Prediction of hot metal temperature based on data mining
-
Zhao Jun
 und
Liu Erhao
und
Liu Erhao

Abstract
Accurately and continuously monitoring the hot metal temperature status of the blast furnace (BF) is a challenging job. To solve this problem, we propose a hot metal temperature prediction model based on the AdaBoost integrated algorithm using the real production data of the BF. We cleaned the raw data using the data analysis technology combined with metallurgical process theory, which mainly included data integration, outliers elimination, and missing value supplement. The redundant features were removed based on Pearson’s thermodynamic diagram analysis, and the input parameters of the model were preliminarily determined by using recursive feature elimination method. We built the hot metal temperature prediction model using the AdaBoost ensemble algorithm on a dataset with selected features as well as derived features by using K-mean clustering tags. The results show that the performance of the hot metal temperature prediction model with K-means clustering tags has been further improved, and the accurate monitoring and forecast of molten iron temperature has been achieved. The model can achieve an accuracy of more than 90% with an error of ±5°C.
1 Introduction
The long life of the blast furnace (BF) is the precondition of its high efficiency. One of the main factors which affect the lifespan of the large BF is the lifespan of the hearth. There are many factors that affect the lifespan and high efficiency of the hearth. They all reflect, to some extent, if the hearth has a good working condition, which is the important sign of the stableness and smoothness of the operation of the furnace [1].
The temperature of hot metal can reflect the physical heat energy well [2] and it is also a symbol of the heat in the hearth. The high temperature of hot metal during discharging indicates that the heat inside the hearth is abundant and the hearth is active; otherwise, it indicates that the hearth is not hot enough and the activity is decreased. Therefore, the hot metal temperature can directly reflect the temperature status inside the hearth, which is a very important index to measure the thermal state of the hearth.
In order to achieve accurate prediction and optimal control of BF smelting, many experts and scholars have done a lot of research. Li et al. [3] proposed a kind of limit learning machine model based on the grey correlation degree. Through the grey correlation degree to analyze the correlation between the parameters of BF, the influence of strong coupling of data brought by the complexity of BF smelting was effectively reduced, but it was difficult to determine the optimal value of index, so it depended too much on the subjectivity of users. Sun et al. [4] proposed the support vector machine (SVM) based on PCA and least square (LS) method, through PCA to reduce the dimension of input parameters, combined with the LS–SVM to build a time series prediction model, which can effectively solve the strong coupling of BF data and the slow operation speed of SVM due to the complexity of training in the case of multivariables; when the training set was updated, the main factor would fluctuate to affect the prediction effect. Chong [5] introduced quantum theory into the neural network model based on genetic theory in order to solve the problems such as easy fitting ahead of time and limitation of optimization process of genetic algorithm neural network model, which successfully combined the diversity of quantum theory and the accuracy of neural network, weakened the dependence on initial conditions, and ensured the training effect of algorithm on data, but there were problems such as large data demand and poor network extension.
By collecting a large number of original data, big data technology can find potential relationship among data by using complex analysis model [6]. This advanced technology can provide a more reliable basis for decision-making, effectively avoid risk accidents, and obtain considerable returns. At present, big data technology has been successfully applied in many aspects of the industrial field, such as predicting the strength of rock materials [7], predicting the air overpressure caused by blasting [8], soil classification [9], etc., which promote the industry into a new era of innovation and change.
The hot metal temperature is closely related to the working state of the hearth. A moderate molten iron temperature is beneficial to the smooth flow of slag and iron inside the hearth of the BF; while if the temperature of the molten iron is too high or too low it will cause the BF to develop in a bad direction, increasing the risk of BF production accidents. In order to avoid the occurrence of furnace heating and furnace cooling conditions caused by manual judgment errors, a research on real-time monitoring of the hearth status was carried out. This article adopts the massive BF production data collected by the steel mill to carry out standardized data preprocessing on the original data and divides the data set into a training set and a test set. Because the K-means clustering algorithm has fast convergence speed, few tuning parameters, and good interpretability, this method is used to cluster historical hot metal temperature, and the clustering results are analyzed and verified through metallurgical process experience. In this article, we used the AdaBoost integrated algorithm to predict the temperature of the hot metal in the production process due to its high accuracy and good generalization ability. The accuracy of the prediction results was verified using actual production data. This model can provide effective guides for the on-site operators to stabilize the working state of the hearth and to control the hearth in real time.
2 Theoretical analysis of iron making process
The whole process of BF smelting can be summarized as follows: the burden enters the BF from the top of the furnace. During the heat exchange between the furnace and the gas flow, the reduction reaction takes place. The iron oxide in the ore is gradually reduced to iron under the action of gas CO, H2, etc. The hot air and fuel are injected from the tuyere on the upper part of the hearth, react with the solid coke to produce the high-temperature gas flow moving from the bottom to the top, and finally are discharged from the top of the furnace for recovery. The ore is heated and softened by the gradual rising temperature in the process of moving down the burden, and finally the hot metal drops into the hearth for storage, and the ash and other impurities form the slag floating on the hot metal to realize the separation. Finally, the hot metal and slag are discharged regularly to ensure that there is enough space in the hearth to maintain the continuity of the smelting process [10,11,12].
There are many factors affecting the temperature of hot metal; the nature of raw materials, operation system, smelting equipment, and production cycle all affect the variation trend of hot metal temperature more or less. Only when the furnace temperature changes greatly, the BF operator will change the raw material ratio. Since the detection of raw material properties had the defects of time asynchrony and serious lack of data, the influence of raw material and fuel properties on the prediction of hot metal temperature is not considered here [13,14,15].
There are two parts to control the temperature of hot metal by the operation system: in the upper part, the position distribution of ore and coke in the furnace is controlled by adjusting the distribution mode, so as to adjust the air permeability in the furnace and ensure the stable downward movement of the furnace charge. In the lower part, the combustion reaction is controlled by adjusting the air supply system and the injection system, so that the hearth area can maintain good thermal state [16]. In daily production, the operator mainly controls the hot metal temperature by adjusting the operation system. Therefore, this article selected the smelting data of nearly 7,000 heat and 71 parameters covering the various operation systems (including top state, air supply state, injection state, etc.) of the smelting process.
3 Data processing
3.1 Data collation
The principle of data collation is to organize data into neat, clear, and easy-to-use data forms.
3.1.1 Data classification
BF smelting is a production process which includes multiple operating systems in cooperation. Because the data of the steel plant were all stored in one database, they were messy and unclear. We organized the data according to their subject; put the parameters belonging to the same process together.
3.1.2 Data alignment
First, the collected data were integrated by heat. Since the selected input parameters were collected according to the frequency of the minute (there was no corresponding data set with the frequency of the furnace), all the data were needed to be integrated by the heat. Taking the collection time of hot metal temperature as the node, from the beginning of the previous furnace to the end of the next furnace, all data in the period of parameter selection were added and averaged to reflect an average level state of the parameter in this period. Then, a new data set was formed by aligning the processed parameters with the hot metal temperature according to the heat. The number of batches was needed to be handled separately. As the recording method of material batch number was cumulative material batch number, it was necessary to subtract the cumulative measurement of material batch between two tapping to obtain the corresponding material batch number of this tapping.
Second, the repetitive measurement points of parameters were integrated. Because there may be more than one detection point for a certain position in the BF (Table 1), it was considered to integrate these monitoring points to obtain a new variable to represent these multiple points.
Variable consolidation list
| New variable | Original variable | Treatment |
|---|---|---|
| Upper differential pressure | 1# Upper differential pressure, 2# Upper differential pressure | Arithmetic mean |
| 3# Upper differential pressure, 4# Upper differential pressure | ||
| Lower differential pressure | 1# Lower differential pressure, 2# Lower differential pressure | Arithmetic mean |
| 3# Lower differential pressure, 4# Lower differential pressure | ||
| Top pressure | 1# Top pressure, 2# Top pressure | Arithmetic mean |
| Top temperature | 1# Top temperature, 2# Top temperature | Arithmetic mean |
| 3# Top temperature, 4# Top temperature | ||
| Standard wind speed | Standard speed, standard wind speed | Arithmetic mean |
| Actual wind speed | Actual speed, actual wind speed | Arithmetic mean |
| Hot blast temperature | Hot blast temperature (TEHOT), hot blast temperature | Arithmetic mean |
| Hot blast main pipe temperature A | ||
| Hot blast pressure | Hot blast pressure 02, hot blast pressure, main pipe hot blast pressure | Arithmetic mean |
| Cold blast pressure | Cold blast pressure CW, cold blast pressure | Arithmetic mean |
| Ventilating index | BF body ventilating index, ventilating index | Arithmetic mean |
| Blast kinetic energy | Blast kinetic energy KG, blast kinetic energy | Arithmetic mean |
After treatment, the number of parameters was reduced from 71 to 52.
3.2 Data cleaning
Data cleaning is an essential step in data preprocessing. It mainly uses mathematical methods to remove redundant data, modify abnormal data, and fill in vacancy data.
Correspondence between actual physical meaning and parameter name
| Actual physical meaning | Parameter name | Actual physical meaning | Parameter name |
|---|---|---|---|
| Valve seat temperature | VST | Top pressure | TP |
| Hot blast pressure | HBP | Oxygen flow | OF |
| Oxygen pressure and hot blast pressure difference | OPHBPD | Oxygen pipe temperature | OPT |
| Top temperature | TT | Blast kinetic energy | BKE |
| Hot blast temperature | HBT | Cold blast pressure | CWP |
| Oxygen-enriched flow rate | OEFR | Oxygen pipeline pressure | OPP |
| Standard wind speed | SWS | Lower differential pressure | LDP |
| Ventilating index | VI | Flow of cold wind | FCW |
| Pressure of air cooling main in front of furnace | PACMF | Gas utilization rate | GUR |
| Online analysis of gas | OAG | CO2 online analysis | COA |
| Number of tuyeres | NT | Nitrogen press | NP |
| Nitrogen flow | NF | Actual wind speed | AWS |
| Tuyere area | TA | Oxygen-enriched content | OEC |
| Flow of nitrogen in main pipe | FNMP | Production of blast furnace gas | PBFG |
| Oxygen-enriched pressure | OEP | Gas main pipe pressure | GMPP |
| Upper differential pressure | UDP | Total soft water flow of blast furnace | TSWFBF |
| Theoretical combustion temperature | TCT | Supplementing water pressure for emergency | SWPE |
| Pressure of main water supply pipe of bottom cooling water | PMWSPBCW | Pressure of high-pressure water main pipe | PHPWMP |
| Soft water supply loop pressure | SWSLP | Flow of high pressure water in main pipeline (No. 1564) | FHPWMP1564 |
| Atmospheric water pressure | AWP | Heat load | HL |
| High-pressure water pressure | PHWP | Inlet water temperature | IWT |
| Top cooling water temperature | TCWT | Top cooling water return temperature | TCWRT |
| Top cooling water pressure | TCWP | Number of iron notch | NIN |
| Depth of taphole | DT | Blast furnace load | BFL |
| Cooling water flow of furnace top | CWFFT | Batch number | BN |
| Flow of high pressure water in main pipeline (No. 1563) | FHPWMP1563 | — | — |
3.2.1 Deduplication
One part of the duplicate data was generated by the repeated entry of data caused by mechanical failure or manual entry, and the other part was caused by the repeated selection and connection of data caused by software when the data were connected in the database. Duplicate data are generally deleted directly.
3.2.2 Handling of abnormal data
Abnormal data refer to data points that are obviously different from the overall data distribution, also known as outliers. This kind of data was usually caused by equipment failure. Since the data set used in the experiment was a large sample data set, it was possible to mark the large error data beyond the range of 3σ by using the Pauta criterion [17,18]. The corresponding relationship between actual physical meaning and parameter name is shown in Table 2. It can be seen from Figure 1 that most of the parameters have abnormal data and the amount of abnormal data is unequal, so correction was needed. The specific correction method was needed to be combined with the processing method of the vacancy value.
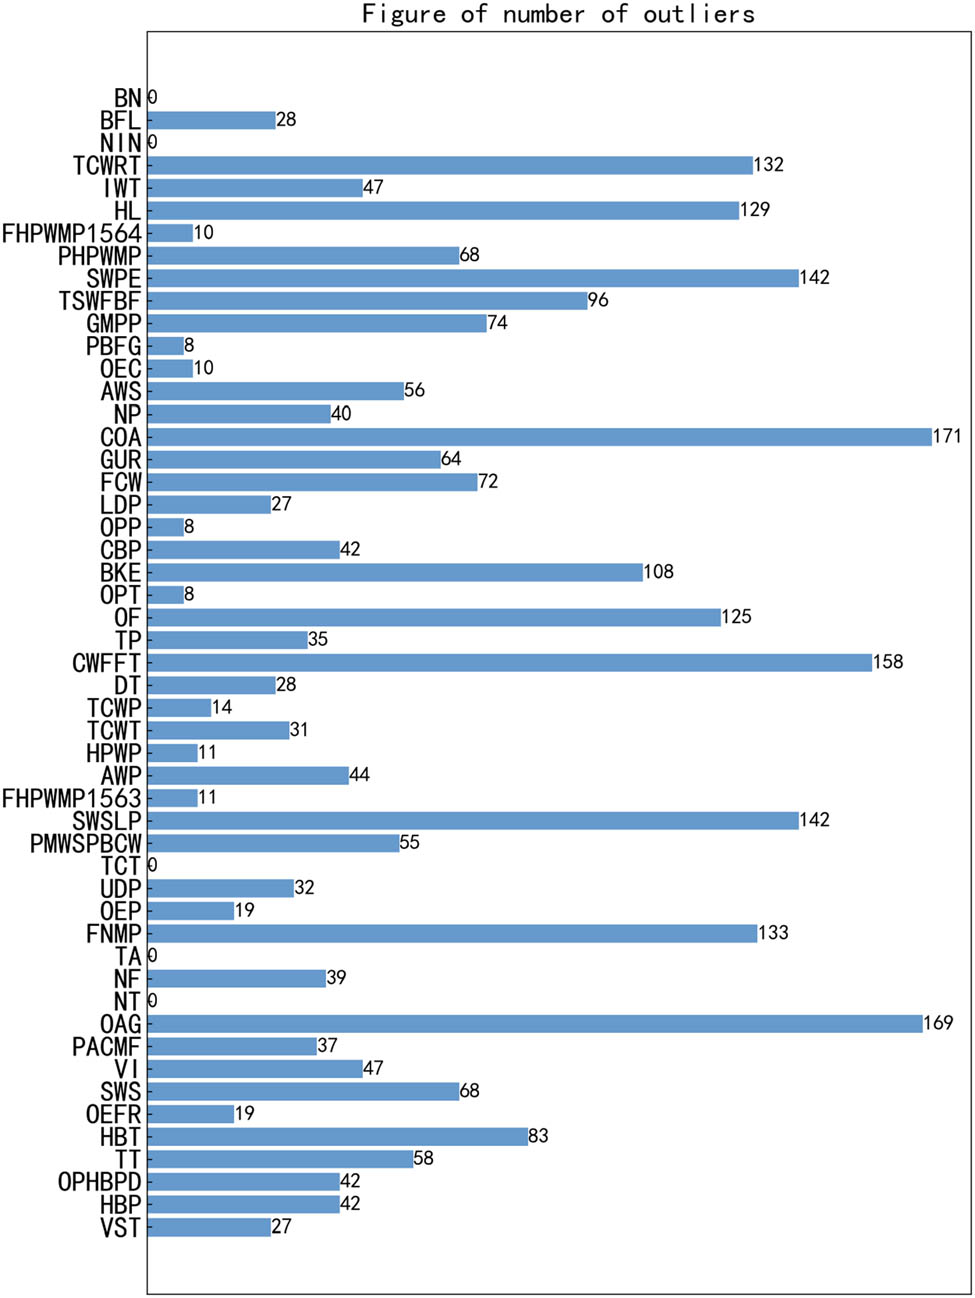
Number of outliers for each parameter.
3.2.3 Processing of missing value
There are two reasons for the missing value: one is mechanical reason, which is caused by mechanical failure in data collection; the other is human reason, which is caused by human subjective error or intentional act. BF smelting is a continuous production process. In order to ensure the continuity of time, abnormal data and vacancy data are usually filled instead of completely deleted.
The Lagrange linear interpolation method is a common method in the regression algorithm. It connects two or more non-null data and fits the vacant value according to the proposed function. Generally, the most commonly used methods are linear interpolation and square interpolation [19]. In this article, a linear interpolation method is selected, using two adjacent points on the left and right sides of the missing value to fill in the missing value by constructing a straight line.
4 Parameter selection
BF smelting process parameters consist of state parameters and material flow parameters. The state parameters mainly refer to the equipment state parameters and smelting state parameters of the whole BF. The material flow parameters mainly include the quantity and attribute parameters of all the input and output materials of the BF. In the process of modeling, reasonable selection of input parameters can maximize the efficiency of the model, reduce the operation time, and improve the accuracy of the model prediction.
4.1 Data correlation analysis
Pearson correlation coefficient (R) is a linear correlation coefficient, which is also most commonly used to describe the degree of correlation between parameters [20]. The range of correlation coefficient is from −1 to 1; greater than 0 means positive correlation, less than 0 means negative correlation, and the larger the absolute value is, the stronger the correlation is.
Figure 2 is the thermodynamic diagram of Pearson correlation coefficient between parameters. The darker the color is, the higher the positive correlation is, and the lighter the color is, the higher the negative correlation is. The absolute value of Pearson correlation coefficient in different intervals has different meanings:

Heatmap of Pearson correlation coefficient.
When Pearson correlation coefficient is in the region of high correlation, that is, when
4.2 Feature selection
Model-based importance ranking.

Selection of the best number of features.
Summary table of model input parameters and output parameters
| Parameter category | Top state | Injection state | Body state | Equipment status |
|---|---|---|---|---|
| Parameter name | VST | HBP | VI | PACMF |
| TT | OPHHBPD | UDP | NF | |
| OAG | HBT | BKE | FNMP | |
| TCWT | OPT | UDP | FHPWMP1563 | |
| TCWP | OEFR | BFL | NP | |
| COA | HL | GMPP | ||
| PBFG | GUR | TSWFBF | ||
| TCWRT | FHPWMP1564 | |||
| TP | PMWSPBCW | |||
| PHPW | ||||
| IWT | ||||
| PHWP |
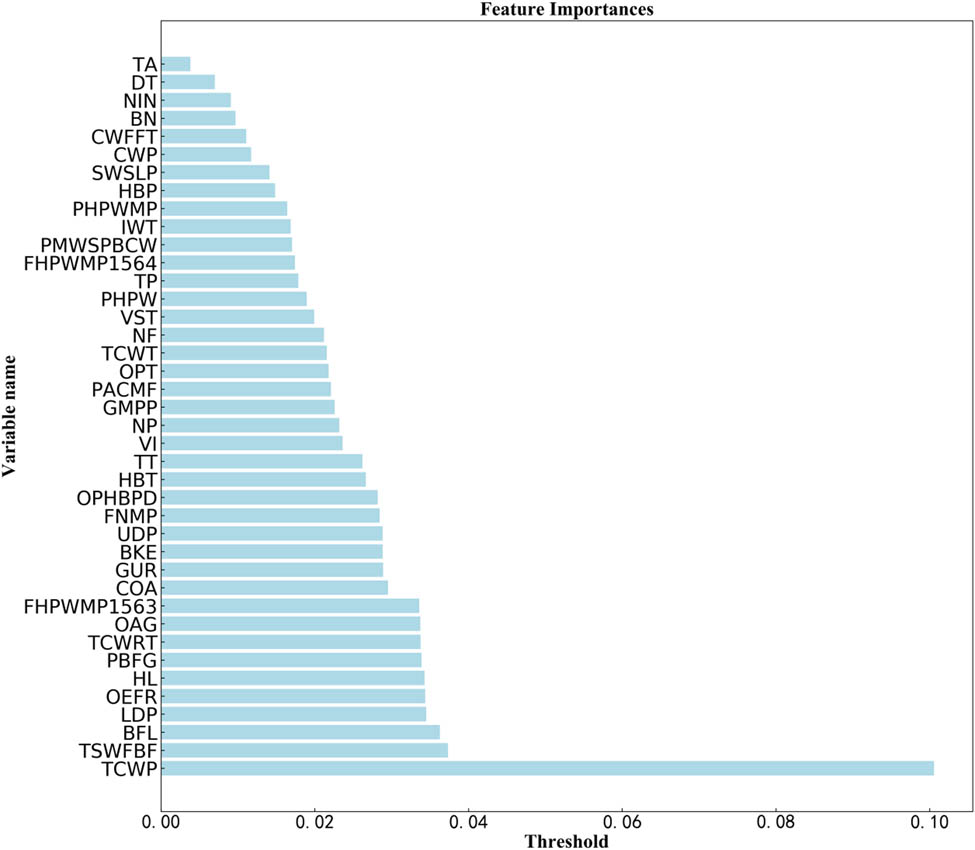
4.2.1 Importance analysis
Importance analysis is to calculate the contribution degree of each parameter to the target parameter according to the algorithm and sort the parameters according to the score. It is a method of directly selecting parameters through the internal algorithm of the model [21]. In this way, we obtain the sensitivity relationship between each variable and the target value, and the target value is more affected by the top-ranked variables (i.e., the target value is more sensitive to the top-ranked variables).
Figure 3 is a feature importance ranking diagram obtained by using a decision tree-based gradient boosting algorithm. It can be seen from the figure that each feature is ranked from small to large according to the importance score: tuyere area, depth of taphole, number of iron notch, batch number, cooling water flow of furnace top, cold blast pressure, soft water supply loop pressure, hot blast pressure, pressure of high-pressure water main pipe, inlet water temperature, pressure of main water supply pipe of bottom cooling water, flow of high pressure water in main pipeline (No. 1564), top pressure, high-pressure water pressure, valve seat temperature, nitrogen flow, top cooling water temperature, oxygen pipe temperature, pressure of air cooling main in front of furnace, gas main pipe pressure, nitrogen press, ventilating index, top temperature, hot blast temperature, oxygen pressure and hot blast pressure difference, flow of nitrogen in main pipe, upper differential pressure, blast kinetic energy, gas utilization rate, CO2 online analysis, flow of high pressure water in main pipeline (No. 1563), online analysis of gas, top cooling water return temperature, production of BF gas, heat load, oxygen-enriched flow rate, lower differential pressure, BF load, total soft water flow of BF, and top cooling water pressure.
4.2.2 Determination of the number of optimum features
Based on the recursive feature elimination and cross-validation methods, the forward selection method is used to select the parameters in combination with the importance of feature parameters and the model prediction accuracy. RFE, also known as feature recursion elimination, is to select the feature with the best score through repeated modeling, and then repeat the process for the remaining features until all samples have been tested at least once, and then sort the features according to the score value to select the optimal feature subset [22]. The number of optimum features can be found by the cross-validation method of recursive feature elimination. Cross-validation is a method of cyclic iteration based on the cut sample set. The obtained sample data are repeatedly divided into different training sets and test sets. The training set is used to train the model and the test set is used to evaluate the quality of model prediction [23]. On this basis, multiple sets of different training sets and test sets can be obtained. A sample in a training set may become a sample in a test set next time, which becomes a cross. Collect the sum of the square error of each sample after inspection.
It can be seen from Figure 4 that with the continuous addition of parameters, the score of the model gradually rises and tends to be stable. It was found that when the number of feature subsets was 33, the score of cross-validation was the highest, so the number of feature subsets is 33. The classification and summary results of the model input parameters are shown in Table 3.
5 Model construction
The most intuitive effect of a good model is to improve the accuracy of prediction and reduce the prediction time. The AdaBoost integrated tree algorithm in the integrated model was used to construct the prediction model. The AdaBoost model has good self-adaptability. Through continuous training and autonomous weighting, the error is minimized to achieve a good prediction effect. However, the AdaBoost integrated tree model is sensitive to outlier samples. In order to make up for this big defect, K-means clustering method is introduced based on the idea of classification. K-means clustering was used to classify the hot metal temperature into highly similar classes, eliminating the differences caused by outliers and further improving the prediction accuracy and hit rate.
In the process of model construction, random sampling is first used to divide the sample into a training set and a test set at a ratio of 9 to 1. Then, two sets of different input parameters (33 input parameters obtained by parameter screening and 34 input parameters derived with K-means clustering result tags) are used to construct a hot metal temperature prediction model based on the AdaBoost ensemble tree algorithm, and the hyperparameters of the model are optimized by a combination of grid search and cross-validation. Finally, the performance of the two sets of models was verified and compared.
5.1 AdaBoost algorithm
5.1.1 Algorithm introduction
AdaBoost, an abbreviation of “adaptive boosting,” was proposed in 1995 [24,25]. Its adaption lies in: when the sample data are misclassified, the given weight will be improved; the weighted sample will be used to train the classifier again. At the same time, a new weak classifier will be added until it reaches the predetermined small error rate or the predetermined maximum number of iterations.
5.1.2 Algorithm principle
The whole AdaBoost iterative algorithm is roughly divided into three steps:
Initialize the weight distribution of training data. Each training sample is given the same weight at the beginning.
The weight distribution of the weak classifier is optimized iteratively.
Each training weak classifier is combined into a strong classifier according to the weight
The core formula of the algorithm is as follows:
where
5.2 Hot metal temperature clustering based on K-means algorithm

Result of K-means clustering.
5.2.1 K-means algorithm
AdaBoost integrated tree algorithm cannot capture discrete values effectively.
Considering that the temperature of hot metal fluctuates greatly in the whole cycle, in order to improve the prediction accuracy and capture the change trend of hot metal temperature more effectively, the temperature of hot metal was first processed by K-means clustering and then mining and learning were carried out according to the characteristics of different categories of data.
K-means clustering is one of the most typical and commonly used clustering algorithms, which has the advantages of good effect, fast, and simple. The main idea of this algorithm is to get the final clustering result by giving the number of clustering centers in advance and iterating until the error value of the objective function converges. The specific process steps [26,27] are as follows:
Select K objects randomly, each of which represents the initial value of a cluster center;
Calculate the distance between the remaining objects and the cluster center and classify them according to the distance;
Recalculate the average value of each cluster population and update the cluster center;
Repeat steps 2 and 3 until the cluster center no longer changes.
5.2.2 Hot metal temperature clustering
The hot metal temperature data of 6,702 heats from 2017 to 2018 were collected and clustered by K-means clustering method.
The number of clusters is 3, and the initial cluster centers are 1,450, 1,475, and 1,490°C. The clustering results are shown in Figure 5. It can be seen from Figure 5 that the number of sample subsets with hot metal temperature of 1,450, 1,475, and 1,490°C as cluster centers is 4,740, 1,761, and 205, respectively. In contrast, the number of samples with the hot metal temperature of 1,490°C as the cluster center is relatively small. The result based on K-means clustering is almost the same as that of prior analysis. When the temperature of hot metal is between 1,468–1,482°C, it can be regarded as stable and normal state; when it is higher than 1,482°C, it is considered as high; when it is lower than 1,468°C, it is considered as low. The final cluster centers are 1,460, 1,472, and 1,480°C.
5.3 AdaBoost prediction model based on K-means clustering results
The 33 variables determined in the parameter screening process and the 34 input variables added with the clustering results were used as the input parameters of the AdaBoost prediction model, and the hot metal temperature prediction model was established using the AdaBoost integrated algorithm model. The method of combining grid search and cross-validation is used to optimize the model hyperparameters, and the performance of the forecast model is adjusted to the best. Table 4 shows the optimal hyper parameter set obtained.
Model hyperparameter optimization results
| Model categories | Base estimator | Number of estimators | Learning rate | Fixed seed for random generator | Fixed seed for random generator | Regression loss function |
|---|---|---|---|---|---|---|
| Benchmark model | Tree | 90 | 0.06 | 1 | SAMME.R | Exponential() |
| Benchmark model for adding cluster labels | Tree | 80 | 0.7 | 1 | SAMME.R | Exponential() |
Figure 6 shows the comparison curve between the predicted results and the actual values based on AdaBoost model; Figure 7 shows the construction of prediction model using AdaBoost algorithm on the basis that the temperature range of hot metal has been determined.

Result of AdaBoost model.

AdaBoost prediction result graph based on K-means clustering.
It can be seen from Figures 6 and 7 that the prediction results of AdaBoost integrated tree model based on K-means clustering algorithm are more accurate than the actual data values only using AdaBoost mode, which can not only predict the trend of hot metal temperature, but also capture the data points with large fluctuations.
Figure 8 shows the changes in the prediction error of the AdaBoost model after adding the K-means clustering results. It can be seen that after adding the clustering label, the performance of the model is improved significantly, and it is basically stable at about ±5°C. Such model performance can play a good guiding role for on-site hot metal temperature monitoring and advance prediction.

Errors in the prediction results of the two models. (a) AdaBoost model; (b) AdaBoost ensemble tree model based on K-means clustering algorithm.
5.4 Model evaluation
By using only AdaBoost integration tree and AdaBoost integration tree based on K-means clustering algorithm, two models for predicting hot metal temperature were constructed, respectively. This article summarized the prediction hit rate (Table 5) and model evaluation index results (Table 6) of the two models to comprehensively evaluate the effects of the two models.
Prediction accuracy between the three models/%
| Accuracy | AdaBoost integration tree | AdaBoost integration tree based on K-means clustering |
|---|---|---|
| ±3°C | 43.07 | 71.98 |
| ±5°C | 63.64 | 92.40 |
| ±10°C | 87.93 | 99.55 |
Comparison of prediction accuracy between the three models
| Evaluation index | AdaBoost integration tree | AdaBoost integration tree based on K-means clustering |
|---|---|---|
| R 2 | 0.15 | 0.78 |
| MSE | 52.28 | 13.28 |
| MAE | 5.24 | 2.59 |
| i10-index | 0.6775 | 0.8663 |
It can be seen from Tables 5 and 6 that the prediction results of the AdaBoost integrated tree model based on K-means clustering have a hit rate of more than 90% under the accuracy of ±5°C and more than 70% under the accuracy of ±3°C; by comparison, the hit rate of the AdaBoost integrated tree model is relatively low under the same accuracy. It showed that the introduction of K-means clustering method successfully eliminated the defect that the accuracy of AdaBoost prediction model decreases due to outliers.
In addition, we also compared the i10-index of the AdaBoost integrated tree model based on K-means clustering and the AdaBoost integrated tree model. The i10-index values of the two models are 0.8663 and 0.6775, respectively. The results of the AdaBoost integrated tree model based on K-means clustering seem to have not yet reached the ideal range (0.90–1.00) [28]. However, for the iron and steel industry, where the environment is changeable and complex, people pay more attention to the hit rate of the model within a specific error range. Since our model can achieve a hit rate of 92.40% at ±5°C, it can play a good guiding role in actual steel production.
5.5 Future work
With the deep integration of industrial big data, new ironmaking technology, and information automation, the establishment of a high-precision BF ironmaking prediction model and the realization of the white box inside the BF are necessary for the future development of the BF ironmaking industry.
Promoting the digital transformation of the ironmaking process and the intelligent upgrading of BF production require a full combination of technologies such as big data platforms, artificial intelligence algorithms, and metallurgical process theory. The construction of a big data platform for the steel industry is the foundation. By integrating all the data information of the iron and steel industry, we can fully supervise the coordinated operation of various processes and conduct more accurate operation status analysis and decision optimization. With the help of advanced artificial intelligence algorithm technology, we can attain the precious values in the massive historical data of iron and steel enterprises, so as to better guide the current production operation and parameter monitoring. In addition, metallurgical process theory and field operation experience are extremely valuable. This part of knowledge is solidified in the big data platform and forecast model of the ironmaking industry to realize the true landing of the digitalization of the iron and steel industry, so as to obtain long-term guiding significance for on-site production.
Due to the limitation of the current monitoring method, the hearth temperature cannot be detected directly. The changing trend of the hearth temperature can only be captured by constructing a high-precision prediction model of hot metal temperature. The future work should focus on the long period optimization of hot metal temperature prediction, in order to achieve stable production, extend the life of the BF, and improve the utilization efficiency of the BF.
6 Conclusion
After using big data technology for cleaning, correspondence, and analysis, 33 BF operation parameters, including, valve seat temperature, hot blast pressure, oxygen pressure and hot blast pressure difference, upper differential pressure, hot blast temperature, ventilating index, pressure of air cooling main in front of furnace, online analysis of gas, nitrogen flow, tuyere area, flow of nitrogen in main pipe, upper differential pressure, pressure of main water supply pipe of bottom cooling water, soft water supply loop pressure, flow of high-pressure water in main pipeline (No. 1563), top cooling water supply temperature, top cooling water pressure, oxygen pipe temperature, blast kinetic energy, lower differential pressure, gas utilization rate, CO2 online analysis, permeability index, nitrogen press, production of BF gas, gas main pipe pressure, total soft water flow of BF, flow of high-pressure water in main pipeline (No. 1564), heat load, top cooling water return temperature, iron notch, BF load, oxygen-enriched flow rate, were selected as the input characteristics of the model.
By comparing the prediction results of AdaBoost model and K-means classification-based AdaBoost model, it was found that the latter has the advantages of higher accuracy and more accurate hit. When the accuracy was increased to ±5°C, the former had only 63.64% accuracy, while the latter had 92.40% accuracy. When the accuracy was increased to ±3°C, the former had only 43.07% accuracy, the latter still has a hit rate of 71.98%
-
Funding information: Thanks are given to the financial supports from the key Program of National Nature Science Foundation of China (U1360205) and Science and Technology Project of Hebei Education Department (BJ2021099).
-
Author contributions: Zhao Jun: Conceptualization, Methodology, Writing original draft. Li Xin: Conceptualization, Methodology, Writing original draft. Liu Song: Modelling, Validation, Formal analysis, Manuscript revision. Kun Wang: Investigation, Data management, Modelling, Visualization. Lyu Qing: Resources, Review & Editing, Supervision. Liu Erhao: Resources, Review & Editing, Supervision.
-
Conflict of interest: Authors state no conflict of interest.
-
Data availability statement: The raw/processed data required to reproduce these findings cannot be shared at this time as the data also forms part of an ongoing study.
References
[1] Dawson, P. R., Recent developments in iron ore sintering. Part 2. Research studies on sintering and sinter quality. Ironmaking & Steelmaking, Vol. 20, No. 2, 1993, pp. 137–143.Suche in Google Scholar
[2] Fan, X. H., Mathematical models and expert systems of iron ore agglomeration, Science Press, Beijing, 2013, 8 (in Chinese).Suche in Google Scholar
[3] Li, A. L., Y. M. Zhao, and G. M. Cui. Prediction model of blast furnace temperature based on ELM with grey correlation analysis. Journal of Iron and Steel Research, Vol. 27, 2015, id. 33 (in Chinese).Suche in Google Scholar
[4] Cui, G. M., T. Sun, and Y. Zhang. Forecast of blast furnace hot metal temperaturebased on least support vector machine. Computer Simulation, Vol. 30, 2013, id. 354 (in Chinese).Suche in Google Scholar
[5] Yan, C., Hot metal temperature forecast research based onquantum genetic neural networkp, Northeastern University, Shenyang City, China, 2014 (in Chinese).Suche in Google Scholar
[6] Hu, J. Q. and E. Rose. Predictive fuzzy control applied to the sinter strand process. Control Engineering Practice, Vol. 5, No. 2, 1997, pp. 247–252.10.1016/S0967-0661(97)00232-3Suche in Google Scholar
[7] Li, D., D. J. Armaghani, J. Zhou, S. H. Lai, and M. Hasanipanah. A GMDH predictive model to predict rock material strength using three non-destructive tests. Journal of Nondestructive Evaluation, Vol. 39, 2020, id. 81.10.1007/s10921-020-00725-xSuche in Google Scholar
[8] Hh, A. and B. Dja. Prediction of air-overpressure induced by blasting using an ANFIS-PNN model optimized by GA – ScienceDirect. Applied SoftComputing, Vol. 99, 2020, id. 106904.10.1016/j.asoc.2020.106904Suche in Google Scholar
[9] Pham, B. T., C. Qi, L. S. Ho, T. Nguyenthoi, N. Alansari, and M. D. Nguyen. A novel hybrid soft computing model using random forest and particle swarm optimization for estimation of undrained shear strength of soil. Sustainability, Vol. 27, 2020, id. 100508.10.3390/su12062218Suche in Google Scholar
[10] Feng, Q. M., T. Li, X. H. Fan, and T. Jiang. Adaptive prediction system of sintering through point based on self-organize artificial neural network. Transactions of Nonferrous Metals Society of China, Vol. 10, No. 6, 2000, pp. 804–807.Suche in Google Scholar
[11] Nath, N. K. and K. Mitra. Optimisation of suction pressure for iron ore sintering by genetic algorithm. Ironmaking & Steelmaking, Vol. 31, No. 3, 2004, pp. 199–206.10.1179/030192304225018118Suche in Google Scholar
[12] Li, M. H. and Y. F. Sun. Study of the fuzzy control system for burning through point of sintering. Journal of Huazhong University ofScience and Technology, Vol. 32, 2004, id. 71 (in Chinese).Suche in Google Scholar
[13] Tetc, F. Sinter operation control system with artificial intelligence. Kawasaki Steel GIHO, Vol. 23, No. 3, 1991, pp. 203–209 (in Japanese).Suche in Google Scholar
[14] Vescovi, M. R., M. M. Lamega, and A. Farquhar. Modeling and simulation of a complex industrial process. IEEE Expert, Vol. 12, No. 3, 2002, pp. 42–46.10.1109/64.590073Suche in Google Scholar
[15] Wu, X. F. and R. FeiM. Fuzzy control applied to burning through point based on support vector machines prediction model. Journal of Zhejiang University, Vol. 41, 2007, id. 1722 (in Chinese).Suche in Google Scholar
[16] Zhou, H., J. P. Zhao, and C. E. Loo. Model predictions of important bed and gas properties during iron ore sintering. ISIJ International, Vol. 52, No. 12, 2012, pp. 2168–2176.10.2355/isijinternational.52.2168Suche in Google Scholar
[17] Liu, H. and C. Chen. Data processing strategies in wind energy forecasting models and applications: a comprehensive review. Applied Energy, Vol. 249, No. 1, 2019, pp. 392–408.10.1016/j.apenergy.2019.04.188Suche in Google Scholar
[18] Ye, Y., M. Wang, and S. Yao. Big data processing framework for manufacturing. Procedia CIRP, Vol. 83, 2019, pp. 661–664.10.1016/j.procir.2019.04.109Suche in Google Scholar
[19] Boorboor, S., H. Jafari, and S. Feghhi. Development of a novel approach for precise pulse height extraction using Lagrange interpolation. Nuclear Instruments & Methods in Physics Research, Vol. 919, 2019, pp. 82–88.10.1016/j.nima.2018.12.028Suche in Google Scholar
[20] Mu, Y. S., X. D. Liu, and L. D. Wang. A Pearson’s correlation coefficient based decision tree and its parallel implementation. Information Sciences, Vol. 435, 2018, pp. 40–58.10.1016/j.ins.2017.12.059Suche in Google Scholar
[21] Liu, S., Q. Lyu, X. J. Liu, Y. Q. Sun, and X. S. Zhang. A prediction system of burn through point based on gradient boosting decision tree and decision rules. ISIJ International, Vol. 59, No. 12, 2019, pp. 2156–2164.10.2355/isijinternational.ISIJINT-2019-059Suche in Google Scholar
[22] Guyon, I., J. Weston, S. Barnhill, and V. Vapnik. Gene selection for cancer classification using support vector machines. Machine Learning, Vol. 46, No. (1–3), 2002, pp. 389–422.10.1023/A:1012487302797Suche in Google Scholar
[23] Liu, S., Q. Lyu, X. J. Liu, and Y. Q. Sun. Synthetically predicting the quality index of sinter using machine learning model. Ironmaking & Steelmaking, Vol. 47, No. 7, 2020, pp. 828–836.10.1080/03019233.2019.1617573Suche in Google Scholar
[24] Asim, K. M., A. Idris, T. Iqbal, and F. Martínez-Álvarez. Seismic indicators based earthquake predictor system using genetic programming and AdaBoost classification. Soil Dynamics and Earthquake Engineering, Vol. 111, 2018, pp. 1–7.10.1016/j.soildyn.2018.04.020Suche in Google Scholar
[25] He, Y. L., Y. Zhao, X. Hu, X. N. Yan, Q. X. Zhu, and Y. Xu. Fault diagnosis using novel AdaBoost based discriminant locality preserving projection with resamples. Engineering Applications of Artificial Intelligence, Vol. 91, 2020, id. 103631.10.1016/j.engappai.2020.103631Suche in Google Scholar
[26] Zahra, S., M. A. Ghazanfar, A. Khalid, M. A. Azam, U. Naeem, and A. Prugel-Bennett. Novel centroid selection approaches for KMeans-clustering based recommender systems. Information Sciences, Vol. 320, 2015, pp. 156–189.10.1016/j.ins.2015.03.062Suche in Google Scholar
[27] Huang, X. H., Y. M. Ye, H. F. Guo, Y. Cai, H. J. Zhang, and Y. Li. DSKmeans: a new kmeans-type approach to discriminative subspace clustering. Knowledge-Based Systems, Vol. 70, 2014, pp. 293–300.10.1016/j.knosys.2014.07.009Suche in Google Scholar
[28] Armaghani, D. J. and P. G. Asteris. A comparative study of ANN and ANFIS models for the prediction of cement-based mortar materials compressive strength. Neural Computing and Applications, 2020, 10.1007/s00521-020-05244-4. (published online).Suche in Google Scholar
© 2021 Zhao Jun et al., published by De Gruyter
This work is licensed under the Creative Commons Attribution 4.0 International License.
Artikel in diesem Heft
- Research Articles
- Fused deposition modeling of poly(ether ether ketone) scaffolds
- Investigation of the microstructure evolution in TP347HFG austenitic steel at 700°C and its characterization method
- Hot deformation behavior and processing maps of 9Cr3W3Co oxide dispersion-strengthened steel
- Evolution of physicochemical properties of quick lime at converter-smelting temperature
- Influence of phase distribution of converter slag microzones on the occurrence of P
- Investigation on ultrasonic assisted friction stir welding of aluminum/steel dissimilar alloys
- Analysis of oxide scale thickness and pores position of HCM12A steel in supercritical water
- Behavior of MnS inclusions during homogenization process in low-alloyed steel FAS3420H
- Preparation and cutting performance of nano-scaled Al2O3-coated micro-textured cutting tool prepared by atomic layer deposition
- Prediction of hot metal temperature based on data mining
- Effect of TiO2 content in slag on Ti content in molten steel
- Performance evaluation of titanium-based metal nitride coatings and die lifetime prediction in a cold extrusion process
- Effect of different drilling techniques on high-cycle fatigue behavior of nickel-based single-crystal superalloy with film cooling hole
- Effect of CO2 injection into blast furnace tuyeres on the pulverized coal combustion
- Microstructure and properties of Co–Al porous intermetallics fabricated by thermal explosion reaction
- Evolution regularity of temperature field of active heat insulation roadway considering thermal insulation spraying and grouting: A case study of Zhujidong Coal Mine, China
- Evolution of reduction process from tungsten oxide to ultrafine tungsten powder via hydrogen
- A thermodynamic assessment of precipitation, growth, and control of MnS inclusion in U75V heavy rail steel
- Effect of basicity on the reduction swelling properties of iron ore briquettes
- Effect of Cr and Al alloying on the oxidation resistance of a Ti5Si3-incorporated MoSiBTiC alloy
- Microstructure and mechanical properties of 2060 Al–Li alloy welded by alternating current cold metal transfer with high-frequency pulse current
- Effects of composition and strain rate on hot ductility of Cr–Mo-alloy steel in the two-phase region
- Effect of K and Na on reduction swelling performance of oxidized roasted briquettes
- Dephosphorization mechanism and phase change in the reduction of converter slag
- Parametric investigation and optimization for CO2 laser cladding of AlFeCoCrNiCu powder on AISI 316
- Optimization of heat transfer and pressure drop of the channel flow with baffle
- Quantitative analysis of microstructure and mechanical properties of Nb–V microalloyed high-strength seismic reinforcement with different Nb additions
- Visualization of the damage evolution for Ti–3Al–2Mo–2Zr alloy during a uniaxial tensile process using a microvoids proliferation damage model
- Research on high-temperature mechanical properties of wellhead and downhole tool steel in offshore multi-round thermal recovery
- Dephosphorization behavior of reduced iron and the properties of high-P-containing slag
- Jet characteristics of CO2–O2 mixed injection using a dual-parameter oxygen lance nozzle for different smelting periods
- Effects of ball milling on powder particle boundaries and properties of ODS copper
- Heat transfer behavior in ultrahigh-speed continuous casting mold
- Solidification microstructure characteristics of Cu–Pb alloy by ECP treatment
- Luminescence properties of Eu2+ and Sm3+ co-doped in KBaPO4
- Research on high-temperature oxidation resistance, hot forming ability, and microstructure of Al–Si–Cu coating for 22MnB5 steel
- The differential analysis for temperature distribution diagnostics of arc current-carrying region in sheet slanting tungsten electrode inert gas welding with the electrostatic probe
- Reactions at the molten flux-weld pool interface in submerged arc welding
- The effect of liquid crystalline graphene oxide compared with non-liquid crystalline graphene oxide on the rheological properties of polyacrylonitrile solution
- Study on manganese volatilization behavior of Fe–Mn–C–Al twinning-induced plasticity steel
- Physical modeling of bubble behaviors in molten steel under high pressure
- Rapid Communication
- The new concept of thermal barrier coatings with Pt + Pd/Zr/Hf-modified aluminide bond coat and ceramic layer formed by PS-PVD method
- Topical Issue on Science and Technology of Solar Energy
- Solution growth of chalcopyrite Cu(In1−xGax)Se2 single crystals for high open-circuit voltage photovoltaic device
- Copper-based kesterite thin films for photoelectrochemical water splitting