The differential analysis for temperature distribution diagnostics of arc current-carrying region in sheet slanting tungsten electrode inert gas welding with the electrostatic probe
-
Yuanbo Li
 ,
Tao Ye
,
Tao Ye

Abstract
An electrostatic probe differential analysis method is used to diagnose the arc current-carrying region of the sheet slanting tungsten electrode. Based on the local thermal equilibrium condition and energy transition model with charged particles collision, the temperature distribution in the current-carrying region of different welding process parameters is solved by saturated ion current. The results show that the temperature distribution range in the width direction of sheet slanting tungsten electrode expands, the arc high-temperature region shifts integrally, and the temperature in the thickness direction of sheet slanting tungsten electrode would be symmetrical. The guide effect of the hypotenuse of sheet slanting tungsten electrode for arc current and the inertia drag effect of arc would mainly change the temperature distribution. The variation of the inclination angle of the hypotenuse of sheet slanting tungsten electrode will aggravate the shift of the arc high-temperature region. The larger inclination angle will enhance the guiding effect, and then the inertia drag effect would be in a dominant position with a smaller inclination angle. With the increase of welding current, both the arc stiffness and the guiding effect would be intensified, the latter should make the arc high-temperature zone shift to the position with a small discharge gap.
1 Introduction
The narrow gap welding method has become a highly efficient welding method with good prospects due to its characteristics such as saving welding materials, reducing residual stress, and improving elasticity and toughness in the heat-affected zone [1,2]. In the narrow gap welding technology, the narrow gap tungsten inert gas (TIG) welding method has the advantages of both TIG welding and narrow gap welding technology, which has high welding quality, stable arc, and excellent mechanical properties of joints. And it is gradually widely used because it can effectively alleviate the problems of large welding deformation and poor corrosion resistance of welded joints [3,4]. For offshore engineering welding and nuclear power equipment welding, which require higher wall thickness, the narrow gap TIG welding method shows its unique advantages [5,6]. However, due to the small gap width, the traditional TIG welding method mostly adopts the small diameter tungsten electrode with weak current carrying capacity, which weakens the arc heating capacity and reduces the depth of fusion. When the gap width is reduced to a few millimeters, the small diameter tungsten electrode is close to the sidewall, so that the arc can easily climb to the sidewall [7]. Li et al. [8] adopted a sheet slanting tungsten electrode with a rectangular cross-section. By keeping the cross-sectional area of the sheet slanting tungsten electrode unchanged, it has a good current carrying capacity, and the generated arc has enough heat to melt the base metal. At the same time, the thickness of the sheet slanting tungsten electrode is reduced, and the distance between the sheet slanting tungsten electrode and the side wall is increased, thus preventing the arc from crawling to the side wall. In the welding process, the temperature distribution in the current-carrying zone of the sheet slanting tungsten electrode arc is the key factor affecting the weld forming, so it is necessary to conduct in-depth research on its distribution characteristics and regulation mechanism.
In recent years, the non-contact spectral measurement method has been widely used because it will not interfere with the properties of arc plasma and its internal temperature and density distribution [9]. Vilarinho et al. [10] studied the quasi neutrality of TIG arc plasma by combining the emission spectrum temperature map. Mu et al. [11] put the nanometer narrow-band filter in front of the high-speed camera and reflected the arc temperature distribution through the spectral intensity of the argon element. Xiao et al. [12] used three different spectral methods to calculate the temperature of the argon–helium–arc plasma, compared the accuracy of the different methods, and made improvements. However, due to the limitation of axisymmetric conditions, the non-contact spectral diagnosis method is difficult to accurately measure the temperature of the sheet slanting tungsten electrode arc [13].
The electrostatic probe is one of the earliest test tools used in plasma diagnosis. According to the local thermal equilibrium conditions of the arc column and the mechanism of charged particle collision, the saturated ion current measured by the electrostatic probe can be used to solve the temperature in the arc current-carrying area, and its distribution characteristics are consistent with the spectral diagnosis results [14,15]. The electrostatic probe has a simple structure and usually uses a high-speed moving wire as a probe to enter the arc for measurement. The smaller the conductive surface area of the probe, the more beneficial it is to realize the local micro-measurement of the temperature in the current-carrying region [16]. However, conventional electrostatic probes rely on metal wires covering ceramic tubes to adjust the conductive surface, so it is difficult to obtain a sufficiently small conductive surface area. In this paper, an electrostatic probe differential analysis method is used to measure the temperature in the current-carrying area of sheet slanting tungsten electrode arc locally, and the variation law and regulation mechanism of temperature distribution in the current-carrying area of sheet slanting tungsten electrode arc under different welding process parameters are studied, which provides a theoretical basis for subsequent experiments and production.
2 Methodology
2.1 Experimental method of electrostatic probe differential analysis
To better describe the principle of the device and the corresponding test process, the nomenclature is given in Table 1. Figure 1 is a schematic diagram of an experimental device, in which an arc is ignited between a sheet slanting tungsten electrode and a water-cooled copper block; a Space rectangular coordinate is established on the surface of the water-cooled copper block. The centroid projected by the sheet slanting tungsten electrode on the surface of the water-cooled copper block is the origin of the coordinate. The width direction of the sheet slanting tungsten electrode is parallel to the x-axis, and the thickness direction of the sheet slanting tungsten electrode is parallel to the y-axis. The water-cooled copper block can move at a constant speed along the negative direction of the x-axis to simulate the moving process of arc along the x-axis. Aluminum wire with a diameter of 0.3 mm is used as an electrostatic probe and driven by a winding roll to move through the arc at a constant speed along the y-axis. According to previous studies [17], to avoid the melting of the insulating oxide film in the arc, the motion speed of aluminum wire with an oxidized surface is up to 3 m·s−1. At the same time, the effect of aluminum wire surface oxidation insulation has been verified in previous work [18].
Nomenclature
| Name | Description | Units |
|---|---|---|
| U b | Negative bias voltage | [V] |
| R b | Sampling resistor | [Ω] |
| t k | t k time | [s] |
| s k | Conductive surface area of probe corresponding to t k time | [m2] |
| (i ion) k | The amplitude of saturated ion current measured by the probe corresponding to t k time | [A] |
| t k+1 | t k+1 time | [s] |
| s k+1 | Conductive surface area of probe corresponding to t k+1 time | [m2] |
| (i ion) k+1 | The amplitude of saturated ion current measured by the probe corresponding to t k+1 time | [A] |
| r p | Probe radius | [m] |
| v | The motion velocity of the probe | [m·s−1] |
| Δs | The change of the conductive surface area | [m2] |
| Δi ion | The saturated ion current measured by the probe | [A] |
| θ | The inclination angle of the sheet slanting tungsten electrode front end | [°] |
| n | The spatial density of ions | [m−3] |
| v i | The average velocity of ions | [m·s−1] |
| N i | The number of ions passing through per unit area per unit time | [m−2·s−2] |
| e | The ionic charge of primary ionization | [C] |
| J i | The ion current density passing through any plane in the current-carrying region | [A·m−2] |
| n arc | The spatial density of argon ion in the arc current-carrying region | [m−3] |
| k | Boltzmann constant | [J·K−1] |
| T e | The electron temperature in the current-carrying region | [K] |
| m i | The mass of argon ion | [kg] |
| T h | The temperature of arc heavy particles | [K] |
| T | The temperature of arc current-carrying region | [K] |
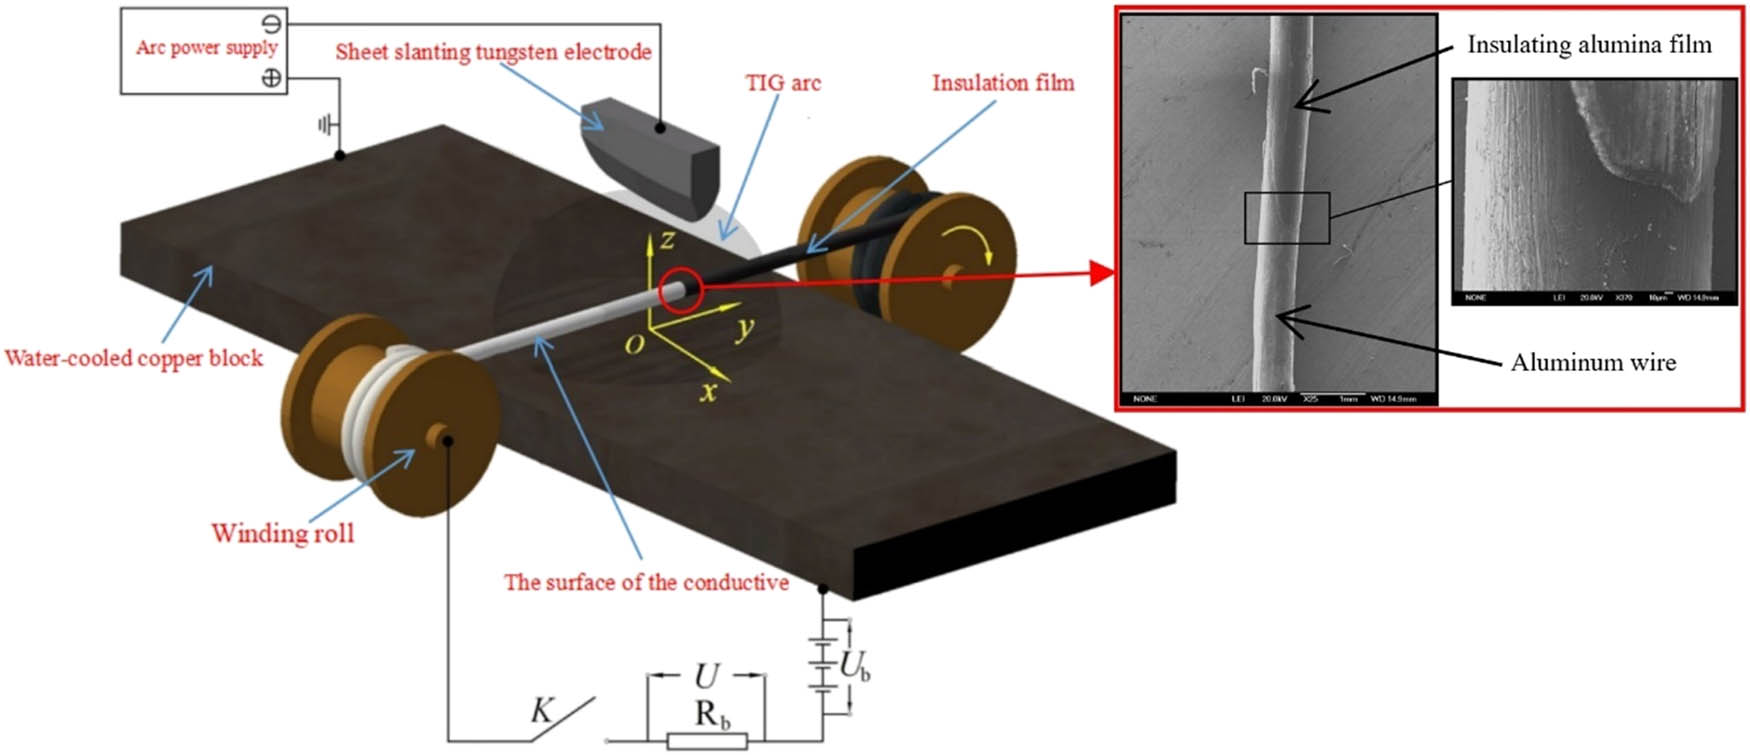
Experimental device and a sampling circuit.
The position of aluminum wire is adjusted in x-direction and z-direction, respectively, as shown in Figure 2, so that the probe can diagnose in different positions in the arc cross-section and in different height z. The probe measurement signal was imported into the sampling loop for recording with Tektronix’s MDO3024 digital oscilloscope. As shown in Figure 1, when a sufficiently large negative bias U b is applied by the probe and it is in series with the sampling resistor R b, the saturation ion current flowing through the sampling resistor R b can be obtained through Ohm’s law [19,20].

Electrostatic probe in the arc section.
Figure 1 shows the surface topography of the aluminum wire. An insulating film with a thickness of only tens of microns is formed on the local surface of aluminum wire by anodic oxidation to replace the ceramic tube covered with the conventional probe. Non-oxidized parts can be used as conductive surfaces for differential analysis. The principle of differential analysis is shown in Figure 3. The conductive surface area of the probe in the cross-section of arc current-carrying region at t k time is s k , and the amplitude of saturated ion current measured by the probe is (i ion) k ; when the probe moves through the arc at a constant speed, the conductive surface area at t k+1 is s k+1, and the measured saturated ion current amplitude is (i ion) k+1. Then, the change of the conductive surface area is calculated as follows:
where r p is the probe radius; v is the motion velocity of the probe; t k+1 – t k is the collection time interval of saturated ion current, which can be adjusted by the oscilloscope. The amplitude change of saturated ion current caused by the change of the probe conductive surface area is calculated as follows:
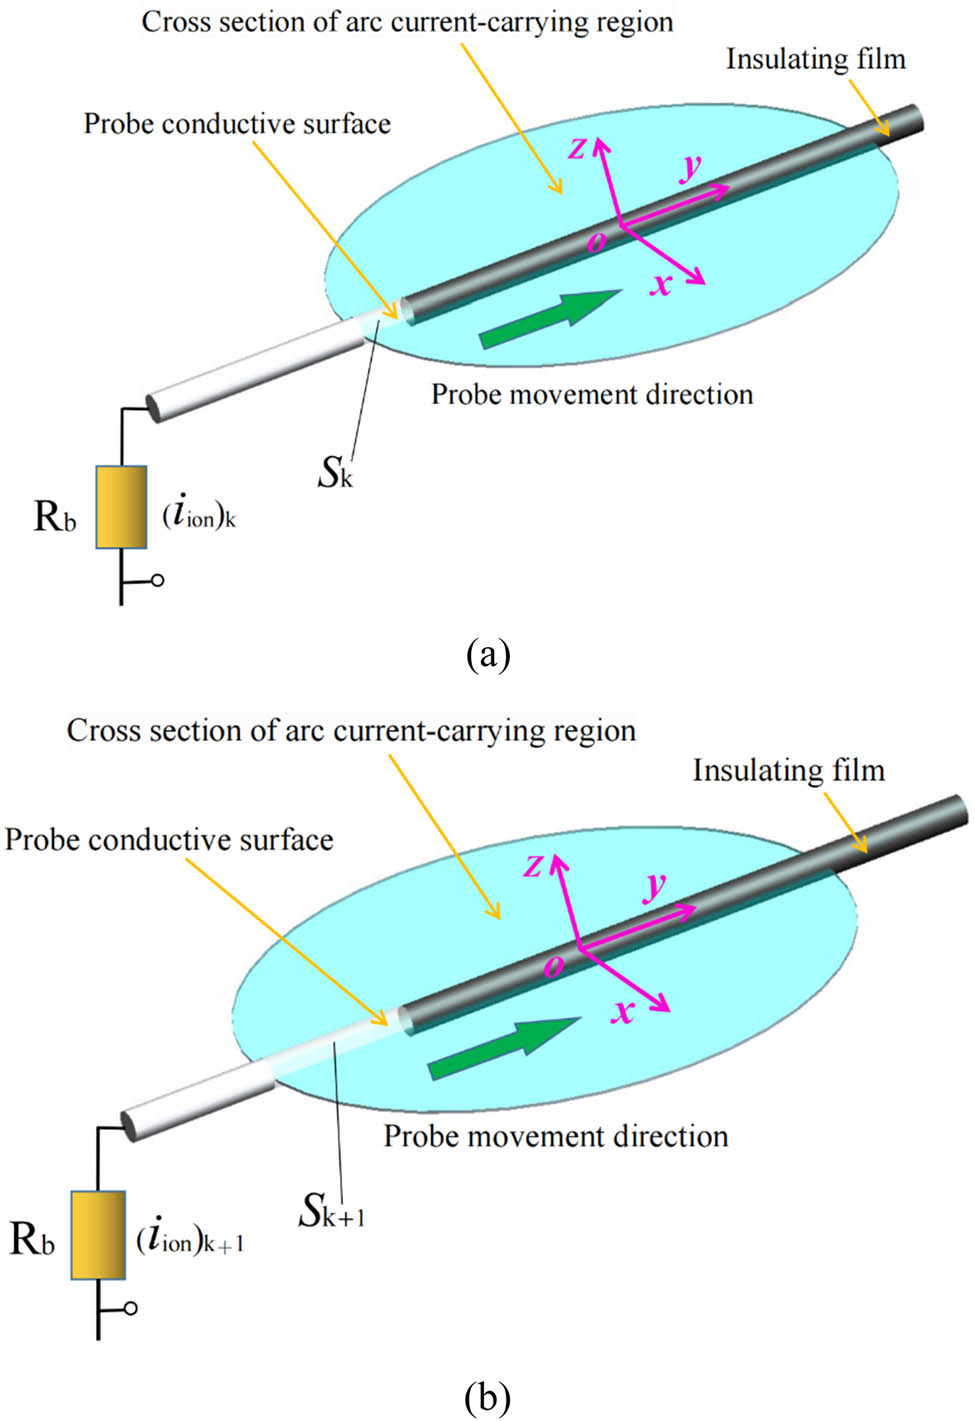
Schematic of principle for differential analysis: (a) t k time electrostatic probe and (b) and t k+1 time electrostatic probe.
It can be seen that Δi ion is equivalent to the saturated ion current measured by the probe with conductive surface area Δs in the arc cross-section. In equation (1), it can be seen that Δs can be reduced by shortening the acquisition collection time interval of the oscilloscope, so as to realize the local micro-measurement of Δi ion.
2.2 Experimental installation
The experiment adopts direct current electrode negative, the arc length is 5 mm, and the flow rate of shielding gas is 4 L·min−1. The special welding torch used in the experiment is composed of a plate-type contact tube, mica protection air cover, insulation positioning clamp block, and sheet slanting tungsten electrode, as shown in Figure 4. Wherein, the sheet slanting tungsten electrode is clamped by a plate-type contact tube which is provided with a water cooling channel, and a mica protection air cover is covered on the outside of plate-type contact tube and sheet slanting tungsten electrode and is clamped from the side by insulating positioning clamp block. The use of sealing tape ensures airtightness of the mica protection air cover. The thickness of the assembled welding torch is only 3 mm, which is suitable for ultra-narrow gap TIG welding with a gap width of several millimeters. The geometry size of the sheet slanting tungsten electrode is shown in Figure 5, the cross-section is a rectangle of 6 mm × 1.34 mm, the included angle of the electrode tip is 45°, and the inclination angle of the sheet slanting tungsten electrode front end is θ. Besides, to avoid the tip discharge, the front end corner of the sheet slanting tungsten electrode is machined into fillet, and named as fillet 1 and fillet 2, respectively.

Welding torch diagram.

Geometry of sheet slanting electrode tungsten inert gas welding.
2.3 Calculation of temperature in the current-carrying zone
Based on the local thermal equilibrium condition and the mechanism of charged particle collision, the temperature distribution in the current-carrying region can be obtained by the saturated ion current measured by the electrostatic probe [20]. The arc current-carrying region is in thermal equilibrium, so the number of ions passing through per unit area per unit time is calculated as follows:
where n is the spatial density of ions and v i is the average velocity of ions. Because the arc current-carrying region can be regarded as argon gas mainly composed of first-order ionization, and the secondary electron emission on the probe surface and sputtering of probe material can be ignored [21], the ion current density passing through any plane in the current-carrying region can be expressed as:
In the formula, e is the ionic charge of primary ionization. Besides, the sheath layer makes the space density of argon ions on the probe surface decrease relative to the arc current-carrying region [22].
where n arc is the spatial density of argon ion in the arc current-carrying region, and the results given by H.N.O. Elson can be used [23]. The average velocity of argon ions passing through the sheath is equal to the Bohm velocity [24].
where k is Boltzmann constant; T e is the electron temperature in the current-carrying region; and m i for the mass of argon ion. At the same time, variation of the conductive surface area of the electrostatic probe can be combined with relevant parameters calculated by the type (1) to Δs = 1.413 × 10⁻⁷ m2. Then, it can be considered that the saturated ion current is uniformly distributed on the conductive surface of the probe with an area of 1.413 × 10⁻⁷ m2, and the formula is as follows:
Besides, according to the recommendation in literature [25], the effective surface area of the cylindrical probe to measure saturated ion current is generally two-thirds of the conductive surface area of the probe, and the formula is as follows:
With simultaneous formulas (3)–(8), the electron temperature in the current-carrying region can be obtained by solving the saturated ion current. Further combined with the physical characteristics of the arc, the arc current-carrying region is in a local thermal equilibrium state, so the temperature of the electron is equal to the temperature of the heavy particle [14], and the formula is as follows:
where T h is the temperature of arc heavy particles and T is the temperature of arc current-carrying region. Therefore, under the condition of local thermal equilibrium, the electron temperature measured by electrostatic probe differential analysis is equivalent to the arc temperature.
In the previous work, the temperature distribution of TIG arc with conventional cylindrical tungsten electrode was measured by spectroscopic measurement, sweep electrostatic probe and electrostatic probe differential analysis method, and the reliability of electrostatic probe differential analysis method was verified [17]. As shown in Figure 6, it can be seen that the arc temperature measured by the electrostatic probe differential analysis method is lower than that measured by spectroscopic measurement, and the difference between them is several thousand K, which is caused by the disturbance of the electrostatic probe to arc. However, the temperature distribution trend measured by electrostatic probe differential analysis is similar to that measured by spectroscopic measurement, which indicates that it is feasible to qualitatively analyze arc temperature by electrostatic probe differential analysis.

Radial distribution of temperature in the current-carrying region 3 mm from the arc surface, welding current 100 A, and arc length 5 mm.
3 Experimental analysis
3.1 Temperature distribution in the current-carrying region of sheet slanting tungsten arc
Figure 7 shows the temperature of the arc current-carrying zone of the sheet slanting tungsten electrode measured at a distance of 1 mm from the surface of the water-cooled copper block. The inclination angle of the sheet slanting tungsten electrode front end is 5° and the welding current is 200 A. Considering that the edge of the current-carrying zone is out of the local thermal equilibrium, and according to the suggestions in literature [19,20], only the temperature distribution above 6,000 K is analyzed. As can be seen from Figure 7(a), the temperature distribution in the current-carrying zone along the thickness direction of sheet slanting tungsten electrode (y-direction) is symmetrical. The peak temperature appears at y = 0 mm and decreases along the y-direction to the periphery of the current-carrying zone. The x-direction temperature distribution of the arc of the sheet slanting tungsten electrode can also be obtained from the temperature value at y = 0 mm in Figure 7(a). As shown in Figure 7(b), the temperature distribution along the width direction of the sheet slanting tungsten electrode deviates from the symmetrical distribution characteristics, and the width of the temperature distribution is more than 17.5 mm, which is larger than the maximum width of the temperature distribution in the thickness direction, indicating that the current-carrying area of the sheet slanting tungsten electrode arc has an approximate elliptical cross-section, and the temperature peak value is offset from the centerline (x = 0 mm) in the width direction of the sheet slanting tungsten electrode.

Temperature distribution of arc current-carrying region in sheet slanting electrode tungsten inert gas welding. (a) Temperature distribution of the arc section. (b) Temperature distribution in x-direction arc current-carrying region.
The above-mentioned temperature distribution is due to the fact that the inclination angle of the sheet slanting tungsten electrode front end can change the discharge gap between the electrode and the water-cooled copper block. As shown in Figure 5, the discharge gap at fillet 1 is smaller and the discharge gap at fillet 2 is larger. After arc ignition, the bevel edge at the front end of the tungsten electrode will guide the arc current to flow intensively to fillet 1 with a small discharge gap. On the other hand, because the arc lags behind the sheet slanting tungsten electrode’s motion, it will promote the current to flow to the fillet 2, so the current flow range in the width direction of the sheet slanting tungsten electrode is significantly expanded. Because the arc heat is mainly generated by the Joule heat of the current, the temperature distribution range will also increase, which will eventually lead to the temperature distribution width expansion and overall deviation in the current-carrying area in the width direction of the tungsten electrode. The thickness direction of the tungsten electrode is not affected by the above effects, and the arc current flows symmetrically based on the geometric features of the tungsten electrode and concentrates at the tip of the tungsten electrode so that the temperature distribution in this direction is symmetrical.
3.2 The influence of the inclination angle of the sheet slanting tungsten electrode front end on the temperature of the current-carrying zone
The measured temperature distribution in different cross-sections of the current-carrying region is shown in Figure 8 by changing the inclination angle of the sheet slanting tungsten electrode front end. For the convenience of analysis, the result at x = 0 mm is taken. It can be seen that the temperature in the thickness direction of the sheet slanting tungsten electrode still maintains symmetrical distribution characteristics under different inclination angles; The temperature distribution width, temperature peak, and offset distance (relative to x = 0 mm) vary with the inclination angle. When the inclination angle decreases from 5° to 1°, the temperature peak in the width direction of the sheet slanting tungsten electrode shifts in the negative direction of the x-axis, and the offset distance increases with the decrease of the inclination angle. When the inclination angle is between 3° and 5°, the temperature peak and temperature distribution width in the width direction of the sheet slanting tungsten electrode have little change. When the inclination angle decreases to 1°, the temperature peak increases significantly and the temperature distribution width decreases significantly. When the inclination angle increases from 5° to 11°, the temperature peak in the width direction of the sheet slanting tungsten electrode shifts positively along the x-axis, and the offset distance increases with the increase of the inclination angle. When the inclination angle increases from 5° to 8°, the temperature peak and temperature distribution width in the width direction of the sheet slanting tungsten electrode have little change. When the inclination angle increases to 11°, the temperature peak increases greatly and the temperature distribution width decreases significantly.

T distribution of arc current-carrying region with the different tilt angle of sheet slanting tungsten electrode hypotenuse. (a) T distribution in y-direction, z = 1 mm. (b) T distribution in x-direction, z = 1 mm. (c) T distribution in y-direction, z = 2.5 mm. (d) T distribution in x-direction, z = 2.5 mm. (e) T distribution in y-direction, z = 4 mm. (f) T distribution in x-direction, z = 4 mm.
In addition, combined with the results of Figure 8(a), (c), and (e), it can be seen that the temperature peak and temperature distribution width in the thickness direction (x = 0 mm) of the tungsten electrode are the largest when the inclination angle of the sheet slanting tungsten electrode front end is 5° and combined with Figure 8(b), (d), and (f), it is found that the temperature peak offset distance of the corresponding current-carrying region is the smallest. This shows that when the inclination angle of the bevel edge of sheet slanting tungsten electrode is 5°, the deviation degree of the arc high-temperature zone from the centerline in the width direction of the tungsten electrode is the smallest, so the maximum temperature peak and temperature distribution width are found at x = 0 mm. Once the inclination angle changes, the arc high-temperature zone will shift along the x-axis as a whole, resulting in a decrease of the temperature peak and temperature distribution width at x = 0 mm.
When the inclination angle of the front end of the sheet slanting tungsten electrode is too large, the guiding effect will cause the arc current to be excessively concentrated to the fillet 1 with a small discharge gap, which will easily lead to overheating and melting of the sheet slanting tungsten electrode locally, resulting in burning loss of the sheet slanting tungsten electrode and arc instability. When the inclination angle of the front end of the sheet slanting tungsten electrode is too small, the guiding effect will be greatly weakened, so that the inertia drag effect will dominate, and the arc current will concentrate on the fillet 2, which will also lead to overheating and burning of the sheet slanting tungsten electrode and destroy the arc stability.
3.3 Effect of welding current on the temperature of the current-carrying zone
The temperature distribution in the current-carrying region under different welding currents is shown in Figure 9, and the inclination angle of the sheet slanting tungsten electrode front end is 5°. It can be seen from the figure that when the welding current changes, the temperature distribution in the thickness direction of sheet slanting tungsten electrode is still symmetrical, and the width and peak value of temperature distribution in this direction increase with the increase of welding current. The temperature distribution range in the width direction of the tungsten electrode also expands with the increase of welding current, and the temperature peak value increases significantly. At the same time, with the increase of welding current, the peak value in the width direction of the sheet slanting tungsten electrode shifts to the positive direction of the x-axis.

T distribution of arc current-carrying region with different welding current. (a) T distribution in y-direction, z = 1 mm. (b) T distribution in x-direction, z = 1 mm. (c) T distribution in y-direction, z = 2.5 mm. (d) T distribution in x-direction, z = 2.5 mm. (e) T distribution in y-direction, z = 4 mm. (f) T distribution in x-direction, z = 4 mm.
The influence of welding current on temperature distribution in the current-carrying area is still caused by the change of current density distribution. With the increase of welding current, Joule heat in arc current-carrying area increases greatly, which will inevitably lead to the increase of temperature peak value, and further enhance the diffusion ability of charged particles, resulting in the expansion of temperature distribution width. At the same time, using a larger welding current will inevitably increase the arc stiffness, so that the arc can maintain its own shape, and the inertia drag effect is weakened, thus making arc current flow more easily to fillet 1 with a small discharge gap, and the arc high-temperature area will also shift integrally in the same direction.
4 Conclusion
The temperature distribution in the current-carrying region of the sheet slanting tungsten electrode was measured by electrostatic probe differential analysis, and the influence of different parameters on the temperature distribution in the current-carrying region was tested by experiments. The conclusions are summarized as follows:
The sheet slanting tungsten electrode has a larger temperature distribution width in the width direction and the arc high-temperature zone shifts along this direction as a whole.
The leading effect of the bevel edge at the front end of the sheet slanting tungsten electrode on the arc current and the inertia drag effect during the arc movement are the main reasons for the expansion of the temperature distribution range in the width direction of the tungsten electrode and the deviation of the arc high-temperature zone.
When the inclination angle of the front end of the sheet slanting tungsten electrode is small, the inertia drag effect is dominant, and the arc high-temperature zone shifts to the position where the discharge gap is large; When the inclination angle is large, the guiding effect is enhanced, and the arc high-temperature zone shifts to the position where the discharge gap is small.
When a large welding current is used, the arc stiffness increases and the inertia drag effect is weakened, so that the arc high-temperature zone shifts to the position where the discharge gap is small.
Acknowledgements
This work was supported by the National Natural Science Foundation of China (No. 51605384), the Natural Science Foundation of Gansu Province, China (No. 21JR7RA308), and the Natural Science Foundation of Gansu Province, China (No. 20JR5RA416). The authors wish to express their gratitude.
-
Funding information: This work was supported by the National Natural Science Foundation of China (No. 51605384), the Natural Science Foundation of Gansu Province, China (No. 21JR7RA308), and the Natural Science Foundation of Gansu Province, China (No. 20JR5RA416).
-
Author contributions: Yuanbo Li: conceptualization, original draft, supervision, funding acquisition, review, and editing; Tao Ye: experiment, investigation; Wenxing Zheng: data processing, validation; Shuaichuan Ma: picture production; Xilong Zhao: supervision, project administration. All authors have read and agreed to the published version of the manuscript.
-
Conflict of interest: The authors declare no conflict of interest.
References
[1] Malin, V. Y. The state of the art of narrow gap welding. Welding Journal, Vol. 62, 1983, pp. 22–30.Search in Google Scholar
[2] Itsuhiko, S., G. Tomokazu, K. Minoru, and N. Hirokazu. Development and application of narrow gap welding processes in Japan. Journal of the Japan Welding Society, Vol. 50, No. 11, 1981, pp. 1074–1080.10.2207/qjjws1943.50.1074Search in Google Scholar
[3] Sun, Q. J., H. F. Hu, X. Yuan, and J. C. Feng. Research status and development trend of narrow-gap tig welding. Advanced Materials Research, Vol. 308–310, 2011, pp. 1170–1176.10.4028/www.scientific.net/AMR.308-310.1170Search in Google Scholar
[4] Kusano, K. and H. Watanabe. Recent trends in development of high – efficiency tig welding; high – deposition tig welding and ultranarrow – gap tig welding. Welding International, Vol. 16, No. 12, 2002, pp. 986–991.10.1080/09507110209549651Search in Google Scholar
[5] Liu, J., Z. T. He, and J. Niu. Research on narrow gap hot wire tig welding of thick plate of high strength steel for shipbuilding. Development and Application of Materials, Vol. 33, No. 3, 2018, pp. 10–15.Search in Google Scholar
[6] Ji, H., X. Xia, J. Wu, H. Wu, Z. Liu, J. Ma, et al. Welding technology development for the fabrication of vacuum vessel for CFETR. Fusion Engineering and Design, Vol. 147, 2019, id. 111272.10.1016/j.fusengdes.2019.111272Search in Google Scholar
[7] Wu, Q. D. Electric field distribution of tungsten electrode welding arc in narrow gap. Journal of Welding, Vol. 1, 1983, pp. 39–54.Search in Google Scholar
[8] Li, Y. B., T. Yang, S. Zheng, and X. Zhao. Electrostatic probe differential analysis for temperature distribution diagnostics of constricted arc current-carrying region in sheet slanting tungsten electrode with insulating solid wall. Journal of Mechanical Engineering, Vol. 55, No. 4, 2019, pp. 77–83.10.3901/JME.2019.04.060Search in Google Scholar
[9] Ma, S., H. Gao, S. Zheng, and L. Wu. Spectroscopic measurement of temperatures in pulsed tig welding arcs. Journal of Physics D Applied Physics, Vol. 44, No. 40, 2011, id. 405202.10.1088/0022-3727/44/40/405202Search in Google Scholar
[10] Vilarinho, L. O., C. Fanara, D. Yapp, and I. M. Richardson. Quasi-neutrality and local thermodynamical equilibrium in atmospheric presure arc discharges. Journal of the Brazilian Society of Mechanical Sciences and Engineering, Vol. 31, No. 3, 2009, pp. 224–231.10.1590/S1678-58782009000300008Search in Google Scholar
[11] Mu, Z., X. Chen, R. Hu, S. Lin, and S. Pang. Laser induced arc dynamics destabilization in laser-arc hybrid welding. Journal of Physics D: Applied Physics, Vol. 53, No. 7, 2020, id. 075202.10.1088/1361-6463/ab5758Search in Google Scholar
[12] Xiao, X., X. Hua, and Y. Wu. Comparison of temperature and composition measurement by spectroscopic methods for argon–helium arc plasma. Optics and Laser Technology, Vol. 66, 2015, pp. 138–145.10.1016/j.optlastec.2014.08.017Search in Google Scholar
[13] Yu, H., Y. Xu, N. Lv, H. Chen, and S. Chen. Arc spectral processing technique with its application to wire feed monitoring in al–mg alloy pulsed gas tungsten arc welding. Journal of Materials Processing Tech, Vol. 213, No. 5, 2013, pp. 707–716.10.1016/j.jmatprotec.2012.11.016Search in Google Scholar
[14] Fanara, C. Sweeping electrostatic probes in atmospheric pressure arc plasmas-part i: general observations and characteristic curves. IEEE Transactions on Plasma Science, Vol. 33, No. 3, 2005, pp. 1072–1081.10.1109/TPS.2005.848614Search in Google Scholar
[15] Doyle, S. J. and G. Kunning. Measurement of atmospheric pressure microplasma jet with langmuir probes. Journal of Vacuum Science & Technology, A. Vacuum, Surfaces, and Films, Vol. 34, No. 5, 2016, id. 051301.10.1116/1.4959565Search in Google Scholar
[16] Kim, Y. C., Y. S. Kim, H. C. Lee, J. H. Moon, C. W. Chung, Y. Kim, et al. Non-invasive probe diagnostic method for electron temperature and ion current density in atmospheric pressure plasma jet source. Physics of Plasmas, Vol. 22, 2015, id. 083511.10.1063/1.4928440Search in Google Scholar
[17] Li, Y. B., X. Li, Q. Shi, J. Liu, and K. Li. Differential analysis for temperature distribution diagnostics of arc current-carrying region with low disturbance electrostatic probe. Transactions of the China Welding Institution, Vol. 38, No. 5, 2017, pp. 26–30 + 130.Search in Google Scholar
[18] Li, Y. B. Electrostatic probe analysis of TIG arc confined by insulating sheet and its heating characteristics in ultra narrow gap (Ph.D. dissertation). Lanzhou University of Technology, Gansu, China, 2013.Search in Google Scholar
[19] Fanara, C. and L. Vilarinho. Electrical characterization of atmospheric pressure arc plasmas. The European Physical Journal D - Atomic, Molecular, Optical and Plasma Physics, Vol. 28, No. 2, 2004, pp. 241–251.10.1140/epjd/e2003-00301-8Search in Google Scholar
[20] Fanara, C. and I. M. Richardson. A langmuir multi-probe system for the characterization of atmospheric pressure arc plasmas. Journal of Physics D: Applied Physics, Vol. 34, No. 18, 2001, id. 2715.10.1088/0022-3727/34/18/302Search in Google Scholar
[21] Xiang, Z. L. and C. X. Yu. High temperature plasma diagnosis technology, Shanghai Science and Technology Press, Shanghai, 1982.Search in Google Scholar
[22] Smy, P. R. The use of Langmuir probes in the study of high pressure plasmas. Advanced in Physics, Vol. 25, No. 5, 1976, pp. 517–553.10.1080/00018737600101442Search in Google Scholar
[23] Olsen, H. N. Thermal and electrical properties of an Argon plasma. The Physics of Fluids, Vol. 2, No. 6, 1959, pp. 614–623.10.1063/1.1705962Search in Google Scholar
[24] Riemann, K. U. The Bohm criterion and sheath formation. Journal of Physics D: Applied Physics, Vol. 24, No. 4, 1991, pp. 493–518.10.1088/0022-3727/24/4/001Search in Google Scholar
[25] Leandro, P., K. Hector, and M. Fernando. On the use of sweeping Langmuir probe in cutting-arc plasmas-Part II: Interpretation of the results. IEEE Transactions on Plasma Science, Vol. 32, No. 1, 2008, pp. 271–277.10.1109/TPS.2007.914182Search in Google Scholar
© 2021 Yuanbo Li et al., published by De Gruyter
This work is licensed under the Creative Commons Attribution 4.0 International License.
Articles in the same Issue
- Research Articles
- Fused deposition modeling of poly(ether ether ketone) scaffolds
- Investigation of the microstructure evolution in TP347HFG austenitic steel at 700°C and its characterization method
- Hot deformation behavior and processing maps of 9Cr3W3Co oxide dispersion-strengthened steel
- Evolution of physicochemical properties of quick lime at converter-smelting temperature
- Influence of phase distribution of converter slag microzones on the occurrence of P
- Investigation on ultrasonic assisted friction stir welding of aluminum/steel dissimilar alloys
- Analysis of oxide scale thickness and pores position of HCM12A steel in supercritical water
- Behavior of MnS inclusions during homogenization process in low-alloyed steel FAS3420H
- Preparation and cutting performance of nano-scaled Al2O3-coated micro-textured cutting tool prepared by atomic layer deposition
- Prediction of hot metal temperature based on data mining
- Effect of TiO2 content in slag on Ti content in molten steel
- Performance evaluation of titanium-based metal nitride coatings and die lifetime prediction in a cold extrusion process
- Effect of different drilling techniques on high-cycle fatigue behavior of nickel-based single-crystal superalloy with film cooling hole
- Effect of CO2 injection into blast furnace tuyeres on the pulverized coal combustion
- Microstructure and properties of Co–Al porous intermetallics fabricated by thermal explosion reaction
- Evolution regularity of temperature field of active heat insulation roadway considering thermal insulation spraying and grouting: A case study of Zhujidong Coal Mine, China
- Evolution of reduction process from tungsten oxide to ultrafine tungsten powder via hydrogen
- A thermodynamic assessment of precipitation, growth, and control of MnS inclusion in U75V heavy rail steel
- Effect of basicity on the reduction swelling properties of iron ore briquettes
- Effect of Cr and Al alloying on the oxidation resistance of a Ti5Si3-incorporated MoSiBTiC alloy
- Microstructure and mechanical properties of 2060 Al–Li alloy welded by alternating current cold metal transfer with high-frequency pulse current
- Effects of composition and strain rate on hot ductility of Cr–Mo-alloy steel in the two-phase region
- Effect of K and Na on reduction swelling performance of oxidized roasted briquettes
- Dephosphorization mechanism and phase change in the reduction of converter slag
- Parametric investigation and optimization for CO2 laser cladding of AlFeCoCrNiCu powder on AISI 316
- Optimization of heat transfer and pressure drop of the channel flow with baffle
- Quantitative analysis of microstructure and mechanical properties of Nb–V microalloyed high-strength seismic reinforcement with different Nb additions
- Visualization of the damage evolution for Ti–3Al–2Mo–2Zr alloy during a uniaxial tensile process using a microvoids proliferation damage model
- Research on high-temperature mechanical properties of wellhead and downhole tool steel in offshore multi-round thermal recovery
- Dephosphorization behavior of reduced iron and the properties of high-P-containing slag
- Jet characteristics of CO2–O2 mixed injection using a dual-parameter oxygen lance nozzle for different smelting periods
- Effects of ball milling on powder particle boundaries and properties of ODS copper
- Heat transfer behavior in ultrahigh-speed continuous casting mold
- Solidification microstructure characteristics of Cu–Pb alloy by ECP treatment
- Luminescence properties of Eu2+ and Sm3+ co-doped in KBaPO4
- Research on high-temperature oxidation resistance, hot forming ability, and microstructure of Al–Si–Cu coating for 22MnB5 steel
- The differential analysis for temperature distribution diagnostics of arc current-carrying region in sheet slanting tungsten electrode inert gas welding with the electrostatic probe
- Reactions at the molten flux-weld pool interface in submerged arc welding
- The effect of liquid crystalline graphene oxide compared with non-liquid crystalline graphene oxide on the rheological properties of polyacrylonitrile solution
- Study on manganese volatilization behavior of Fe–Mn–C–Al twinning-induced plasticity steel
- Physical modeling of bubble behaviors in molten steel under high pressure
- Rapid Communication
- The new concept of thermal barrier coatings with Pt + Pd/Zr/Hf-modified aluminide bond coat and ceramic layer formed by PS-PVD method
- Topical Issue on Science and Technology of Solar Energy
- Solution growth of chalcopyrite Cu(In1−xGax)Se2 single crystals for high open-circuit voltage photovoltaic device
- Copper-based kesterite thin films for photoelectrochemical water splitting