A Compliance Return Method to Evaluate Different Approaches to Implementing Regulations: The Example of Food Hygiene Standards
-
David Williamson
 and
Mayowa Akinbote
and
Mayowa Akinbote

Abstract
We investigate how different approaches to the implementation of regulations affect compliance by evaluating the implementation of food hygiene standards in four English authorities. We draw upon regulatory theory in general together with specific literature on food hygiene standards to advance a new “compliance return” concept, which enables compliance outcomes and resource inputs to be considered jointly. We operationalize “compliance return” as part of a low-cost methodology for evaluating the relative effectiveness of different approaches to implementing food hygiene standards. We find that different approaches to implementation have significant impacts on food policy outcomes. Specifically, implementation ranged from a greater emphasis on deterrence to a greater emphasis on cooperation, with cooperation resulting in greater compliance and deterrence requiring less resource input. When compliance level is considered alongside resource input, to assess the overall “compliance return,” a stronger case emerges for a deterrence approach. The food policy implications are two-fold: (i) implementation affects policy outcomes, and (ii) the measure of “compliance return” developed and implemented in this article offers a low-cost approach to support the ex-post evaluation of implementation choices. The Compliance Return approach may be applicable more widely, especially where there is discretion regarding how regulations are to be implemented.
1 Introduction
This article addresses practitioner concerns regarding the implementation of UK food hygiene regulations for establishments handling food – most of which provide food directly to consumers – and contributes to the related scholarly literature on approaches to regulatory compliance. Practitioners – e.g. senior public health managers in local authorities – must not only implement food hygiene standards but must do so within cost constraints. This challenge has consequences when failure to comply affects public health (e.g. there are an estimated 2.4 million cases of foodborne illnesses each year in the UK, within which there are 380,000 cases of norovirus, with eating out and takeaways accounting for 37 and 26% of those cases; Food Standards Agency, 2020). Yet, especially since 2009–2010, when the financial crisis triggered “austerity” policies that severely constrained local government budgets, local officials must ensure compliance with limited resources (Regulating Futures Review, 2017).
The practical need to reconcile high standards of public health with low enforcement costs of doing so gave rise to the research reported in this article, which was commissioned by a consortium of four neighbouring District Councils (local authorities; henceforth, LAs) – each responsible for implementing the national food hygiene regulations in its own district – in the English West Midlands. (To preserve anonymity, these four LAs are denoted LA1, LA2, LA3, and LA4.) To this end, we developed a “compliance return” construct to (i) evaluate the efficacy of different approaches to the implementation of food safety regulations and (ii) demonstrate the terms of the trade-off between food safety standards and the cost of securing compliance. Further, we develop and explain how our quantitative methodology can deliver these two objectives using the data available to managers, hence at a low cost.
In pursuit of these objectives, we also contribute to understanding how implementation affects compliance. To assess this, we focus on two key compliance approaches, which, in their different guises, have deterrence and cooperation as opposing or complementary strategies (Ayres and Braithwaite, 1992; Bates et al., 2015; Braga et al., 2018; Burby & Patterson, 1993; Downs et al., 1996; Kuperan & Sutinan, 1998; Mackay et al., 2020; OECD, 2013, Rechtschaffen, 1998; Scholz, 1984). Our contribution to this literature is to investigate, in the context of food hygiene, how even small changes along this continuum of regulatory approaches can have substantial impacts on both compliance outcomes and compliance costs.
To enable implementation practices and their outcomes to be compared across the four local authorities, we were granted access to a large longitudinal data set recording the complete results from food hygiene inspections carried out by all four authorities over a 10-year period (fiscal years 2008–2009 and 2017–2018): i.e., 26,285 individual assessments of food hygiene and safety performance carried out during regulatory interventions at 11,294 establishments. These authorities also provided personnel data to enable us to consider the resources involved in the delivery of the enforcement service, which, when considered alongside levels of compliance, enabled a fuller assessment of the respective “compliance returns” of the different approaches to implementation.
This study commences by positioning the investigation within the deterrence and cooperation literature and, following this, the literature on compliance within the food hygiene and safety area. We then introduce the construct of “compliance return” and demonstrate its use in comparing different approaches to implementation along the deterrence–cooperation continuum. This involves explaining the two essential constituents in the measure of “compliance return”: the compliance score and the resource input by the regulator. Having considered the literature on compliance and the rationale for our “compliance return” construct, we present the methods used to analyse the data, present and interpret the results of the analysis, and discuss the policy implications of these findings.
Regarding the wider applicability of our Compliance Return approach to evaluation, we conclude that it may have external validity in regulatory fields where (i) full cost–benefit analysis is not feasible, (ii) there is some discretion – and thus some variation – regarding implementation, and (iii) consistent records of inspection results are maintained across implementing authorities. In this article, we do not attempt to identify such regulatory fields. Although we cannot make statistically verifiable claims to external validity, we attempt to provide sufficient detail about the context and implementation of our approach for readers to make informed judgements as to the applicability of our evaluation methodology to their own circumstances.
2 Policy: Modes of Implementation
In this section, we draw upon the literature to identify deterrence and cooperation as modes of implementing food hygiene and safety policy.
2.1 Theory (1): Using Deterrence and Cooperation to Secure Compliance
When the success of a regulation is dependent on the level of compliance achieved, and when compliance is not automatic, then the question of how compliance can be encouraged becomes a critical matter. The question concerns how compliance can be incentivized most effectively, with the focus typically being a penalty to deter non-compliance and/or support to help achieve compliance. These represent two styles of implementation and enforcement. The names given to these styles include punishment and persuasion (Braithwaite, 1985), deterrence and cooperation (Rechtschaffen, 1998), and coercive and catalytic (Weske et al., 2018). Each enforcement style has different assumptions and actions. Deterrence assumes that individuals (as well as private and public organizations) make rational choices based on self-interest. This can lead to an unwillingness to comply, which, being a purposeful choice, is deemed to justify and require compulsion to force compliance (Becker, 1968; Cohen, 2000; Ehrlich, 1975; Kagan et al., 2003; Mintz, 1995; Markel, 2000, 2005; Nagin, 2013; Pearce & Tombs, 1997; Stigler, 1970). Compulsion can include warnings, fines, closure, and imprisonment. Cooperation assumes that those being regulated are willing to comply but lack the capacity (e.g. knowledge) to comply. Actions would then involve support to address the shortfalls in capacity (e.g. training). Cooperation as a normative approach was born from studies showing that persuasion, assistance, and collaboration were the preferred approach of regulators (Braithwaite, 1985; Cranston, 1979; Hawkins, 1984, 2002; Hutter, 1997) and from criticisms of deterrence theory (Andreen, 2007; Rechtschaffen & Markell, 2003; Scholz, 1997; Stoughton et al., 2001). These criticisms, which Scholz (1997) summarized in four key points, are that (i) corporations fail to act as fully informed utility maximizers, (ii) regulation fails to unambiguously define the required behaviour, (iii) punishment is not a primary driver of behaviour, and (iv) officials do not have the capacity to detect and punish non-compliance. Together, these constitute the justification for a more cooperative-focused approach.
Deterrence and cooperation should not, however, be seen as mutually exclusive. It is recognized that cooperation may not always work and that coercion needs to be available, to be called upon if necessary (Ayres & Braithwaite, 1992; Braithwaite, 1985, Burby & Patterson, 1993; Hawkins, 2002; Hutter, 1988; OECD, 2005; Rechtschaffen, 2004; Scholz, 1997; Stoughton et al., 2001). Integration rather than exclusion has therefore permeated the debate on deterrence and cooperation, with much of the detail being on when and where each should be used and their relative effectiveness (Andreoni et al., 2003; Chen et al., 2012; Glicksman & EarnHart, 2007; Scholz, 1984; Scholz & Gray, 1997). However, what remains unclear is the issue of effectiveness more broadly. In particular, whilst the most obvious criterion is the level of compliance achieved, this cannot be compliance at any cost, due to the expectation that the benefits from compliance should outweigh the costs incurred (e.g. the remit of the Regulatory Policy Committee, created by the UK Government in 2009, focuses on the impact of regulatory decisions). Accordingly, to compare the efficacy of different approaches to regulatory compliance with food hygiene standards, we develop and apply our “compliance return” construct, which jointly measures compliance and the costs to the regulatory authority of achieving compliance. Joint measurement enables policy makers to use existing data – hence, at minimal cost – to evaluate different approaches to implementation by exploring potential trade-offs between levels of compliance and the costs of achieving such levels.
Empirically, studies on effectiveness have tended to focus on either deterrence or cooperation, levels of compliance when using either deterrence or cooperation, or the effect of either deterrence or cooperation on the regulatee and/or the regulator. Examples include the explanation of provisional driver non-compliance using deterrence theory (Bates et al., 2015); cooperation being an incomplete explanation of compliance with international agreements (Downs et al., 1996); deterrence being more effective when accompanied by a moral obligation and social pressure for the regulation of Malaysian fishermen (Kuperan & Sutinan, 1998); cooperation through capacity building improving compliance with State environmental regulations, and deterrence working as well for simpler regulatory requirements (Burby & Patterson, 1993); a systematic review showing that deterrence produces a small reduction in gang violence, drug markets and repeat offending (Braga et al., 2018); that increased compliance occurs when firms participate in the compliance process (Malesky & Taussig, 2017); and that regulators will make trade-offs between deterrence and cooperation when seeking compliance (Gunningham, 2017). One study that compared deterrence and cooperation for the same regulated activity is Weske et al. (2018). They compared the use of deterrence and cooperation for regulation on quality and patient safety in hospitals, showing that cooperation increased the capacity of ward leaders to comply, subject to the caveat that this depended on the motivation of ward leaders, which was shown to vary, which in turn necessitated the use of deterrence when motivation was absent. Another study, by Earnhart and Glicksman (2015), investigated deterrence and cooperation for water discharge limits, concluding that cooperation resulted in better environmental management by the firm.
The paucity of studies assessing how regulation is carried out is a significant gap. Yet, the implementation literature is clear in pointing out the importance of identifying and assessing the implementation influencing variables in the securing of compliance (Khanna, 2021; Peters et al., 2013; Sabatier, 1986). These variables include the consistency and effectiveness of inspectors (Barnes et al., 2022), availability of implementation resources (Borraz et al., 2022; Luukkanen et al., 2018), and forms of cooperation (Buckley, 2015; Nevas et al., 2013). In our analysis, the implementation influencing variables, as previously alluded to, are the use of deterrence and the use of cooperation, and their implementation effectiveness as measured by compliance output per unit of resource input. Specifically, when using deterrence and cooperation for the same regulated task, there is an absence of empirical analysis of compliance levels alongside analysis of the efficacy in delivering those compliance levels. To address this deficiency, we analyse efficacy by (i) comparing compliance levels when using different approaches to regulation to secure compliance with food hygiene standards by food handling establishments (most of which provide food directly to consumers), in conjunction with (ii) comparing the resources used in the delivery of these two approaches to securing compliance. Before this is investigated in detail, we review the literature on compliance with food hygiene and safety standards.
2.2 Theory (2): Food Hygiene and Safety Standards
Food hygiene and safety in England, Wales, and Northern Ireland is overseen by the Food Standards Agency and in Scotland by Food Standards Scotland. The legislation the Food Standards Agency implements includes the Food Safety Act 1990, the Food Safety and Hygiene (England) Regulations 2013, Regulation (EC) 178/2002, Regulation 852/2004, and other areas of law as detailed in the Food Law Code of Practice (England) (2017). Local authorities are responsible for implementing policies determined by national legislation, in collaboration with the Food Standards Agency. In England, Wales, and Northern Ireland this involves 329 local authorities, which cover substantial but varying populations. For example, the four local authorities studied in the present article serve the following population sizes: LA1, 100,500; LA2, 123,300; LA3, 136,800; and LA4, 258,400.
The aim of food hygiene legislation and enforcement is explained by Fleetwood et al. (2019, p. 77): “As the consumption of food outside the home increases, efforts to identify effective strategies to reduce foodborne illness often focus on restaurants and other food premises. Inspections monitor hygiene while educating proprietors and … can inform consumers.” Accordingly, most establishments that are subject to the food hygiene and safety standards supply food directly to the consumer: the largest categories of inspected establishments are “restaurants and caterers” followed by “retailers” (the complete list of categories, together with the proportions in which each one appears in the data used in the present study, is presented in Section 4.3.1.).
The food hygiene and safety standards are operated through a food hygiene rating scheme, which involves separate ratings on “food hygiene and safety procedures,” “structure,” and “confidence in management.” (Structural requirements concern the cleanliness and ease of cleaning of all surfaces together with the adequacy of washing facilities, ventilation, lighting and drainage; “confidence in management” is a measure of confidence in the business’s food safety management systems and likelihood of future compliance.) The rating is from 0 to 5: where 0 = urgent improvement necessary; 1 = major improvement necessary; 2 = improvement needed; 3 = generally satisfactory; 4 = good; and 5 = very good. The rating is compulsorily displayed at the entrance to establishments in Wales and Northern Ireland and voluntarily displayed in England. Ratings are also publicly accessible via the Food Standards Agency website.
Studies on the use of food hygiene and safety standards, and the visual display of establishment performance, generally show a positive effect on food hygiene and safety. A study that looked at the use of inspection-based “grade cards” for hygiene performance for restaurants in Los Angeles County showed an increase in hygiene quality and a decrease in foodborne illnesses (Jin & Leslie, 2003, 2009; Simon et al., 2003). A similar finding was reported in Toronto, with disclosure improving compliance and decreasing foodborne illnesses (Serapiglia et al., 2007). In another study, a “letter-grade” score on restaurant hygiene in New York showed an increase in hygiene conditions (Wong et al., 2015). The use of a food inspection and restaurant grading system, but this time in Brazil for the 2014 FIFA world cup, also showed an improvement in food safety (da Cunha et al., 2016). A case study of Preston City Council likewise showed that cooperation improved food hygiene and safety compliance and, in doing so, produced an economic benefit by facilitating a more efficient use of resources (Bradford-Knox et al., 2016). In Berlin, the use of a points-based scale for food safety laws again showed a positive relationship (Fietz et al., 2018). Similarly, the positive impact of public disclosure of inspection scores was also reported in a recent study of King County in Washington State, where there was a small but positive impact on inspection scores and a corresponding reduction of hygiene violations (Patel & Rietveld, 2020). This is repeated in a study by Yu and Costanigro (2019), where the introduction of online restaurant disclosure scores for Orange County in North Carolina resulted in improved hygiene safety scores. Within this generally positive picture, it is important to note that in an analysis by Ho et al. (2019), which looked again at the introduction of food hygiene scores in Los Angeles, the health improvements reported by Jin and Leslie (2003) were absent when considered against new data and a revised methodology. However, this, in turn, is at odds with a recent study in the United Kingdom, which reported a clear association between better inspection scores and reduced foodborne illness (Fleetwood et al., 2019).
On the basis that the evidence shows improved food hygiene and safety scores reducing foodborne illness, it is apposite that we investigate how food hygiene and safety scores can be improved. A study by Yapp and Fairman (2005), which looked at compliance with food safety legislation in small businesses, found that regulators and small businesses viewed compliance in different ways: regulators see compliance as an on-going proactive process of evaluation and monitoring; while small businesses see compliance as a reactive process that follows regulator visits and inspections. This indicates that the regulator, as a component in the complex set of factors that affect compliance, can affect those factors via the regulator–regulatee interaction. And if the regulator uses education, persuasion, and cooperation to achieve compliance in the first instance, which is widely held to be the case (Bardach & Kagan, 1982; Braithwaite, 1985; Cranston, 1979; Hawkins, 1984, 2002; Hawkins & Hutter, 1993; Hutter, 1988, 1989, 1997; May, 2005; May & Wood, 2003; May & Winter, 2011; Pautz, 2009, 2010), it is appropriate to ask whether this is the best approach for improving food hygiene and safety scores. Indeed, even if education, persuasion, and cooperation are not the best approach, and the regulator–regulatee interaction is a much more nuanced interaction, it is incumbent on us to ask how the interaction affects food hygiene and safety scores – to see whether we can improve the scoring to reduce foodborne illness. In the present study, even though the four neighbouring LAs under investigation collaborate and implement the same national regulations, there is a marked difference in approach to ensuring compliance. This difference is explained in the next section.
3 Four LAs: Two Distinctive Approaches to Ensuring Compliance
In the UK, local authorities have some discretion over how to implement national legislation and accordingly can develop distinctive approaches to enforcement. Indeed, the scope of this study was determined by a joint decision by the four local authorities to compare the efficacy of two distinctly different approaches that had arisen within their number: in LA1, LA2, and LA3, the approaches were broadly the same by being compliance-to-support orientated, with an assessment of compliance based on the conditions found during the inspection, whereas in LA4 a support-to-compliance approach was used, involving a number of visits to provide support and advice followed by an assessment of compliance once the establishment had had the opportunity to implement the guidance given. (These characterizations of the respective approaches were suggested by the authors of the present study and were endorsed, along with the following explanations, by the practitioner group – representing all four LAs – that commissioned the research reported in this article).
The rating process, as specified in the Food Law Code of Practice (England) (2017) (the Code), commences once the establishment has registered with the local authority, which they must do 28 days prior to the commencement of trading. This is followed by an unannounced on-site visit to verify that systems, procedures, and documentation are in place. In LA1, LA2, and LA3, a rating would then be given followed by advice and support. Subsequent visits, which are unannounced and take place at frequencies determined by the level of risk involved, then re-inspect and re-rate. When remedial action is required and the business response is inadequate, local authorities have the power to apply written warnings and potential enforcement actions including seizure and detention of food, hygiene improvement notices, hygiene emergency prohibition notices, cautions, and prosecutions. We refer to this as a compliance-to-support approach, since advice and support towards compliance or an improved rating score are provided after the assessment of compliance is undertaken and recorded. However, a different approach is followed in LA4. It moved away from compliance-to-support as this is perceived, in line with the criticism of deterrence theory, to intimidate establishments, conditioning an evasive, non-cooperative approach and an often-unequal relationship.
In LA4, these considerations resulted in an alternative support-to-compliance approach. This was considered to comply with statutory requirements (i.e. the rating is eventually applied following an unannounced visit, and enforcement powers are used when needed) but gives greater weight to prior observation of practices, identification of risks, and provision of support in the compliance process. In practice, the support-to-compliance approach involves the pre-booking of visits to ensure that relevant people would be present, the use of chefs’ overalls rather than white coats, and as part of a less formal approach, the development of a more equal relationship based on trust, with an emphasis on joint working to identify solutions to improve practices. This “hands on” approach takes place at the establishment’s premises, with reports being jointly produced and agreed on-site, and actions likewise being immediately prioritized by both parties. Follow-up visits continue until the establishment is deemed “safe” and ready for a rating. Importantly, although this may require more visits and more time spent with establishments, the authority felt that it provided a more reliable indicator of food hygiene compliance, since an officer will have had the opportunity to observe a range of activities and food handlers, and to have had discussions with the Food Business Officer (FBO) and will therefore be able to make a more informed judgement in the key areas pertaining to food hygiene (“Procedures,” “Structure,” and “Confidence in Management”). (The FBO is defined in Article 3 of Regulation (EC) No 178/2002 as the natural or legal person responsible for ensuring that the requirements of food law are met within the food business under their control). The benefit is said to be a more accurate judgement of the risks involved, which is perceived to be essential when the Code necessitates the determination of a minimum inspection interval based on the risk rating given by the inspecting officer. Hence, the LA4 approach, in preference to what is seen as a less accurate “snapshot” from the inspection checklist approach advocated in the Code (which may or may not involve the FBO being present), considers that it is introducing positive changes in food hygiene practices, and as such, that positive changes will more likely be sustained over time.
These approaches have evolved over time, since policy changes take time to develop and take effect. The consensus among the senior practitioners who advised and gave regular feedback on the project from which the present study originated – all responsible for implementing food hygiene regulations in their respective authorities – is that the available data span covered the conception, inception, development, and hence divergence of the LA4 approach from the relatively homogeneous approach of the other three authorities. Accordingly, we cannot identify a clear division between some periods before and some periods after the introduction of the LA4 approach. Therefore, to investigate whether the LA4 approach gives rise to more compliant establishments, we compare the effects on establishment compliance of location in each authority (i) for each year from 2009–2010 to 2017–2018 relative to the baseline year 2008–2009 and (ii) for each year from 2013–2014 to 2017–2018 relative to the five-year baseline period 2008–2009 to 2012–2013. However, we then combine our measure of compliance with a measure of resource expended to create a joint measure of “compliance return,” which we propose as a more comprehensive measure of the efficacy of different regulator–regulatee interactions.
4 Methodology: Research Questions; the “Compliance Return” Construct; and Data
In this Section, we set out the components of our “compliance return” construct – i.e. the compliance level and the resource level – together with the data used to measure each component. On this platform, we address two research questions.
4.1 Research Questions
Our measure of the compliance level of each enterprise across the four authorities and in each year of the sample period enables us to address our first Research Question (RQ1):
“How does each authority differ in terms of compliance?” This will identify systematic differences in compliance level (if any) between the “compliance-to-support” approach of LA1, LA2, and LA3 and the “support to compliance” approach of LA4.
Next, we measure the resource level available to each authority in each year. We then combine our measure of the resource level with our measure of the compliance level to create a joint measure of “compliance return.” This enables us to address our second Research Question (RQ2):
“How are LA differences in resources expended related to compliance?” This will identify the terms of the trade-off (if any) between compliance levels and resource levels.
4.2 The Construct
We propose the “compliance return” construct to measure jointly (i) enterprise compliance (food hygiene and safety scores) and (ii) the resource inputs made available by each local authority to administer the system. Compared to a poorer performing “compliance return,” an improved “compliance return” can be achieved by either an improved compliance score or less administrative input.
The administrative cost to the regulator includes the level of monitoring required to verify the compliance of the business (e.g. number of inspections, time, and resources needed to investigate compliance) and the cost of enforcing non-compliance (e.g. improvement notifications, prosecution expenditure). We anticipate that deterrence would necessitate a stronger emphasis on detecting non-compliance and the collection of evidence to prove it, and the time and expense when prosecution is pursued, while cooperation would require the time and resources to create the conditions needed to avoid non-conformance in the first place (Oded, 2013; Rechtschaffen, 1998). Given the extent of these resource needs, it is often presumed, for the level of compliance being pursued, that the regulator has the necessary cognitive, computational, and administrative resources to secure compliance (Garrie & Keeler, 1993; Glachant et al., 2013; Russel et al., 1986). Yet, challenging the assumption that regulators have the resources to regulate, UK regulatory authorities, in line with other countries, have experienced an on-going downward pressure on their budgets (Regulating Futures Review, 2017). The resources of the regulator, we posit, are therefore critical to compliance no matter how the regulation is implemented. Moreover, the task is operationalized through street-level inspectors, as they are the main mode for delivering policy (Hill & Hupe, 2002; Lipsky, 1980; Meyers & Vorsanger, 2003). This also applies to compliance with food hygiene and safety standards, since this too depends on “street-level” inspections. Hence, in all four local authorities under investigation, food hygiene and safety officers are the key units of resource when comparing the resource requirements of different approaches to regulation.
Together, measures of compliance level (i.e., the food hygiene and safety score) and of the resource level (i.e., number of food hygiene and safety officers) provide a feasible and low-cost empirical platform for determining the overall “compliance return,” because both can be clearly defined and are readily available from a data acquisition perspective. We explain, in Section 5.2, the technical procedure for combining the different units of measurement of compliance and resources into a single composite “compliance return” measure.
4.3 Data
The available data enables us to measure both compliance outcomes and the corresponding resource inputs.
4.3.1 Compliance Outcomes
The data on food hygiene compliance comes from inspections by professionally qualified food safety officers. Inspections take place in accordance with national statutes and thus give rise to standardized data in electronic form. The data for all four authorities are collected, compiled, and curated in a common format and subject to rigorous checking – these data must meet statutory requirements – by the IT Department of LA3, who transferred the data set used in the present study to the authors. Storage and transmission of the data were electronic and thus not subject to the introduction of errors. Subsequent quality checks by the authors confirmed that there were no missing or outlying values.
The data made available for this study are the official records of the relevant population of inspections over a 10-year period (fiscal years between 2008–2009 and 2017–2018): i.e., all inspections of all inspected establishments in all four local authorities. The data available enabled us to investigate the food hygiene and safety rating scheme by providing the following variables: a unique establishment identifier (i.e., the same for each inspection during the whole sample period); the local authority carrying out the inspection; the date of inspection; the type of business; and the Overall Risk score. Although the number of variables is minimal, these data proved sufficient to implement the panel fixed effects strategy explained and implemented in Section 5. The data were provided in Microsoft Excel. Subsequent variable transformation and estimation were conducted in Stata 16 (such as creating a new variable to record the year of inspection and creating the dummy variables specified in our econometric model). Minimal data preparation to bring raw data into the form necessary for econometric analysis is consistent with an approach to evaluation that is relatively easy to implement and thus low cost.
To assess levels and changes in food hygiene and safety compliance, we use the “Overall Risk” score as the unit of analysis. The Overall Risk score is the total numerical score allocated to a food business establishment, following an inspection, and captures the factors that can be affected by the establishment itself: i.e., food hygiene and safety procedures; structure; and confidence in management. The Overall Risk score is continuous from 0 to 147, with the score decreasing as compliance improves (so a score of 147 is the worst possible score while 0 is the best possible score), and translates into the 0–5 public food hygiene rating described earlier. (In our sample [N = 26,285], per rating category [0–5] the mean Overall Risk scores [0–147, rounded] are 0/97 [n = 114]; 1/77 [n = 1,587]; 2/64 [n = 1,004]; 3/56 [n = 5,181]; 4/47 [n = 4,753]; and 5/37 [n = 13,646]. The correlation is near perfect (−0.9965), noting that the higher the better for the publicly available rating scale but the lower the better for the underlying Risk Score). Nationally, most establishments (90.2%) are rated at 3 or above, showing that compliance is generally satisfactory or better (Food Standards Agency, 2018). This is also a characteristic of our sample (89.7%). The Overall risk score is thus the measure with the highest informational content on the food hygiene and safety performance of the establishment and therefore is our preferred measure of the food hygiene and safety compliance of the establishment.
Our data on the Overall Risk score are complete for all four LAs throughout the sample period. In total, there are 11,294 establishments uniquely identified over time. The following are the percentages of the total number of inspections accounted for by the different categories of establishments subject to inspection: Distributors/Transporters (1.45%); Slaughterhouse (0.11%); Importers/Exporters (2.47%); Manufacturers and Packers (2.16%); Primary producers (0.21%); Restaurants and Caterers (72.74%); Retailers (21.42%); and Supermarket/Hypermarket (1.96%). The number of establishments by local authority was as follows: 948 in LA4; 1,786 in LA3; 1,591 in LA2; and 6,969 in LA1. The analysis of food hygiene and safety compliance involved 26,285 observations from individual inspections, with a maximum of six observations for any one establishment and a mean of 2.3 observations per establishment across all 11,294 establishments. As Appendix B shows, the observations were spread fairly evenly across local authorities and by year.
An important concern is that scoring differences between the four local authorities under consideration may reflect systematic differences in assessment and recording practices, even in the context of national regulations. If so, then the econometric estimates reported below to address our two Research Questions (Section 4.1) could be invalidated by confounding effects. For example, if inspectors adopting the “support to compliance” approach were inclined towards leniency then their food hygiene scores would fail to capture the true effect of the food hygiene approach. However, the following considerations suggest that there were no such variations in enforcement standards across the four authorities investigated in the present study.
Consistency of the food hygiene standards is sought through:
a common national methodology for rating food establishments;
minimum qualifications to become a food standards officer (e.g. Higher Certificate in Food Premises Inspection, Higher Certificate in Food Control, Advanced Professional Certificate in Food Hygiene and Standards Control);
continuing professional development of officers (e.g. Cannock Chase Council Food Safety Service Plan, 2016–2018);
liaison groups across local authorities (Newcastle Under Lyme Borough Council, 2014);
inter-authority audits (e.g. Audit of Food Hygiene Service Delivery Focussing on Service Organisation, Management, and Internal Monitoring Arrangements, London Borough of Bromley Council, Food Standards Agency, 2017) and, from 2016;
a national consistency exercise for England, Wales, and Northern Ireland (Food Standards Agency, 2016), involving a proportion of officers from all local authorities and revealing a high level of consistency.
Indeed, the UK Food Standards Agency (2015) has investigated just this issue, concluding that “management practices within local authorities may result in inconsistencies observed within the case study pairs.” However, our study is not based on statistically matched but otherwise unrelated “study pairs,” but on a group of local authorities in close geographical proximity that work closely together and share infrastructure (such as the IT system that enabled the data for the present article to be accessed in a form suitable for econometric analysis). Indeed, this report also concludes that “where present, the use of shared processes and policies to enforce food safety regulation has promoted regional consistency in the delivery of official controls between local authorities.” This characterizes the relationship between the four local authorities under investigation. To ensure assessment and recording practices, these neighbouring authorities undertook continuing professional development of officers and cooperated through formal liaison (indeed, the project from which the present study originates is an outcome of such cooperation). The close collaboration of the four LAs under investigation together with the audit trail outlined above suggests common and accurate recording practices and, hence, the validity of our compliance measure.
Fleetwood et al. (2019, p. 76), reporting research conducted by the Science Evidence and Research Division of the UK’s Food Standards Agency (Rahman et al., 2018), “demonstrates an association between the results of food hygiene inspections done by trained inspectors, using a rigorous and consistent procedure, with microbiological contamination of actual food samples taken from those premises.”[1] Fleetwood et al. (2019, p. 78) note:
To address potential consistency issues in the UK, the FSA undertakes national consistency exercises to keep variations to a minimum, and commissioned research looking at inspectors and whether their experiences or sequence of observations influenced scores. The research shows inspections are reasonably consistent, accurate, and robust.
Moreover, while noting that detecting public health benefits is “extremely complex,” Fleetwood et al. (2019, p. 83) estimate the positive impact of reducing foodborne illness by improving “compliance with food hygiene law”. However, from the evidence of a strong (and statistically significant) positive correlation between food hygiene ratings (the same metric as used in the present study) and independently measured microbiological contamination, we can infer the consistency of standards implied by standard protocols, requirements, and rigorous standards checked by national consistency exercises.
In contrast to corrupt practices reported from several cities in the USA, Fleetwood et al. (2019, p. 85) “found no evidence of bribery in the UK, where … initiatives evaluating reliability and consistency are in place.”
Finally, the evidence for consistency of standards is consistent with participant observations made by the researchers. Discussions in the advisory group that supported this research concerned different approaches to enforcement. However, senior representatives of all four local authorities accepted that the same standards were being applied even where the inspection processes vary between compliance-to-support and support-to-compliance approaches to enforcement.
According to these five considerations, including FSA-originated research addressing its own previous concerns regarding the consistency of standards, we conclude that the estimated compliance effects reported below reflect different approaches to enforcement rather than the potentially confounding effects of inconsistent standards.
4.3.2 Resource Inputs
LA3 also provided data from the respective personnel departments of the four LAs. This enabled the creation of a new variable to measure resource inputs: Resource – defined as the ratio of the number of available inspectors (full-time equivalents, henceforth FTE) to the number of inspections carried out by each local authority in each year (= FTE/Number of inspections).
Descriptive data by authority and year on the number of inspections and the available FTE are reported in Tables 1 and 2. The derived Resource variable is reported in Appendix C.
FTE numbers by Authority and Year
| 2008–2009 | 2009–2010 | 2010–2011 | 2011–2012 | 2012–2013 | 2013–2014 | 2014–2015 | 2015–2016 | 2016–2017 | 2017–2018 | |
|---|---|---|---|---|---|---|---|---|---|---|
| LA4 | 3.05 | 2.25 | 1.86 | 3 | 3 | 3 | 3 | 3 | 3 | 3 |
| LA3 | 4.5 | 4 | 4 | 4 | 4 | 4 | 4 | 4 | 4 | 4 |
| LA2 | 3.1 | 2.81 | 3.72 | 3.4 | 3.4 | 3.4 | 3.4 | 3.4 | 2.5 | 2.5 |
| LA1 | 7.5 | 7.5 | 7.5 | 7 | 6 | 5 | 5 | 4.6 | 4.6 | 4.6 |
Number of inspections by Authority and Year
| 2008–2009 | 2009–2010 | 2010–2011 | 2011–2012 | 2012–2013 | 2013–2014 | 2014–2015 | 2015–2016 | 2016–2017 | 2017–2018 | |
|---|---|---|---|---|---|---|---|---|---|---|
| LA4 | 90 | 355 | 265 | 334 | 426 | 248 | 184 | 501 | 311 | 372 |
| LA3 | 204 | 173 | 237 | 1,277 | 560 | 552 | 541 | 602 | 508 | 485 |
| LA2 | 219 | 224 | 370 | 547 | 1,139 | 668 | 673 | 691 | 663 | 819 |
| LA1 | 657 | 971 | 856 | 839 | 666 | 831 | 690 | 820 | 847 | 4,870 |
Salary data were not available throughout the sample period. However, standard professional qualifications and salary scales support the interpretation of our Resource variable as a proxy for cost.
5 “Compliance Return”: Empirical Application
First, we use econometric estimation to identify the compliance effects of each LA in each year relative to both a baseline year and a baseline period. Second, we combine our measure of compliance with our measure of resource input to obtain our empirical “compliance return” construct, which is the compliance output return per unit of resource input. Finally, we estimate the effects of each LA’s approach to implementation on “compliance return.”
5.1 Estimating Relative Compliance Effects: Model and Results
We gain some initial insight into the effects of the different approaches to compliance by comparing the mean Overall Risk scores for each local authority over the whole sample. The mean Overall Risk Score for all 26,285 observations is 46.21. Figure 1 displays the mean Overall Risk Score from all inspections undertaken by each local authority in each fiscal year (2008–2009 to 2017–2018). The horizontal red lines mark the mean for each authority over the sample period.
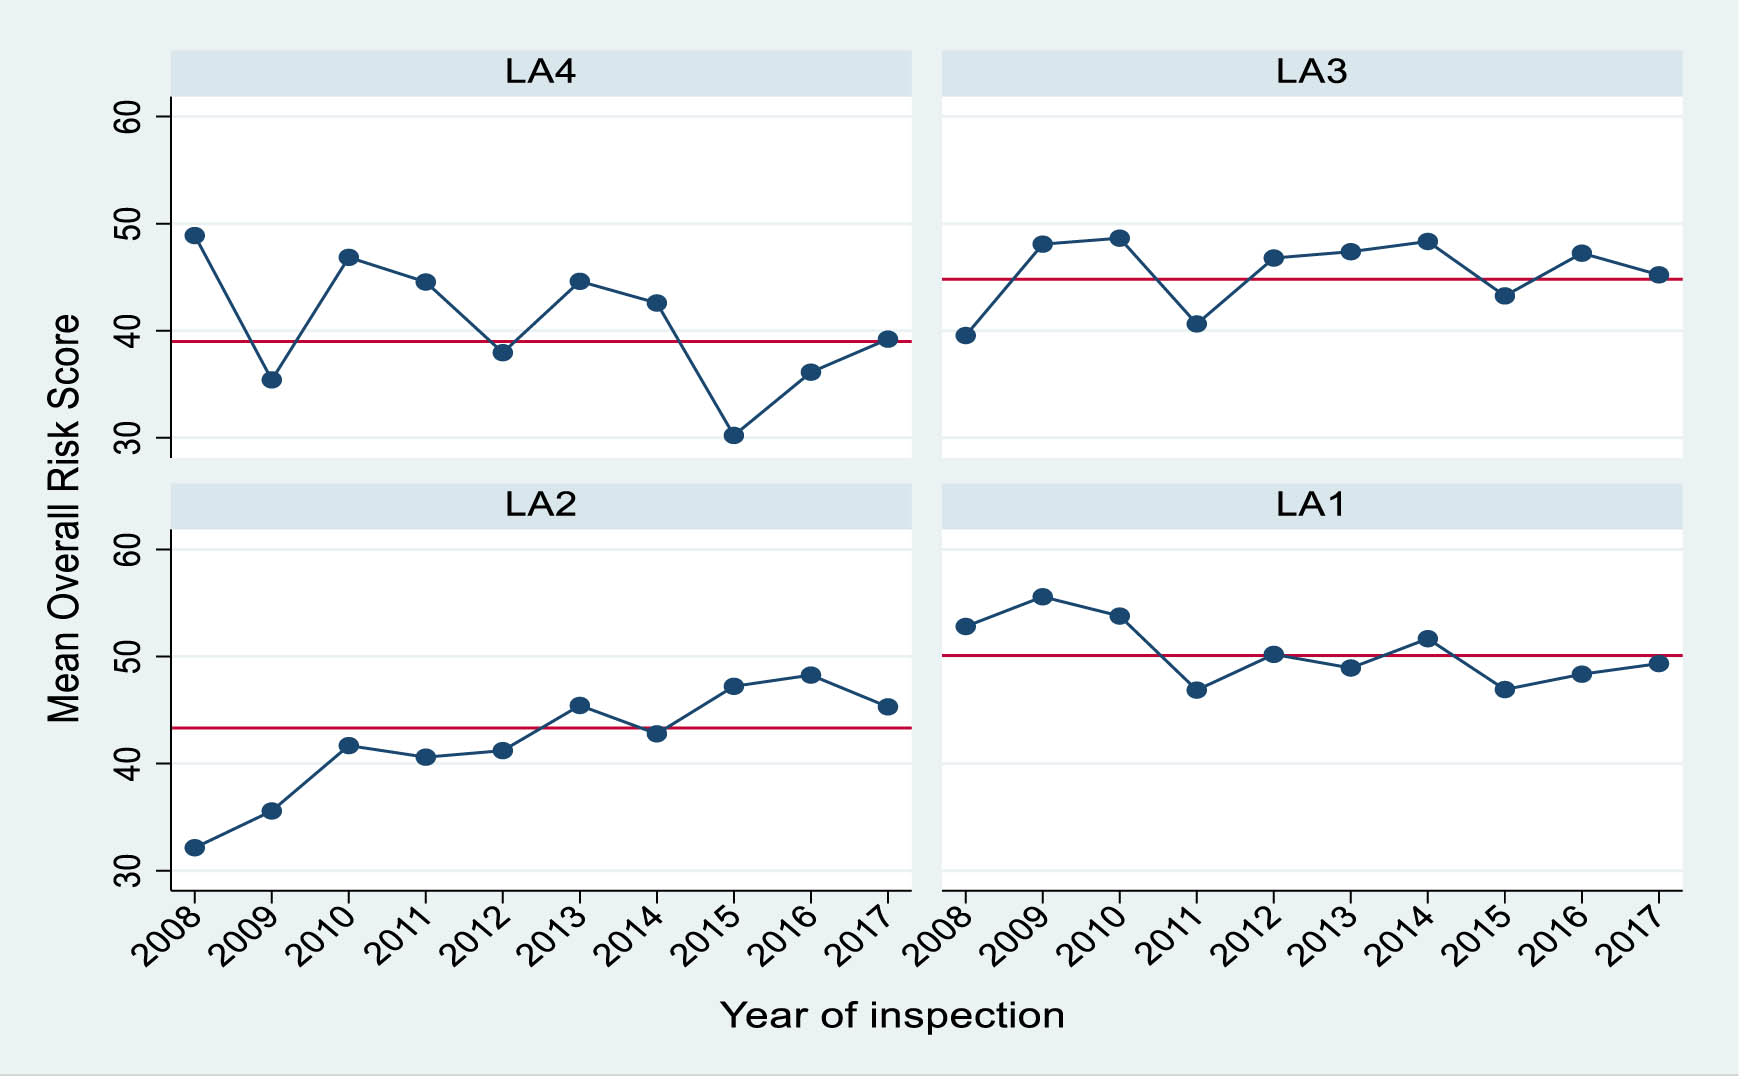
Mean Overall Risk Score by year (2008–2009 to 2017–2018) and local authority. Note: Horizontal red lines indicate the mean for each local authority over the sample period. The means are statistically different from each other.
The authority means over the whole sample period vary with high degrees of statistical significance: LA1 = 50.10 > LA3 = 44.81 > LA2 = 43.32 > LA4 = 38.98 (t-tests reject the null of equal means in each comparison with p = 0.0000). These unconditional (i.e., model-free) statistics suggest that establishments in LA4 typically display a higher level of compliance than do establishments in the other three LAs and are thus consistent with the suggestion that LA4’s support-to-compliance approach may outperform the compliance-to-support approach of the other authorities.
Next, we specify an econometric model to isolate and measure (i.e. to identify) the influence on establishment compliance of location in a particular authority in each year separately relative to the base year, 2008–2009. The estimated establishment compliance model (equation (1)) explains variation in Overall Risk scores (the dependent variable) by variations in the independent variables, where i = 1, …, 11,294 indexes the establishments and t = 2009–2010, …, 2017–2018 indexes the years in which inspections occurred (2008–2009 is omitted as the base year).
DVLA1 is a dummy variable (DV) (=1 for each inspection by LA1; = 0 for each inspection by another local authority) and
Although our data is rich in that it gives us the food hygiene scores from every inspection carried out in our four local authorities over a 10-year period, it includes only one directly observed variable that allows us to control directly for potentially time-varying effects (Restaurants and Caterers, as noted earlier). Accordingly, a potential limitation of our study is that we cannot control directly for other time-varying firm-level effects that might influence the risk score. However, while the literature identifies socio-economic differences between areas that might affect establishments’ food hygiene scores (Collins, 2015), these are unlikely to be substantially time-varying during our sample period and so – as noted above – are controlled by the fixed effects. In part, this is because the likelihood of substantial time variation is reduced when we consider that an average of only 2.3 inspections per establishment were carried out during the sample period. Yet, even to the extent that such influences may have changed incrementally during our sample period, the fixed effects still exercise their control function, because our firm-level fixed effects control not only for all firm-specific influences that are constant but also for firm-specific influences that are slowly moving (Beck, 2001; Plumper & Troeger, 2007).[2] Consequently, because the fixed effects are a component of the estimated part of the model, time-invariant and slowly moving influences otherwise omitted from the model do not enter the error term to become a source of endogeneity bias (in the case that such omitted influences were to be correlated with one or more variables in the estimated part of the model). Moreover, the literature does not empirically identify, or even suggest on theoretical grounds, influences on businesses’ food handling that might be strongly time-varying (let alone time-varying in just the systematic manner required to confound the estimated effects of our authority-year dummies). Finally, although there may have been changes in the policy and macroeconomic environment during the sample period that affected businesses across all four local authorities, which together constitute a geographically compact sub-region, such changes could not have been a source of systematic variations between establishments across the four local authorities. In the light of these considerations, we judge that specifying our model with establishment-level fixed effects to control for otherwise unmodelled time-invariant and slowly-moving influences brings us as close as possible – within the limitations of the available data – to an empirical strategy for estimating broadly indicative comparisons between different approaches to regulatory enforcement.
The complete estimated model is reported and interpreted in detail in Appendix A. Here, we focus on the estimates of interest, i.e.
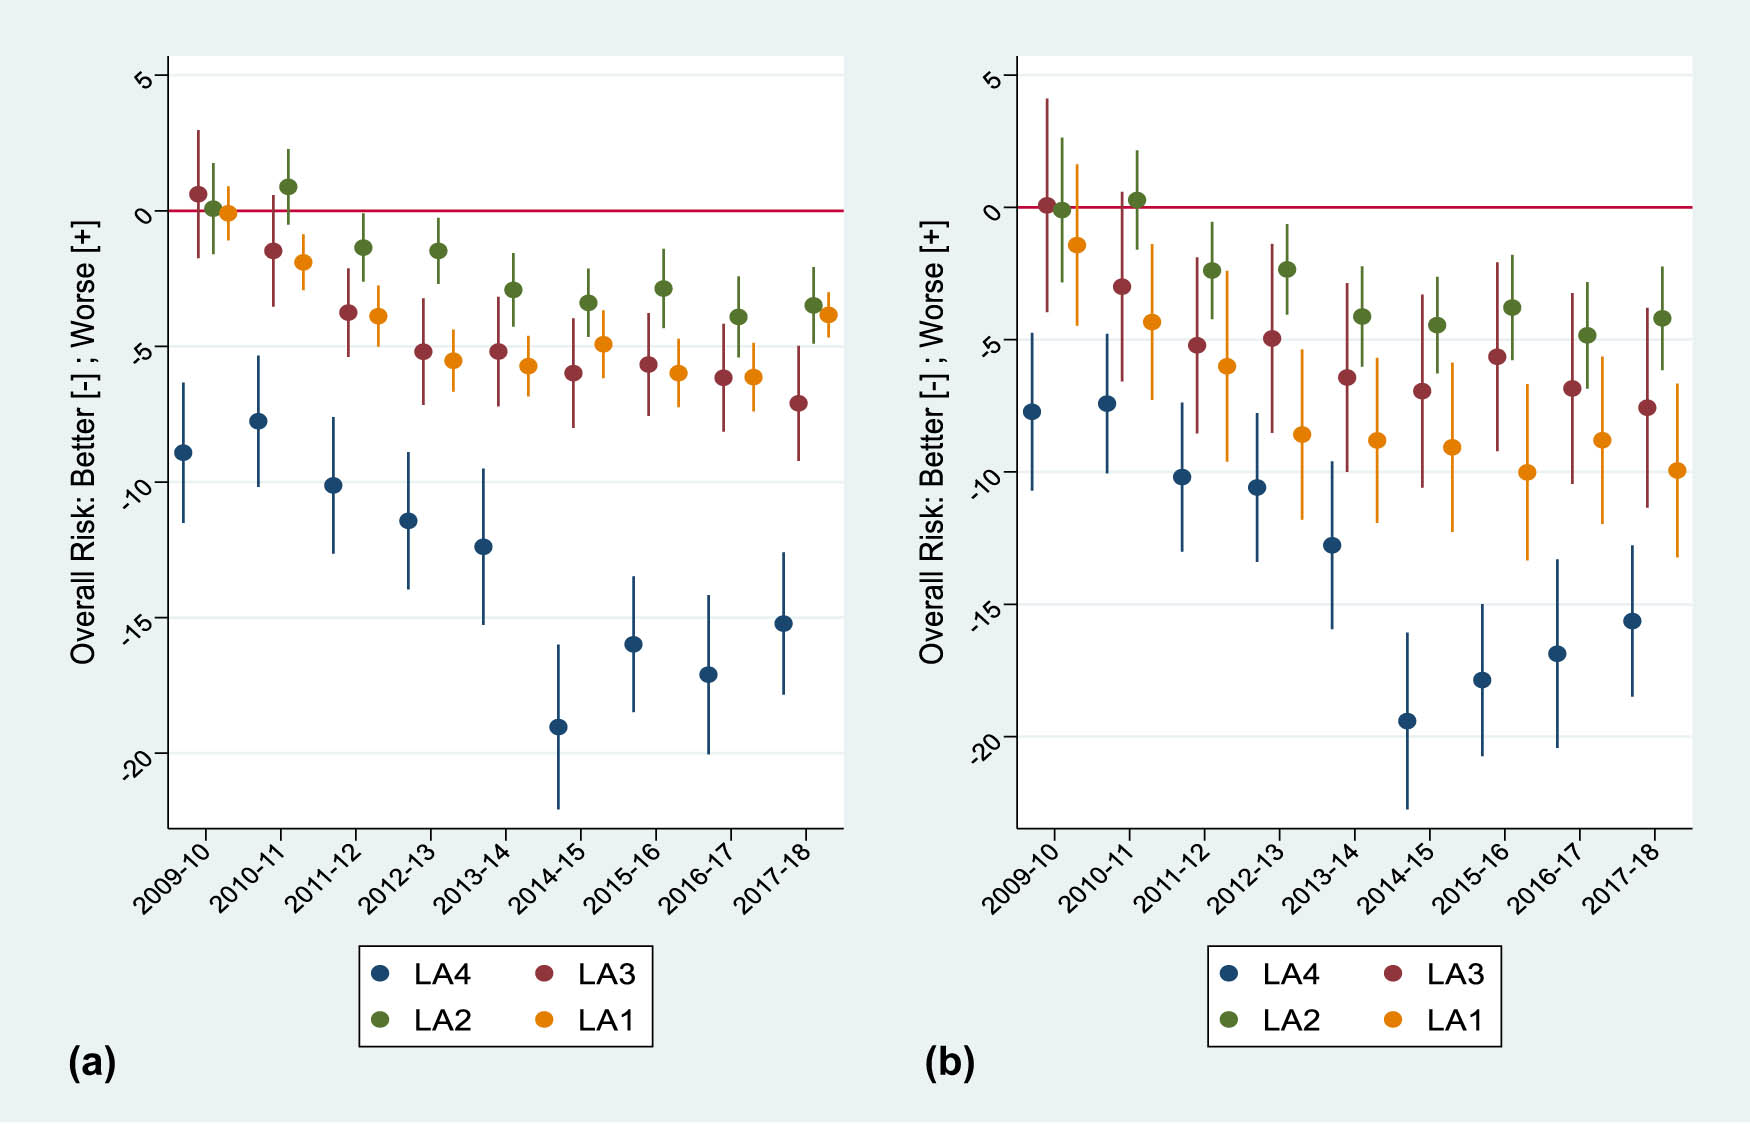
Food Hygiene and Safety Compliance by Local Authority – Changes in average Overall Risk score from 2009–2010 to 2017–2018 (each year’s estimate is relative to the base year of 2008–2009): (a) full sample (11,294 establishments; 26,285 observations); (b) establishments with five or six inspections (1,776 establishments; 8,951 observations). Source: Estimated fixed effects models. The Panel 2a model is reported and explained in full in Appendix A.
In most years, all four authorities record improved compliance. The reference line at zero indicates no change; negative values on the Y-axis show improvements; and conversely, positive values on the Y-axis show decreases in average compliance. The dots represent yearly changes in average overall risk score relative to the base year of 2008–2009, while the vertical bars running from the dots are 95% confidence intervals, which show the range within which we can be 95% sure that that the improvement is valid (i.e., not just a random fluctuation). The confidence intervals are calculated from the cluster-robust standard errors reported in Appendix A, Table A1. (Likewise for the results reported in Figures 2–4). When the confidence intervals touch or cross the zero reference line, the estimate is not regarded as statistically significant (i.e., not distinguishable from zero).
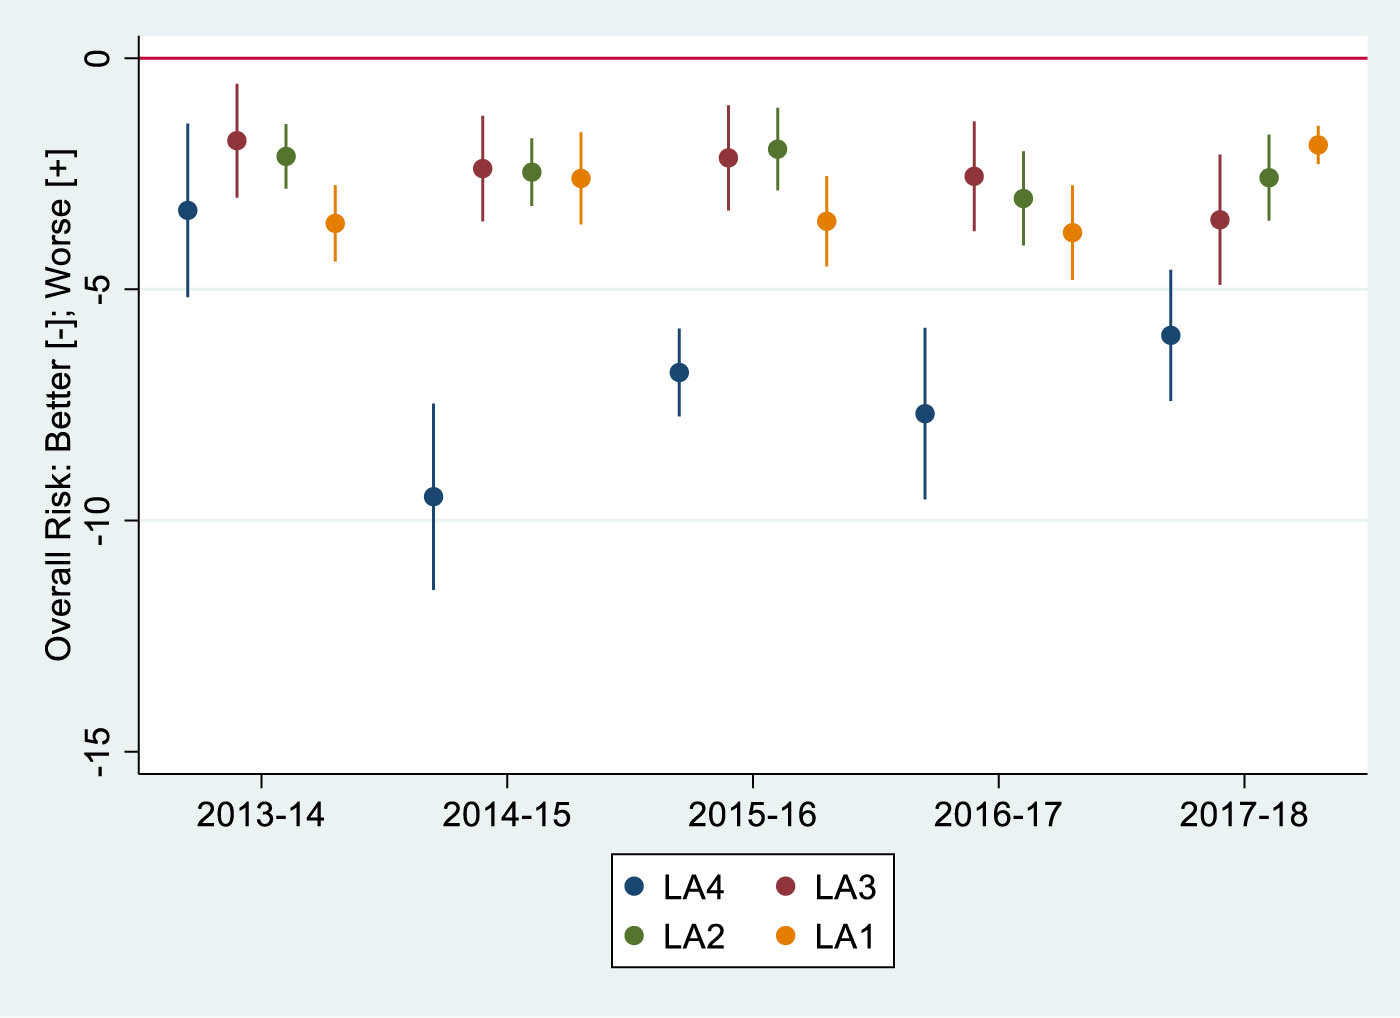
Food Hygiene and Safety Compliance by Local Authority – Changes in average Overall Risk score from 2013–2014 to 2017–2018 (each year’s estimate is relative to the base period from 2008–2009 to 2012–2013).
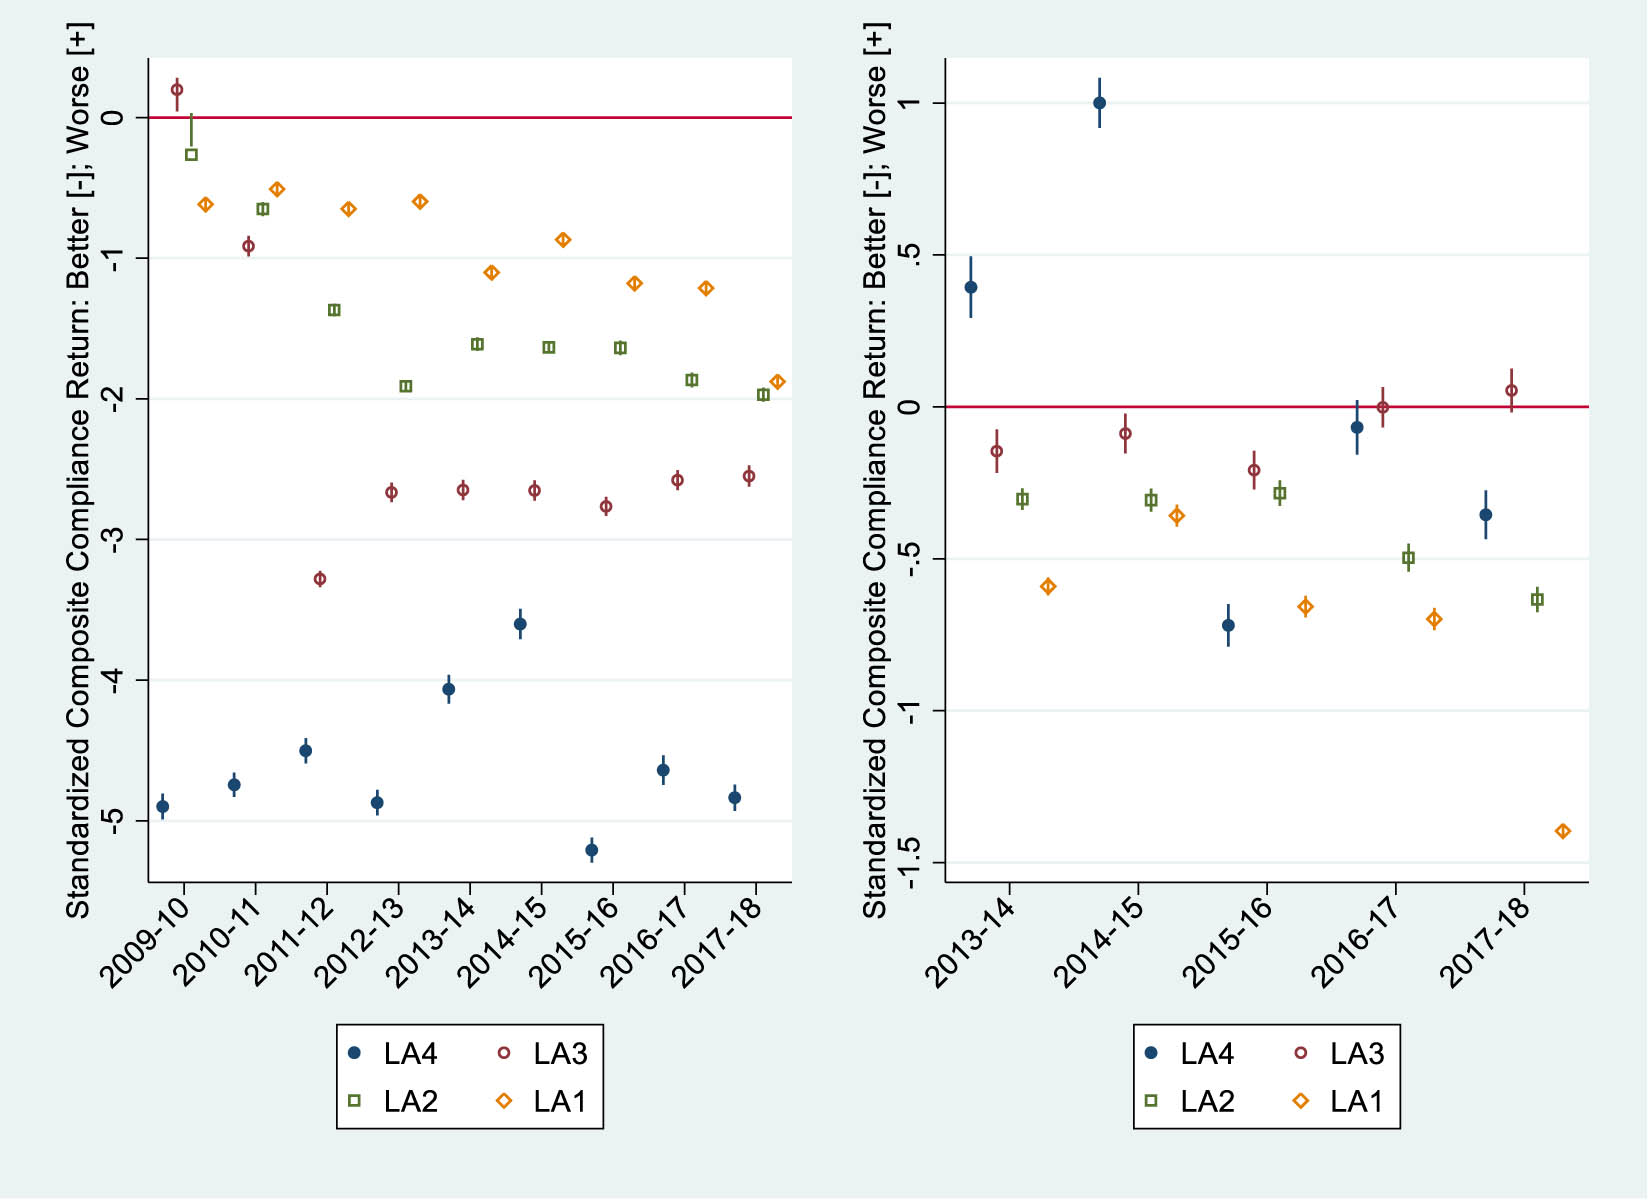
Local Authority Food Hygiene and Safety: Standardized Composite Compliance Return (Standardized Overall Risk score adjusted for Standardized Resources). (a) From 2009–2010 to 2017–2018 (relative to 2008–2009). (b) From 2013–2014 to 2017–2018 (relative to 2008–2009 to 2012–2013). Note: Bars within the hollow markers are confidence intervals, which reflect very precise estimation.
Each dot depicts one of the respective estimated coefficients
The Authority-Year effects reported in Figure 2a are not cumulative and can be scaled against the mean Overall Risk score (=46.21).
LA4 improved establishment compliance in all 9 years: in each year, the improvement in the Overall Risk score was substantial, being between −8.92 and −19.03 on the base year (i.e., between −19.3 and −41.2% of the mean Overall Risk score).
LA3 improved establishment compliance in 7 of the 9 years, with improvements between −3.75 and −7.10 on the base year (i.e., between −8.1 and −15.4% of the mean).
LA2 improved establishment compliance in 7 of the 9 years, although the improvement was less pronounced, being between −1.35 and −3.39 on the base year (i.e., between −3.0 and −8.5% of the mean).
LA1 improved establishment compliance in 8 of the 9 years, being between −1.90 and −6.13 on the base year (i.e. between −4.1 and −13.3% of the mean).
From these estimates, we conclude firstly that not only is the average level of compliance higher in LA4 than in the other three authorities (Figure 1) but that this effect is systematic, present in every year. While all four local authorities improved establishment compliance, LA4 achieved, in each year and by some margin, a greater improvement relative to the base year than did each of the other three local authorities. Whereas the upper bounds of the LA4 95% confidence bands are clearly separated (and thus statistically distinct) from the lower bounds for the other local authorities every year, the mainly overlapping confidence intervals between the LA1, LA2, and LA3 estimates show that with respect to improvements in compliance, these three authorities have more in common with each other than with LA4.
Together with the superior average compliance in LA4 (Figure 1), the persistence of greater compliance throughout the sample period (Figure 2) is evidence consistent with the greater effectiveness of LA4’s support-to-compliance approach in comparison with the compliance-to-support approach used by the other authorities. However, best practice considerations suggest that we should investigate the possibility that features of our data or model might be accounting for the effects – and their trajectories – presented in Figure 2a. Accordingly, we investigate the robustness of these findings with respect to two potential sources of bias.
The widely varying number of inspections per establishment could be a source of bias.
Time-series comparisons – especially over short periods – are notoriously sensitive to initial conditions. Figure 1 shows a markedly worse mean Overall Risk Score for LA4 at the beginning of the sample period, which raises the possibility that subsequently, superior compliance reflects only a poor starting position.
In the whole sample used so far, the average number of inspections is 2.3, ranging between one and six (Appendix A). Accordingly, a concern is that our estimates may be averaging across establishments with relatively few and establishments with relatively many inspections that potentially could react differently to one or both approaches to enforcement. To investigate this source of potential heterogeneity, we estimate our model on a sample comprising only those establishments with five or six inspections, respectively, accounting for 8,525 and 426 observations (together a little over one-third of the whole sample), which gives sufficient cross-section breadth and time-series depth for comparison with the population results so far reported. For individual local authorities, the percentage reductions in the number of establishments and observations available for estimation are LA1 – by 96% and 89%, respectively; LA2 – 52 and 36%; LA3 – 76 and 57%; and LA4 by 68 and 49%. Comparison of Figure 2b (reduced sample) with 2a (full sample) shows that, while not identical, the overall pattern of estimates is robust to large changes in the number of establishments and observations. First, in each year, the point estimates for LA4 continue to be much the same size and lower than for the other three authorities. The upper bounds of the LA4 95 per cent confidence bands are clearly separated (and thus statistically distinct) from the lower bounds for the other LAs in four from nine years (and borderline in another) compared to lower in every year. This less clear separation of LA4 from the other three authorities reflects (i) lower estimates for LA1, conditioned by the most extreme reduction in sample size, and (ii) a consequently smaller sample resulting in less precise estimates (i.e. wider confidence bands). (In the reduced sample, the number of establishments and observations for each authority are: LA1 – 270 and 1,350; LA2 – 762 and 3,841; LA3 – 436 and 2,195; and LA4 – 308 and 1,565.) Nonetheless, while the LA1 estimates are lower in the reduced sample, overlapping confidence intervals between the LA1, LA2, and LA3 estimates continue to show that with respect to improvements in compliance, these three authorities have more in common with each other than with LA4. Accordingly, we continue our analysis using the whole sample.
To check robustness with respect to the baseline, we estimate our model on the full sample. However, instead of estimating our authority-year variables relative to a single year (2008–2009), we estimate our variables of interest relative to the five-year period from 2008–2009 to 2012–2013. The full model is available on request. The estimates of interest are displayed graphically in Figure 3.
Qualitatively, the results are similar to those estimated relative to the single baseline year, 2008–2009: in each year, the LA1, LA2, and LA3 estimates are not statistically different from each other, whereas four from five LA4 estimates show statistically greater improvements (three with clear and one with borderline statistical significance). Quantitatively, however, the range of improvements is reduced from between −8.92 and −19.03% on the base year 2008–2009 to between −3.29 and −9.48% (i.e., between −7.2 and −20.5% of the sample mean). If we extend the base period to the first 6 years, the improvements range between −5.44 and −9.01%. In round terms, diluting the effect of early years with higher (worse) Overall Risk Scores reduces LA4’s outperformance by about a half.
5.2 Resource Input and the Measurement of Compliance Return
So far, we have investigated variations in compliance associated with different approaches followed by the four local authorities. We have presented evidence that (i) LA4’s “support-to-compliance” approach is more effective in achieving compliance than the “compliance-to-support” approach used by the other authorities, and (ii) this outperformance is not an artefact of data limitations or the choice of baseline. In this section, we investigate the influence of differing levels of resource input on differing levels of compliance achieved by the four LAs.
This part of the investigation proceeds in two stages: first, we construct our measure of “compliance return” to capture the combined effect of Overall Risk Score (our compliance output variable) and Resource (our resource input variable); second, we use this joint measure as a new dependent variable in our econometric model (equation (1)).
Stage 1.
Step 1. The values of our compliance variable – Overall Risk Score – are transformed into z scores: z_Overall Risk.
Step 2. The values of our Resource variable (Section 4.3.2) are likewise transformed into z scores: z_Resource.
Step 3. Overall Risk Score and Resource are measured in different units. However, once standardized by z transformation, we can follow Chignell et al. (2015) to create a composite performance measure by summation of the respective z scores:
Subscripts i and t – as in equation (1) – indicate that Compliance Return and z_Overall Risk vary by establishment and year, whereas z_Resource varies by the local authority (subscript a = LA1, LA2, LA3, and LA4) and year. Compliance Return is interpreted in the same manner as z_Overall Risk, which enters with a positive sign so that higher (lower) values are registered as worse (better) Compliance Return. In Section 4.3.2, we defined our Resource variable as Number of inspectors (FTE)/Number of inspections. Hence, for consistency, z_Resource is also entered positively in equation (2), as (i) more FTE per inspection means greater resource for a given Overall Risk score, so reduced efficiency and a higher (i.e. worse) Compliance Return score, while (ii) more inspections for a given FTE count increases efficiency and thus lowers (i.e. improves) the Compliance Return score. Weighting allows greater or less influence to be attributed to the two components. However, departing from equally weighted components (both 0.5) must be guided by “a comprehensive set of research findings” (Chignell et al., 2015, p. 38), which do not exist in the present case and go beyond the scope of the present study.
Step 4. Compliance Return is also transformed into a z variable, according to the following formula (The method is clearly set out at: https://stats.stackexchange.com/questions/348192/combining-z-scores-by-weighted-average-sanity-check-please). Equation (3) is an approximation, because it assumes that the component z scores are independent. However, the correlation is very small (−0.0230) and so makes no practical difference to the calculation. The resulting composite measure is standard normal distributed with mean zero (−5.93 × 10⁻¹⁰) and standard deviation very close to one (0.988).
where
Stage 2.
The standardized Compliance Return variable (
The message of Figure 4 is that the systematically greater compliance achieved by LA4 (Figures 2 and 3) comes at a cost. Although Figure 4a indicates superior performance from LA4, this reflects a very high (i.e. worse) z_Compliance Return value in the base year (Appendix C, Table A3), which, in turn, is driven by a very low number of inspections in 2008–2009 (Table 2): the Resource variable = Number of inspectors/Number of Inspections (Section 4.3.2) and Compliance Return is a weighted average of the Overall Risk score and Resource, so that a low level of inspections conducted by a particular authority in a given year means fewer inspections per inspector – i.e. reduced efficiency – and, in turn, an increase in the Resource variable and an increase in our Compliance Return construct (through equation (2)), which means reduced compliance return. Accordingly, we regard Figure 4b as presenting the more reliable estimates, as these measure performance effects relative to a five-year base period in which the disproportionate effect from 2008–2009 is substantially diluted.
6 Discussion
In equation (3), our procedure of applying equal weights to compliance (z_Overall Risk) and resources (z_Resource) in calculating our composite performance measure (z_Compliance Return) is sufficient to transform the typically greater establishment compliance in LA4 (Figures 2 and 3) into “compliance return” measures – accounting for both compliance output and resource input – that are either no better or substantially worse than those estimated for the other authorities (Figure 4b). Conversely, the performance estimates now flatter LA1, which typically had a lower-than-average ratio of inspectors (FTE) to the number of inspections, although the apparently outlying performance in 2017–2018 is driven by an outlying number of inspections in that year (Tables 1 and 2; Appendix C). Of course, different comparisons could be obtained by imposing different weights: weighting Resource at zero gives a “compliance return” measure reflecting only compliance (the Overall Risk score reported in Figures 2(a), (b) and 3), which suggests outperformance by LA4’s support to compliance approach; conversely, increasing the weight of Resource yields “compliance return” measures that increasingly temper the benefits from compliance by taking into account the resource implications (Figure 4), which casts the compliance to support approach of the other three LAs in a more favourable light. Compared to LA1, LA2, and LA3, LA4 was able to significantly improve establishment compliance using a support-to-compliance approach but only on the basis of a stable FTE that was relatively high in relation to the number of inspections (Tables 1 and 2; Appendix C). Conversely, the compliance-to-support approach combines lower levels of improved compliance with lower costs.
In effect, we have introduced an apparatus for exploring the implications of different assumptions regarding, for example, the respective claims of the public health benefits of increased compliance and the costs of delivery. However, the theoretical and empirical – not to mention political – justification of different weighting schemes is beyond the scope of this paper. Here, it is sufficient to note that, once we look past the distorting influence of the base year, these estimates confirm that the benefits of greater compliance from the LA4 approach come at the cost of greater resources.
7 Policy Implications and Conclusions
This study is designed to support practitioner debate and decision-making by evaluating the associations between implementation approaches, establishment compliance, and resource implications. To this end, we analysed a large set of data on food hygiene and safety inspections carried out by four UK local authorities in close geographical proximity, over a 10-year period, to estimate the relative effects of different approaches to implementation on the “compliance return.” We introduced the construct of “compliance return” to embrace two elements: (i) compliance effects; and (ii) resource implications. Evaluation of the relative efficacy of different approaches to regulation through the lens of “compliance return” does not provide a comprehensive cost-benefit analysis but is both more comprehensive than a focus on either compliance or resources in isolation and – above all – feasible within the limitations of the available data. Data on compliance and corresponding resource requirements are available internally, although, of course, measured in different units. On this platform, we advance a methodology to combine these components into a single compound measure of “compliance return,” which is a construct or tool for (i) gaining insight into the trade-off between compliance and cost and (ii) taking account of this trade-off in evaluating regulatory regimes where there is a choice between more resource-intensive cooperative approaches and less resource-intensive approaches emphasizing deterrence. As such, this low-cost approach to evaluation could be applied elsewhere by practitioners in food safety regulation and, possibly, in other regulated activities.
The evidence from our empirical investigation addresses our two research questions. RQ1 asked: “How does each authority differ in terms of compliance?” Fixed effects econometric analysis of our compliance variable (Overall Risk score) indicated that while all four local authorities were able to improve food hygiene and safety compliance at establishments in their district, LA4 stimulated the most improvement. This suggests that with respect to compliance considered in isolation (measured by inspectors’ Overall Risk scores), support-to-compliance is more efficacious than compliance-to-support. Neither of these approaches is at the extremes of the continuum from deterrence to cooperation but, rather, are variant hybrid forms. So, in this case, at least, the evidence suggests that even moderate changes in the approach to regulation can have substantial effects on compliance outcomes. Yet, in forming judgements regarding the respective efficacy of the four LAs and, in particular, the respective merits of support-to-compliance and compliance-to-support, we need to consider RQ2: “How are LA differences in resources expended related to compliance?” RQ2 is addressed by translating our “compliance return” construct into an empirical measure to take account of both compliance outcomes and resource inputs. This “compliance return” measure is then used as the dependent variable in our econometric model to identify the effects of each local authority in each year of the sample. Focusing on the alternative approaches, support-to-compliance requires more FTE resources per inspection than does compliance-to-support. Econometric analysis enables the terms of this trade-off to be identified across regulatory authorities and over time. The estimates reported in the present study show that down weighting the importance of resource inputs favours the support-to-compliance approach (greater emphasis on cooperation), while increasing the weighting of resource inputs can present the compliance-to-support approach (greater emphasis on deterrence) in an increasingly favourable light. Of course, once armed with this information the choice for policy-makers between different regulatory approaches is politically delicate, since cost constraints must be balanced against the health of the population.
The evaluation methodology advanced in this article may be useful whenever the benefits of compliance must be considered within the constraints of cost. It is a low-cost methodology, because it is implemented using only data already available. The technical requirements are minimal, such that the template provided in this study could easily be implemented either in-house or with help from a local university. Regarding practical implementation, we recommend – as demonstrated in this article – attention to robustness checks, in particular, the need to ensure that results do not simply reflect the choice of the baseline period. Finally, the methodology should also prove easy to adapt and improve, depending on local requirements and data availability.
For public policy at the LA level, our findings suggest that different approaches to implementation, occupying – in our case – hybrid positions along the continuum from deterrence to cooperation, can be judged differently depending on whether policy-makers consider (i) compliance alone or (ii) compliance jointly with resource implications. The method of investigation advanced in this study can provide quantitative information to inform choices between different approaches.
Our methodology and results can also inform key national bodies, which in the UK include the Office for Product Safety and Standards and the Local Authority Regulatory Services Excellence Framework, which stipulates that practices should be shared to inform and improve delivery. This study could also inform the “Regulating our Future” agenda of the UK Food Standards Agency and their plans for reforming food industry regulation (e.g. plans around a permit to trade, segmentation based on risk, and private assurance schemes to alleviate pressure on local authority resources).
We propose our “compliance return” construct as a low-cost approach to evaluating the relative effectiveness of different approaches to implementing food hygiene regulations. Whereas full cost-benefit analysis is likely to be ruled out on grounds of cost and feasibility alike, the Compliance Return approach can be implemented using existing data, hence at minimal cost. The data required are inspection results and personnel details, while analysis can be completed either in-house or with a minimum of external help. However, policymakers should be aware that the use of existing data also involves limitations. In the case of the present study, the record of inspections does not include data that would, for example, (i) enable analysis of potential gender effects – among owners, managers, or employees of inspected businesses – on compliance, or (ii) take account of the economic impact on the business of securing compliance, the importance of which was highlighted by Antle (1999) and Traill and Koenig (2010). Unfortunately, the desirability of additional data to inform a richer and more complex analysis of “compliance return” conflicts with the requirement of feasibility. Extending food hygiene inspections to incorporate wider business intelligence data – e.g. concerning owners, managers and employees, the number of full- and part-time employees, turnover, and so on – would enable the benefit of a more rounded and complex analysis but only at the cost of more intrusive and time-consuming inspections. For policy-makers wanting to evaluate the “compliance return” of different approaches to implementation, we propose the approach outlined in this article as a practical compromise.
Regarding the applicability of our Compliance Return approach beyond the implementation of food hygiene regulations in a single English region, we conclude that our approach may have external validity in regulatory fields where (i) full cost–benefit analysis is not feasible, (ii) there is some discretion – and thus some variation – regarding implementation, especially at the local level, and (iii) consistent records of inspection results are maintained across implementing authorities. In this article, we do not attempt to identify such regulatory fields. Nonetheless, we have attempted to provide sufficient detail about the context and implementation of our approach to enable readers to make informed judgements as to the applicability of our evaluation methodology to their own circumstances.
Finally, researchers adopting and/or adapting the approach to evaluation proposed in this article should be aware of two potential limitations.
A potential threat to the validity of any evaluation of different approaches to regulatory enforcement used by different enforcement authorities is the possibility that different standards are applied. In this case, any empirical strategy may detect variations in leniency/severity rather than true effects.
An advantage of our fixed effects approach to estimating the effects of different approaches to regulatory enforcement is that it is applicable to existing data sets, requires minimal data preparation, and hence may be implemented at low cost. Yet, because existing data sets are likely to be limited with respect to the availability of control variables, a corresponding disadvantage is a potential bias in the case that strongly and systematically time-varying influences on the dependent variable were to be omitted from the econometric model.
In the case of the present study, we have explained our judgement that these limitations are not a substantial influence on the results reported. Yet these possible sources of bias should always be considered.
Acknowledgements
Financial support was provided by the Stoke-on-Trent and Staffordshire Local Enterprise Partnership and Staffordshire University. The participating local authorities also provided significant support in kind. Special thanks are owed to the members of the Steering Group, whose support made the analysis possible. However, any shortcomings are the sole responsibility of the authors.
-
Funding information: Financial support was provided by the Stoke-on-Trent and Staffordshire Local Enterprise Partnership and Staffordshire University. The participating local authorities also provided significant support in kind. Special thanks are owed to the members of the Steering Group, whose support made the analysis possible. However, any shortcomings are the sole responsibility of the authors.
-
Author contributions: All authors accepted the responsibility for the content of the manuscript and consented to its submission, reviewed all the results, and approved the final version of the manuscript. DW: conceptualization (primary role); investigation; Methodology (secondary role); writing – original draft; writing – review & editing; visualization; supervision; project administration; funding acquisition. GP: conceptualization (secondary role); investigation; methodology (primary role); formal analysis (primary role); validation; data curation; writing – original draft; writing – review & editing; visualization; supervision; project administration. MA: conceptualization (secondary role); validation; formal analysis (secondary role); investigation; writing – review & editing; visualization; project administration. According to the “percent-contribution-indicated” (PCI) approach, the respective authorial contributions are – in descending order – 42.5, 42.5, and 15%.
-
Conflict of interest: Authors state no conflict of interest.
-
Data availability statement: The data set, in anonymized form, generated during and/or analysed during the current study is available from the corresponding author on reasonable request. Upon publication, the data will be made available online together with the Stata syntax used to estimate the models and generate the graphical displays of results reported in this article.
-
Article note: As part of the open assessment, reviews and the original submission are available as supplementary files on our website.
Source of Figure 2a: Econometric model estimating food hygiene and safety compliance
The estimated model reported in Table A1 explains variation in “Overall Risk” scores (the dependent variable) by variations in the variables of interest (the explanatory or independent variables): Inspection-Authority effects in each year (our main variables of interest) and the Business Category (although only one category – “Restaurants and Caterers” – varies over time and can thus be included in the model).
In Table A1, the Inspection-Authority effects in each year are captured by the estimated effects of the following authority-year dummy variables:
DV_LA4_09_10 is a dummy (binary) variable defined as one for all observations on inspections undertaken by LA4 in the year 2009–2010 and as zero for all other observations. Similar dummy variables are defined for all observations on inspections undertaken by LA4 in each subsequent year in the dataset: i.e., DV_LA4_10_11 … DV_LA4_17_18.
Similar sets of dummy variables for each of the remaining three local authorities: LA3 (DV_LA3_09_10 … DV_LA3_17_18); LA2 (DV_LA2_09_10 … DV_LA2_17_18); and LA1 (DV_LA1_09_10 … DV_LA1_17_18).
The model reported in Table A1 also includes a business category dummy variable of all food handling establishments in the “Restaurants and Caterers” category (new_6 = 1; = 0 for all inspections of establishments in other business categories).
The model includes a “fixed effect” for each establishment, which controls for all constant (or slowly moving) but unobserved characteristics of the establishment. In our model, although the local authority effects are time invariant and thus absorbed by the fixed effects, we interact them with year effects to create time-varying local authority effects that are consistent with fixed effects estimation. Hence, regarding the specification of our fixed effects model, separate sets of local authority and year dummies cannot be included, because the local authority dummies are fully absorbed by the fixed effects, and the year dummies are absorbed by the authority-year dummies, which are our variables of interest. Local authority dummies – with the omission of one as the base category – can be included in a random effects model; however, the Hausman test unambiguously rejects random effects estimation in favour of fixed effects estimation (p = 0.0000).
The results from estimating the model reported in Table A1 tell us that the variables of interest explain 6.6% of the variation in establishments’ Overall Risk scores over time (R-square within). However, the model also accounts for variation in establishments’ Overall Risk scores by taking into account (controlling for):
establishment-level fixed effects (sigma_u), which account for 85% of the variation in Overall Risk ratings that is not explained by the Authority-Year effects and the Business Category effect; and
purely random events at the observation level affecting scores (sigma_e), which account for 15% of the variation in Overall Risk ratings that is not explained by the variables of interest.
Of the variables of interest, holding all other influences constant, “Restaurants and caterers” (new_6) on average have worse (i.e., higher) Overall Risk ratings than all other categories by 27.71 points (almost 60% of the mean of 46.21).
Finally, we interpret the estimated Authority-Year effects on the Overall Risk ratings. These effects are estimated by Authority for each Authority-Year relative to its own performance in the base year 2008–2009 (+ve indicates deterioration; −ve indicates improvement). These Authority-Year effects are interpreted as follows.
LA4 effects:
All 9 ≠ 0 (all statistically significant at the 1% level)
Substantial improvements of the Overall Risk score of between −8.92 and −19.03
LA3 effects:
7 from 9 ≠ 0 (statistically significant at the 1% level)
Small statistically significant improvements of between −3.75 and −7.10
LA2 effects:
7 from 9 ≠ 0 (statistically significant at the 1 or 5% level)
Small statistically significant improvements of between −1.35 and −3.39
LA1 effects:
8 from 9 ≠ 0 (statistically significant at the 1% level)
Small statistically significant improvements of between −1.90 and −6.13
These are the Authority-Year effects depicted graphically in Figure 2a.
Food Hygiene and Safety Compliance by Local Authority: Changes in average Overall Risk score from 2009–2010 to 2017–2018 (each year s estimate is relative to the base year of 2008–2009) (fixed efects estimation with cluster-robust standard errors)*
| Dependent variable: Overall_Risk | |
|---|---|
| Number of observations: 26,285 | Observations per group: |
| Number of groups (establishments): 11,294 | Minimum = 1 |
| Average = 2.3 | |
| Maximum = 6 | |
| R-squared: | |
| Within = 0.0656 | |
| Between = 0.0723 | |
| Overall = 0.0664 | |
| Independent variables | ||
|---|---|---|
| LA4 effects: Authority-year dummies | ||
| DV_LA4_09_10 | −8.919 | *** |
| (1.319) | ||
| DV_LA4_10_11 | −7.757 | *** |
| (1.234) | ||
| DV_LA4_11_12 | −10.124 | *** |
| (1.282) | ||
| DV_LA4_12_13 | −11.431 | *** |
| (1.290) | ||
| DV_LA4_13_14 | −12.387 | *** |
| (1.470) | ||
| DV_LA4_14_15 | −19.033 | *** |
| (1.550) | ||
| DV_LA4_15_16 | −15.983 | *** |
| (1.276) | ||
| DV_LA4_16_17 | −17.101 | *** |
| (1.497) | ||
| DV_LA4_17_18 | −15.220 | *** |
| (1.338) | ||
| LA3 effects: Authority-year dummies | ||
| DV_LA3_09_10 | 0.612 | |
| (1.203) | ||
| DV_LA3_10_11 | −1.478 | |
| (1.047) | ||
| DV_LA3_11_12 | −3.752 | *** |
| (0.832) | ||
| DV_LA3_12_13 | −5.195 | *** |
| (1.003) | ||
| DV_LA3_13_14 | −5.188 | *** |
| (1.029) | ||
| DV_LA3_14_15 | −5.986 | *** |
| (1.030) | ||
| DV_LA3_15_16 | −5.669 | *** |
| (0.967) | ||
| DV_LA3_16_17 | −6.156 | *** |
| (1.013) | ||
| DV_LA3_17_18 | −7.096 | *** |
| (1.081) | ||
| LA2 effects: Authority-year dummies | ||
| DV_LA2_09_10 | 0.079 | |
| (0.855) | ||
| DV_LA2_10_11 | 0.884 | |
| (0.711) | ||
| DV_LA2_11_12 | −1.357 | ** |
| (0.642) | ||
| DV_LA2_12_13 | −1.478 | ** |
| (0.622) | ||
| DV_LA2_13_14 | −2.917 | *** |
| (0.693) | ||
| DV_LA2_14_15 | −3.393 | *** |
| (0.641) | ||
| DV_LA2_15_16 | −2.866 | *** |
| (0.744) | ||
| DV_LA2_16_17 | −3.911 | *** |
| (0.764) | ||
| DV_LA2_17_18 | −3.486 | *** |
| (0.720) | ||
| LA1 effects: Authority-year dummies | ||
| DV_LA1_09_10 | −0.092 | |
| (0.507) | ||
| DV_LA1_10_11 | −1.900 | *** |
| (0.524) | ||
| DV_LA1_11_12 | −3.885 | *** |
| (0.573) | ||
| DV_LA1_12_13 | −5.527 | *** |
| (0.582) | ||
| DV_LA1_13_14 | −5.726 | *** |
| (0.569) | ||
| DV_LA1_14_15 | −4.919 | *** |
| (0.637) | ||
| DV_LA1_15_16 | −5.985 | *** |
| (0.641) | ||
| DV_LA1_16_17 | −6.132 | *** |
| (0.645) | ||
| DV_LA1_17_18 | −3.837 | *** |
| (0.424) | ||
| new_6: Restaurants and caterers | 27.711 | *** |
| (0.697) | ||
| Intercept | 30.708 | *** |
| (0.610) | ||
| sigma_u (panel level: group-specific fixed effects) | 20.421 | |
| sigma_e (observation level: purely random effects on each establishment in each period) | 8.744 | |
| Rho (fraction of variance due to sigma_u) | 0.845 | |
Fixed-effects (within-group) regression: Cluster-robust standard errors in parentheses; Group variable is Business_ID_num, the unique identifier for each establishment; ***p-value ≤ 0.01, **p-value ≤ 0.05, *p-value ≤ 0.1.
Stata syntax: xtreg Overall_Risk DV_LA4_09_10-DV_LA4_17_18 DV_LA3_09_10-DV_LA3_17_18 DV_LA2_09_10-DV_LA2_17_18 DV_LA1_09_10-DV_LA1_17_18 new_6, fe vce (cluster Business_ID_num).
Appendix B
Descriptive statistics for the sample used to estimate the model reported in Table A1
| Variable | Mean | Standard deviation | Minimum | Maximum |
|---|---|---|---|---|
| Overall_Risk | 46.2068 | 19.8737 | 0 | 147 |
| DV_LA4_09_10 | 0.0135 | 0.1154 | 0 | 1 |
| DV_LA4_10_11 | 0.0101 | 0.0999 | 0 | 1 |
| DV_LA4_11_12 | 0.0127 | 0.1120 | 0 | 1 |
| DV_LA4_12_13 | 0.0162 | 0.1263 | 0 | 1 |
| DV_LA4_13_14 | 0.0094 | 0.0967 | 0 | 1 |
| DV_LA4_14_15 | 0.0070 | 0.0834 | 0 | 1 |
| DV_LA4_15_16 | 0.0191 | 0.1367 | 0 | 1 |
| DV_LA4_16_17 | 0.0118 | 0.1081 | 0 | 1 |
| DV_LA4_17_18 | 0.0142 | 0.1181 | 0 | 1 |
| DV_LA3_09_10 | 0.0066 | 0.0809 | 0 | 1 |
| DV_LA3_10_11 | 0.0090 | 0.0945 | 0 | 1 |
| DV_LA3_11_12 | 0.0486 | 0.2150 | 0 | 1 |
| DV_LA3_12_13 | 0.0213 | 0.1444 | 0 | 1 |
| DV_LA3_13_14 | 0.0210 | 0.1434 | 0 | 1 |
| DV_LA3_14_15 | 0.0206 | 0.1420 | 0 | 1 |
| DV_LA3_15_16 | 0.0229 | 0.1496 | 0 | 1 |
| DV_LA3_16_17 | 0.0193 | 0.1377 | 0 | 1 |
| DV_LA3_17_18 | 0.0185 | 0.1346 | 0 | 1 |
| DV_LA2_09_10 | 0.0085 | 0.0919 | 0 | 1 |
| DV_LA2_10_11 | 0.0141 | 0.1178 | 0 | 1 |
| DV_LA2_11_12 | 0.0208 | 0.1428 | 0 | 1 |
| DV_LA2_12_13 | 0.0433 | 0.2036 | 0 | 1 |
| DV_LA2_13_14 | 0.0254 | 0.1574 | 0 | 1 |
| DV_LA2_14_15 | 0.0256 | 0.1580 | 0 | 1 |
| DV_LA2_15_16 | 0.0263 | 0.1600 | 0 | 1 |
| DV_LA2_16_17 | 0.0252 | 0.1568 | 0 | 1 |
| DV_LA2_17_18 | 0.0312 | 0.1737 | 0 | 1 |
| DV_LA1_09_10 | 0.0369 | 0.1886 | 0 | 1 |
| DV_LA1_10_11 | 0.0326 | 0.1775 | 0 | 1 |
| DV_LA1_11_12 | 0.0319 | 0.1758 | 0 | 1 |
| DV_LA1_12_13 | 0.0253 | 0.1572 | 0 | 1 |
| DV_LA1_13_14 | 0.0316 | 0.1750 | 0 | 1 |
| DV_LA1_14_15 | 0.0263 | 0.1599 | 0 | 1 |
| DV_LA1_15_16 | 0.0312 | 0.1739 | 0 | 1 |
| DV_LA1_16_17 | 0.0322 | 0.1766 | 0 | 1 |
| DV_LA1_17_18 | 0.1853 | 0.3885 | 0 | 1 |
| new_6 | 0.7274 | 0.4453 | 0 | 1 |
Overall_Risk is the dependent variable, which is continuous over the range of 0 to 147 with a mean of 46.21 and a standard deviation of 19.87.
For each of these dummy variables, the mean is the corresponding proportion of observations (e.g. DV_LA4_09_10 indicates that inspections taking place in LA4 in the year 2009–2010 account for 1.35% of the total number of observations used to estimate the model reported in Table A1).
Appendix C
The Resource variable
Resource by Authority and Year (= FTE/number of inspections) (rounded)
| 2008–2009 | 2009–2010 | 2010–2011 | 2011–2012 | 2012–2013 | 2013–2014 | 2014–2015 | 2015–2016 | 2016–2017 | 2017–2018 | |
|---|---|---|---|---|---|---|---|---|---|---|
| LA4 | 0.034 | 0.006 | 0.007 | 0.009 | 0.007 | 0.012 | 0.016 | 0.006 | 0.010 | 0.008 |
| LA3 | 0.022 | 0.023 | 0.017 | 0.003 | 0.007 | 0.007 | 0.007 | 0.007 | 0.008 | 0.008 |
| LA2 | 0.014 | 0.013 | 0.010 | 0.006 | 0.003 | 0.005 | 0.005 | 0.005 | 0.004 | 0.003 |
| LA1 | 0.011 | 0.008 | 0.009 | 0.008 | 0.009 | 0.006 | 0.007 | 0.006 | 0.005 | 0.001 |
References
Andreen, W. L. (2007). Motivating enforcement: Institutional culture and the clean water act. Pace Environmental Law Review, 24, 67–98.10.58948/0738-6206.1054Search in Google Scholar
Andreoni, J., Harbaugh, W., & Vasterlund, L. (2003). The carrot or stick: Rewards, punishments, and cooperation. American Economic Review, 93(3), 893–902.10.1257/000282803322157142Search in Google Scholar
Antle, J. M. (1999). Benefits and costs of food safety regulation. Food Policy, 24(6), 605–623.10.1016/S0306-9192(99)00068-8Search in Google Scholar
Ayres, I., & Braithwaite, J. (1992). Responsive regulation: Transcending the deregulation debate. Oxford: Oxford University Press.10.1093/oso/9780195070705.001.0001Search in Google Scholar
Bardach, E., & Kagan, R. A. (1982). Going by the book: The problem of regulatory unreasonableness. Philadelphia: Temple University Press.Search in Google Scholar
Barnes, J., Whiley, H., Ross, K., & Smith, J. (2022). Defining food safety inspections. International Journal of Environmental Research and Public Health, 19(2), 789–807.10.3390/ijerph19020789Search in Google Scholar
Bates, L., Darvell, J. M., & Watson, B. (2015). Young and unaffected by road policing strategies: Using deterrence theory to explain provisional drivers’ (non)compliance. Australian & New Zealand Journal of Criminology, 50(1), 23–38.10.1177/0004865815589824Search in Google Scholar
Beck, N. (2001). Time-series-cross-section data: What have we learned in the past few years? Annual Review of Political Science, 4, 271–293.10.1146/annurev.polisci.4.1.271Search in Google Scholar
Becker, G. S. (1968). Crime and punishment: An economic approach. Journal of Political Economy, 76(2), 169–217.10.1086/259394Search in Google Scholar
Borraz, O., Beaussier, A. L., Wesseling, M., Demeritt, D., Rothstein, H., Hermans, M., Huber, M., & Paul, R. (2022). Why regulators assess risk differently: Regulatory style, business organization, and the varied practice of risk-based food safety inspectors across the EU. Regulation & Governance, 16(1), 274–292.10.1111/rego.12320Search in Google Scholar
Bradford-Knox, R., Kane, K., & Neighbour, S. (2016). Approaches to food safety hazard control and risk management: A case study of preston city council’s food safety compliance strategy. International Journal of Management and Applied Research, 3(1), 14–29.10.18646/2056.31.16-002Search in Google Scholar
Braga, A., Weisburd, D., & Turchan, B. (2018). Focussed deterrence strategies and crime control: An updated systematic review and meta-analysis of the empirical evidence. Criminology & Public Policy, 17(1), 205–250.10.1111/1745-9133.12353Search in Google Scholar
Braithwaite, J. (1985). To punish or persuade. Albany: State University of New York Press.Search in Google Scholar
Buckley, J. A. (2015). Food safety regulation and small processing: A case study of interactions between processors and inspectors. Food Policy, 51, 74–82.10.1016/j.foodpol.2014.12.009Search in Google Scholar
Burby, R. J., & Patterson, R. G. (1993). Improving compliance with state environmental regulations. Journal of Policy Analysis and Management, 12(4), 753–772.10.2307/3325349Search in Google Scholar
Cannock Chase Council. (2016). Food Safety Service plan 2016–2018. https://www.cannockchasedc.gov.uk/sites/default/files/site-old/foodsafety.pdf.Search in Google Scholar
Chen, Y., Ramamurthy, K., & Wen, K. W. (2012). Organization’s information security policy: Stick or carrot approach? Journal of Management Information Systems, 29(3), 157–188.10.2753/MIS0742-1222290305Search in Google Scholar
Chignell, M., Tong, T., Mizobuchi, S., Delange, T., Ho, W., & Walmsley, W. (2015). Combining multiple measures into a single figure of merit. Procedia Computer Science, 69, 36–43. https://www.sciencedirect.com/science/article/pii/S1877050915031683.10.1016/j.procs.2015.10.004Search in Google Scholar
Cohen, M. A. (2000). Empirical research on the deterrent effect of environmental monitoring and enforcement. Environmental Law Reporter, 30, 10245–10252.Search in Google Scholar
Collins, B. (2015). Food hygiene deprivation, types of premises and rates of gastrointestinal illnesses in the UK. Public Health Nutrition, 18(1), 160–166.10.1017/S1368980013003303Search in Google Scholar
Cranston, R. (1979). Regulating business: Law and consumer agencies. London: Macmillan.10.1007/978-1-349-03849-7Search in Google Scholar
da Cunha, D. T., Saccol, A. L., Tondo, E. C., de Oliveira, A., Ginani, V. C., Araújo, V. C., Lima, T. A. S., da Castro, A. K. S., & Stedefeldt, E. (2016). Inspection scores and grading system for food services in Brazil: The results of a food safety strategy to reduce the risk of foodborne diseases during the 2014 World Cup. Frontiers in Microbiology, 7(1), Article 614. https://www.ncbi.nlm.nih.gov/pmc/articles/PMC4847479/.10.3389/fmicb.2016.00614Search in Google Scholar
Downs, G. W., Rocke, D. M., & Barsoom, P. N. (1996). Is the good news about compliance good news for cooperation? International Organization, 50(3), 379–406.10.1017/S0020818300033427Search in Google Scholar
Earnhart, D. H., & Glicksman, R. L. (2015). Coercive vs cooperative enforcement: Effect of enforcement approach on environmental management. International Review of Law and Economics, 42, 135–146.10.1016/j.irle.2015.02.003Search in Google Scholar
Ehrlich I. (1975). The deterrent effect of capital punishment: A question of life and death. American Economic Review, 65(3), 397–417.Search in Google Scholar
Fietz, A., Bavorová, M., Grűner, S., & Hirschaner, N. (2018). Compliance with food safety laws in Germany: Food businesses in Berlin. Law & Policy, 40(3), 267–285.10.1111/lapo.12105Search in Google Scholar
Fleetwood, J., Rahman, S., Holland, D., Millson, D., Thompson, L., & Poppy, G. (2019). As clean as they look? Food hygiene inspection scores, microbiological contamination, and foodborne illness. Food Control, 96, 76–86.10.1016/j.foodcont.2018.08.034Search in Google Scholar
Food Law Code of Practice (England). (2017). https://www.food.gov.uk/about-us/food-and-feed-codes-of-practice.Search in Google Scholar
Food Standards Agency. (2015). Consistency in regulatory work. http://food.gov.uk/research/research-projects/consistency-in-regulatory-work.Search in Google Scholar
Food Standards Agency. (2016). UK-Wide Food Hygiene Ratings Steering Group. Inter-sessional paper, February 2016. https://old.food.gov.uk/sites/default/files/national-consistency-exercise.pdf.Search in Google Scholar
Food Standards Agency. (2018). Regulating our Future. https://www.food.gov.uk/about-us/regulating-our-future.Search in Google Scholar
Food Standards Agency. (2020). Assessing the contribution made by the food chain to the burden of UK-acquired norovirus infection. https://www.food.gov.uk/sites/default/files/media/document/assessing-the-contribution-made-by-the-food-chain-to-the-burden-of-uk-acquired-norovirus-infection.pdf.Search in Google Scholar
Garrie, D., & Keeler, A. (1993). Incomplete Enforcement with Endogenous Regulatory Choice. Discussion Paper 873. Canada: Institute for Economic Research, Queen’s University.Search in Google Scholar
Glachant, J. M., Khalfallah, H., Perez, Y., Rious, V., & Saguarn, M. (2013). Implementing incentive regulation and regulatory alignment with resource bounded regulators. European University Institute Working Paper RSCAS 2013/31, Florence School of Regulation.10.1177/178359171301400303Search in Google Scholar
Glicksman, R. L., & EarnHart, D. H. (2007). Depiction of the regulator-regulated entity relationship in the chemical industry: Deterrence-based vs cooperative enforcement. William and Mary Environmental Law and Policy Review, 31(3), 603–660.Search in Google Scholar
Gunningham, N. (2017). Compliance, Enforcement, and Regulatory Excellence. RegNet Research Paper 124, School of Regulation and Global Governance (RegNet).10.2139/ssrn.2929568Search in Google Scholar
Hawkins, K. (1984). Environment and enforcement: Regulation and the social definition of pollution. Oxford: Clarendon.10.1093/acprof:oso/9780198275145.001.0001Search in Google Scholar
Hawkins, K. (2002). Law as last resort: Prosecution decision-making in a regulatory agency. Oxford: Oxford University Press.10.1093/acprof:oso/9780199243891.001.0001Search in Google Scholar
Hawkins, K., & Hutter, B. M. (1993). The response of business to social regulation in England and Wales: An enforcement perspective. Law & Policy, 15(3), 199–217.10.1111/j.1467-9930.1993.tb00103.xSearch in Google Scholar
Hill, M., & Hupe, P. (2002). Implementing public policy: Governance in theory and in practice. London: Sage Publications.Search in Google Scholar
Ho, D. E., Ashwood, Z. C., & Handan-Nader, C. (2019). New evidence on information disclosure through restaurant hygiene grading. American Economic Journal: Economic Policy, 11(4), 404–428.10.1257/pol.20180230Search in Google Scholar
Hutter, B. M. (1988). The Reasonable Arm of the Law? Law Enforcement Procedures of Environmental Health Officers. Oxford: Clarendon.Search in Google Scholar
Hutter, B. M. (1989). Variations in regulatory enforcement styles. Law & Policy, 11(2), 153–174.10.1111/j.1467-9930.1989.tb00024.xSearch in Google Scholar
Hutter, B. M. (1997). Compliance: Regulation and environment. Oxford: Clarendon.10.1093/oso/9780198264750.001.0001Search in Google Scholar
Jin, G. Z., & Leslie, P. (2003). The effects of information on product quality: Evidence from restaurant hygiene grade cards. The Quarterly Journal of Economics, 118(2), 409–451.10.1162/003355303321675428Search in Google Scholar
Jin, G. Z., & Leslie, P. (2009). Reputational incentives for restaurant hygiene. American Economic Journal: Microeconomics, 1(1), 237–267.10.1257/mic.1.1.237Search in Google Scholar
Kagan, R. A., Gunningham, N., & Thornton, D. (2003). Explaining corporate environmental performance: How does regulation matter? Law & Society Review, 37(1), 51–90.10.1111/1540-5893.3701002Search in Google Scholar
Khanna, V. S. (2021). Compliance as costs and benefits. In B. Van Rooij & D. D. Sakol (Eds.), Cambridge handbook of compliance Part 1, Chapter 2, (pp. 13–26). Cambridge: Cambridge University Press.10.1017/9781108759458.002Search in Google Scholar
Kuperan, K., & Sutinan, J. G. (1998). Blue water crime: Deterrence, legitimacy, and compliance in fisheries. Law & Society Review, 32(2), 309–338.10.2307/827765Search in Google Scholar
Lipsky, M. (1980). Street level Bureaucracy: Dilemmas of the Individual in Public Service. New York: Russel Sage Foundation.10.2307/1288305Search in Google Scholar
London Borough of Bromley Council. (2017). Audit of Food Hygiene Service Delivery Focussing on Service Organisation, Management and Internal Monitoring Arrangements. https://cds.bromley.gov.uk/documents/s50051119/FSA-Enc%201.pdf.Search in Google Scholar
Luukkanen, J., Nevas, M., Fredriksson-Ahomaa, M., & Lundén, J. (2018). Developing official control in slaughterhouses through internal audits. Food Control, 90, 344–351.10.1016/j.foodcont.2018.03.014Search in Google Scholar
Mackay, M., Yamazaki, S., Jennings, S., Sibly, H., Putten, I. E., & Emery, T. J. (2020). The influence of nudges on compliance behavior in recreational fisheries: A laboratory experiment. ICES Journal of Marine Science, 77(6), 2319–2332.10.1093/icesjms/fsz020Search in Google Scholar
Malesky, E., & Taussig, M. (2017). The danger of not listening to firms: Government responsiveness and the goal of regulatory compliance. Academy of Management Journal, 60(5), 1741–1770.10.5465/amj.2015.0722Search in Google Scholar
Markel, D. L. (2000). The role of deterrence-based enforcement in a ‘Reinvented’ state/federal relationship: The divide between theory and reality. Harvard Environmental Law Review, 24, 1–114.Search in Google Scholar
Markel, D. L. (2005). ‘Slack’ in the administrative state and its implications for governance: The issue of accountability. Oregon Law Review, 84(1), 1–65.Search in Google Scholar
May, P. J. (2005). Compliance motivations: Perspectives of farmers, homebuilders, and marine facilities. Law & Policy, 27(2), 317–347.10.1111/j.1467-9930.2005.00202.xSearch in Google Scholar
May, P. J., & Winter, S. C. (2011). Regulatory enforcement styles and compliance. In C. Parker & V. L. Nielsen (Eds.), Explaining regulatory compliance: Business responses to regulation (pp. 232–244). Cheltenham: Edward Elgar.10.4337/9780857938732.00017Search in Google Scholar
May, P. J., & Wood, R. S. (2003). At the regulatory front line: Inspector’s enforcement styles and regulatory compliance. Journal of Public Administration Research and Theory, 13(2), 117–139.10.1093/jpart/mug014Search in Google Scholar
Meyers, M. K., & Vorsanger, S. (2003). Street-level bureaucrats and the implementation of public policy. In G. Peters & J. Pierre (Eds.), Handbook of public administration (pp. 153–164). London: Sage Publications.10.4135/9780857020970.n13Search in Google Scholar
Mintz, J. A. (1995). Enforcement at the EPA: High stakes and hard choices. Austin: University of Texas Press.Search in Google Scholar
Nagin, D. S. (2013). Deterrence in the twenty-first century. Crime and Justice, 42(1), 199–263.10.1086/670398Search in Google Scholar
Nevas, M., Kalenius, S., & Lundén, J. (2013). Significance of official food control in food safety: Food business operators’ perceptions. Food Control, 31(1), 59–64.10.1016/j.foodcont.2012.09.041Search in Google Scholar
Newcastle Under Lyme Borough Council. (2014). Food Safety Service Plan 2014/2015. https://moderngov.newcastle-staffs.gov.uk/documents/s12589/Newcastle%20Food%20Safety%20Service%20Plan%202014.pdf.Search in Google Scholar
Oded, S. (2013). Corporate compliance: New approaches to regulatory enforcement. Cheltenham: Edward Elgar.10.4337/9781781954751.00010Search in Google Scholar
OECD. (2005). Assuring environmental compliance: A Toolkit for building better environmental inspectorates in Eastern Europe, Caucasus and Central Asia. Paris: OECD Publishing.Search in Google Scholar
OECD. (2013). Cooperative compliance: A framework. From enhanced relationship to cooperative compliance. Paris: OECD Publishing.Search in Google Scholar
Patel, P. C., & Rietveld, C. A. (2020). The impact of the public disclosure of curved inspection scores using emojis on hygiene violators in food establishments. Cornell Hospitality Quarterly, 62(4), 1–13. https://journals.sagepub.com/10.1177/1938965520935398.Search in Google Scholar
Pautz, M. C. (2009). Trust between regulators and the regulated: A case study of environmental inspectors in Virginia. Politics & Policy, 37(5), 1047–1072.10.1111/j.1747-1346.2009.00210.xSearch in Google Scholar
Pautz, M. C. (2010). Front-line regulators and their approach to environmental regulation in Southwest Ohio. Review of Policy Research, 27(6), 761–780.10.1111/j.1541-1338.2010.00470.xSearch in Google Scholar
Pearce, F., & Tombs, S. (1997). Law and class: Contextualizing the regulation of corporate crime. Social & Legal Studies, 6(1), 79–107.10.1177/096466399700600104Search in Google Scholar
Peters, D. H., Adam, T., Alonge, O., Akun, A., & Tran. N. (2013). Implementation research: What it is and how to do it. British Medical Journal, BMJ, 347, f6753. https://pubmed.ncbi.nlm.nih.gov/24259324/.Search in Google Scholar
Plumper, T., & Troeger, V. (2007). Efficient estimation of time invariant and rarely changing variables in finite sample panel analyses with unit fixed effects. Political Analysis, 15, 124–139.10.1093/pan/mpm002Search in Google Scholar
Rahman, S., Millson D., & Thomson, L. (2018). Evidence of relationship between food business hygiene compliance and measures of food safety. Food Standards Agency, (Operational Research, Analytics Unit, Science Evidence and Research Division). Accessed 20-12-2023 at: Evidence of relationship between food business hygiene compliance and measures of food safety.Search in Google Scholar
Rechtschaffen, C. (1998). Deterrence vs cooperation and the evolving theory of environmental enforcement. Southern California Law Review, 71(6), 1181–1272.Search in Google Scholar
Rechtschaffen, C. (2004). Promoting pragmatic risk regulation: Is enforcement discretion the answer? Kansas Law Review, 53, 1327–1375.Search in Google Scholar
Rechtschaffen, C., & Markell, D. L. (2003). Reinventing environmental enforcement and the state/federal relationship. Washington: Environmental Law Institute.Search in Google Scholar
Regulating Futures Review. (2017). Cabinet Office, UK Government. https://assets.publishing.service.gov.uk/government/uploads/system/uploads/attachment_data/file/582283/Regulatory_Futures_Review.pdf.Search in Google Scholar
Russel, C. S., Harrington, W., & Vaughan, W. J. (1986). Enforcing pollution control laws. Baltimore: John Hopkins University Press.Search in Google Scholar
Sabatier, P. A. (1986). Top-down and bottom-up approaches to implementation research. Journal of Public Policy, 6(1), 21–48.10.1017/S0143814X00003846Search in Google Scholar
Scholz, J. T. (1984). Cooperation, deterrence, and the ecology of regulatory enforcement. Law & Society Review, 18(2), 179–224.10.2307/3053402Search in Google Scholar
Scholz, J. T. (1997). Enforcement policy and corporate misconduct: The changing perspective of deterrence theory. Law and Contemporary Problems, 60(3), 253–268.10.2307/1192014Search in Google Scholar
Scholz, J. T., & Gray, W. B. (1997). Can government facilitate cooperation? An informational model of OSHA enforcement. American Journal of Political Science, 41(3), 693–717.10.2307/2111672Search in Google Scholar
Serapiglia, T., Kennedy, E., Thompson, S., & de Burger, R. (2007). Association of food premises inspection and disclosure program with retail-acquired foodborne illness and operator noncompliance in Toronto. Journal of Environmental Heath, 70(1), 54–59.Search in Google Scholar
Simon, P., Leslie, P., Jin, G. Z., Reporter, R., Aquirre, A., & Fielding, J. E. (2003). Impact of restaurant hygiene grade cards on foodborne-decease hospitalizations in Los Angeles County. Journal of Environmental Heath, 67(7), 32–56.Search in Google Scholar
Stigler, G. J. (1970). The optimum enforcement of laws. Journal of Political Economy, 78(3), 526–536.10.1086/259646Search in Google Scholar
Stoughton, M., Herb, J., Sullivan, J., & Crow, M. (2001). Toward integrated approaches to compliance assurance. Environmental Law Reporter, 31, 11266–11283.Search in Google Scholar
Traill, W. B., & Koenig, A. (2010). Economic assessment of food safety standards: Costs and benefits of alternative approaches. Food Control, 21(12), 1611–1619.10.1016/j.foodcont.2009.06.018Search in Google Scholar
Weske, U., Boselie, P., van Rensen, E. L. J., & Schneider, M. M. E. (2018). Using regulatory enforcement theory to explain compliance with quality and patient safety regulations: The case of internal audits. BMC Health Services Research, 18(62), 1–6.10.1186/s12913-018-2865-8Search in Google Scholar
Wong, M. R., McKelvey, W., Schiff, C., Jacobson, J. B., & Kass, D. (2015). Impact of a letter-grade program on restaurant sanitary conditions and diner behavior in New York City. American Journal of Public Health, 105(3), 81–87.10.2105/AJPH.2014.302404Search in Google Scholar
Yapp, C., & Fairman, R. (2005). Assessing compliance with food safety legislation in small businesses. British Food Journal, 107(3), 150–161.10.1108/00070700510586470Search in Google Scholar
Yu, S., & Costanigro, M. (2019). The Effect of Public Online Disclosure of Restaurant Inspection Scores in the Lives Program: A Difference-in-Difference and Geographic Regression Discontinuity Approach. Annual Meeting of the Agricultural and Applied Economics Association, July 21-23, Atlanta, Georgia.Search in Google Scholar
© 2024 the author(s), published by De Gruyter
This work is licensed under the Creative Commons Attribution 4.0 International License.
Articles in the same Issue
- Regular Articles
- Political Turnover and Public Health Provision in Brazilian Municipalities
- Examining the Effects of Trade Liberalisation Using a Gravity Model Approach
- Operating Efficiency in the Capital-Intensive Semiconductor Industry: A Nonparametric Frontier Approach
- Does Health Insurance Boost Subjective Well-being? Examining the Link in China through a National Survey
- An Intelligent Approach for Predicting Stock Market Movements in Emerging Markets Using Optimized Technical Indicators and Neural Networks
- Analysis of the Effect of Digital Financial Inclusion in Promoting Inclusive Growth: Mechanism and Statistical Verification
- Effective Tax Rates and Firm Size under Turnover Tax: Evidence from a Natural Experiment on SMEs
- Re-investigating the Impact of Economic Growth, Energy Consumption, Financial Development, Institutional Quality, and Globalization on Environmental Degradation in OECD Countries
- A Compliance Return Method to Evaluate Different Approaches to Implementing Regulations: The Example of Food Hygiene Standards
- Panel Technical Efficiency of Korean Companies in the Energy Sector based on Digital Capabilities
- Time-varying Investment Dynamics in the USA
- Preferences, Institutions, and Policy Makers: The Case of the New Institutionalization of Science, Technology, and Innovation Governance in Colombia
- The Impact of Geographic Factors on Credit Risk: A Study of Chinese Commercial Banks
- The Heterogeneous Effect and Transmission Paths of Air Pollution on Housing Prices: Evidence from 30 Large- and Medium-Sized Cities in China
- Analysis of Demographic Variables Affecting Digital Citizenship in Turkey
- Green Finance, Environmental Regulations, and Green Technologies in China: Implications for Achieving Green Economic Recovery
- Coupled and Coordinated Development of Economic Growth and Green Sustainability in a Manufacturing Enterprise under the Context of Dual Carbon Goals: Carbon Peaking and Carbon Neutrality
- Revealing the New Nexus in Urban Unemployment Dynamics: The Relationship between Institutional Variables and Long-Term Unemployment in Colombia
- The Roles of the Terms of Trade and the Real Exchange Rate in the Current Account Balance
- Cleaner Production: Analysis of the Role and Path of Green Finance in Controlling Agricultural Nonpoint Source Pollution
- The Research on the Impact of Regional Trade Network Relationships on Value Chain Resilience in China’s Service Industry
- Social Support and Suicidal Ideation among Children of Cross-Border Married Couples
- Asymmetrical Monetary Relations and Involuntary Unemployment in a General Equilibrium Model
- Job Crafting among Airport Security: The Role of Organizational Support, Work Engagement and Social Courage
- Does the Adjustment of Industrial Structure Restrain the Income Gap between Urban and Rural Areas
- Optimizing Emergency Logistics Centre Locations: A Multi-Objective Robust Model
- Geopolitical Risks and Stock Market Volatility in the SAARC Region
- Trade Globalization, Overseas Investment, and Tax Revenue Growth in Sub-Saharan Africa
- Can Government Expenditure Improve the Efficiency of Institutional Elderly-Care Service? – Take Wuhan as an Example
- Media Tone and Earnings Management before the Earnings Announcement: Evidence from China
- Review Articles
- Economic Growth in the Age of Ubiquitous Threats: How Global Risks are Reshaping Growth Theory
- Efficiency Measurement in Healthcare: The Foundations, Variables, and Models – A Narrative Literature Review
- Rethinking the Theoretical Foundation of Economics I: The Multilevel Paradigm
- Financial Literacy as Part of Empowerment Education for Later Life: A Spectrum of Perspectives, Challenges and Implications for Individuals, Educators and Policymakers in the Modern Digital Economy
- Special Issue: Economic Implications of Management and Entrepreneurship - Part II
- Ethnic Entrepreneurship: A Qualitative Study on Entrepreneurial Tendency of Meskhetian Turks Living in the USA in the Context of the Interactive Model
- Bridging Brand Parity with Insights Regarding Consumer Behavior
- The Effect of Green Human Resources Management Practices on Corporate Sustainability from the Perspective of Employees
- Special Issue: Shapes of Performance Evaluation in Economics and Management Decision - Part II
- High-Quality Development of Sports Competition Performance Industry in Chengdu-Chongqing Region Based on Performance Evaluation Theory
- Analysis of Multi-Factor Dynamic Coupling and Government Intervention Level for Urbanization in China: Evidence from the Yangtze River Economic Belt
- The Impact of Environmental Regulation on Technological Innovation of Enterprises: Based on Empirical Evidences of the Implementation of Pollution Charges in China
- Environmental Social Responsibility, Local Environmental Protection Strategy, and Corporate Financial Performance – Empirical Evidence from Heavy Pollution Industry
- The Relationship Between Stock Performance and Money Supply Based on VAR Model in the Context of E-commerce
- A Novel Approach for the Assessment of Logistics Performance Index of EU Countries
- The Decision Behaviour Evaluation of Interrelationships among Personality, Transformational Leadership, Leadership Self-Efficacy, and Commitment for E-Commerce Administrative Managers
- Role of Cultural Factors on Entrepreneurship Across the Diverse Economic Stages: Insights from GEM and GLOBE Data
- Performance Evaluation of Economic Relocation Effect for Environmental Non-Governmental Organizations: Evidence from China
- Functional Analysis of English Carriers and Related Resources of Cultural Communication in Internet Media
- The Influences of Multi-Level Environmental Regulations on Firm Performance in China
- Exploring the Ethnic Cultural Integration Path of Immigrant Communities Based on Ethnic Inter-Embedding
- Analysis of a New Model of Economic Growth in Renewable Energy for Green Computing
- An Empirical Examination of Aging’s Ramifications on Large-scale Agriculture: China’s Perspective
- The Impact of Firm Digital Transformation on Environmental, Social, and Governance Performance: Evidence from China
- Accounting Comparability and Labor Productivity: Evidence from China’s A-Share Listed Firms
- An Empirical Study on the Impact of Tariff Reduction on China’s Textile Industry under the Background of RCEP
- Top Executives’ Overseas Background on Corporate Green Innovation Output: The Mediating Role of Risk Preference
- Neutrosophic Inventory Management: A Cost-Effective Approach
- Mechanism Analysis and Response of Digital Financial Inclusion to Labor Economy based on ANN and Contribution Analysis
- Asset Pricing and Portfolio Investment Management Using Machine Learning: Research Trend Analysis Using Scientometrics
- User-centric Smart City Services for People with Disabilities and the Elderly: A UN SDG Framework Approach
- Research on the Problems and Institutional Optimization Strategies of Rural Collective Economic Organization Governance
- The Impact of the Global Minimum Tax Reform on China and Its Countermeasures
- Sustainable Development of Low-Carbon Supply Chain Economy based on the Internet of Things and Environmental Responsibility
- Measurement of Higher Education Competitiveness Level and Regional Disparities in China from the Perspective of Sustainable Development
- Payment Clearing and Regional Economy Development Based on Panel Data of Sichuan Province
- Coordinated Regional Economic Development: A Study of the Relationship Between Regional Policies and Business Performance
- A Novel Perspective on Prioritizing Investment Projects under Future Uncertainty: Integrating Robustness Analysis with the Net Present Value Model
- Research on Measurement of Manufacturing Industry Chain Resilience Based on Index Contribution Model Driven by Digital Economy
- Special Issue: AEEFI 2023
- Portfolio Allocation, Risk Aversion, and Digital Literacy Among the European Elderly
- Exploring the Heterogeneous Impact of Trade Agreements on Trade: Depth Matters
- Import, Productivity, and Export Performances
- Government Expenditure, Education, and Productivity in the European Union: Effects on Economic Growth
- Replication Study
- Carbon Taxes and CO2 Emissions: A Replication of Andersson (American Economic Journal: Economic Policy, 2019)