Performance Evaluation of Economic Relocation Effect for Environmental Non-Governmental Organizations: Evidence from China
-
Guangqin Li
 and
Siyan Liu
and
Siyan Liu

Abstract
In this article, an economic natural experiment in China is analyzed and the performance evaluation of the economic relocation effect of informal environmental regulations imposed through the channel of environmental nongovernmental organizations (ENGOs) is suggested. ENGOs are found to have a significantly negative impact on the overall economic location quotient of six major polluting industries. The economic relocation effect from ENGOs exhibits industrial and regional heterogeneity, as the effect is stronger among easy-to-relocate industries and in market-oriented areas. The underlying mechanism is the ENGOs, as informal environmental regulations could motivate firms to enhance their investment in environmental governance, ultimately crowding out these economically polluting industries.
1 Introduction
With the development of globalization, some industries have shifted from developed countries to developing countries. In a major country’s economy, the transfer of some industries from developed areas to relatively underdeveloped areas is called industrial transfer. Among the numerous studies on industrial transfer, environmental regulation is the most important branch. The pollution haven hypothesis, first proposed by Walter and Ugelow (1979), has been used by environmental economists to refer to the important theory of environmental regulation and industrial transfer. This theory extends the Heckscher Ohlin (H–O) model to analyze the relationship between environmental regulation and FDI, further analyzing the relationship between environmental regulation and FDI. Multiple data studies now use this theory to explain the relationship between polluted sludge and foreign direct investment (Levinson & Taylor, 2008), and further analyze the relationship between environmental regulation and industrial relocation. With the expanding application of environmental economics over the past decade years, not only do foreign investors need to choose a location, but polluting enterprises and polluting industries also need to choose a location given the environmental regulations (Dechezleprêtre & Sato, 2017). There is stronger evidence for the existence of pollution havens in pollution-intensive industries and enterprises (Wu et al., 2017; Yin et al., 2015). There is a U-shaped relationship between environmental regulation and the transfer of pollution-intensive industries (Zhang & Guo, 2015).
Pollution havens are mainly caused by the implementation of weak environmental regulations (Féres & Reynaud, 2012; Zhang et al., 2017). It has been found that polluting industries tend to relocate to regions with looser formal environmental regulations. Stronger formal regulations in adjacent regions may push polluting companies to relocate to regions with weak environmental regulations, turning the latter into pollution havens (Wu et al., 2017). This shows that regional differences in environmental regulations and policies play a dominant role in the location choice of polluting industries (Li et al., 2021). However, due to the endogeneity of local environmental governance and regulations, it is worthwhile to extend existing studies and incorporate more policy instruments and identification methods with microlevel data.
An academic gap remains in that so far, most empirical studies on the pollution haven and relocation effects have focused on the impact of formal environmental regulations caused by governmental intervention. However, the impact of informal environmental regulations imposed by other social sectors in the pollution haven has seldom been empirically examined (Li & Ramanathan, 2018). The important role of public participation in environmental regulation has always been ignored in empirical studies on the relocation effect (Hasan et al., 2018). In addition to formal environmental regulations, informal environmental regulations may also have a significant impact on the transfer of pollution-intensive industries (Li et al., 2018a,b). The difference is formal environmental regulations, while informal environmental regulations have an indirect impact on industrial relocation, which may affect local labor supply, wage levels, etc. The difference is formal environmental regulations, while informal environmental regulations have an indirect impact on industrial relocation, which may affect local labor supply, wage levels, etc. For example, as an informal environmental regulation mechanism, environmental nongovernmental organizations (ENGOs) may also affect polluting industries and enterprises as well as their operation and survival. However, what kind of underlying roles do ENGOs play in influencing polluting enterprises to relocate their polluting industries purposefully or passively, and what is the mechanism through which this occurs? Does the pollution haven hypothesis stand when such informal environmental regulations are effective? There are still no clear answers.
This article contributes to the existing literature as follows: First, the growth of ENGOs is taken as an informal environmental regulation, and that growth is regarded as a quasi-natural experiment to overcome endogeneity and to investigate the performance evaluation of economic relocation effect for ENGOs. This article could enrich the literature on the economic relocation effects of informal environmental regulation on pollution-intensive industries. Second, the mechanism analysis finds that the growth of ENGOs could, on the one hand, increase environmental supervision, information disclosure, environmental education, and environmental litigation. On the other hand, ENGOs motivate governments to strengthen formal environmental regulations and force companies to enhance their investments in environmental governance, ultimately crowding out polluting industries.
The rest of this article is organized as follows: the second part is the theoretical analysis, the third part is the methodology, the fourth part is the empirical results, the fifth part is the mechanism analysis, and the final part is the conclusion.
2 Literature Review and Theoretical Mechanism
2.1 Literature Reviews
Informal environmental regulations play a significant role in industrial transfer and upgrading. Informal environmental regulations influence the decision-making process of enterprises, promoting technological innovation and environmental protection behaviors (Féres & Reynaud, 2012; Zhang et al., 2023), thereby driving the green transformation of industries to some extent (Pargal & Wheeler, 1996; Pargal et al., 1997). At the same time, these studies also emphasize the key role of informal environmental regulations in achieving a win–win situation for economic development and environmental protection (Ouyang et al., 2019; Sharghi et al., 2024; Wu, 2023). ENGOs, as a form of informal environmental regulation, have attracted academic attention for their role in environmental governance. Li et al. (2018a,b) used urban panel data from China to quantitatively study the significant improvement in urban environmental quality due to the development of ENGOs in China. Anderson et al. (2019) conducted research in 50 cities in China and found that the supervision of non-governmental organizations (NGOs) can promote the implementation of local government environmental policies. In the process of climate change, ENGOs directly or indirectly participate in the formulation of climate change policies, becoming an important partner for governments in climate change governance (Haris et al., 2020). Partelow et al. (2020) argue that the diversity of ENGOs exceeds traditional perceptions, and their influence in global environmental politics and discourse is continuously increasing, mainly including environmental discourse categories: environmental management, climate politics, environmental justice, and ecological modernization. Li et al. (2021) used data from OECD countries and found that ENGOs have a positive impact on improving environmental quality by increasing environmental protection investments.
2.2 Theoretical Mechanisms
As a non-profit organization, NGOs play an important role in the process of economic and social development. Among them, ENGOs, as a type of NGO, take environmental protection as their responsibility and have become an important component of the environmental protection process in various countries around the world. The rise of ENGOs is putting political pressure on local government officials with respect to environmental issues. Over the past 20 years, scholars have extensively studied the role of ENGOs on environmental laws and policies. Globally, the effects of pollution on human health can result in a strong public demand for environmental and energy policies in order to accelerate governmental action and improve accountability (Grano, 2012). ENGOs have many means, such as media, to influence environmental governance and policies, highlight the need for implementation of laws, and represent the interests of vulnerable populations.
Despite these facts, ENGOs in China are among the least likely to have an influence on policymakers (Lu, 2007). Indeed, ENGOs are perceived as social movements that focus on individual interests and act on behalf of mankind (Wang & Liu, 2009). ENGOs are more likely to influence green policies when these do not oppose stakeholder interests (Betsill & Corell, 2008). Therefore, the lower the political stakes, the higher the ENGO influence. In particular, ENGOs usually have a better chance of playing an important role in the negotiation process during the early stages of environmental policy making rather than the later stages of development actions (Betsill & Corell, 2008). However, it is worth noting that these organizations can address and reflect the needs of local residents and community groups through grassroots communication, by creating trust and reducing distrust in bureaucratic encounters.
Due to the authoritarian constraints to which ENGOs in China are subjected, some of them can push their agendas to the attention of authorities without openly criticize the local government, as opposed to other ENGOs around the world. However, the non-political and non-antagonistic nature of Chinese ENGOs can still have wide-ranging civic and political implications, as they learn the subtlety of domestic politics by cautiously pushing the boundaries of advocacy (Young, 2001).
Given the inherently superior ability of ENGOs, some successes have been achieved via (i) legal suits that generate pressure on the authorities; (ii) the involvement of key actors, such as the media, which contribute to make the issue more well-known, and (iii) the conventional method of utilizing bureaucratic political channels and conflicts between politicians and businesses. The long-term battle is not only to defeat a single corrupt official or relocate polluting factories but also to build a more transparent and open system in which citizens are actively involved.
Moreover, ENGOs can also exert positive influences on the firms’ environmental regulations (Heyes et al., 2018), environmental inspections, and enforcement actions, including issuing new guidance and initiating social movements (Li et al., 2018a,b). In this regard, cognitive theory has emphasized the importance of attitudes, beliefs, ideology, and personal values in driving corporate behavior. Specially, when the firms are situated in a community that advocates for a sustainable environment, they may tend to implement similar measures to strengthen social cohesion and remove the barriers among themselves (Sun et al., 2019).
The ability of ENGOs can bring pressure to bear on the firms for the implementation of environmental standards and indicators (McCarthy & Zen, 2010). If a company refuses to comply with the pollution criteria, ENGOs begin to affect state policy in response to the threat of negative actions, including consumers’ boycotts (Gunningham et al., 2004). In this sense, the involvement of ENGOs in green decision-making and enforcement remains crucial.
The partnership between ENGOs and advocacy campaigns plays important roles in raising public awareness, increasing consumer satisfaction, and developing new environmental regulations (Hopkins et al., 2011). To a certain extent, the accelerated development of ENGOs reflects a need for more responsible environmental management and the increasing demand for corporate leaders toward green value creation (Dauvergne & Lister, 2012). Through their demonstrating commitment, companies have gained legitimacy and are influenced by ENGOs with respect to corporate production and environmental governance. Besides, climate changes and global environmental issues also create conducive conditions for policy decision-making.
There may be some intriguing possibilities for ENGOs to leverage company initiatives, reach into corporate networks, and accelerate economic reforms, at unprecedented speed and scale. The lever for ENGOs to drive corporate environmental improvements is much greater now that companies have tied their products so openly to far-reaching sustainability commitments. The costs resulting from failing to meet the goal of company reputation are considerably high, and even higher if competitors have made good progress toward corporate sustainability (Dauvergne & Lister, 2012).
It is insightful to reveal the importance of ENGOs in shaping the context of private environmental governance mechanisms, such as eco-certification (Lister, 2011). Previous research has shown that ENGOs can start a partnership with industry frames and play a critical role in the face of conflict over corporate legitimacy, thus creating new forms (state-led and market-led) of environmental governance (Dauvergne & Lister, 2012).
The environmental issues (such as climate change and air pollution) may be even worse, as the state capacity or willingness to address the causes is low, leaving the government failure to do much about it. Thus, ENGOs should explore creative ways to leverage the scale, speed, and innovative ideas of corporate governance to increase regulatory efforts. ENGOs also need to focus on the roles of companies in protecting the environment at different stages of the product life cycle, ranging from material sourcing to manufacturing, retailing, and consumer use. Most companies are forced to decrease the intensity of environmental impact per unit of output, mainly through energy-efficient appliances and energy-conserving practices encouraged by ENGOs (Dauvergne & Lister, 2012).
ENGO–corporate partnerships are anticipated to become more important, along with the acceleration of sustainable development. This may either raise a warning flag or initiate positive developments (MacDonald, 2008). Hence, we believe that the growth of ENGOs could on one hand directly lift environmental supervision, information disclosure, environmental education, and environmental litigation. On the other hand, they indirectly motivate governments to strengthen formal environmental regulations. These could further force enterprises to enhance investment in environmental governance and finally crowd out polluting industries (Figure 1).
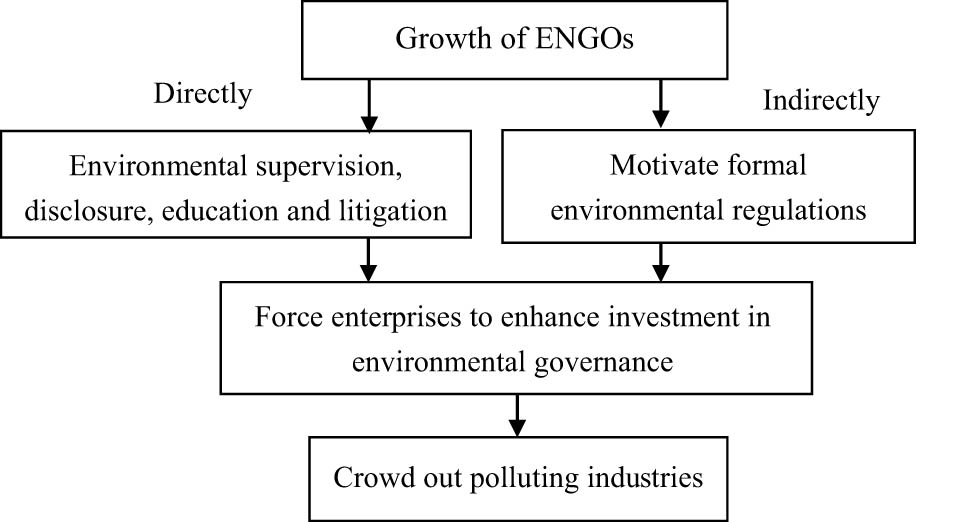
Mechanism of ENGOs’ crowding-out effect on polluting industries.
In all, the mechanism of ENGOs’ crowding-out effect on polluting industries can be explained through the following mechanisms:
Advocacy and policy influence: ENGOs often engage in advocacy efforts to promote environmental policies and regulations that limit the activities of polluting industries. By successfully lobbying for stricter environmental standards, ENGOs can crowd out polluting industries by making it more difficult or expensive for them to operate.
Public awareness and pressure: ENGOs play a crucial role in raising public awareness about environmental issues and the negative impacts of polluting industries. By increasing public scrutiny and pressure on these industries, ENGOs can make it more challenging for them to operate, thereby crowding them out.
Economic incentives: ENGOs may also work to promote sustainable business practices and green technologies, which can provide economic incentives for companies to shift away from polluting activities. As more companies adopt these practices, polluting industries may find it increasingly difficult to compete, leading to their crowding out.
Funding and resources: ENGOs often rely on donations and grants from donors who support environmental causes. By diverting funding and resources away from polluting industries and toward environmental initiatives, ENGOs can limit the growth and expansion of these industries.
Partnerships and collaborations: ENGOs may form partnerships with governments, businesses, and other organizations to promote environmental sustainability. These collaborations can result in the development of new policies, technologies, and practices that make it more difficult for polluting industries to operate, contributing to their crowding out.
Based on the above analysis, this article proposes the following research hypotheses:
Hypothesis 1: The development of ENGOs will promote the relocation of polluting industries.
Hypothesis 2: The development of ENGOs and the increase in regional environmental protection investment jointly promote the relocation of polluting industries.
3 Methodology
3.1 Model
In our research cycle, ENGOs were not present at the beginning. Over time, some regions had ENGOs, while others had relatively lagging development of ENGOs. By the end of the research cycle, not all regions have ENGOs. We consider the emergence of ENGOs as a quasi-natural implementation, with regions with ENGOs as the treatment group and regions without ENGOs as the control group. The time after the appearance of ENGOs is used as the experimental time. The above analysis meets the setting principles of the difference-in-difference (DID) model. The dependent variable is the development level of the polluting industry under the influence of ENGOs, and the core variables are engodata and engopop: the number of ENGOs and their employees in the region, respectively; engodata and engopop are continuous variables between 0 and 1, rather than 0–1 dummy variables. Therefore, this article adopts the continuous DID method for estimation, with the following model settings:
where the subscripts
It has been acknowledged in the literature that the relationship between ENGOs and the location quotient of polluting industries is indirect. Based on previous research, we know that ENGOs have an impact on two major environmental governance investments: government investments and business investments made at the request of the government. Moreover, ENGOs have a direct influence on pollution industry governance investments. Therefore, to investigate whether ENGOs play a role in the relocation of polluting industries through environmental governance investments, interactions between the ENGO variables and environmental governance investments are introduced into the econometric equation. Specifically, the econometric model is as follows:
In the above two models, the coefficient of interest is
3.2 Polluting Industries
Most studies on the relocation of polluting industries mainly draw from industry-related data, while determining the definition of a polluting industry is the first step in this study. Following different standards, there are three main classification methods for dirty industries in international academic circles.
The first method is environmental cost classification. Although it is difficult to calculate the pollution abatement costs of every industry, it is possible to calculate their pollution-control costs. By calculating the ratio of pollution-control costs to total value added, we can determine whether an industry is a polluting industry. It is easier to measure the ratio of pollution-control costs to total sales and rely on that ratio to define polluting industries. Through this method, it could be classified into five industries, including the papermaking, mining, nonferrous metals, steel, and chemical industries, as polluting industries. Specifically, we calculated each industry’s ratio of pollution-control costs to total production costs, and then through an empirical study, we determined the cutoff for this ratio to be 1.85%, meaning an industry is regarded as a polluting industry when its ratio is larger than 1.85%; otherwise, it is not. This method may be applicable to an entire country but not to a region, as its industrial structure is not necessarily complete.
The second method is pollution damage classification, which takes damage to the natural ecology and public health as its criteria. If an industry causes greater damage to these two features, it is classified as a polluting industry; otherwise, it is not. Through this method, McGuire (1982) ultimately classified 17 industries as polluting industries, such as mining, food manufacturing, tobacco and beverage manufacturing, textiles (including clothing, footwear, and hat manufacturing), fur and leather products, and papermaking.
The third method is pollution intensity classification using the Industrial Pollution Projection System (IPPS), which was proposed by the World Bank in 1994 and has mainly been used to evaluate the extent of industrial pollution. It is currently the most mature and widely used classification standard for polluting industries in the world. It is based on the calculation of pollution intensity for each firm, which is then used to classify industries as polluting or non-polluting. The IPPS is considered one of the most mature and widely used classification systems for identifying polluting industries globally. The IPPS methodology involves the following steps:
Calculation of pollution intensity: Using the four-digit Standard Industrial Classification (SIC) code, the pollution intensity of each firm is calculated. Pollution intensity is typically measured as the amount of pollution released per unit of production or revenue.
Comparison with critical value: The calculated pollution intensity is compared to a critical value, which serves as a benchmark for determining whether an industry is polluting or not. If the emission intensity of an industry exceeds this critical value, it is classified as a polluting industry.
Classification of industries: Based on the comparison, industries are categorized into polluting and non-polluting sectors. This classification helps in understanding the environmental impact of different industries and can inform policy decisions related to environmental regulations and sustainability initiatives.
Referring to the International Standard Industrial Classification (ISIC2.0) level, the method calculates each firm’s pollution intensity by four-digit Standard Industrial Classification (SIC) code, and pollution intensity is used as a criterion for defining polluting industries. If an industry’s emission intensity exceeds the critical value, that industry is considered a polluting industry; otherwise, it is not.
Then, Mani and Wheeler (1998) applied this IPPS methodology to classify American industries at the three-digit International Standard Industrial Classification (ISIC) level. Their study identified five sectors as the leading candidates for dirty industry status, which are the following:
Iron and steel: This sector involves the production of iron and steel products and is known for its high energy consumption and emissions of pollutants such as sulfur dioxide and nitrogen oxides.
Nonferrous metals: This sector includes the production of metals like copper, aluminum, and lead, which often involve the release of heavy metals and other hazardous substances.
Industrial chemicals: The production of chemicals like plastics, fertilizers, and pesticides can result in the emission of various toxic substances and greenhouse gases.
Pulp and paper: The paper industry is associated with water pollution due to the discharge of chemicals and wastewater from pulping and papermaking processes.
Nonmetallic mineral products: This sector includes the production of cement, glass, and other mineral products, which can contribute to air pollution through the release of particulate matter and carbon dioxide.
These sectors are considered to have higher pollution intensity than other industries, indicating that they have a significant environmental impact. The identification of these sectors as “dirty” can lead to targeted environmental policies and incentives to reduce pollution and promote cleaner production techniques.
As China’s industrial categorization differs from other countries to some extent, some scholars have proposed their own classification criteria. Otsuki et al. (2004) divided 20 two-digit manufacturing industries from the National Economical Industry Classification (GB/4754-2011) into three categories based on their average pollutant concentration: severely polluting, moderately polluting, and lightly polluting industries.
In terms of national policymaking, the Chinese State Council divided pollution sources into industrial pollution sources, agricultural nonpoint source pollution sources, domestic pollution sources, and centralized pollution sources in the First National pollution source survey program issued in 2006. Of these sources, industrial pollution sources include all secondary industries except for the construction industry and can be further divided into major and general pollution sources.
Based on international standards and existing studies in China, this article chose six polluting industries, i.e., mining, papermaking, chemical fiber manufacturing, nonmetallic mineral products, the smelting and processing of ferrous metals, and the production and supply of electric power. Additionally, since this article studies ENGOs’ role in environmental governance, we need to consider whether pollution behavior is easy to observe and therefore neglect industry-level pollution costs, damages, and intensity. The reasons we chose these six industries are as follows. For the mining industry, its major pollutant is the waste residue generated during the mining process that is piled up haphazardly and causes environmental problems, which are particularly easy for ENGOs to observe. The mining industry here includes all its subsectors. As the most traditional dirty industries, papermaking, and chemical fiber manufacturing have always been a focus of ENGOs because they usually produce a huge amount of sewage and odor. Nonmetallic mineral products and the smelting and processing of ferrous metals have also been representative of heavy industries, resulting in severe air, water, and soil pollution, another major cause of concern for ENGOs. The production and supply of electric power (mainly referring to thermal power plants and heating companies) are mainly fueled by coal, which also draws ENGOs’ attention.
3.3 Industrial Relocation
Existing studies have found strong evidence for the existence of pollution havens in China. Research integrating environmental regulations on polluting industries has found strong evidence in favor of the fact that polluting industries tend to relocate to regions with looser environmental regulations as well as to Midwest China. Once environmental regulations in adjacent regions are strengthened, polluting companies in those places may relocate to local areas, turning these areas into pollution havens. However, the economic relocation effect of ENGOs has not yet received much attention in academia. By contrast, this article aims to fill this research gap through an empirical examination. After defining the polluting industries of concern to ENGOs as above, we then focus on the relocation index for polluting industries. Previous studies have adopted the location quotient of polluting industries or the share of the output value of a region’s polluting industries in the output of the country as a measure of polluting industries. These indicators partly reflect the development level of certain polluting industries in a region. As we aim to determine whether the relocation of polluting industries is influenced by the development of ENGOs, industrial and growth indicators fail to reflect whether these industries have relocated or not. Ultimately, we chose the employment location quotient, denoting the study area as a region (j) within a nation (n) and using employment (worker) as the measure of economic activity. Then, the location quotient for industry i may be expressed as follows:
where
Since this article focuses on six polluting industries, we add up the six industries’ employment in the province to obtain total employment. For a country with j regions and i industries, let
It should be noted that the total location quotient does not add up to the sum of the location quotients for the six polluting industries. Rather, it is measured by comparing the share of employment in the six polluting industries at the province level with the share of employment in the polluting industries throughout the country.
In recent years, the utilization of the location quotient for estimating regional economic or industrial development levels has been widely used and has attracted an increasing number of scholars from various fields. Liu (2009) regarded the location quotient as a criterion for selecting regional pillar industries. In this article, the location quotient is used to measure the competitive advantage of a certain polluting industry in a province relative to the country, justifying its pillar position. Specifically, a decreasing location quotient indicates that this industry is losing its pillar position in the region, meaning it is relocating to other regions. In addition, instead of the output location quotient, this article adopts the employment location quotient index to measure the geographic concentration of the polluting industries across regions. If the employment location quotient declines, it is an indicator that this industry’s employment is less advantaged. This may be caused either by the industry relocating or by the industry introducing advanced production technology, leading to labor declines or transfers to other industries. Generally, most polluting industries are labor intensive; hence, using the employment share to calculate the location quotient index can serve as an indirect indicator of the employment effect and the economic relocation effect.
3.4 Explanatory Variables
In this article, we choose engopop and engodata as the core explanatory variables (equations (1) and (2)). However, ENGO data are not calculated in China. The data used in our study are mainly from the China Development Brief, a Chinese–English bilingual network platform founded in 1996 with a directory of NGOs. It provides professional observations, research, network platform support, and services to charity organizations, and the relevant information on most NGOs can be found through this platform (http://www.chinadevelopmentbrief.org.cn).
We define nongovernmental organizations engaged in the environmental protection business as ENGOs. The platform includes each ENGO’s information, such as its name, date of establishment, organization size (number of personnel), and business field, and identifies the ENGO’s registration place at the province–prefecture–county level. With these data, we can manually collect the relevant information on each ENGO and then pool those data to the province-prefecture level and obtain two-administrative-level ENGO data. It should be noted that the data currently available are relatively comprehensive, although they are not perfectly so. The data include whether there are any ENGOs (engo), the number of ENGOs (engodata), and the number of ENGO employees (engopop).
In this article, we use provincial-level data on the number of ENGOs (engodata) and the number of ENGO employees (engopop) as core explanatory variables. Then, we chose two years, 2000 and 2010, to analyze the trends in these two indicators. Figures 2 and 3 reveal the spatial distribution of the number of ENGOs in all provinces in 2000 and 2010, respectively. By comparing the two figures, ENGOs can be seen to have only existed in the coastal areas and Chongqing in 2000, where there were a larger number of ENGOs in the province-level municipalities of Beijing and Shanghai, and in Guangdong Province. However, ENGOs expanded into more provinces by 2010, although they were mainly still concentrated in coastal provinces and did not yet exist in every province. They began to appear in the southwestern region and Heilongjiang and Ningxia provinces. The central part of the country also saw the appearance of ENGOs. However, in Shanxi, Inner Mongolia, and Shaanxi, where environmental pollution is heavy, ENGO development lagged.
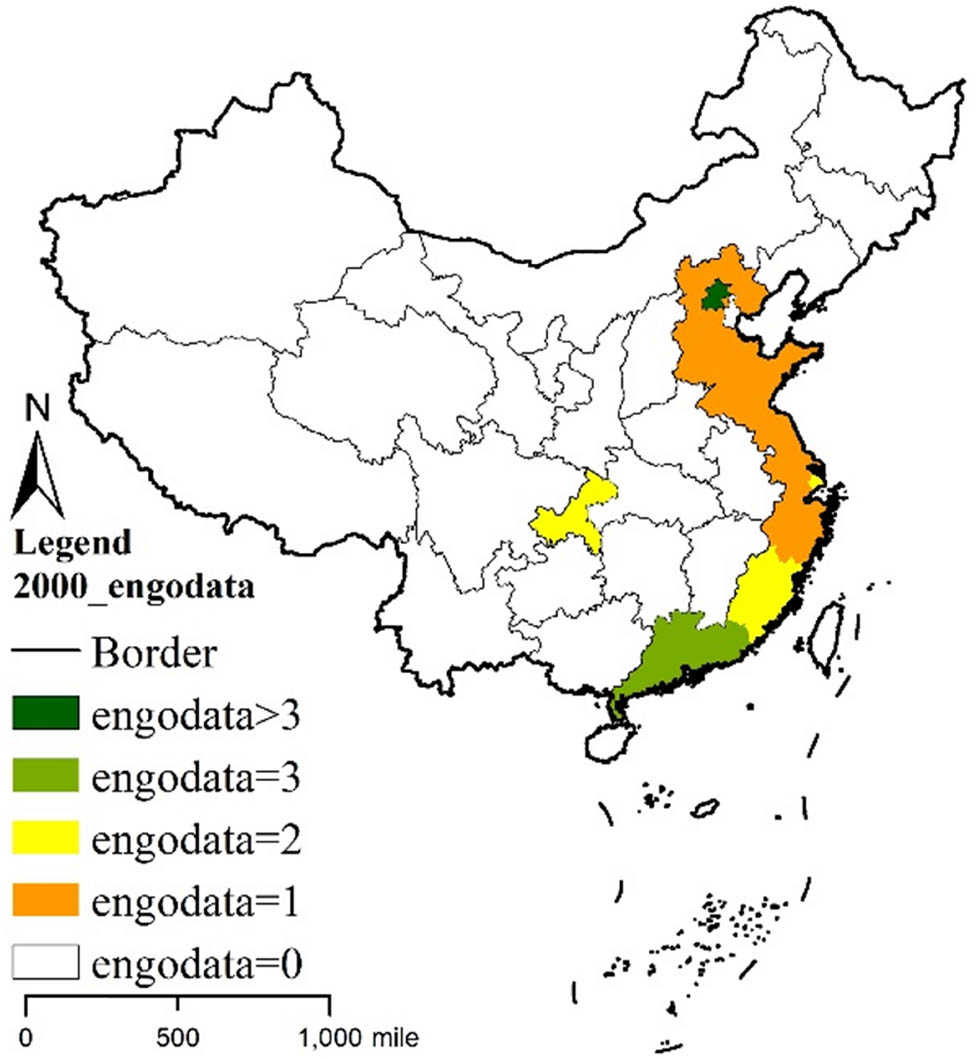
Spatial distribution of the ENGOs’ number of all provinces in 2000.
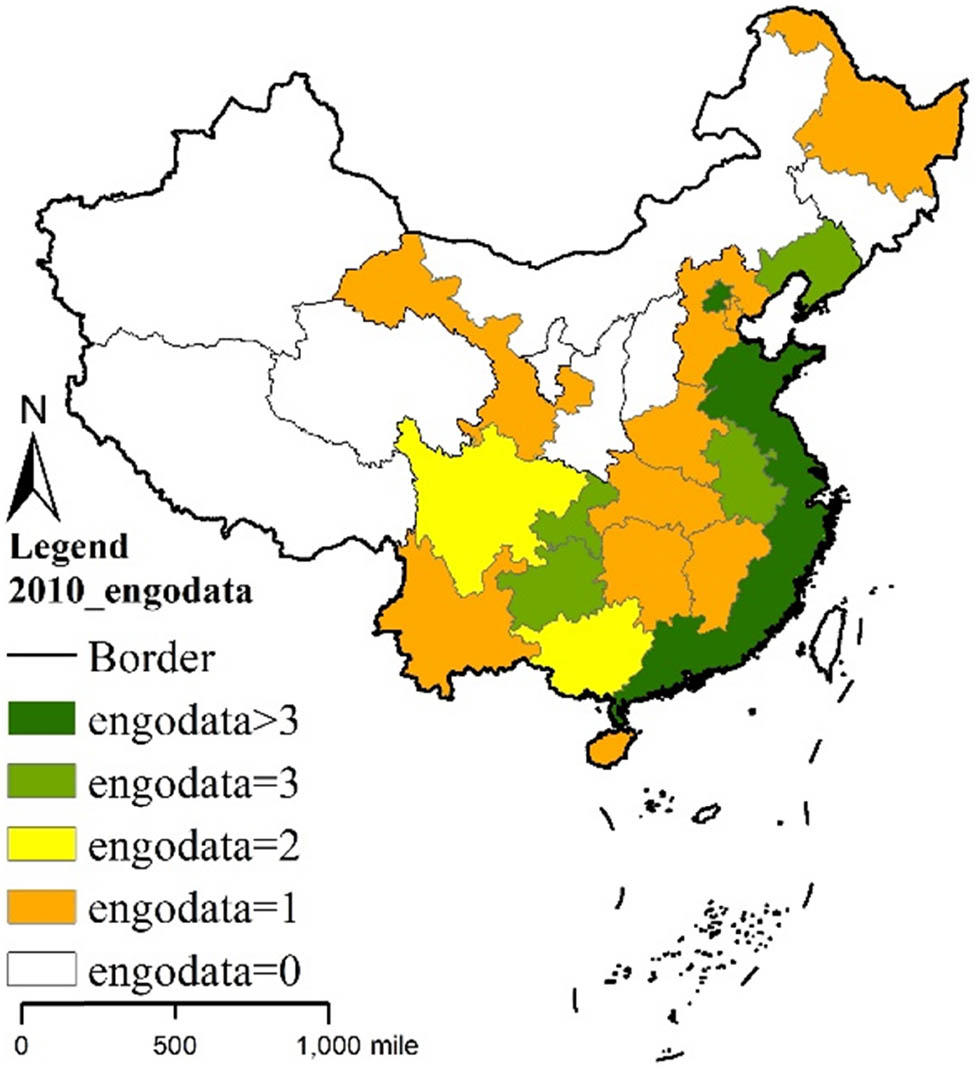
Spatial distribution of the ENGOs’ number of all provinces in 2010.
Figures 4 and 5 reveal the spatial distribution of ENGO employees in all provinces in 2000 and 2010, respectively. By comparing the distribution maps for 2010 and 2000, the regions with the largest number of ENGO employees can be seen to have spread from Beijing to Shandong, including Shanghai, Jiangsu, and Fujian Provinces. In addition, Hebei, Henan, Sichuan, Hubei, Zhejiang, Guangdong, and Guangxi provinces had the most ENGO employees. However, in 2010, Chongqing, Guizhou, and Heilongjiang provinces had relatively fewer employees. In Ningxia, Liaoning, Yunnan, Henan, and Jiangxi provinces, where there was only one ENGO each, the number of ENGO employees was small.
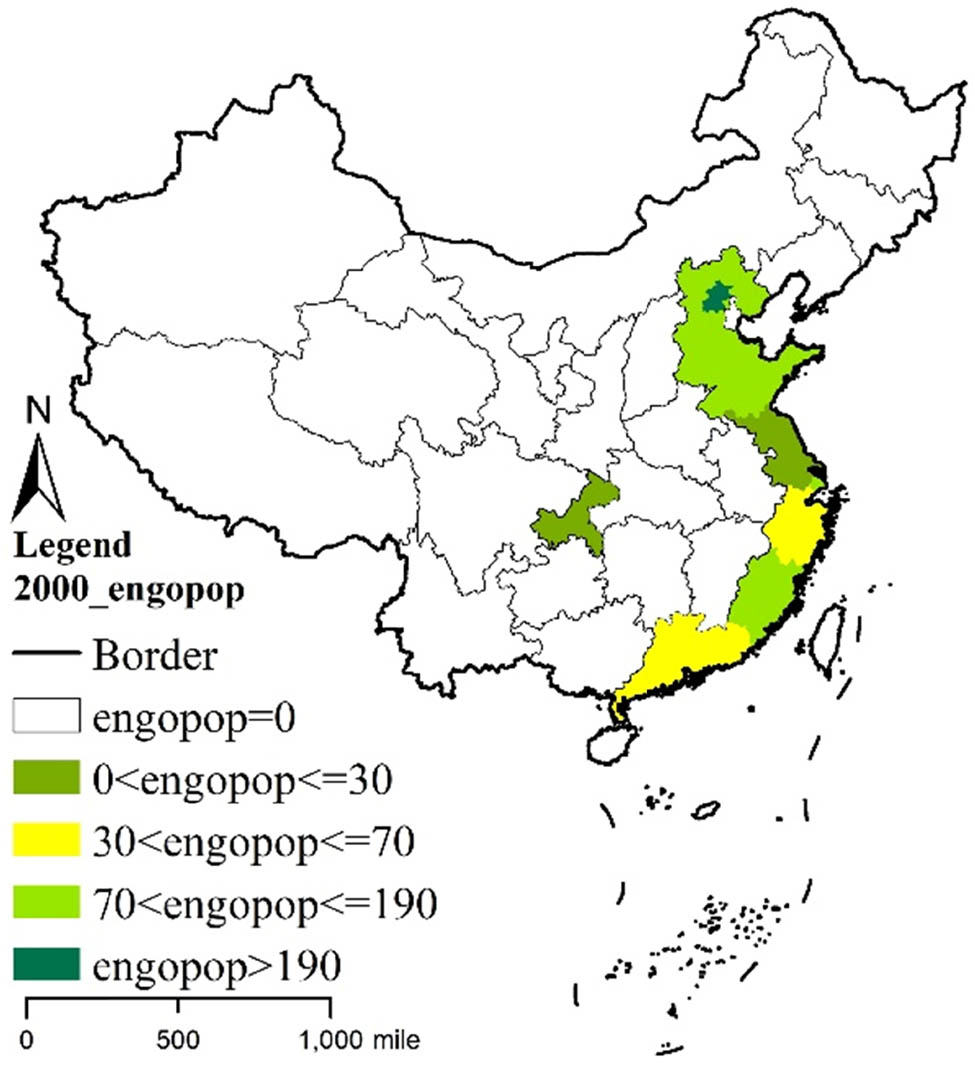
Spatial distribution of the ENGOs’ employees of all provinces in 2000.
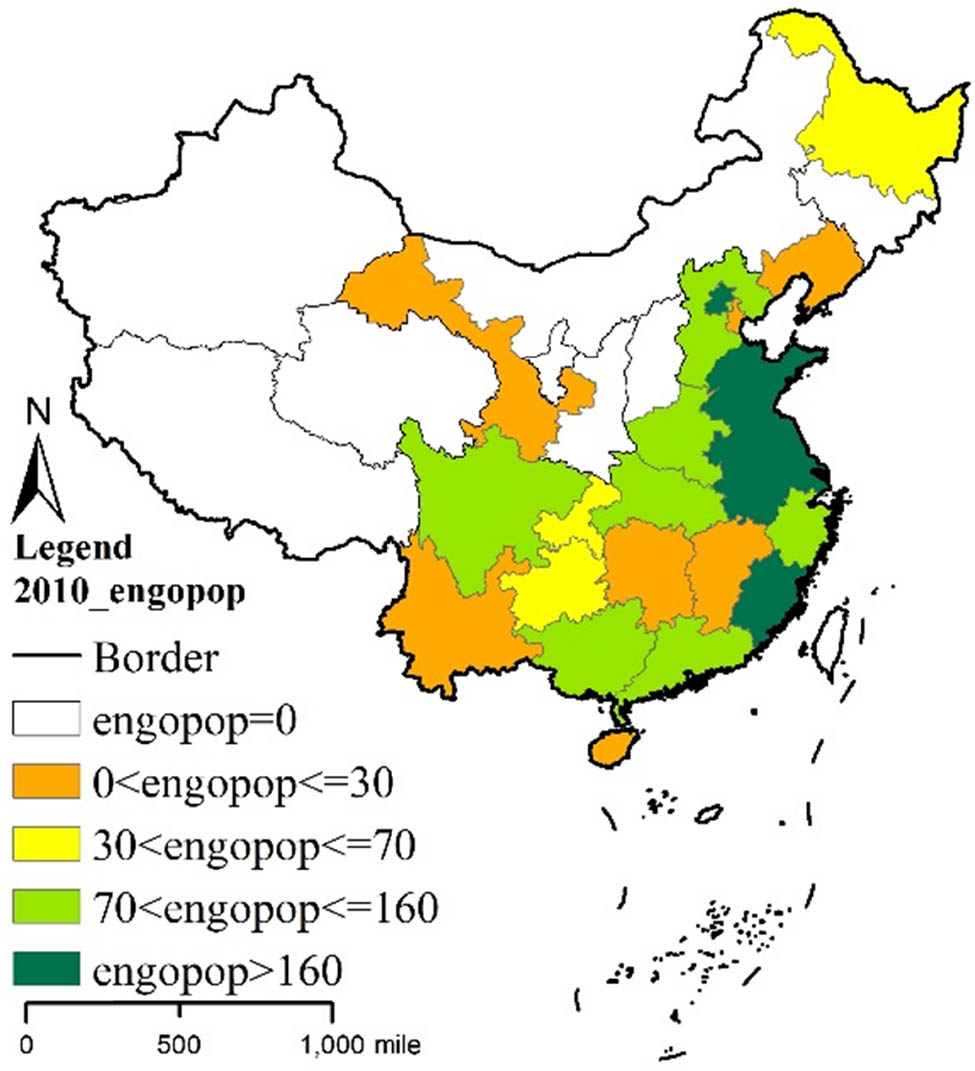
Spatial distribution of the ENGOs’ employees of all provinces in 2010.
3.5 Summary and Data
We structure the variables as follows:
Dependent variables: the employment location quotient for the six polluting industries in a region (
Key explanatory variables: the number of ENGOs (engodata) and the number of ENGO employees (engopop) in a region. Our main estimation strategy follows the same logic as a standard difference-in-differences (DD) strategy. Since not every region always has ENGOs, we use a continuous measure for intensity and thereby capture more variation in the data. It should be especially noted that ENGO development varies considerably across the different parts of China, so we add 1 to each data point and take its logarithm.
In line with the former research, the following variables are used as the main control variables: the natural logarithm of per capita GDP (lnpgdp) and the natural logarithm of per capita GDP squared (lnpgdp2), which indicate the level of economic development; the industrial structure (ind), which is measured by the proportion of the secondary industry; the capital–labor ratio (lncap_lab), which is the ratio of fixed assets to the labor force; foreign direct investment (FDI), which is the ratio of FDI to GDP and is multiplied by 100%; population density (lnden), which is measured by the natural logarithm of the number of people per unit of area; and energy efficiency (en), which is the natural logarithm of electricity consumption per unit of GDP.
In addition, the variables we selected for detecting the underlying mechanisms are as follows: aggregate investment in environmental pollution treatments, investment in urban environmental infrastructure, investment in industrial pollution controls, three simultaneous environmental investments in construction items, and aggregate investment in environmental pollution treatments as a share of GDP. The data for these variables come from the China Environmental Statistical Yearbook (2003–2016). The employment data come from the China Labor Statistical Yearbook (2000–2016). Other control variables are derived from the China Statistical Yearbook and China Regional Economic Statistical Yearbook. Some missing data are estimated by interpolation, while those areas with large amounts of missing data are indicated with a missing value in this paper. Since employment data for each manufacturing sector are at the provincial level only, our final data set includes the 31 provinces in mainland China from 2000 to 2016 and from 2003 to 2016. The descriptive statistics of the main variables are shown in Table 1.
Descriptive statistics of variables
| Variable | Obs. | Mean | Std. dev. | Min | Max |
|---|---|---|---|---|---|
| Dependent variable | |||||
| poll_loc | 527 | 1.067 | 0.544 | 0.003 | 3.128 |
| poll_loc1 | 527 | 1.078 | 0.961 | 0.002 | 7.709 |
| poll_loc2 | 510 | 0.928 | 0.740 | 0.005 | 5.439 |
| poll_loc3 | 493 | 0.840 | 0.887 | 0.000 | 3.831 |
| poll_loc4 | 527 | 0.967 | 0.342 | 0.043 | 2.619 |
| poll_loc5 | 510 | 1.060 | 0.756 | 0.012 | 6.985 |
| poll_loc6 | 527 | 1.172 | 0.747 | 0.185 | 10.348 |
| Key explanatory variable | |||||
| engodata | 527 | 3.154 | 6.564 | 0 | 61 |
| engopop | 527 | 2.977 | 2.496 | 0 | 8.226 |
| lnengopop | 527 | 2.977 | 2.496 | 0 | 8.226 |
| lnengodata | 527 | 0.897 | 0.911 | 0 | 3.127 |
| Control variable | |||||
| lnpgdp | 527 | 8.815 | 1.218 | 3.769 | 11.300 |
| lnpgdp2 | 527 | 79.193 | 20.673 | 22.743 | 127.699 |
| ind | 527 | 45.310 | 8.193 | 19.262 | 60.133 |
| lncap_lab | 527 | 0.806 | 0.454 | 0.254 | 3.351 |
| fdi | 527 | 2.301 | 2.356 | 0.001 | 13.652 |
| lnden | 527 | 5.269 | 1.464 | 0.723 | 8.245 |
| en | 527 | 0.128 | 0.081 | 0.037 | 0.521 |
Notes: poll_loc represents total location quotient of polluting industry, poll_loc1-poll_loc6, respectively, represent location quotient of Mining Industry; Papermaking; Chemical Fiber Manufacturing; Nonmetal Mineral Products; Smelting & Processing of Ferrous Metal; Production & Supply of Electric Power.
4 Results
4.1 Benchmark Regression
Table 2 reports the benchmark regression results based on equations (1) and (2). All four models are estimated by controlling for time-fixed effects, and the models’ F-test values are greater than 3, indicating that the models have reached a significance level of 1% or better. In column (1), we estimate the single impact of engodata on the total polluting industrial location quotient (
Benchmark regression results for the entire sample
| EV | DV: poll_loc | |||
|---|---|---|---|---|
| (1) | (2) | (3) | (4) | |
| lnengodata | −0.014*** | −0.012*** | ||
| (0.004) | (0.004) | |||
| lnengopop | −0.028*** | −0.028*** | ||
| (0.008) | (0.008) | |||
| lnpgdp | 0.613** | 0.644*** | ||
| (0.242) | (0.237) | |||
| lnpgdp2 | −0.039*** | −0.039*** | ||
| (0.009) | (0.009) | |||
| indstr | −0.008* | −0.009** | ||
| (0.004) | (0.004) | |||
| lncap_lab | 0.090* | 0.102** | ||
| (0.052) | (0.052) | |||
| fdi | −0.021*** | −0.021*** | ||
| (0.008) | (0.008) | |||
| lnden | 0.172 | 0.194 | ||
| (0.211) | (0.211) | |||
| en | −2.498*** | −2.504*** | ||
| (0.588) | (0.584) | |||
| Region-fixed effect | Y | Y | Y | Y |
| Time-fixed effect | Y | Y | Y | Y |
| F-test | 3.571 | 5.286 | 3.665 | 5.527 |
| (p-value) | [0.000] | [0.000] | [0.000] | [0.000] |
| R-squared | 0.112 | 0.212 | 0.115 | 0.219 |
Notes: The estimated result of the constant term is not presented, with a sample size of 527. The numbers in parenthesis are robust standard errors; P values are in square bracket; *, **, and *** represent 10, 5, and 1% significant levels, respectively. DV stands for dependent variable; EV stands for explanatory variable. The following tables are the same.
The estimation results for the control variables show that when the location quotient of the polluting industries is used as the explained variable, the impact of the overall economic development level exhibits an inverted U-curve similar to an environmental Kuznets curve. As the economy grows in a region, the location quotient of the polluting industries in that region increases first before it decreases, indicating that the share of polluting industries increases because there is no marked preference for the industry at the beginning of the economic development, which leads to environmental deterioration. However, when the region strengthens its environmental regulations and requirements with the development of its economy, its polluting industries decline. In addition, the increase in the proportion of the secondary industry greatly reduces the location quotient of the polluting industries because such an increase is mainly due to nonpolluting industries, an indication that the industrial structure has upgraded in the region, which leads to a decline in the proportion of polluting industries. The capital–labor ratio represents the type of industries, and its increase shows that industry has become more capital intensive, with workers being replaced by machines, so more energy is required and more pollution is generated. The increase in the proportion of foreign investment significantly reduces the location quotient of polluting industries because regions tend to allow cleaner foreign investment, which reduces the importance of polluting industries. Industrial electricity consumption dramatically reduces the proportion of polluting industries because the consumption of electricity indicates that machines are replacing labor, and there is a shift to more advanced industries, which causes the importance of polluting industries to decline. There is no significant relationship between population density and the location quotient of polluting industries.
4.2 Region-based Discussion
The vast territory and the unbalanced marketization of China (eastern China has a higher marketization level than midwestern China) result in remarkable regional differences (Chen et al., 2000), while the development of ENGOs varies significantly among regions (Bebbington, 2004). Therefore, ENGOs have heterogeneous influences on the location quotient of regional polluting industries. We chose 31 provincial-level administrative districts (according to China’s existing administrative system) in the mainland as geographic units and further divided them into two regions: East China, including Liaoning, Beijing, Tianjin, Hebei, Shandong, Jiangsu, Shanghai, Zhejiang, Fujian, Guangdong and Hainan Provinces, and midwestern China, including the remaining 20 provinces. Table 3 reports the estimation results for the above two regions. Columns (1) and (2) show the impact of ENGOs on East China. The results show that both coefficients are significantly positive, indicating that ENGOs have a crowding-out effect on polluting industries in the eastern region, which leads to a decline in the location quotient of total polluting industries in the region. Columns (3) and (4) show the impact of ENGOs on polluting industries in midwestern China. The estimation results show that the coefficients from the two models are neither significant nor different from the previous two, indicating that ENGOs do not significantly reduce the location quotient of polluting industries in these areas. This is caused by the fact that ENGOs in East China are relatively mature and have pushed the polluting industries into midwestern China. In East China, the relationship between the level of economic development and the location quotient of polluting industries follows a significant inverted U-shaped curve, whereas such a curve also exists in midwestern China, it is not significant. Some other control variables are not significant, but the signs on the coefficients are basically consistent with those from the benchmark regression.
Regression results for eastern and Midwestern China
| EV | DV: poll_loc | |||
|---|---|---|---|---|
| Eastern | Midwestern | |||
| (1) | (2) | (3) | (4) | |
| lnengodata | −0.008** | 0.010 | ||
| (0.003) | (0.016) | |||
| lnengopop | −0.016** | −0.031 | ||
| (0.006) | (0.033) | |||
| lnpgdp | 1.089*** | 1.187*** | 0.402 | 0.246 |
| (0.295) | (0.287) | (0.355) | (0.356) | |
| lnpgdp2 | −0.048*** | −0.051*** | −0.021 | −0.013 |
| (0.013) | (0.013) | (0.014) | (0.013) | |
| indstr | 0.003 | 0.001 | −0.016*** | −0.016*** |
| (0.006) | (0.006) | (0.006) | (0.006) | |
| lncap_lab | 0.047 | 0.063 | 0.151 | 0.118 |
| (0.048) | (0.049) | (0.098) | (0.101) | |
| fdi | −0.004 | −0.005 | −0.019 | −0.022* |
| (0.011) | (0.011) | (0.013) | (0.012) | |
| lnden | −0.061 | −0.069 | 0.924** | 0.941** |
| (0.181) | (0.180) | (0.464) | (0.464) | |
| en | 0.947 | 0.682 | −2.753*** | −3.016*** |
| (1.669) | (1.678) | (0.731) | (0.742) | |
| N | 187 | 187 | 340 | 340 |
| Region-fixed effect | Y | Y | Y | Y |
| Time-fixed effect | Y | Y | Y | Y |
| F-test | 3.415 | 3.459 | 3.660 | 3.686 |
| (p-value) | [0.000] | [0.000] | [0.000] | [0.000] |
| R-squared | 0.350 | 0.353 | 0.274 | 0.275 |
*, **, and *** represent 10%, 5%, and 1% significant level, respectively.
4.3 Robustness Check
The fact that some areas suffer from substantial missing data at the provincial level and the number of employees in the polluting industries in those regions is relatively low may lead to inaccuracy in our estimation. Therefore, robustness tests are conducted in this section, in which observations from four regions, i.e., Tibet, Qinghai, Xinjiang, and Inner Mongolia Provinces were deleted for re-estimation. Table 4 reports the estimation results from the full samples and the subsamples. The first three columns present the impact of engodata on the polluting industries’ location quotient (poll_loc). The coefficients for the whole sample and for the eastern region are significantly negative and lower than those from the baseline regression, indicating that the estimation results are affected by the sample composition. For the midwestern China subsample, the estimated coefficient is positive but not significant. Once again, the results verify that in the full and eastern region samples, ENGOs have a crowding-out effect on polluting industries, an effect that does not exist in midwestern China, indicating that the midwest has become a pollution haven.
Results of robustness check
| EV | DV: poll_loc | |||||
|---|---|---|---|---|---|---|
| Entire sample | Eastern | Midwestern | Entire sample | Eastern | Midwestern | |
| (1) | (2) | (3) | (4) | (5) | (6) | |
| lnengodata | −0.009** | −0.008** | 0.040 | |||
| (0.004) | (0.003) | (0.035) | ||||
| lnengopop | −0.016** | −0.021*** | 0.028 | |||
| (0.006) | (0.007) | (0.032) | ||||
| lnpgdp | 0.773*** | 1.089*** | 0.489 | 1.187*** | 0.815*** | 0.317 |
| (0.279) | (0.295) | (0.467) | (0.287) | (0.273) | (0.469) | |
| lnpgdp2 | −0.057*** | −0.048*** | −0.042** | −0.051*** | −0.058*** | −0.028 |
| (0.011) | (0.013) | (0.021) | (0.013) | (0.011) | (0.021) | |
| indstr | −0.003 | 0.003 | −0.009 | 0.001 | −0.004 | −0.011 |
| (0.004) | (0.006) | (0.007) | (0.006) | (0.004) | (0.007) | |
| lncap_lab | 0.075 | 0.047 | 0.116 | 0.063 | 0.085* | 0.108 |
| (0.048) | (0.048) | (0.093) | (0.049) | (0.048) | (0.098) | |
| fdi | −0.016** | −0.004 | 0.003 | −0.005 | −0.016** | −0.004 |
| (0.007) | (0.011) | (0.012) | (0.011) | (0.007) | (0.012) | |
| lnden | 0.108 | −0.061 | 1.010** | −0.069 | 0.128 | 0.863* |
| (0.196) | (0.181) | (0.464) | (0.180) | (0.195) | (0.470) | |
| en | −1.466* | 0.947 | −2.062* | 0.682 | −1.399* | −2.280** |
| (0.748) | (1.669) | (1.068) | (1.678) | (0.744) | (1.080) | |
| N | 459 | 187 | 272 | 187 | 459 | 272 |
| Region-fixed effect | Y | Y | Y | Y | Y | Y |
| Time-fixed effect | Y | Y | Y | Y | Y | Y |
| F-test | 3.135 | 3.415 | 3.047 | 3.459 | 3.324 | 3.687 |
| (p-value) | [0.000] | [0.000] | [0.000] | [0.000] | [0.000] | [0.000] |
| R-squared | 0.196 | 0.350 | 0.295 | 0.353 | 0.203 | 0.276 |
*, **, and *** represent 10%, 5%, and 1% significant level, respectively.
The last three columns present the impact of engopop on the polluting industrial location quotient (poll_loc). The results show that in the full sample and the eastern sample, the coefficients on the core explanatory variables are highly and significantly negative, but they are not significant in the midwestern sample. The six models all verify that ENGOs have a significant crowding-out effect on polluting industries in the full sample and the eastern region, while midwestern China has received some of the polluting industries from the eastern region and has become a refuge for polluting industries. The estimation results for the other control variables are in line with the estimation results from the benchmark regression and the previous regional regression, so they are not repeated here.
4.4 Industry-based Discussion
While the first three sections of this chapter mainly examine the total effects of polluting industries, this section considers the effect of each polluting industry individually. The variables poll_loc1-poll_loc6 represent the location quotient for mining, papermaking, chemical fiber manufacturing, nonmetallic mineral products, the smelting and processing of ferrous metals, and the production and supply of electric power, respectively. Table 5 reports the estimation results for the six polluting industries. The results show that engodata has a negative influence on the six polluting industries, while only in columns (2), (3), and (5) are the coefficients significantly negative, indicating that engodata has a negative impact on the location quotients of the following three industries: papermaking, chemical fiber manufacturing, and the smelting and processing of ferrous metals.
Regression results for six polluting industries (engodata)
| EV | DV | |||||
|---|---|---|---|---|---|---|
| poll_loc1 | poll_loc2 | poll_loc3 | poll_loc4 | poll_loc5 | poll_loc6 | |
| (1) | (2) | (3) | (4) | (5) | (6) | |
| lnengodata | −0.010 | −0.013* | −0.020** | −0.005 | −0.038*** | −0.009 |
| (0.008) | (0.007) | (0.010) | (0.004) | (0.008) | (0.010) | |
| lnpgdp | 0.823* | −0.246 | 0.281 | −0.065 | −1.118** | 1.796*** |
| (0.461) | (0.411) | (0.612) | (0.226) | (0.471) | (0.548) | |
| lnpgdp2 | −0.064*** | 0.030* | −0.003 | 0.015* | 0.035* | −0.089*** |
| (0.017) | (0.017) | (0.027) | (0.008) | (0.019) | (0.020) | |
| indstr | −0.011 | −0.002 | −0.002 | −0.002 | −0.002 | −0.011 |
| (0.008) | (0.007) | (0.010) | (0.004) | (0.008) | (0.010) | |
| lncap_lab | −0.103 | −0.214** | 0.227* | 0.038 | 0.213** | 0.058 |
| (0.099) | (0.085) | (0.120) | (0.048) | (0.097) | (0.117) | |
| fdi | −0.018 | −0.010 | −0.030 | −0.011 | −0.025* | 0.008 |
| (0.015) | (0.013) | (0.018) | (0.007) | (0.015) | (0.018) | |
| lnden | 0.294 | −0.546 | −0.834* | 0.321 | −0.068 | −0.015 |
| (0.402) | (0.346) | (0.497) | (0.197) | (0.396) | (0.478) | |
| en | −3.987*** | 6.750*** | 2.539* | 1.624*** | 1.829 | −3.587*** |
| (1.118) | (0.984) | (1.416) | (0.547) | (1.128) | (1.330) | |
| N | 527 | 510 | 493 | 527 | 510 | 527 |
| Region-fixed effect | Y | Y | Y | Y | Y | Y |
| Time-fixed effect | Y | Y | Y | Y | Y | Y |
| F-test | 2.931 | 3.051 | 1.080 | 1.264 | 2.138 | 3.817 |
| (p-value) | [0.000] | [0.000] | [0.311] | [0.212] | [0.045] | [0.000] |
| R-squared | 0.130 | 0.176 | 0.056 | 0.060 | 0.101 | 0.163 |
*, **, and *** represent 10%, 5%, and 1% significant level, respectively.
The impact of ENGOs on the other three industries, i.e., mining, nonmetallic mineral products, and the production and supply of electric power, is not significant. This may be because ENGOs have not closely monitored these three industries. First, compared with the other industries, the mining industry is not located in the center of a region, while ENGOs mainly serve urban areas or key cities. Then, the nonmetallic mineral products industry is dominated by cement production and includes glass, ceramics, gypsum, and other manufacturing industries, which are critical polluting enterprises that are often relatively evasive and difficult to supervise. Last, the supply of electric power mainly refers to thermal power plants and heating companies, which are industries that face rigid demand due to regional economic development and are mostly state-owned enterprises. In conclusion, ENGOs have relatively weak supervisory power over these companies, but their negative impact remains.
Table 6 reveals the impact of engopop on each polluting industry. The results show that engopop has a negative impact on every polluting industry, but its negative impact is significant on papermaking, chemical fiber manufacturing, and the smelting and processing of ferrous metals. Although the other coefficients fail to reach a significance level of 10%, the t values in columns (1) and (4) are both above 1.5; that is, the two models are significant within the 20% level. This indicates that engopop reduces the location quotients of the six polluting industries, causing a crowding-out effect that makes these industries relocate to regions with laxer environmental regulations.
Regression results for six polluting industries (engopop)
| EV | DV | |||||
|---|---|---|---|---|---|---|
| poll_loc1 | poll_loc2 | poll_loc3 | poll_loc4 | poll_loc5 | poll_loc6 | |
| (1) | (2) | (3) | (4) | (5) | (6) | |
| lnengopop | −0.023 | −0.009*** | −0.016** | −0.012 | −0.072*** | −0.016 |
| (0.015) | (0.03) | (0.08) | (0.008) | (0.015) | (0.018) | |
| lnpgdp | 0.854* | −0.388 | 0.057 | −0.054 | −0.935** | 1.844*** |
| (0.452) | (0.405) | (0.602) | (0.221) | (0.462) | (0.538) | |
| lnpgdp2 | −0.064*** | 0.035** | 0.005 | 0.014* | 0.029 | −0.091*** |
| (0.016) | (0.017) | (0.026) | (0.008) | (0.019) | (0.020) | |
| indstr | −0.012 | −0.003 | −0.003 | −0.002 | −0.004 | −0.012 |
| (0.008) | (0.007) | (0.010) | (0.004) | (0.008) | (0.010) | |
| lncap_lab | −0.093 | −0.216** | 0.223* | 0.043 | 0.243** | 0.065 |
| (0.099) | (0.085) | (0.121) | (0.048) | (0.097) | (0.118) | |
| fdi | −0.018 | −0.012 | −0.033* | −0.011 | −0.023 | 0.009 |
| (0.015) | (0.013) | (0.018) | (0.007) | (0.015) | (0.018) | |
| lnden | 0.311 | −0.511 | −0.782 | 0.331* | −0.047 | −0.012 |
| (0.402) | (0.347) | (0.499) | (0.197) | (0.396) | (0.479) | |
| en | −3.987*** | 6.633*** | 2.352* | 1.620*** | 1.898* | −3.565*** |
| (1.116) | (0.986) | (1.419) | (0.546) | (1.126) | (1.328) | |
| N | 527 | 510 | 493 | 527 | 510 | 527 |
| Region-fixed effect | Y | Y | Y | Y | Y | Y |
| Time-fixed effect | Y | Y | Y | Y | Y | Y |
| F-test | 2.965 | 3.913 | 0.940 | 1.309 | 2.182 | 3.814 |
| (p-value) | [0.000] | [0.000] | [0.343] | [0.1320] | [0.041] | [0.000] |
| R-squared | 0.131 | 0.171 | 0.049 | 0.062 | 0.103 | 0.162 |
*, **, and *** represent 10%, 5%, and 1% significant level, respectively.
4.5 Endogeneity Discussion
Endogeneity is an unavoidable issue in this article. Due to the continuous DID method used in this article, it can alleviate endogeneity issues to a certain extent, but it cannot fundamentally solve endogeneity problems. This article discusses endogeneity issues through the following strategies.
Lag of core explanatory variables: By lagging core explanatory variables (engopop and engodata) by one and two periods, it helps mitigate potential simultaneity bias. After changing the lagging variables, the results are still valid. These results indicate that the model has some robustness.
Parallel trend test and Placebo Tests: In the traditional DID model, the parallel trend hypothesis is the key, which requires that the processing group and the control group have the same trend before processing, while in our article, the continuous DID model may not be able to use traditional parallel trend tests.
In the continuous difference-difference (DID) model, the parallel trend hypothesis is a key premise for efficient estimation. This assumption requires that the processing group and the control group should have the same trend before the processing occurs. If this hypothesis is satisfied, then any observed change in the outcome after processing can reasonably be attributed to the processing itself, rather than other unobserved factors.
For traditional DID models, parallel trend testing usually involves comparing the differences between the treatment group and the control group before and after the treatment. However, in a continuous DID model, since processing changes on a continuous time scale, traditional parallel trend tests may not be applicable. This is because in continuous DID, it is difficult to define a clear “before” and “after” time period, because the processing effects may appear gradually.
Because the method of parallel trend test of continuous DID model is not mature, this test is not carried out in this paper. This means that the parallel trend hypothesis cannot be directly tested. Accordingly, placebo tests are difficult to perform because they often rely on being able to define a spurious processing time point and then check for the presence of a treatment effect before and after that time point.
4.6 External Validity
When discussing performance assessments of the economic relocation effects of ENGOs, external validity refers to the extent to which research findings can be generalized outside the study context. In other words, it concerns the universality of the findings. When assessing the economic relocation effects of ENGOs, this article considers how changes in the policy/industry context over time affect these relationships.
The following are some of the factors and consideration points that may influence the external validity of the performance assessment of ENGOs’ economic relocation effects and how these relationships change with changing policy/industry contexts:
Geographical and cultural differences: Different regions may have different cultures, values, and levels of environmental awareness, which can affect ENGOs’ operational efficiency and relocation decisions.
Policy environment: Policies such as tax incentives, subsidies, or other incentives may be different in different regions and at different times, which can affect the cost-benefit analysis of ENGO relocation.
Laws and regulations: Environmental regulations and land use laws may vary significantly in different regions and at different times, affecting ENGOs’ strategic choices and the effectiveness of their actions.
Economic conditions: Factors such as regional economic conditions such as GDP, employment rate, and economic diversity can affect ENGOs’ funding sources and the effect of relocation.
Technological developments: Technological advances could change the way ENGOs operates, for example, by reducing operating costs through improved energy efficiency or increasing its reach through social media.
Organizational maturity: More established ENGOs may have more resources and a greater ability to adapt to policy changes, while emerging organizations may have limited strategies and resources.
Global dynamics: International treaties and agreements, as well as changes in the global environmental agenda, can affect domestic policies and ENGOs’ framework for action.
Social attitudes and behavioral patterns: Changes in the level of public concern about environmental issues and behavioral habits, such as increased recycling, may also affect ENGOs’ strategy and effectiveness.
Funding flow: Changes in the source and amount of funding, including private donations, government grants, and international funding, can affect ENGOs’ relocation decisions and subsequent operations.
Data access and quality: The accessibility and quality of data can change over time, which affects the accuracy of long-term follow-up studies and performance evaluations.
5 Mechanism Analysis
Based on the above analysis and equations (3) and (4), ENGOs have an impact on investments in regional environmental governance. Therefore, based on equations (3) and (4), this section introduces the interaction terms between ENGOs and environmental governance investment to conduct a mechanism analysis, which consists of two parts. The first is a test of the interaction between engodata and environmental governance investment. Table 7 reveals the estimation results that show that when the interaction term is added, the original coefficients on engodata are no longer significant, while the coefficients of its interactions become significantly negative. First, the natural logarithm of the total environmental investment in each province was used to measure the investment in environmental governance (lnei).
Mechanism analysis results (engodata)
| EV | DV: poll_loc | |||
|---|---|---|---|---|
| (1) | (2) | (3) | (4) | |
| lnengodata | 0.057 | 0.024 | 0.005 | −0.000 |
| (0.047) | (0.017) | (0.009) | (0.010) | |
| lnei × lnengodata | −0.009** | |||
| (0.004) | ||||
| lncityei × lnengodata | −0.004** | |||
| (0.002) | ||||
| lnind_ei × lnengodata | −0.004** | |||
| (0.002) | ||||
| lnthr_ei × lnengodata | −0.001* | |||
| (0.000) | ||||
| N | 372 | 372 | 372 | 372 |
| Control variable | Y | Y | Y | Y |
| Region-fixed effect | Y | Y | Y | Y |
| Time-fixed effect | Y | Y | Y | Y |
| F test | 3.372 | 3.283 | 3.154 | 3.068 |
| (p-value) | [0.000] | [0.000] | [0.000] | [0.000] |
| R-squared | 0.214 | 0.211 | 0.206 | 0.202 |
*, **, and *** represent 10%, 5%, and 1% significant level, respectively.
Total environmental investment refers to the sum of all financial resources allocated towards activities and projects aimed at improving, protecting, or maintaining the quality of the environment. This can include investments in pollution control, renewable energy, waste management, water treatment, conservation of natural habitats, and other initiatives that contribute to environmental sustainability. In this article, the variable of total environmental investment in each province includes three parts: the investment of urban environmental infrastructure construction, the investment of old industrial pollution sources, and the investment of environmental protection after the completion of construction projects. The data source is the Annual Report of Ecological and Environmental Statistics of China. The vacancy is filled by the interpolation method and ARIMA filling method.
Column (1) reports the interaction effect between engodata and environmental investment, with a coefficient of −0.009, which is significant at the 5% level. Second, the natural logarithm of urban environmental governance investment is used to measure environmental governance investment (lncityei), Column (2) reveals the interaction effect between engodata and investment in urban environmental governance; Third, the natural logarithm of industrial environmental governance investment is used to measure environmental governance investment (lnind_ei), column (3) reveals the interaction effect between engodata and investment in industrial environmental governance: both coefficients are equal to −0.004 at a significance level of 5%; Fourth, the natural logarithm of environmental protection investment in the “three simultaneities” of construction projects is used to measure environmental governance investment (thr_ei); column (4) reports the interaction effect between three simultaneous environmental investments in construction items and engodata, with a coefficient of −0.001 at a significance level of 10%. All four models indicate that engodata affects the location quotient of polluting industries through environmental governance investments. Since the four models are all investigated with the full sample, the coefficients on the other control variables are basically consistent with the estimated results from the benchmark regression.
The second part is a test of the interaction between engopop and environmental governance investments. Table 8 reveals the following estimation results. The coefficients on engopop in the four models are all negative but not significant, while the coefficients on its interactions are all significantly negative. Column (1) reports the interaction effect between engopop and total environmental investment, with a coefficient of −0.003 at a significance level of 10%. Column (2) reveals the interaction effect between engopop and investment in urban environmental governance, with a coefficient of −0.002 at a significance level of 5%. Column (3) reveals the interaction effect between engopop and investment in industrial environmental governance, with a coefficient of −0.007 at a significance level of 5%. Column (4) reveals the interaction effect between engopop and three simultaneous environmental investments in construction items, with a coefficient of −0.004 at a significance level of 5%. In addition, the coefficients on the other control variables are in line with the estimated results from the benchmark regression.
Mechanism analysis results (engopop)
| EV | DV: poll_loc | |||
|---|---|---|---|---|
| (1) | (2) | (3) | (4) | |
| lnengopop | −0.028 | −0.032 | −0.006 | −0.016 |
| (0.051) | (0.040) | (0.014) | (0.017) | |
| lnei × lnengopop | −0.003* | |||
| (0.001) | ||||
| lncityei × lnengopop | −0.002** | |||
| (0.000) | ||||
| lnind_ei × lnengopop | −0.007** | |||
| (0.003) | ||||
| lnthr_ei × lnengopop | −0.004** | |||
| (0.002) | ||||
| N | 372 | 372 | 372 | 372 |
| Control variable | Y | Y | Y | Y |
| Region-fixed effect | Y | Y | Y | Y |
| Time-fixed effect | Y | Y | Y | Y |
| F test | 3.465 | 3.503 | 3.583 | 3.428 |
| (p-value) | [0.000] | [0.000] | [0.000] | [0.000] |
| R-squared | 0.209 | 0.210 | 0.213 | 0.207 |
*, **, and *** represent 10%, 5%, and 1% significant level, respectively.
The analysis results for the two sets of mechanisms indicate that ENGOs reduce the agglomeration of polluting industries by affecting investment in environmental governance, causing these industries to relocate or upgrade and thereby reducing their employment location quotient. Unfortunately, due to the limitations in the available data, more in-depth mechanisms cannot be explored in this article. By increasing in number and expanding their scale, ENGOs exert an influence on polluting firms by providing environmental supervision, information disclosure, environmental education, environmental litigation, etc., causing polluting firms to lose credibility and close their plants or relocate to other areas under pressure. Furthermore, through a series of environmental activities, ENGOs enable companies to increase their investment in environmental governance and enable the government to enhance its formal environmental regulations. Therefore, polluting industries reduce their scale of production in the face of pressure from both the government and enterprises and eventually withdraw from the market.
6 Conclusions
This article focuses on the economic relocation effects of ENGOs. First, as industrial relocation refers to the spatial–temporal changes in an industrial location, it is difficult to identify in the data. We construct a relocation index, i.e., the industrial location quotient, to investigate the extent to which polluting industries relocate. Any decrease in the index indicates that the competitiveness of an industry in the region has fallen compared with the national average, meaning that this industry has relocated to other areas.
Second, by investigating the impact of ENGOs on the location quotients of polluting industries, ENGOs are found to have a significant negative impact on the overall location quotient of the six polluting industries, indicating that an increase in the number of ENGOs or ENGO employees affects the polluting industries through their active environmental governance and their activities in the target region.
Third, through regressions analyzing the different polluting industries, the growth of ENGOs is found to have a negative impact on all polluting industries. However, the relocation effect is only significant in papermaking, chemical fiber manufacturing, smelting and processing of ferrous metals, not in Mining, nonmetallic mineral products, production and supply of electric power industries. This indicates that the economic relocation effect of ENGOs is heterogeneous across industries, with more significant effects on industries that pollute more and can relocate more easily. The underlying reasons for this industrial heterogeneity may be that mining cannot be easily relocated, the pollution from nonmetallic mineral products is relatively inconspicuous, and the production and supply of electric power are essential to life; hence, the relocation effect of ENGOs is not clearly observable.
Fourth, the mechanism analysis reveals that ENGOs exert their economic relocation effects by increasing the environmental investments of polluting industries and enterprises. The growth of ENGOs, including in number and in employees, could enhance their supervisory power over polluting enterprises and motivate governments to engage in environmental treatments. Both channels could increase production costs for polluting companies and encourage them to relocate their pollution to other areas.
Hence, this article is consistent with Chen et al. (2018), who found that the relocation of the chemical and rubber industry and the machinery manufacturing industry had a markedly positive role in industrial land use efficiency. However, the relocation effect of ENGOs in the nonmetallic mineral manufacturing industry is not significant due to the industry’s lower pollution intensity.
This article supports the findings of Li and Wang (2020) that formal environmental regulation does not necessarily lead to the relocation of pollution-intensive industries due to differences in pollutant generation factors and relocation costs. We found that essential considerations of informal regulations, such as those provided by ENGOs, should be included in policy-making related to industrial relocation.
We also supplement the findings of Gidron (2014) and Yu and Chen (2018) that the motivational and supervisory effects of ENGOs on governments and enterprises are more significant in more market-oriented areas, as was the case for the relocation effect in our study. Hence, the facilitation of marketization for ENGOs is conducive to their distinctive role in this green redistribution. However, whether such a relocation effect from ENGOs is helpful for increasing total welfare still needs to be further studied in the future.
However, this article also has the following shortcomings: first, the measurement of industrial transfer is relatively simple and cannot clearly define where a certain industry is transferred from; Second, the statistics on ENGOs are not complete, leading to measurement errors in ENGOs. The next direction for further research can start from the bilateral relationship of industrial transfer, such as measuring industrial transfer through listed companies investing in different regions. At the same time, case studies and other methods can be used to study the specific impact of ENGOs on industrial transfer.
-
Funding information: Authors state no funding involved.
-
Conflict of interest: Authors state no conflict of interest.
-
Data availability statement: The data that support the findings of this study are available on request from the corresponding author upon reasonable request.
-
Article note: As part of the open assessment, reviews and the original submission are available as supplementary files on our website.
References
Anderson, S. E., Buntaine, M. T., Liu, M., & Zhang, B. (2019). Non-governmental monitoring of local governments increases compliance with central mandates: A national-scale field experiment in China. American Journal of Political Science, 63(3), 626–643.Search in Google Scholar
Bebbington, A. (2004). NGOs and uneven development: geographies of development intervention. Progress in Human Geography, 28(6), 725–745.Search in Google Scholar
Betsill, M. M., & Corell, E. (2008). NGO diplomacy: The Influence of Nongovernmental Organizations in International Environmental Negotiations. Cambridge, MA: MIT Press.Search in Google Scholar
Chen, W., Shen, Y., Wang, Y., & Wu, Q. (2018). The effect of industrial relocation on industrial land use efficiency in China: A spatial econometrics approach. Journal of Cleaner Production, 205, 525–535.Search in Google Scholar
Chen, Z., Xie, S., & Siquan, Z. (2000). The extent of marketization of economic systems in China. Nova Publishers.Search in Google Scholar
Dauvergne, P., & Lister, J. (2012). Big brand sustainability: Governance prospects and environmental limits. Global Environmental Change, 22(1), 36–45.Search in Google Scholar
Dechezleprêtre, A., & Sato, M. (2017). The impacts of environmental regulations on competitiveness. Review of Environmental Economics and Policy, 11(2), 183–206.Search in Google Scholar
Féres, J., & Reynaud, A. (2012). Assessing the impact of formal and informal regulations on environmental and economic performance of Brazilian manufacturing firms. Environmental Resource Economics, 52(1), 65–85.Search in Google Scholar
Gidron, B. (2014). Market-oriented social enterprises employing people with disabilities: A participants’ perspective. Journal of Social Entrepreneurship, 5(1), 60–76.Search in Google Scholar
Grano, S. A. (2012). Green activism in Red China: The role of Shanghai’s ENGOs in influencing environmental politics. Journal of Civil Society, 8(1), 39–61.Search in Google Scholar
Gunningham, N., Kagan, R. A., & Thornton, D. (2004). Social license and environmental protection: why businesses go beyond compliance. Law & Social Inquiry, 29(2), 307–341.Search in Google Scholar
Haris, S. M., Mustafa, F. B., & Raja Ariffin, R. N. (2020). Systematic literature review of climate change governance activities of environmental nongovernmental organizations in Southeast Asia. Environmental Management, 66, 816–825.Search in Google Scholar
Hasan, M. A., Nahiduzzaman, K. M., & Aldosary, A. S. (2018). Public participation in EIA: A comparative study of the projects run by government and non-governmental organizations. Environmental Impact Assessment Review, 72, 12–24.Search in Google Scholar
Heyes, A., Lyon, T. P., & Martin, S. (2018). Salience games: Private politics when public attention is limited. Journal of Environmental Economics and Management, 88(3), 396–410.Search in Google Scholar
Hopkins, M. S., Kruschwitz, N., Haanaes, K., Kong, M. T., Arthur, D., & Reeves, M. (2011). Sustainability: The ‘embracers’ seize advantage. MIT Sloan Management Review, 52(3), 23–35.Search in Google Scholar
Levinson, A., & Taylor, M.S. (2008). Unmasking the pollution haven effect. International Economic Review, 49(1), 223–254Search in Google Scholar
Li, G., He, Q., Shao, S., & Cao, J. (2018a). Environmental non‐governmental organizations and urban environmental governance: Evidence from China. Journal of Environmental Management, 206(1), 1296–1307.Search in Google Scholar
Li, G., Shao, S., & Cao, J. (2018b). Environmental non-governmental organizations and urban environmental governance: Evidence from China. Journal of Environmental Management, 206(1), 1296–1307.Search in Google Scholar
Li, K., Yuan, W., Li, J., & Ai, H. (2021). Effects of time-dependent environmental regulations on air pollution: Evidence from the Changsha-Zhuzhou-Xiangtan region, China. World Development, 138, 105267.Search in Google Scholar
Li, M., & Wang, Q. (2020). Does industrial relocation alleviate environmental pollution? A mathematical economics analysis. Environment, Development and Sustainability, 22, 4673–4698.Search in Google Scholar
Li, R., & Ramanathan, R. (2018). Exploring the relationships between different types of environmental regulations and environmental performance: Evidence from China. Journal of Cleaner Production, 196, 1329–1340.Search in Google Scholar
Lister, J. (2011). Corporate social responsibility and the state: International approaches to forest co-regulation. UBC Press.Search in Google Scholar
Liu, H. (2009). Goal decomposition and structure optimization of marine industry development of Shandong Province. China Population, Resources and Environment, 19(3), 140–145.Search in Google Scholar
Lu, Y. (2007). Environmental civil society and governance in China. International Journal of Environmental Studies, 64(1), 59–69.Search in Google Scholar
MacDonald, C. (2008). Green, Inc: An environmental insider reveals how a good cause has gone bad. Rowman & Littlefield.Search in Google Scholar
Mani, M., & Wheeler, D. (1998). In search of pollution havens? Dirty industry in the world economy, 1960 to 1995. The Journal of Environment & Development, 7(8), 215–247.Search in Google Scholar
McCarthy, J., & Zen, Z. (2010). Regulating the oil palm boom: Assessing the effectiveness of environmental governance approaches to agro‐industrial pollution in Indonesia. Law & Policy, 32(1), 153–179.Search in Google Scholar
McGuire, M. (1982). Regulation, factor rewards, and international trade. Journal of Public Economics, 17(3), 335–353.Search in Google Scholar
Otsuki T., Wilson J., & Sewadeh M. (2004). Saving two in a billion: Quantifying the trade effect of European food safety standards on African exports. Food Policy, 26(5), 495–513.Search in Google Scholar
Ouyang, X, Shao, Q., Zhu, X., He, Q., Xiang, C., & Wei, G. (2019). Environmental regulation, economic growth and air pollution: Panel threshold analysis for OECD countries. Science of The Total Environment, 657, 234–241.Search in Google Scholar
Pargal, S., Hettige, H., Singh, M., & Wheeler, D. (1997). Formal and informal regulation of industrial pollution: Comparative evidence from Indonesia and the United States. The World Bank Economic Review, 11(3), 433–450.Search in Google Scholar
Pargal, S., & Wheeler, D. (1996). Informal regulation of industrial pollution in developing countries. Journal of Political Economy, 104(6), 1314–1327.Search in Google Scholar
Partelow, S, Winkler, K. J., & Thaler, G. M. (2020) Environmental non-governmental organizations and global environmental discourse. PLoS ONE, 15(5), e0232945.Search in Google Scholar
Sharghi, M., Jeong, H., & Afshin, H. (2024). Evaluation of environmental and economic compatibility of different types of segment linings based on the structural performance with some aggravating factors. Tunnelling and Underground Space Technology, 144, 105567.Search in Google Scholar
Sun, D., Zeng, S., Chen, H., Meng, X., & Jin, Z. (2019). Monitoring effect of transparency: How does government environmental disclosure facilitate corporate environmentalism? Business Strategy and the Environment, 28(8), 1594–1607.Search in Google Scholar
Walter, I., & Ugelow, J. L. (1979). Environmental policies in developing countries. Ambio, 8, 102–109.Search in Google Scholar
Wang, M., & Liu, Q. (2009). Analyzing China’s NGO development system. The China Nonprofit Review, 1(1), 5–35.Search in Google Scholar
Wu, H. (2023). Evaluating the role of renewable energy investment resources and green finance on the economic performance: Evidence from OECD economies. Resources Policy, 80, 103149.Search in Google Scholar
Wu, H., Guo, H., Zhang, B., & Bu, M. (2017). Westward movement of new polluting firms in China: Pollution reduction mandates and location choice. Journal of Comparative Economics 45(1), 119–138.Search in Google Scholar
Yin, J., Zheng, M., & Chen, J. (2015). The effects of environmental regulation and technical progress on CO2 Kuznets curve: An evidence from China. Energy Policy, 77(2), 97–108.Search in Google Scholar
Young, N. (2001). Searching for Civil Society: 250 NGOs in China. Hong Kong: China Development Brief.Search in Google Scholar
Yu, J., & Chen, K. (2018). Does nonprofit marketization facilitate or inhibit the development of civil society? A comparative study of China and the USA. VOLUNTAS: International Journal of Voluntary and Nonprofit Organizations, 29(5), 925–937.Search in Google Scholar
Zhang, C., & Guo, Y. Q. (2015). Can pollution-intensive industry transfer achieve win-win development in economy and environment? From the perspective of environmental regulation. Journal of Finance Economics, 41(1), 96–108.Search in Google Scholar
Zhang, C., Zhou, B., Lv, M. Y., & Liu, X. (2017). Has West China development directly or indirectly brought pollution haven? China Population, Resources and Environment, 27(4), 95–101.Search in Google Scholar
Zhang, Y., Imeni, M., & Edalatpanah, S. A. (2023). Environmental dimension of corporate social responsibility and earnings persistence: An exploration of the moderator roles of operating efficiency and financing cost. Sustainability, 15(20), 14814.Search in Google Scholar
© 2024 the author(s), published by De Gruyter
This work is licensed under the Creative Commons Attribution 4.0 International License.
Articles in the same Issue
- Regular Articles
- Political Turnover and Public Health Provision in Brazilian Municipalities
- Examining the Effects of Trade Liberalisation Using a Gravity Model Approach
- Operating Efficiency in the Capital-Intensive Semiconductor Industry: A Nonparametric Frontier Approach
- Does Health Insurance Boost Subjective Well-being? Examining the Link in China through a National Survey
- An Intelligent Approach for Predicting Stock Market Movements in Emerging Markets Using Optimized Technical Indicators and Neural Networks
- Analysis of the Effect of Digital Financial Inclusion in Promoting Inclusive Growth: Mechanism and Statistical Verification
- Effective Tax Rates and Firm Size under Turnover Tax: Evidence from a Natural Experiment on SMEs
- Re-investigating the Impact of Economic Growth, Energy Consumption, Financial Development, Institutional Quality, and Globalization on Environmental Degradation in OECD Countries
- A Compliance Return Method to Evaluate Different Approaches to Implementing Regulations: The Example of Food Hygiene Standards
- Panel Technical Efficiency of Korean Companies in the Energy Sector based on Digital Capabilities
- Time-varying Investment Dynamics in the USA
- Preferences, Institutions, and Policy Makers: The Case of the New Institutionalization of Science, Technology, and Innovation Governance in Colombia
- The Impact of Geographic Factors on Credit Risk: A Study of Chinese Commercial Banks
- The Heterogeneous Effect and Transmission Paths of Air Pollution on Housing Prices: Evidence from 30 Large- and Medium-Sized Cities in China
- Analysis of Demographic Variables Affecting Digital Citizenship in Turkey
- Green Finance, Environmental Regulations, and Green Technologies in China: Implications for Achieving Green Economic Recovery
- Coupled and Coordinated Development of Economic Growth and Green Sustainability in a Manufacturing Enterprise under the Context of Dual Carbon Goals: Carbon Peaking and Carbon Neutrality
- Revealing the New Nexus in Urban Unemployment Dynamics: The Relationship between Institutional Variables and Long-Term Unemployment in Colombia
- The Roles of the Terms of Trade and the Real Exchange Rate in the Current Account Balance
- Cleaner Production: Analysis of the Role and Path of Green Finance in Controlling Agricultural Nonpoint Source Pollution
- The Research on the Impact of Regional Trade Network Relationships on Value Chain Resilience in China’s Service Industry
- Social Support and Suicidal Ideation among Children of Cross-Border Married Couples
- Asymmetrical Monetary Relations and Involuntary Unemployment in a General Equilibrium Model
- Job Crafting among Airport Security: The Role of Organizational Support, Work Engagement and Social Courage
- Does the Adjustment of Industrial Structure Restrain the Income Gap between Urban and Rural Areas
- Optimizing Emergency Logistics Centre Locations: A Multi-Objective Robust Model
- Geopolitical Risks and Stock Market Volatility in the SAARC Region
- Trade Globalization, Overseas Investment, and Tax Revenue Growth in Sub-Saharan Africa
- Can Government Expenditure Improve the Efficiency of Institutional Elderly-Care Service? – Take Wuhan as an Example
- Media Tone and Earnings Management before the Earnings Announcement: Evidence from China
- Review Articles
- Economic Growth in the Age of Ubiquitous Threats: How Global Risks are Reshaping Growth Theory
- Efficiency Measurement in Healthcare: The Foundations, Variables, and Models – A Narrative Literature Review
- Rethinking the Theoretical Foundation of Economics I: The Multilevel Paradigm
- Financial Literacy as Part of Empowerment Education for Later Life: A Spectrum of Perspectives, Challenges and Implications for Individuals, Educators and Policymakers in the Modern Digital Economy
- Special Issue: Economic Implications of Management and Entrepreneurship - Part II
- Ethnic Entrepreneurship: A Qualitative Study on Entrepreneurial Tendency of Meskhetian Turks Living in the USA in the Context of the Interactive Model
- Bridging Brand Parity with Insights Regarding Consumer Behavior
- The Effect of Green Human Resources Management Practices on Corporate Sustainability from the Perspective of Employees
- Special Issue: Shapes of Performance Evaluation in Economics and Management Decision - Part II
- High-Quality Development of Sports Competition Performance Industry in Chengdu-Chongqing Region Based on Performance Evaluation Theory
- Analysis of Multi-Factor Dynamic Coupling and Government Intervention Level for Urbanization in China: Evidence from the Yangtze River Economic Belt
- The Impact of Environmental Regulation on Technological Innovation of Enterprises: Based on Empirical Evidences of the Implementation of Pollution Charges in China
- Environmental Social Responsibility, Local Environmental Protection Strategy, and Corporate Financial Performance – Empirical Evidence from Heavy Pollution Industry
- The Relationship Between Stock Performance and Money Supply Based on VAR Model in the Context of E-commerce
- A Novel Approach for the Assessment of Logistics Performance Index of EU Countries
- The Decision Behaviour Evaluation of Interrelationships among Personality, Transformational Leadership, Leadership Self-Efficacy, and Commitment for E-Commerce Administrative Managers
- Role of Cultural Factors on Entrepreneurship Across the Diverse Economic Stages: Insights from GEM and GLOBE Data
- Performance Evaluation of Economic Relocation Effect for Environmental Non-Governmental Organizations: Evidence from China
- Functional Analysis of English Carriers and Related Resources of Cultural Communication in Internet Media
- The Influences of Multi-Level Environmental Regulations on Firm Performance in China
- Exploring the Ethnic Cultural Integration Path of Immigrant Communities Based on Ethnic Inter-Embedding
- Analysis of a New Model of Economic Growth in Renewable Energy for Green Computing
- An Empirical Examination of Aging’s Ramifications on Large-scale Agriculture: China’s Perspective
- The Impact of Firm Digital Transformation on Environmental, Social, and Governance Performance: Evidence from China
- Accounting Comparability and Labor Productivity: Evidence from China’s A-Share Listed Firms
- An Empirical Study on the Impact of Tariff Reduction on China’s Textile Industry under the Background of RCEP
- Top Executives’ Overseas Background on Corporate Green Innovation Output: The Mediating Role of Risk Preference
- Neutrosophic Inventory Management: A Cost-Effective Approach
- Mechanism Analysis and Response of Digital Financial Inclusion to Labor Economy based on ANN and Contribution Analysis
- Asset Pricing and Portfolio Investment Management Using Machine Learning: Research Trend Analysis Using Scientometrics
- User-centric Smart City Services for People with Disabilities and the Elderly: A UN SDG Framework Approach
- Research on the Problems and Institutional Optimization Strategies of Rural Collective Economic Organization Governance
- The Impact of the Global Minimum Tax Reform on China and Its Countermeasures
- Sustainable Development of Low-Carbon Supply Chain Economy based on the Internet of Things and Environmental Responsibility
- Measurement of Higher Education Competitiveness Level and Regional Disparities in China from the Perspective of Sustainable Development
- Payment Clearing and Regional Economy Development Based on Panel Data of Sichuan Province
- Coordinated Regional Economic Development: A Study of the Relationship Between Regional Policies and Business Performance
- A Novel Perspective on Prioritizing Investment Projects under Future Uncertainty: Integrating Robustness Analysis with the Net Present Value Model
- Research on Measurement of Manufacturing Industry Chain Resilience Based on Index Contribution Model Driven by Digital Economy
- Special Issue: AEEFI 2023
- Portfolio Allocation, Risk Aversion, and Digital Literacy Among the European Elderly
- Exploring the Heterogeneous Impact of Trade Agreements on Trade: Depth Matters
- Import, Productivity, and Export Performances
- Government Expenditure, Education, and Productivity in the European Union: Effects on Economic Growth
- Replication Study
- Carbon Taxes and CO2 Emissions: A Replication of Andersson (American Economic Journal: Economic Policy, 2019)