Bridging Brand Parity with Insights Regarding Consumer Behavior
-
Ömer Turunç


Abstract
Previous research has investigated some of the relationships among brand parity (BP), brand image (BI), brand satisfaction (BS), and brand loyalty (BL). However, there is not a model investigating all of them in a single conceptual model. Based on information processing theory, the first aim of the article is to investigate the important, direct effect relationships among these variables. Moreover, scant information is available regarding the moderating role of BP. Consequently, the second purpose of the study is to test the moderating effect of BP regarding the effect of BI on BL and BS on BL. The data were collected from customers of chain stores in Antalya. The results supported the positive, direct effect of BI on BS and BL, plus BS on BL. There were no direct and moderating effects of BP. Based on the microeconomic behavior of consumers and because of the bounded rationality of consumers, as BP rises, consumers’ decisions are not affected regarding the effect of BI on BL and BS on BL. This is an important insight that brands should consider in terms of points of parity associations that affect consumers’ decision-making process and create a brand-loyal customer base.
1 Introduction
In today’s economy, it is getting harder for a business to attract new consumers and maintain their existing customer base. Branding helps companies differentiate themselves from others and create a sustainable competitive advantage, resulting in a brand-loyal customer base. However, the competition among brands in similar product categories has been increasing, resulting in fewer differences among brands. This phenomenon is called brand parity (BP), where the differences between competing brands in a particular product category start diminishing (Rahman, 2014). As BP increases, it becomes difficult for a company to create a brand-loyal consumer base. From a microeconomics perspective, the consumers’ decision-making is affected by different factors, and if a consumer does not recognize a considerable difference between two brands, the consumer’s switching behavior is likely to rise as the price elasticity for the consumer increases.
Following the above points, it is important to consider other aspects regarding branding. One of the important aspects is brand image (BI). If a company builds a positive BI, customers will become more loyal. Previous research has also found support regarding the positive effect of BI on brand loyalty (BL) (e.g., Alic et al., 2020; Thai et al., 2020). Another important concept is brand satisfaction (BS). There is also previous literature that investigated the relationship between BI and BS (e.g., Alfakih et al., 2022), BS and BL (e.g., Hwang et al., 2021; Mokha, 2021), and BS and BP (e.g., Hwang et al., 2021). Regarding the relationship between BP and BL, there are few contradictory studies in the current literature (e.g., Iyer & Muncy, 2005; Li, 2010). In that sense, there is a gap in the literature because the effect of BP on BL is not understood in the literature clearly; therefore, it is important to conduct a study that investigates these relationships. Based on information processing theory, the first aim of this study is to investigate the relationships among BP, BI, BS, and BL in one conceptual model and test the related relationships. This study includes some direct-effect hypotheses plus two moderating hypotheses. Consequently, the second aim of this study is to test the moderating effect of BP regarding the effect of BI on BL and BS on BL. The moderating effect of BP regarding the above-mentioned effects is understudied in the literature, so this study aims to contribute to the literature accordingly by filling another gap. To that end, the research questions are whether there is direct-effect relationships among BP, BI, BL, and BS and if BP has a moderating effect. The results of the article will both provide value to the literature with possible microeconomic insights based on consumer behavior and to managers regarding their branding strategy. The results will clarify the contradictory findings in the current literature and also guide marketing practitioners. Especially, investigating the moderating effects of BP will provide additional insights to both marketing practitioners and the current literature. One main conclusion from the results of this study is how important it is for companies to build a strong brand, considering important levels of points of parity associations that contribute to a microeconomic view of the consumer by creating a loyal customer base with a predictable decision-making process.
This article consists of three main chapters. Section 2 will provide definitions and explanations regarding the variables of the study. After providing the necessary information for these concepts, hypothesis development will be delivered in a separate sub-section. Section 3 is about the methodological aspects of the study. Finally, the article will conclude with a discussion of this study’s findings, its limitations, and suggestions for future research.
2 Conceptual Background and Hypothesis Development
2.1 BP
In today’s world, finding any kind of information is getting easier, and from a brand management perspective, competing brands can easily get information about their competition and try to offer similar products or services that satisfy the needs and wants of the consumers. When the differences between brands vanish, BP arises. BP is defined as “the overall perception held by the consumer that the differences between major brand alternatives in a product category are small” (Iyer & Muncy, 2005, p. 222). It is also defined as consumers’ perception of similarity among brands (Henderson et al., 1998). According to Keller (2013), points of parity associations are important, but they should be backed up with points of difference associations in order to create a reason to buy in the mind of the consumer. From a microeconomic perspective, the decision-making process of the consumer is quite complicated, and sometimes, the similarity between brands demotivates the consumer from buying a specific brand. For this reason, it is important for brands to have a points of parity association, while also creating points of difference associations that will attract the consumer.
2.2 BI
BI is one of the most important aspects of building a strong brand. According to Keller (1993), together with brand awareness, BI is one of the dimensions of brand equity under the brand knowledge framework. His conceptualization of BI consists of brand associations. Similarly, Aaker’s (1991) approach to brand equity also includes brand associations. Therefore, the key to a positive BI is creating positive brand associations. Brand associations are related to consumers’ perceptions associated with a specific brand (Ali et al., 2018). For instance, when seeing a specific brand’s logo, if the consumer feels happy, this is a positive brand association, leading to a positive BI. BI can be a distinguishing factor regarding brand preference and may create a brand-loyal consumer base. Keller (2013) categorizes BI into four sub-dimensions, where the first is about the types of brand associations. There are attributes consisting of product-related (product’s physical material or service characteristics) and non-product-related association sources, such as usage imagery, user imagery, packaging, and price. Usually, when a consumer sees a high price, there will be a positive BI signaling high quality. There are also functional (main advantage of the product or service), experiential (the feeling when using the product), and symbolic (such as social acceptance or self-respect) benefits as types of associations. The last type is attitude, which is a general evaluation by consumers regarding a brand. The other sub-dimensions are favorability (whether a brand possesses attributes and benefits that satisfy consumer needs and wants), strength (related to the relevance and consistency of the information to the consumer), and uniqueness (whether the consumer’s brand-related associations in mind are brand specific and unique) of brand associations that all together creates the image of the brand.
2.3 BS
As already stated, the decision-making process of consumers is quite complicated. However, in general, it can be said that consumers are willing to purchase a product or service that satisfies their specific needs or wants. When this happens, the consumer is usually satisfied with the brand. Chinomona et al. (2013) define BS as “overall consumer’s evaluation based on the consumer’s total purchase and experience with a brand of product or service.” From this definition, it can also be seen that the actual purchase, including the decision-making process of the consumer, is related to BS. In another approach, BS is directly affected by brand performance, where if the consumer’s cognitive and affective evaluation of perceived brand performance exceeds the expected performance, it can be stated that there is BS (Hwang et al., 2021). Moreover, if a consumer buys regularly from a brand, this can also show that there is BS. In order to preserve the value of a brand, BS is one of the key elements in brand management (Thai et al., 2020).
2.4 BL
From a brand equity perspective, the BL of a specific brand’s customer base is usually the core of the brand’s equity (Aaker, 1991). Oliver (1999, p. 34) defines BL as “a deeply held commitment to rebuy or repatronize a preferred product/service consistently in the future, thereby causing repetitive same-brand or same brand-set purchasing, despite situational influences and marketing efforts having the potential to cause switching behavior.” Accordingly, repeat purchase behavior is an important component of BL. Keller (1993) also emphasized that BL happens when favorable beliefs and attitudes for a brand end with repeat purchase behavior. The re-purchasing is more about behavioral loyalty. Dick and Basu (1994) also mentioned that regarding BL research, several behavioral measures were used. On the other hand, there is attitudinal BL, which is defined by the dispositional commitment of the consumers regarding unique value associations with the brand (Chaudhuri & Holbrook, 2001). In summary, BL can be conceptualized in two main categories: behavioral perspective and attitudinal perspective (Buil et al., 2008). Keller (2013) considers BL the top of his brand resonance pyramid model, where there are four sub-dimensions. The first sub-dimension is behavioral loyalty, which comprises repeat purchases and share of category volume. The second one is attitudinal loyalty, which occurs when a consumer has a strong bond with the brand. The third sub-dimension is the sense of community, which is defined by the kinship or affiliation with other people associated with the brand. The last sub-dimension is active engagement, which happens when consumers are willing to invest time, money, energy, or other resources in the brand. This article considers BL holistically, where the explanations of the dimensions above are intended to define BL in a descriptive manner and not from an operational perspective.
2.5 Development of the Hypotheses
To make it more convenient and concrete for the readers before explaining the rationale of the development of the hypotheses, the conceptual framework of the study can be seen in Figure 1.
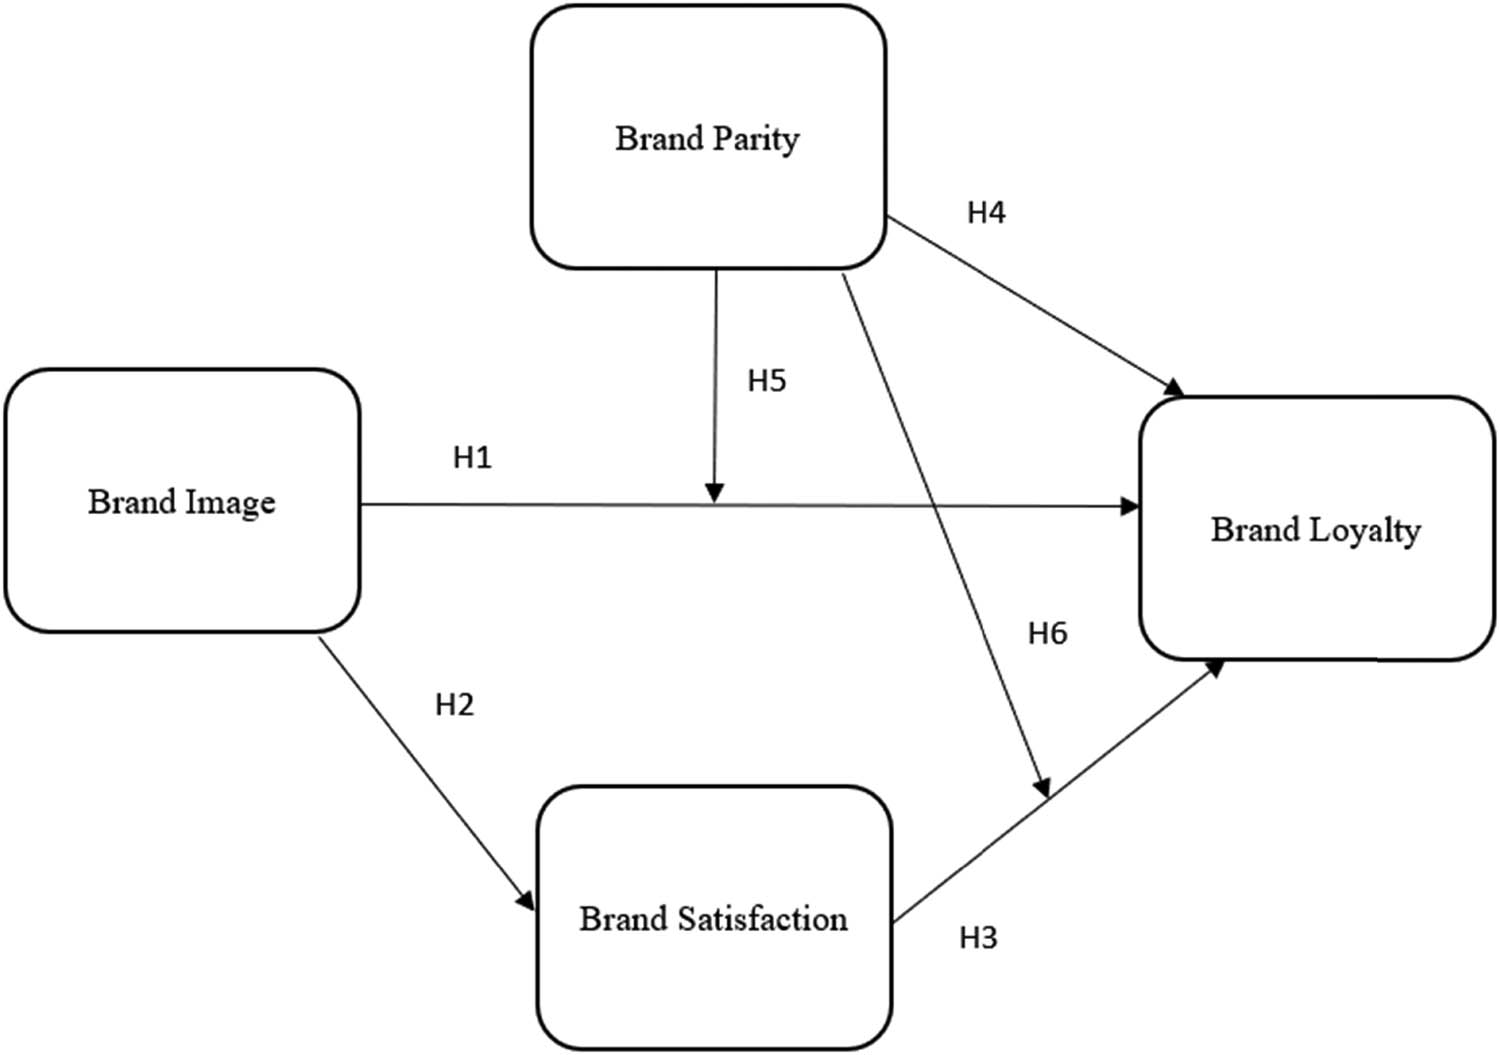
Conceptual framework.
The hypotheses were developed based on information processing theory. Information processing theory has also been used in established brand-related studies (e.g., Leong, 1993), and it is explanatory regarding consumer behavior in the context of cognitive processes (Tybout et al., 1981). A person needs only a piece of information to choose one of two similar alternatives (Miller, 1956). Consumers receive information from different marketing communication options that, in turn, create BI, BS, and BP, which affect several outcomes. The first hypothesis of the study is considering the effect of BI on BL. As described before, consumers have some brand associations in mind regarding their perceptions of a specific brand. As brand associations, along with the overall BI, become more positive, there will be a tendency to become more loyal to the brand. For instance, even if a competing brand offers a discount, if the BI of the regularly purchased brand is very positive, there will be no switching behavior because the BL level would also be high. This logic is supported by previous research findings (Alhaddad, 2015; Büyükdağ, 2021; Greve, 2014; Kim et al., 2018; Thai et al., 2020). Accordingly, the first hypothesis of this study is:
H1. BI has a significant effect on BL.
Having a positive BI will also influence consumer satisfaction. For example, when you eat food from a brand that you have a positive association with, such as good flavor and high-quality service, there will be a higher chance of high BS. When looking at the literature, Ali et al. (2018) found that BI had a positive effect on brand purchase intention, and it can be inferred that a satisfied consumer will have more intention to purchase. Moreover, Alfakih et al. (2022) hypothesized and found support regarding the positive effect of BI on BS. Last but not least, in their study regarding chocolate BI and satisfaction, Puska et al. (2018) found a positive impact of BI on BS. Therefore, the second hypothesis is:
H2. BI has a significant effect on BS.
The third hypothesis of the study considers BS and its effect on BL. In general, the more consumers are satisfied with a brand, it is expected that they will become more loyal to that specific brand. As mentioned before, BS is related to the purchase of the brand and the experience with the brand. As consumers buy more frequently from a brand and have positive experiences with the brand, such as with experiential marketing activities, BS will increase and will turn into stronger BL. Chinomona et al. (2013) found the effect of BS on BL through brand trust. Although this is not showing a direct effect, it is an important insight. Moreover, previous literature also found a positive, direct effect of BS on BL (Hwang et al., 2021; Mokha, 2021; Susanti et al., 2021). Based on the logical relevance of these concepts and previous findings in current literature, the third hypothesis is:
H3. BS has a significant effect on BL.
As mentioned before, BP happens when consumers do not perceive differences among brands in a product category. It can be stated that when this happens, there are only points of parity associations for these brands regarding consumers’ perceptions. However, as stated by Keller (2013), points of difference associations may create reasons to buy a specific brand and differentiate the brand from its competitors. From this perspective, it is expected that BP would be negatively correlated with BL. The reason is that if consumers do not observe considerable differences between competing brands, they can easily switch to another brand, for instance, if there is an effective marketing communication activity. In the literature, there are few contradictory results regarding the relationship between BP and BL. Iyer and Muncy (2005) found that as BP increases, developing a loyal consumer base decreases. However, Li (2010) found something slightly different than the Iyer and Muncy findings. As stated before, there are generally two types of BL, which are behavioral and attitudinal loyalty. Li (2010) observed that BP does not impact attitudinal loyalty, in fact, as BP increases, it has a positive impact on consumers’ behavioral loyalty. In summary, there are few contradictory findings in the literature, but based on the previous literature, the fourth hypothesis of this study is:
H4. BP has a significant effect on BL.
The last two hypotheses are about the moderating effect of BP. As stated before, as consumers start to perceive minimal differences among brands, the possibility of switching behavior rises. In that sense, if there are only points of parity associations regarding competing brands, when observing the effect of BI on BL, because of only points of parity associations building the BI, there might be a moderating effect of BP in that relationship. Similarly, considering the effect of BS on BL, BP may moderate this relationship as well. As mentioned above, BS is based on both the purchases and experiences with the brand. If there are no observable differences among brands, the purchase behavior and experiential relationship with the brands will be small, resulting in BP having a moderating effect on how BS affects BL. In conclusion, the last two hypotheses of this study are:
H5. BP moderates the effect of BI on BL.
H6. BP moderates the effect of BS on BL.
3 Method
3.1 Sample and Procedure
Regular customers who shop at chain supermarkets in the province of Antalya were selected to collect data. In order to generalize the results, ten branches of five well-known chain supermarkets operating in the Konyaaltı district of Antalya province were identified. Permission was obtained by explaining the purpose of the study to the managers of the selected markets. The customers participating in the study were informed about the research topic through the survey description and convinced of the research’s reliability, and their consent was obtained.
The study employed a convenience sampling technique. The population of Konyaaltı district is approximately 205,000. With a 5% margin of error, the sample size was determined to be 384 (Sekaran, 1992). To ensure homogeneity, it was planned to administer 60 questionnaires for each market, totaling 600 data points.
The survey was initially developed in English and then translated back to Turkish by two linguistic experts, following the recommendation of Perrewe et al. (2002). A pilot survey involving 30 customers was conducted to ensure a full understanding of the questions by the participants and to address any potential issues.
In order to mitigate non-response bias, efforts were made to enhance response rates, while simultaneously addressing common method bias by providing participants with assurances of confidentiality to promote truthful and unbiased reporting. An attempt was made to reduce collinearity issues by collecting data at different time points and obtaining responses from different scales each time.
At Time 1, 600 questionnaires were distributed. Each customer received a survey packet containing a cover letter from the researchers, explaining the purpose of the study. The cover letter also provided assurances of confidentiality to mitigate the potential threat of common method bias, as suggested by Podsakoff et al. (2003). The customers were informed that they would receive another short survey approximately 3 weeks later. At Time 1, data on BI, BL, and demographic information were collected. A total of 480 valid questionnaires were returned, resulting in an 80% response rate.
Approximately 3 weeks later, the customers who completed the Time 1 survey (n = 480) were given a second questionnaire assessing customer BS, BP, and demographic information. A total of 408 questionnaires were returned, yielding an 85% response rate. Through assigned identification numbers, the researchers were able to match the questionnaires with each other. Due to missing data, only 392 responses were used for data analysis. Response error was examined by comparing the demographic data (gender, age, and work experience) of those who returned surveys at Time 1 with those who did not respond at Time 2 (Collier & Bienstock, 2007). No significant differences were found.
3.2 Demographic Variables
The average age of the participants was about 35, and 42% were women. Over 71% of employees had at least graduate degrees or higher. About 60% of the respondents were married, and 70% were workers. The reason for preference of 70% of the participants is about economic reasons.
3.3 Measurement
BS Scale: In order to measure the level of BS, the scale developed by Taylor and Baker (1994) and validated by Thuy and Hau (2010) was used. The result of the reliability analyses conducted by Thuy and Hau (2010) of the scale, which consists of a total of 5 statements, is 0.93 (CFI: 0.91; AGFI: 0.88; RMSEA: 0.07).
BI Scale: A five-item BI scale developed by Keller (2003) and used by Kaplan (2007) was used to measure the tendency of customers’ perception regarding BI. The result of the reliability analyses conducted by Kaplan (2007) is 0.92 (CFI: 0.92; AGFI: 0.90; RMSEA: 0.06).
BP Scale: The five-item scale developed by Muncy (1996) and used by Ilıcalı (2016) was used to measure BP. The result of the reliability analyses conducted by Ilıcalı (2016) is 0.76 (CFI: 0.90; AGFI: 0.86; RMSEA: 0.07).
BL Scale: The five-item scale developed by Narayandas (1996) and used by Aydın and Özer (2005) was used to measure BL. The result of the reliability analyses conducted by Aydın and Özer (2005) is 0.88 (CFI: 0.88; AGFI: 0.84; RMSEA: 0.08).
Construct reliability and validity are shown in Table 1.
Construct reliability and validity
| Cronbach’s alpha | Composite reliability (rho_a) | Composite reliability (rho_c) | (AVE) | |
|---|---|---|---|---|
| BS | 0.930 | 0.931 | 0.947 | 0.782 |
| BI | 0.929 | 0.931 | 0.947 | 0.780 |
| BL | 0.880 | 0.901 | 0.915 | 0.686 |
| BP | 0.762 | 0.5895 | 0.836 | 0.791 |
3.4 Results
SPSS and AMOS version 22.0 and Smart PLS 4.0 were used for analyses. All measures were subjected to confirmatory factor analysis to provide support for the issues of dimensionality, convergent, and discriminant validity. The retained item loadings exceeded 0.50; Cronbach’s alphas were all above the benchmark of 0.70; CR and AVE were also above the benchmark of 0.50 (Hair et al., 2006). This provides evidence of convergent validity among our measures. The estimated correlation between the variables is below 0.85, which provides evidence of discriminant validity, as recommended by Kline (2005).
Discriminant validity (Fornell–Larcker criterion) is presented in Table 2. The analysis of discriminant validity demonstrates significant attainment of discriminant validity. According to this finding, the following study has been able to achieve all the criteria since the reliability and validity of the measurement of the construct have been achieved.
Discriminant validity; Fornell–Larcker criterion
| BS | BI | BL | BP | |
|---|---|---|---|---|
| BS | 0.884 | |||
| BI | 0.751 | 0.883 | ||
| BL | 0.786 | 0.674 | 0.828 | |
| BP | 0.496 | 0.432 | 0.373 | 0.437 |
Means, standard deviations, and correlations of the study variables are presented in Table 3.
Means, standard deviations, and correlations values
| Variables | Mean | SD | 1 | 2 | 3 | 4 |
|---|---|---|---|---|---|---|
| 1. BL | 3.55 | 0.85 | 1 | |||
| 2. BI | 3.48 | 0.67 | 0.65** | 1 | ||
| 3. BS | 3.71 | 0.79 | 0.77*** | 0.66*** | 1 | |
| 4. BP | 3.05 | 0.91 | 0.008 | 0.11* | −0.02 | 1 |
N = 392, *p < 0.05; **p < 0.01; ***p < 0.001.
As predicted, the relationship between BI and BL is positive and significant (r = 0.65, p < 0.01); the relationship between BS and BL is positive and significant (r = 0.77, p < 0.001). Due to the significant relationships observed, further analyses were made.
Hierarchical regression analysis was used to test the hypotheses. In addition, hypotheses regarding the moderating role were tested with the method proposed by Baron and Kenny (1986). Hierarchical regression analyses were applied to test the hypotheses. The results were checked through the Smart PLS path model and model fit.
Hierarchical regression analysis was applied to determine the effects of BI on BL and the moderating role of BP in this interaction and to test the hypotheses. The applied regression analysis results are given in Table 4. According to the results of the analysis performed by controlling age and tenure at the first stage, the relationship between BI and BL was found to be significant (β = 0.64; p ≤ 0.001). Hypothesis H1 was supported.
Moderating role of BP in the relationship between BI-BL
| BL | |||
|---|---|---|---|
| Step 1 | Step 2 | Step 3 | |
| Variables | β | β | β |
| Age | −0.01 | −0.10 | −0.10 |
| Tenure | 0.08 | 0.08 | 0.08 |
| BI | 0.64***(H1) | 0.65*** | 0.66*** |
| BP | −0.06(H4) | −0.05 | |
| BI × BP | −0.04 (H5) | ||
| R 2 | 0.42 | 0.43 | 0.43 |
| F | 104*** | 79*** | 66*** |
p < 0.05; p < 0.01; ***p < 0.001
In the second step, it was determined that BP had no significant effect on BL (β = −0.06; p > 0.05). H4 was not supported. The results of this step are presented in Table 5, and the findings showed that BL did not have a moderating role in the relationship between BI and BL (β = −0.04; p > 0.05). Hypothesis H5 was not supported.
Moderating role of BP in the relationship between BS-BL
| BL | |||
|---|---|---|---|
| Step 1 | Step 2 | Step 3 | |
| Variables | β | β | β |
| Age | −0.04 | −0.04 | 0.04 |
| Tenure | 0.05 | 0.04 | 0.04 |
| BS | 0.76***(H3) | 0.76*** | 0.77*** |
| BP | 0.02 | 0.03*** | |
| BI × BP | −0.02 (H6) | ||
| R 2 | 0.27 | 0.44 | 0.45 |
| F | 50*** | 79*** | 66*** |
p < 0.05; p < 0.01; ***p < 0.001.
At this stage of the analysis, hierarchical regression analyses were applied to determine the effects of BS on BL and the moderating role of BP in this interaction and to test the hypotheses. The applied regression analysis results are given in Table 5. According to the results of the analysis performed by controlling age and tenure at the first stage, the relationship between BS and BL was found to be significant (β = 0.6; p ≤ 0.001). Hypothesis H3 was supported.
The results of this step are presented in Table 5, and the findings showed that BP did not have a moderating role in the relationship between BS and BL (β = −0.02; p > 0.05) either. Hypothesis H6 was not supported.
The relationships were retested by path analysis via Smart PLS to determine the model fit, indirect effects, and moderator effect. As already discussed, it was determined that there is a positive and significant effect of BI on BS (β = 0.751; p ≤ 0.001), supporting H2. The results of bootstrapped path analysis show that there were indirect effects between BI and BL via BS (β = 0.5; p ≤ 0.001). The structural model and indirect effects can be seen in Figure 2.
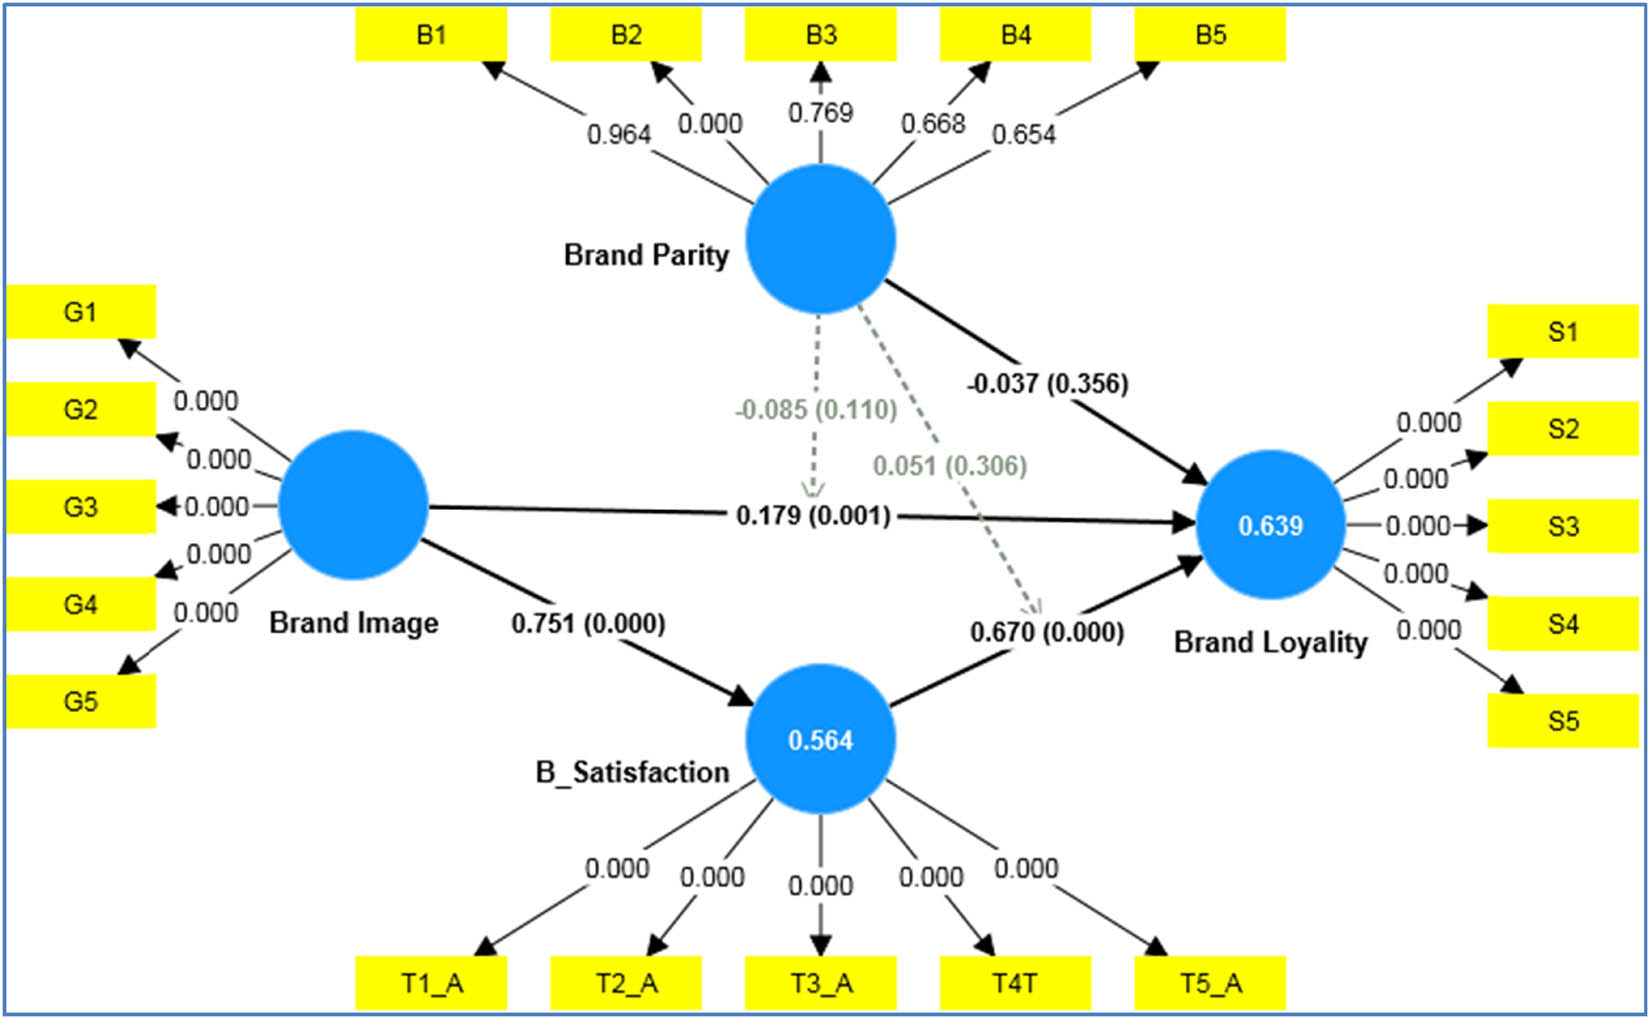
The structural model and indirect effects.
The models fits are presented in Table 6.
Model fit
| Saturated model | Estimated model | |
|---|---|---|
| SRMR | 0.078 | 0.080 |
| d_ULS | 2.788 | 2.927 |
| d_G | 0.899 | 0.921 |
| Chi-square | 1.971030 | 2.020455 |
| NFI | 0.831 | 0.855 |
4 Discussion and Conclusion
Especially over the last 30 years, branding has become an important topic, and because businesses are trying to have differentiated products, branding is an important topic for research in the current literature (e.g., Beckert & Mazzarotto, 2010) so that BP will decrease. By building a strong brand, businesses can achieve a loyal customer base. One important component of BL is behavioral loyalty, which is the last stage of the consumer decision-making process. By bridging BP with the main dependent variable that is BL, this study generated important insights regarding consumer behavior. The first aim of this study was to investigate the important relationships among BP, BI, BS, and BL. The second aim was to test the moderating effect of BP regarding the effect of BI on BL and BS on BL. The main results showed that, regarding the microeconomic view of consumer decision-making, consumers often display irrational behavior. There are important contributions to and implications for current literature and marketing practitioners that are discussed below.
First of all, it was predicted that where consumers have a more positive perception of BI, there will be more BL. In line with previous research (Alhaddad, 2015; Büyükdağ, 2021; Greve, 2014; Kim et al., 2018; Thai et al., 2020), the positive and significant effect of BI on BL was found in this study. This is an important contribution to the literature considering this study’s context, based on information processing theory, the above-mentioned relationship is applicable. Therefore, marketing practitioners should consider the BI and try to create positive associations, which, in turn, increase BL. For example, price is an important attribute that creates brand associations. The concept of price is also an important topic studied in various aspects (e.g., Alvarez, 2008; Chenavaz, 2016; McAfee, 2007). In the context of this study, marketing practitioners can try setting a high price, which will signal high quality and create positive brand associations that, in turn, result in behavioral loyalty, which is the last step of consumer decision-making in the context of microeconomic consumer behavior. Second, as observed in previous literature findings (Alfakih et al., 2022; Puska et al., 2018), the current study observed that BI has a positive impact on BS. Observing this effect in the context of chain stores in Antalya is a theoretical contribution to the literature, as it provides a new industry- and location-specific context. Based on this, marketers should concentrate on BI and try to create strong associations so that consumers will be more satisfied with the brand. Third, compared to previous studies’ findings, such as Hwang et al. (2021), Mokha (2021), and Susanti et al. (2021), this study also shows the positive effect of BS on BL. So in retail chain stores, this effect is also conceptually significant. There is a positive effect of BI on BS and a positive effect of BS on BL. There may be a mediating effect of BS regarding the effect of BI on BL. This indirect effect was also found in this study, which is an important theoretical contribution. Marketing practitioners should consider both BI and BS together to increase BL. Especially, creating positive associations with experiential marketing is important since positive brand experience is an important part of BS, where the indirect effect of BS will be higher regarding the effect of BI on BL.
The last three hypotheses in the study were not supported. However, there are also important theoretical and practical contributions from these results that contribute to the current literature. First, it was predicted that there will be a significant effect from BP on BL. However, this hypothesis was not supported. In the literature, there are also contradictory findings. Therefore, this result is quite important for the literature. Normally, in accordance with Iyer and Muncy’s (2005) findings, it can be expected that as BP increases, BL will decrease, because as consumers observe fewer differences among brands, it can be expected that switching behavior will more likely occur, resulting in a less brand loyal customer base. However, there are also studies, such as the study of Li (2010), that did not find a completely negative effect from BP on BL. Accordingly, the current study’s findings contribute to the literature. BP did not have a significant effect on BL. Similarly, the moderating effect of BP regarding the effect of BI on BL and BS on BL was not observed. So, as consumers perceive similar brands, their loyalty does not change significantly. This is both important for the literature and marketing practitioners. There are important insights considering the microeconomic perspective of consumer behavior and the last step of the decision-making process that is related to behavioral loyalty, which is actually buying the brand. The findings revealed that consumers will not switch to other brands even if they see similar brands, which can be regarded as a distinctive implication for organizational practice. One aspect of this can be related to the bounded rationality of consumers. Consumers have bounded rationality, in that, they cannot weigh every variable when deciding to buy from a brand. So even if the brand differentiates itself from others, this may not be an important factor for the consumer. It is in this context that consumers may act irrationally. Another aspect is regarding branding; it is very important to consider points of parity associations regarding the microeconomic perspective of consumers in the decision-making process, which also creates a distinctive implication for marketing practitioners. In this era, it can be said that points of difference associations are important, but when the differences among brands start to vanish, consumers want to see a large degree of points of parity associations to consider before buying from a brand. Consequently, marketing practitioners should position the brand and concentrate on points of difference associations, but they should not forget to build the necessary level of points of parity associations, which, in turn, results in higher brand awareness and BI, leading to BS and BL. This is an important insight regarding the microeconomic implications of consumer behavior within the decision-making process.
There are some limitations to this study, which lead to future research recommendations. The first limitation is that the research is conducted in only one industry. Future research should re-test a similar model in different industries. The other limitation is about the sample. The sample consisted of consumers from a specific region, which affects the generalization of the findings. It is important to test these relationships in different kinds of industries and regions of the world.
-
Funding information: Authors did not receive funding support for the article.
-
Conflict of interest: There is no conflict of interest.
-
Article note: As part of the open assessment, reviews and the original submission are available as supplementary files on our website.
References
Aaker, D. A. (1991). Managing Brand Equity: Capitalizing on the Value of a Brand Name. The Free Press.Search in Google Scholar
Alfakih, K. A. A., Saraih, U. N., Al-Shammari, S. A., Abdulrab, M., Rehman, A. U., & Al-Mamary, Y. H. S. (2022). Determinants of the Malaysian cars brand loyalty: Mediating effect of brand satisfaction. Journal of Industrial Integration and Management, 7(4), 555–598.10.1142/S2424862221500172Search in Google Scholar
Alhaddad, A. (2015). A structural model of the relationships between brand image, brand trust, and brand loyalty. International Journal of Management Research & Review, 5(3), 137–144.Search in Google Scholar
Ali, A., Xiaoling, G., Sherwani, M., & Ali, A. (2018). Antecedents of consumers’ Halal brand purchase intention: An integrated approach. Management Decision, 56(4), 715–735.10.1108/MD-11-2016-0785Search in Google Scholar
Alic, A., Cinjarevic, M., & Agic, E. (2020). The role of brand image in consumer-brand relationships: Similarities and differences between national and private label brands. Management & Marketing. Challenges for the Knowledge Society, 15(1), 1–16.10.2478/mmcks-2020-0001Search in Google Scholar
Alvarez, L. J. (2008). What do micro price data tell us on the validity of the new keynesian Phillips curve?. Economics: The Open-Access, Open-Assessment E-Journal, 2(1), 1–35.10.5018/economics-ejournal.ja.2008-19Search in Google Scholar
Aydın, S., & Özer, G. (2005). The analysis of antecedents of customer loyalty in the Turkish mobile telecommunication market. European Journal of Marketing, 39(7/8), 910–925.10.1108/03090560510601833Search in Google Scholar
Baron, R. M., & Kenny, D. A. (1986). The moderator-mediator variable distinction in psychological research: Conceptual, strategic, and statistical considerations. jOurnal of Personality and Social Psychology, 51(6), 1173–1182.10.1037//0022-3514.51.6.1173Search in Google Scholar
Beckert, W., & Mazzarotto, N. (2010). Price-concentration analysis in merger cases with differentiated products. Economics: The Open-Access, Open-Assessment E-Journal, 4(1), 1–23.10.5018/economics-ejournal.ja.2010-16Search in Google Scholar
Buil, I., Chernatony, L. D., & Martinez, E. (2008). A cross-national validation of the consumer-based brand equity scale. Journal of Product and Brand Management, 17(6), 384–392.10.1108/10610420810904121Search in Google Scholar
Büyükdağ, N. (2021). The effect of brand awareness, brand image, satisfaction, brand loyalty and WOM on purchase intention: An empirical research on social media. BMIJ, 9(4), 1380–1398.10.15295/bmij.v9i4.1902Search in Google Scholar
Chaudhuri, A., & Holbrook, M. B. (2001). The chain effects from brand trust and brand affect to brand performance: The role of brand loyalty. Journal of Marketing, 65(2), 81–93.10.1509/jmkg.65.2.81.18255Search in Google Scholar
Chenavaz, R. (2016). Dynamic pricing with reference price dependence. Economics: The Open-Access, Open-Assessment E-Journal, 10(1), 1–17.10.5018/economics-ejournal.ja.2016-22Search in Google Scholar
Chinomona, R., Mahlangu, D., & Pooe, D. (2013). Brand service quality, satisfaction, trust, and preferences as predictors of consumer brand loyalty in the retailing industry. Mediterranean Journal of Social Sciences, 4(14), 181–190.10.5901/mjss.2013.v4n14p181Search in Google Scholar
Collier, J. E., & Bienstock, C. C. (2007). An analysis of how non-response error is assessed in academic marketing research. Marketing Theory, 7(2), 163–183.10.1177/1470593107076865Search in Google Scholar
Dick, A. S., & Basu, K. (1994). Customer loyalty: Toward an integrated conceptual framework. Journal of the Academy of Marketing Science, 22(2), 99–113.10.1177/0092070394222001Search in Google Scholar
Greve, G. (2014). The moderating effect of customer engagement on the brand image – brand loyalty relationship. Procedia – Social and Behavioral Sciences, 148, 203–210.10.1016/j.sbspro.2014.07.035Search in Google Scholar
Hair, J. F., Black, W. C., Babin, B. J., Anderson, R. E., & Tatham, R. L. (2006). Multivariate data analysis. Pearson Education, Inc.Search in Google Scholar
Henderson, G. R., Iacobucci, D., & Calder, B. J. (1998). Brand diagnostics: Mapping branding effects using consumer associative networks. European Journal of Operational Research, 111, 306–327.10.1016/S0377-2217(98)00151-9Search in Google Scholar
Hwang, J., Choe, J. Y. J., Kim, H. M., & Kim, J. J. (2021). Human baristas and robot baristas: How does brand experience affect brand satisfaction, brand attitude, brand attachment, and brand loyalty. International Journal of Hospitality Management, 99, 1–12.10.1016/j.ijhm.2021.103050Search in Google Scholar
Ilıcalı, İ. B. (2016). Sadık tüketici kitlesi oluşturmada markaların algılanan benzerliğinin rolü. (Master of Science Dissertation). Bahçeşehir University, İstanbul.Search in Google Scholar
Iyer, R., & Muncy, J. A. (2005). The role of brand parity in developing loyal customers. Journal of Advertising Research, 45(2), 222–228.10.1017/S0021849905050245Search in Google Scholar
Kaplan, M. D. (2007). Product appearance and brand knowledge: An analysis of critical relationships. (Doctoral Dissertation). İzmir University of Economics, İzmir.Search in Google Scholar
Keller, K. L. (1993). Conceptualizing, measuring, and managing customer-based brand equity. Journal of Marketing, 57(1), 1–22.10.1177/002224299305700101Search in Google Scholar
Keller, K. L. (2003). Brand synthesis: The multidimensionality of brand knowledge. Journal of Consumer Research, 29(4), 595–600.10.1086/346254Search in Google Scholar
Keller, K. L. (2013). Strategic brand management: Building, measuring, and managing brand equity. Pearson Education Limited.Search in Google Scholar
Kim, S. S., Choe, J. Y. J., & Petrick, J. F. (2018). The effect of celebrity on brand awareness, perceived quality, brand image, brand loyalty, and destination attachment to a literal festival. Journal of Destination Marketing & Management, 9, 320–329.10.1016/j.jdmm.2018.03.006Search in Google Scholar
Kline, R. B. (2005). Principles and practice of structural equation modeling. The Guilford Press.Search in Google Scholar
Leong, S. M. (1993). Consumer decision making for common, repeat-purchase products: A dual replication. Journal of Consumer Psychology, 2(2), 193–208.10.1016/S1057-7408(08)80024-1Search in Google Scholar
Li, X. R. (2010). Loyalty regardless of brands? Examining three nonperformance effects on brand loyalty in a tourism context. Journal of Travel Research, 49(3), 323–336.10.1177/0047287509346854Search in Google Scholar
McAfee, R. P. (2007). Pricing damaged goods. Economics: The Open-Access, Open-Assessment E-Journal, 1(1), 1–19.10.5018/economics-ejournal.ja.2007-1Search in Google Scholar
Miller, G.A. (1956). The magical number seven, plus or minus two: Some limits on our capacity for processing information. The Psychological Review, 63(2), 81–97.10.1037/h0043158Search in Google Scholar
Mokha, A. K. (2021). Brand equity, brand satisfaction, and brand loyalty: A study of select e-commerce industry. International Journal of Online Marketing, 11(13), 34–50.10.4018/IJOM.2021070103Search in Google Scholar
Muncy, J. A. (1996). Measuring perceived brand parity. In K. P. Corfman & J. G. Jr Lynch (Eds.), NA – Advances in Consumer Research (Vol. 23, pp. 411–417). Provo, UT: Association for Consumer Research.Search in Google Scholar
Narayandas, N. (1996). The link between customer satisfaction and customer loyalty: An empirical invenstigation. Working Paper, 97-017, Harvard Business School.Search in Google Scholar
Oliver, R. L. (1999). Whence consumer loyalty. Journal of Marketing, 63(Special Issue), 33–44.10.2307/1252099Search in Google Scholar
Perrewe, P. L., Hochwarter, W. A. Rossi, A. M., Wallace, A., Maignan, I., Castro, S. L., & Van Deusen, C. A. (2002). Are work stress relationships universal? A nine-region examination of role stressors, general self-efficacy, and burnout. Journal of International Management, 8(2), 163–187.10.1016/S1075-4253(02)00052-2Search in Google Scholar
Podsakoff, P. M., MacKenzie, S. B., Lee, J.-Y., & Podsakoff, N. P. (2003). Common method biases in behavioral research: A critical review of the literature and recommended remedies. Journal of Applied Psychology, 88(5), 879–903.10.1037/0021-9010.88.5.879Search in Google Scholar
Puska, A., Stojanovic, I., & Berbic, S. (2018). The impact of chocolate brand image, satisfaction, and value on brand loyalty. Economy and Market Communication Review, 15(1), 37–54.10.7251/EMC1801037PSearch in Google Scholar
Rahman, M. (2014). Differentiated brand experience in brand parity through branded branding strategy. Journal of Strategic Brand Management, 22(7), 603–615.10.1080/0965254X.2014.914061Search in Google Scholar
Sekaran, U. (1992). Research methods for business: A skill-building approach. New York: John Wiley & Sons, Inc.Search in Google Scholar
Susanti E., Rafika M., & Melinda T. (2021). Consumer brand engagement on brand loyalty: The role of brand satisfaction as a mediating variable. International Conference on Entrepreneurship (ICOEN), KnE Social Sciences, 306–322.10.18502/kss.v5i5.8818Search in Google Scholar
Taylor, S. A., & Baker, T. L. (1994). An assessment of the relationship between service quality and customer satisfaction in the formation of consumers’ purchase intentions. Journal of Retailing, 70(2), 163–178.10.1016/0022-4359(94)90013-2Search in Google Scholar
Thai, N. V., Vuong, D. H., Ha, N. T. T., Thinh, N. Q., Kim, M. H., & Quy, N. L. D. (2020). Exploring brand loyalty toward traditional confectioneries in an emerging market. Entrepreneurship and Sustainability Issues, 8(1), 60–72.10.9770/jesi.2020.8.1(5)Search in Google Scholar
Thuy, P. N., & Hau, L. N. (2010). Service personal values and customer loyalty: A study of banking services in a transitional economy. International Journal of Bank Marketing, 28(6), 465–478.10.1108/02652321011077706Search in Google Scholar
Tybout, A. M., Calder, B. J., & Sternthal, B. (1981). Using information processing theory to design marketing strategies. Journal of Marketing Research, 18(1), 73–79.10.1177/002224378101800107Search in Google Scholar
© 2024 the author(s), published by De Gruyter
This work is licensed under the Creative Commons Attribution 4.0 International License.
Articles in the same Issue
- Regular Articles
- Political Turnover and Public Health Provision in Brazilian Municipalities
- Examining the Effects of Trade Liberalisation Using a Gravity Model Approach
- Operating Efficiency in the Capital-Intensive Semiconductor Industry: A Nonparametric Frontier Approach
- Does Health Insurance Boost Subjective Well-being? Examining the Link in China through a National Survey
- An Intelligent Approach for Predicting Stock Market Movements in Emerging Markets Using Optimized Technical Indicators and Neural Networks
- Analysis of the Effect of Digital Financial Inclusion in Promoting Inclusive Growth: Mechanism and Statistical Verification
- Effective Tax Rates and Firm Size under Turnover Tax: Evidence from a Natural Experiment on SMEs
- Re-investigating the Impact of Economic Growth, Energy Consumption, Financial Development, Institutional Quality, and Globalization on Environmental Degradation in OECD Countries
- A Compliance Return Method to Evaluate Different Approaches to Implementing Regulations: The Example of Food Hygiene Standards
- Panel Technical Efficiency of Korean Companies in the Energy Sector based on Digital Capabilities
- Time-varying Investment Dynamics in the USA
- Preferences, Institutions, and Policy Makers: The Case of the New Institutionalization of Science, Technology, and Innovation Governance in Colombia
- The Impact of Geographic Factors on Credit Risk: A Study of Chinese Commercial Banks
- The Heterogeneous Effect and Transmission Paths of Air Pollution on Housing Prices: Evidence from 30 Large- and Medium-Sized Cities in China
- Analysis of Demographic Variables Affecting Digital Citizenship in Turkey
- Green Finance, Environmental Regulations, and Green Technologies in China: Implications for Achieving Green Economic Recovery
- Coupled and Coordinated Development of Economic Growth and Green Sustainability in a Manufacturing Enterprise under the Context of Dual Carbon Goals: Carbon Peaking and Carbon Neutrality
- Revealing the New Nexus in Urban Unemployment Dynamics: The Relationship between Institutional Variables and Long-Term Unemployment in Colombia
- The Roles of the Terms of Trade and the Real Exchange Rate in the Current Account Balance
- Cleaner Production: Analysis of the Role and Path of Green Finance in Controlling Agricultural Nonpoint Source Pollution
- The Research on the Impact of Regional Trade Network Relationships on Value Chain Resilience in China’s Service Industry
- Social Support and Suicidal Ideation among Children of Cross-Border Married Couples
- Asymmetrical Monetary Relations and Involuntary Unemployment in a General Equilibrium Model
- Job Crafting among Airport Security: The Role of Organizational Support, Work Engagement and Social Courage
- Does the Adjustment of Industrial Structure Restrain the Income Gap between Urban and Rural Areas
- Optimizing Emergency Logistics Centre Locations: A Multi-Objective Robust Model
- Geopolitical Risks and Stock Market Volatility in the SAARC Region
- Trade Globalization, Overseas Investment, and Tax Revenue Growth in Sub-Saharan Africa
- Can Government Expenditure Improve the Efficiency of Institutional Elderly-Care Service? – Take Wuhan as an Example
- Media Tone and Earnings Management before the Earnings Announcement: Evidence from China
- Review Articles
- Economic Growth in the Age of Ubiquitous Threats: How Global Risks are Reshaping Growth Theory
- Efficiency Measurement in Healthcare: The Foundations, Variables, and Models – A Narrative Literature Review
- Rethinking the Theoretical Foundation of Economics I: The Multilevel Paradigm
- Financial Literacy as Part of Empowerment Education for Later Life: A Spectrum of Perspectives, Challenges and Implications for Individuals, Educators and Policymakers in the Modern Digital Economy
- Special Issue: Economic Implications of Management and Entrepreneurship - Part II
- Ethnic Entrepreneurship: A Qualitative Study on Entrepreneurial Tendency of Meskhetian Turks Living in the USA in the Context of the Interactive Model
- Bridging Brand Parity with Insights Regarding Consumer Behavior
- The Effect of Green Human Resources Management Practices on Corporate Sustainability from the Perspective of Employees
- Special Issue: Shapes of Performance Evaluation in Economics and Management Decision - Part II
- High-Quality Development of Sports Competition Performance Industry in Chengdu-Chongqing Region Based on Performance Evaluation Theory
- Analysis of Multi-Factor Dynamic Coupling and Government Intervention Level for Urbanization in China: Evidence from the Yangtze River Economic Belt
- The Impact of Environmental Regulation on Technological Innovation of Enterprises: Based on Empirical Evidences of the Implementation of Pollution Charges in China
- Environmental Social Responsibility, Local Environmental Protection Strategy, and Corporate Financial Performance – Empirical Evidence from Heavy Pollution Industry
- The Relationship Between Stock Performance and Money Supply Based on VAR Model in the Context of E-commerce
- A Novel Approach for the Assessment of Logistics Performance Index of EU Countries
- The Decision Behaviour Evaluation of Interrelationships among Personality, Transformational Leadership, Leadership Self-Efficacy, and Commitment for E-Commerce Administrative Managers
- Role of Cultural Factors on Entrepreneurship Across the Diverse Economic Stages: Insights from GEM and GLOBE Data
- Performance Evaluation of Economic Relocation Effect for Environmental Non-Governmental Organizations: Evidence from China
- Functional Analysis of English Carriers and Related Resources of Cultural Communication in Internet Media
- The Influences of Multi-Level Environmental Regulations on Firm Performance in China
- Exploring the Ethnic Cultural Integration Path of Immigrant Communities Based on Ethnic Inter-Embedding
- Analysis of a New Model of Economic Growth in Renewable Energy for Green Computing
- An Empirical Examination of Aging’s Ramifications on Large-scale Agriculture: China’s Perspective
- The Impact of Firm Digital Transformation on Environmental, Social, and Governance Performance: Evidence from China
- Accounting Comparability and Labor Productivity: Evidence from China’s A-Share Listed Firms
- An Empirical Study on the Impact of Tariff Reduction on China’s Textile Industry under the Background of RCEP
- Top Executives’ Overseas Background on Corporate Green Innovation Output: The Mediating Role of Risk Preference
- Neutrosophic Inventory Management: A Cost-Effective Approach
- Mechanism Analysis and Response of Digital Financial Inclusion to Labor Economy based on ANN and Contribution Analysis
- Asset Pricing and Portfolio Investment Management Using Machine Learning: Research Trend Analysis Using Scientometrics
- User-centric Smart City Services for People with Disabilities and the Elderly: A UN SDG Framework Approach
- Research on the Problems and Institutional Optimization Strategies of Rural Collective Economic Organization Governance
- The Impact of the Global Minimum Tax Reform on China and Its Countermeasures
- Sustainable Development of Low-Carbon Supply Chain Economy based on the Internet of Things and Environmental Responsibility
- Measurement of Higher Education Competitiveness Level and Regional Disparities in China from the Perspective of Sustainable Development
- Payment Clearing and Regional Economy Development Based on Panel Data of Sichuan Province
- Coordinated Regional Economic Development: A Study of the Relationship Between Regional Policies and Business Performance
- A Novel Perspective on Prioritizing Investment Projects under Future Uncertainty: Integrating Robustness Analysis with the Net Present Value Model
- Research on Measurement of Manufacturing Industry Chain Resilience Based on Index Contribution Model Driven by Digital Economy
- Special Issue: AEEFI 2023
- Portfolio Allocation, Risk Aversion, and Digital Literacy Among the European Elderly
- Exploring the Heterogeneous Impact of Trade Agreements on Trade: Depth Matters
- Import, Productivity, and Export Performances
- Government Expenditure, Education, and Productivity in the European Union: Effects on Economic Growth
- Replication Study
- Carbon Taxes and CO2 Emissions: A Replication of Andersson (American Economic Journal: Economic Policy, 2019)