
Multiscale investigation of stress-corrosion crack propagation mechanisms in oxide glasses
-
Gaël Pallares


Abstract
Fracture propagation involves the coupling of many length scales ranging from the sample loading geometry to the molecular level. In brittle materials, the length scales of the damage process zone are reduced to a submicrometric scale and the coupling with the macroscopic scale is expected to be the domain of linear elastic fracture mechanics. However, although 2D elastic analyses are generally adequate to describe the sample deformation at macroscopic scales, local investigations of failure mechanisms at the sample-free surface require the use of 3D mechanical tools due to the crack front local curvature and to the corner point singularities at the intersection between the crack front and the external surfaces of the sample. We present here a thorough multiscale investigation of the slow crack growth of a sharp crack in oxide glasses in the stress-corrosion regime, combining experimental and numerical analyses of the displacement fields from the millimeter scale to the nanoscale range. The principal aim of the study is identifying the length and time scales of the mechanisms of damage and interaction between water and glass, which have been the subject of an extensive debate in the last decades.
1 Introduction
Glass is a very widespread material due to its excellent transparency and corrosion resistance. It also has excellent mechanical properties, because it is actually very stiff and can be brought to very high strength when it is produced into very thin fibers or layers by reducing the number and size of defects and taking particular care of the external surfaces. The main limitation remains the elevated brittleness of glass, i.e. its tendency to initiate and propagate fractures with very low energy dissipation. This can manifest itself in two very different ways. The first one is the well-known catastrophic (critical) fracture, occurring upon overcoming some critical static or dynamic (shock) loading and resulting in crack propagation velocities close to the sound speed in glass, i.e. several km/s. The second more subtle manifestation is the slow sub-critical propagation of pre-existing flaws under moderate stresses, which can involve very low velocities ranging from mm/s to pm/s and below (although this becomes hardly measurable) and which plays an outstanding role in the life duration of many loaded structures (the so called “static fatigue”). For oxide glasses, subcritical crack growth mainly originates from stress-corrosion mechanisms, which are related to different kinds of stress and temperature-enhanced interactions of glass with the local environment at the crack tip, mainly with water molecules in wet or moist environment (cf. recent reviews from Ciccotti, 2009; Freiman, Wiederhorn, & Mecholsky, 2009; Wiederhorn, Fett, Guin, & Ciccotti, 2013).
The understanding of the mechanisms of glass strength reduction by Griffith cracks (Griffith, 1920) and the role of stress-corrosion in the static fatigue of glass has led to important applications concerning reinforcement fibers and telecom optical fibers that approach the theoretical strength of 10 GPa (Brambilla & Payne, 2009). When combining high-quality surface finish with thermal of chemical tempering to induce compressive stresses on the glass surfaces, very strong flat glasses can also be produced, which allowed the development of very thin and light smartphone displays and a progressive increase of the use of glass as structural material such as in the transparent crosswalk over the Grand Canyon.
Stress-corrosion is a hydrolysis chemical reaction happening at the crack tip, which would normally be very slow on glass at ambient temperature, but is significantly accelerated due to stress concentration. Most ordinary oxide glasses are silicate glasses, where about 80 wt.% is constituted by a densely crosslinked network of silica tetrahedra, SiO4, bonded by a common oxygen atom, thus creating Si-O-Si (siloxane) bridges that locally form some rings of radii down to 0.5 nm. The basic corrosion reaction illustrated in Figure 1 is a three-step reaction involving water adsorption on the Si-O bonds, then the hydrolysis reaction itself (exchange of electron and proton), and finally the separation of the bond in two separate silanol groups (Si-OH), which correspond to one step advance of the fracture in the main silicate network of the glass.
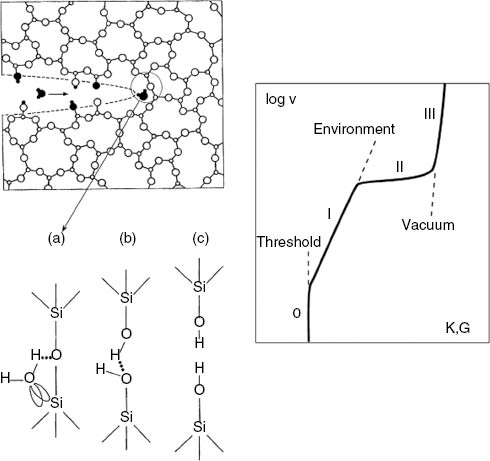
Left: basic mechanisms of the stress-corrosion reactions (from Michalske & Freiman, 1983). Right: schematic v(K) diagram for subcritical crack propagation in oxide glasses.
The vision of stress-corrosion as a sequence of individual bond breakings by stress (and temperature) enhanced hydrolysis was established in the 1970s (Michalske & Freiman, 1983; Wiederhorn, 1967; Wiederhorn & Bolz, 1970). The kinetics of stress-corrosion crack propagation can be represented by a three-region scheme on a graph describing the logarithm of crack velocity v (spanning from cm/s to pm/s) against the stress intensity factor (SIF) K, when K is smaller than the toughness Kc that is of the order of 1 MPa.m1/2 for most glasses.
Region I is the proper stress-corrosion regime, where the stress enhances exponentially the crack propagation according to accelerated hydrolysis reactions. Region II is a plateau where crack velocity is limited by the migration of water molecules towards the very confined crack tip. Region III is a very steep region where the SIF is so high that crack can propagate without any contribution from water hydrolysis. In some glasses such as alkali-silicate glasses, an additional region 0 corresponds to a threshold for crack propagation.
The phenomenology of the stress-corrosion regime (region I) consists of an exponential dependence of the crack velocity on the SIF, an almost proportional dependence on humidity and an increase of crack velocity with temperature. This was experimentally established by Wiederhorn (1967) and Wiederhorn and Bolz (1970), who also proposed the following model equation:
which is based on the chemical reaction rate theory for the hydrolysis of siloxane bonds by water molecules. The dependency on humidity
Phenomenological equations such as Wiederhorn’s [Equation (1)] can describe the dependence of crack velocity on stress and on environmental parameters for most typical glasses and are compatible with a thorough consistent modeling based on the sharp-crack atomic-bonding paradigm (Lawn, 1993). Yet, the detailed nature of the stress-corrosion mechanisms that occur at the crack tip have been debated for decades (Gehrke, Ullner, & Mahnert, 1991; Marsh, 1964; Maugis, 1985; Tomozawa, 1996), and a general disagreement can be found on the relevance of several accessory phenomena that may participate in the stress-corrosion mechanisms at different stages of the process. Stress-corrosion can involve a complex interplay between the diffusion of reactive molecules (mainly water) into the crack cavity and into the glass network, the corrosion (or dissolution) of the network itself, and the migration of weakly bonded alkali ions under chemical or stress gradient (Bunker, 1994; Gehrke et al., 1991). We note that in pure silica glass the absence of ion migration can lead to significantly different local corrosion mechanisms. All three phenomena are typically very slow under ambient conditions in the unstressed material, but they can significantly accelerate in the highly stressed neighborhood of the crack tip, depending especially on the nature of the environment and of its confinement in the crack tip cavity.
A major objection to the sharp-crack atomic-bonding paradigm comes from the hypothesis of a significant contribution of plastic deformation at the crack tip in the slow crack propagation mechanisms. Since the early works of Dugdale (1960) on metals and the observations of plastic behavior of glass under compression in indentation and scratch marks (Taylor, 1949), several investigations have been carried out to track the evidence of plastic behavior in the strong tensile stress field at crack tips in glasses.
The fracture energies measured by Wiederhorn (1969) for six glasses in an inert environment range between 7 and 10 J/m2, a figure that is tenfold higher than twice the typical values of the surface tension of glasses γ=0.5 J/m2 (Griffith, 1920), which suggests a significant contribution of irreversible processes in crack propagation. By considering a typical yield stress of 10 GPa for glass, the size of the crack tip plastic region associated to such fracture energies by the Dugdale model would be limited to a few nanometers. In the subcritical stress-corrosion regime, the fracture energies and the estimated sizes of the plastic regions are lower. However, the extent of penetration of reactive molecules from the environment into the glass network has been much debated (Marsh, 1964; Tomozawa, 1984), and this can enhance damage and plasticity on larger regions around the crack tip (cf. Ciccotti, 2009).
Since the early development of atomic force microscopy (AFM) techniques, it has been possible to probe in situ crack propagation or the post-mortem crack surface morphologies to explore these mechanisms at their relevant nanometric scale, leading to remarkable observations. In 1996, Guilloteau, Charrue, and Creuzet made the first in situ AFM measurements of the external glass surface during crack propagation following an indentation test in borosilicate glass (c.f. Figure 2, left). They observed the presence of a surface depression ahead of the crack tip. This was interpreted as a plastic deformation affecting a region of 50-nm size. The analysis leading to such a conclusion will be discussed below in detail. Similar results were obtained by Célarié et al. (2003) on lithium-alumino-silicate glasses (c.f. Figure 2, right) and by Prades, Bonamy, Dalmas, Bouchaud, and Guillot (2005) on silica glass by in situ AFM observation of slow fracture propagation in double cleavage drilled compression (DCDC) samples under pure mode I loading. The process zone size was observed to grow in size from 20 to 100 nm when the propagation velocity decreased from 10-10 to 10-5 m/s by lowering the SIF K. Moreover, these AFM measurements suggested that crack propagation in the process zone proceeds by the nucleation, growth, and coalescence of nanometric cavities, in a similar way to what happens in the ductile fracture of metals at the (sub-)micrometer to millimeter scale. A complementary investigation by Bonamy, Ponson, Prades, Bouchaud, and Guillot (2006) was based on the observation of a cutoff length close to 50 nm in the statistical correlation functions of the crack surface morphology measured post-mortem by AFM. This cutoff length was also attributed to the size of the process zone. On the other hand, Guin and Wiederhorn (2004) have observed that the post-mortem recombination of the AFM measurements of the morphology of opposing crack surfaces in silica and soda-lime showed no evidence for the expected traces of nanocavities in the bulk of the specimen. All these very resolved but seemingly contradictory AFM observations reopened the debate on crack tip plasticity.
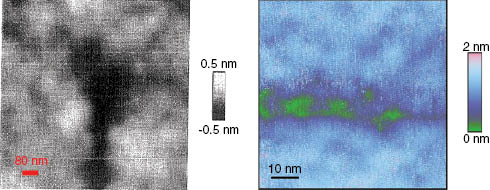
In situ AFM height observations of the neighborhood of a crack tip in glass. Left: observation from Guilloteau et al. (1996) of a local depression at the crack tip propagating from bottom to top. Right: obsevation from Célarié et al. (2003) of apparent nanoscale cavities ahead of a crack tip propagating from left to right.
The aim of this paper is to show that a coherent interpretation of these AFM nanoscale investigations, which are limited to the external surface of the sample in the close neighborhood of the crack tip, can be achieved by a thorough multiscale analysis of the mechanics of fracture from the macroscopic scale where the loading is applied to the sample, to the submicrometric scale where the crack tip singularity lives.
In most fracture mechanic test samples, the macroscopic aspects are tackled by establishing the expression of the SIF K as a function of the applied force F, the crack length a, and the geometric parameters of the sample through a 2D finite-element analysis. This approach conveniently describes the overall energetic balance during crack propagation as well as the in-plane elastic displacement fields of the sample at macroscopic scale. However, when considering the local fields close to the crack tip, the actual shape of the crack front will play a dominant role. Like in most test samples, the crack front shape of the DCDC sample used in most of these AFM investigations is bowed into a parabolic shape, as shown in Figure 3. Since the AFM observations are intrinsically limited to the external surface of the sample, the fact that the crack front is not normal to the external surface breaks the 2D symmetry of the local stress and displacement fields. This prevents one from taking advantage of the classical plane stress or plane strain 2D solutions, especially for what concerns the out-of-plane displacement field, which is the main observable of AFM measurements.

Left: sketch of the DCDC geometry. Right: side view of the DCDC sample, putting into evidence the parabolic shape of the crack front, which is measured in situ during steady-state crack propagation.
Fett et al. (2008) showed the inadequacy of the 2D plane-stress solution used by Guilloteau et al. (1996) and then by Célarié et al. (2003) to represent the elastic out-of-plane surface displacement near the crack tip with a 1/r1/2 dependence (Figure 4, left). They pointed out that the mechanical solutions to describe the corner singularity of a 3D surface striking crack were provided by Benthem (1977) and Bažant and Estenssoro (1979) and imply the use of a rλ dependence (with λ~1/2) to describe the local displacement field. Fett et al. (2008) showed using an alternative fit of the data of Célarié et al. (2003) based on a 3D elastic numerical simulation that the deviation of the displacement profiles measured by AFM from the elastic numerical solution is much less obvious (Figure 4, right). However, the quality of the fit on the vertical topography profiles is insufficient to drive accurate conclusions due to the fact that the vertical extent of the out-of-plane displacement field on AFM images is of the same order of magnitude as the residual roughness (a few angstroms) even after excellent polishing.
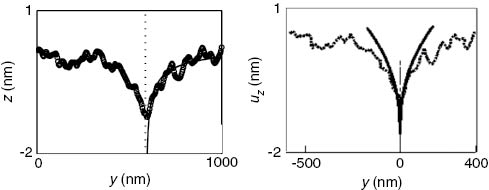
Left: AFM measurement of the out-of-plane displacement field in a section crossing the crack tip from Célarié et al. (2003), along with the 1/r1/2 fit used therein. Right: a different fit of the same dataset as proposed by Fett et al. (2008) according to a 3D elastic numerical analysis.
In order to overcome this problem, we developed an extension of the digital image correlation (DIC) technique to AFM topographical images of in situ crack propagation in order to separate properly the 3D surface displacement field from the nanoscale surface roughness (Han, Ciccotti, & Roux, 2010).
We show here that when insuring the steady-state crack propagation we can interpret in a fully consistent way the nanoscale-resolved displacement fields measured by AFM-DIC with the large scale surface displacement measured by optical profilometry (Figure 5). The optical profilometry allows appreciating the millimetric lateral extent of the crack tip surface depression, which is well separated from surface roughness and clearly attributable to an elastic effect at that scale. The different scales of these experimental observations are bridged by a 3D finite-element modeling of the whole DCDC sample involving the accurate crack front shape geometry. The overall multiscale strategy is presented in Figure 5.
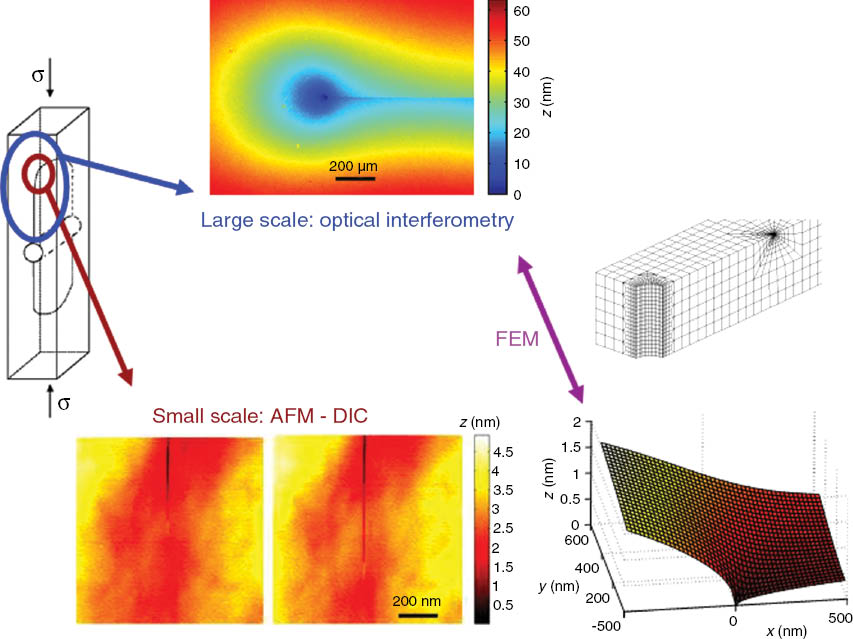
The DCDC test sample is represented on the left along with the regions corresponding to the two scales of observation. The large-scale measurements by optical interferometry are illustrated on the top. The two small-scale AFM images in the bottom represent two successive steps of steady-state crack propagation that lead to the estimation of the local out-of-plane displacement field represented on their right. The finite-element mesh on the right is used to bridge the two scales.
The results of this multiscale analysis provide strong evidence that accurate elastic solutions can describe faithfully the mechanics of the DCDC sample from the macroscopic scale, where the load is applied down to the resolution limit of the AFM measurements, represented by the 10-nm size of the probe. This is proved both from the consistency of the measured out-of-plane displacement throughout all the scales and from the identity (within 5% uncertainty) of the SIF independently obtained by either the macroscopic mechanical analysis of the structural response of the DCDC sample or by the submicroscale measurement of the crack tip asymptotic displacement fields.
2 Corner point singularity
We dedicate this second section to some theoretical notions on the corner point singularity, i.e. on the 3D nature of the asymptotic crack tip fields surrounding the region where a crack front intersects the external surface of the sample, as in Figure 6 (where a perpendicular intersection is chosen for simplifying the first description of the double coordinate system). Intensive theoretical and numerical studies, often disregarded, have been devoted to this problem by Benthem (1977), Bažant and Estenssoro (1979), and Dimitrov et al. (2006); and applied to the DCDC sample by Fett et al. (2008).

Representation of a crack front perpendicularly intersecting the external surface of a sample, along with the two spherical and cylindrical coordinate sets used to describe the corner singularity (after Dimitrov, Buchholz, and Schnack, 2006).
The local symmetry of the crack problem around this singular point is rather spherical than cylindrical (as it is the case for a current point along the crack front away from the edge where classical 2D approaches hold). The asymptotic displacement field u should thus be expressed as
where KCP denotes the corner stress intensity factor, and (r, θ, φ) are the spherical coordinates around the corner point as in Figure 6. The radial dependency (where r is the distance from the corner point) is a power law with a complex exponent λ called corner singularity,
where K(z) represents the evolution of the classical SIF along the crack front as a function of the distance z from the corner point at the sample surface
The classical value λ=1/2, typical of 2D solutions, marks a breakeven point with respect to the limit of K(z) for z→0, i.e. in the neighborhood of the corner point. According to Dimitrov et al. (2006), if the real part of the corner singularity λ is smaller than 1/2, then the SIF K(z) will tend to infinity for z→0. This case is denoted as a “strong-singularity,” and it gives rise to enhanced crack propagation near the surfaces even for a very small load. On the other hand, if the real part of the corner singularity λ is larger than 1/2, then the SIF K(z) will tend to zero for z→0. This case is denoted as a “weak singularity,” and it gives rise to a vanishing propagation velocity of the crack corner point even when the crack propagates (away from the specimen surface). For the sake of simplicity, we will refer here to λ as the real part only, which determines the main radial scaling of the asymptotic solutions, and we limit our description to a crack plane that is perpendicular to the external surface of the sample and to macroscopic mode I loading. Benthem (1977) and Bažant and Estenssoro (1979) have shown that for a crack front merging perpendicularly to the free surface, the singularity is weak, resulting in a vanishing SIF at the corner point. In the general case, if the crack front strikes the external surface with an angle α (measured from the normal to the external surface, like in Figure 3), the corner singularity λ can be expressed as a universal decreasing function of the angle α and an increasing function of the Poisson’s ratio ν of the material.
Bažant and Estenssoro (1979) and subsequently Dimitrov et al. (2006) have proposed an important interpretation of the consequences of this corner point singularity on the evolution of the crack front shape during the ensuing crack propagation. Notably, in the case of a strong singularity (λ<1/2) the crack will advance faster at the surface than in the bulk, thus inducing a reduction of the crack front angle α and hence an increase of λ. On the other hand, in the case of a weak singularity (λ>1/2), the crack corner point will be arrested, and the crack will advance faster in the bulk, thus inducing an increase of the crack front angle α and hence a decrease of λ. It is thus a reasonable conjecture that the crack will reach a steady-state crack propagation only after the corner point singularity has converged to the classical exponent λ=1/2, when the SIF K(z) becomes a constant along the crack front. The crack front angle will thus reach a fixed angle α that only depends on Poisson’s ratio. For these reasons, the steady-state propagation is a very convenient situation to perform a multiscale analysis. We remark that despite the expected corner singularity for steady-state propagation has the same exponent λ=1/2 as for the in plane displacement field in the classical 2D crack tip singularity, the out-of-plane displacement at a corner point should also present a r1/2 singularity, which is not predicted by 2D solutions neither in plane stress nor in plane strain. In order to test this conjecture, we perform our investigations on two glasses with a different Poisson’s ratio.
3 In situ investigations of crack propagation
In the present experiments, fractures were initiated and propagated on a DCDC sample using a precision loading apparatus (based on a Microtest load cell produced by Deben, Woolpit, UK) (cf. Figure 7). The DCDC test setup is particularly convenient for these studies due to its excellent stability and compactness (Janssen, 1974).

Experimental setup for in situ AFM imaging of the slow crack propagation in a DCDC specimen.
The parallelepipedic DCDC samples of dimension 2w×2t×2L (4×4×40 mm3±10 μm and 5×5×25 mm3±10 μm) were polished to a RMS roughness of 0.5 nm (for an area of 1×1 μm2), and a hole of radius R=(500±10) μm was drilled at their center to trigger the initiation of the two symmetric fractures of length a.
Two kinds of oxide glasses were tested: pure fused silica glass [Suprasil 311, Heraeus, Germany, Young modulus E=(72±2) GPa, Poisson’s ratio ν=(0.17±0.01)] and lithium-aluminum-silicate glass [produced by Saint-Gobain and called LAS in the following, with E=(83±2) GPa and ν=(0.22±0.01)], which is the same glass used by Célarié et al. (2003).
All measurements are done after an extensive stabilization consisting of several hours of steady-state propagation, so that crack propagation conditions can be considered as stable. We also insure stable environmental conditions of temperature (±1°C) and relative humidity (±1%). The propagation velocity is accurately measured in the range between 10-5 and 10-12 nm/s. The details of the setup and techniques can be found in Célarié (2004) and Grimaldi, George, Pallares, Marlière, and Ciccotti (2008). The macroscopic value of the SIF K was computed according to one of the most recent 2D finite-element analyses by Pallares et al. (2009):
where σ is the external load; a is the crack length; the set of parameters is c0=0.3156, c1=0.7350, c2=0.0346, c3=-0.4093, c4=0.3794, and c5=-0.0257 for 2.5≤w/R≤5; and the range of applicability is w<a<L-2w.
4 3D macroscopic analyses of the DCDC specimen
4.1 Crack front shape
The crack front shape is measured in situ by means of a CCD camera at different stages of crack propagation. Several high-resolution images are stitched to obtain the whole crack front spanning the 5-mm thickness of the sample (cf. Figure 8). The crack front can be fitted very accurately by a parabolic shape, providing the value of the terminal angle α. This angle is found to be independent on the conditions of loading and environment, and it assumes two clearly different values for the two glasses. The average value for silica glass is α=(8.5±1)°, while for the LAS glass it is α=(15±1)°. The dominant increasing dependency of α on the Poisson’s ratio is qualitatively consistent with the predictions of Bažant and Estenssoro (1979), although the theoretical values are somehow lower (respectively α=5.1° for silica glass and 7.3° for LAS glass, for λ=1/2).
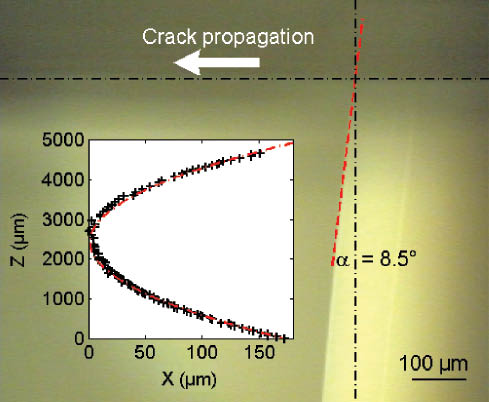
Experimental in situ image of the crack front at the free surface (z=0) in a DCDC fused silica glass sample. Inset: parabolic fit over the whole crack front.
4.2 Out-of-plane displacement
The measurements of the out-of-plane displacement on the DCDC samples were performed by an optical profilometer (Wyko NT9100, Bruker, California), placed in a metrological room with temperature T=(20.0±0.1)°C and relative humidity RH=(50±1)%. By using phase-shifting interferometry, the instrument can reach subnanometric vertical resolution, with the lateral resolution being limited by the ×5 lens quality (±500 nm on 1.27×0.95 mm2 images).
A typical image on silica glass is shown in Figure 9B. The measured out-of-plane displacement field uz describes a funnel centered at the crack tip, which vertically spans 50 nm over the mm scale of the image, and is thus not affected by the nanometric surface roughness. Considering the large lateral scale of observation, this displacement field can be clearly attributed to an elastic effect related to the transverse Poisson contraction caused by the in plane tensile stress fields around the crack tip.

Comparison between (A) finite-element simulation and (B) optical profilometry measurements of the out-of-plane displacement field of a crack in silica glass. The weak residual is shown in (C). Two orthogonal cross-sections intersecting at the crack tip are shown in (D).
These results were compared to the out-of-plane displacement field predicted by the 3D finite-element simulation (described in detail in Section 6), which accounts for the experimentally measured shape of the crack front. An excellent agreement was reached on the whole range of scales spanned by the optical images, as illustrated in Figure 9 for silica glass. The residual error is less than 10% of the image vertical dynamics and can be attributed to a weak additional mode III loading present in the experiment but not included in the simulation.
5 Nanoscale analysis of the asymptotic fields
The AFM observations are done in tapping mode on a D3100 from Veeco Metrology Inc., Santa Barbara, California. After an extensive stabilization consisting of several hours of steady-state crack propagation and imaging, each AFM image series is acquired within a few hours, so that crack propagation conditions can be considered as stable and AFM drifts are minimized. This provides optimal conditions of the application of DIC techniques. A detailed description of techniques can be found in Han et al. (2010), but we recall here the most relevant information for interpreting the results.
The aim of the technique is to extract the displacement field between two AFM topographic images, the reference image
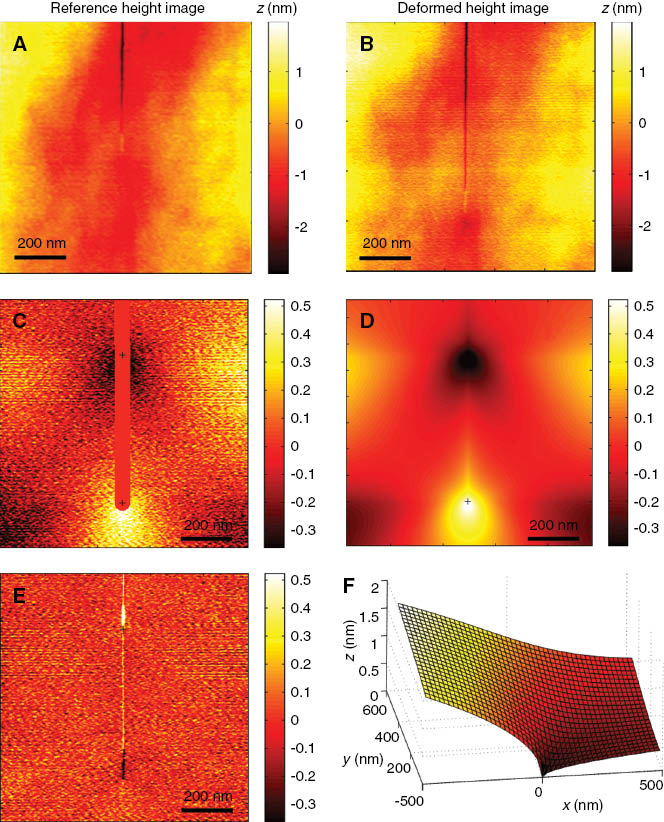
Schematics for the IDIC analysis. (A) and (B) are respectively the reference and deformed AFM height images. (C) Raw residual field obtained after correction of in-plane displacement. Note that the crack path is masked for the IDIC analysis. (D) Fitted displacement field,
where
Six of the base fields represent regular transformations such as uniform extension or shear, which allows for the correction of AFM drifts. Additionally, four others represent the linear elastic fracture mechanics in-plane and out-of-plane singular fields on each image. The steady-state crack propagation condition can be used to enforce the identity of the crack tip fields on the two images after translation along the crack path direction, thus reducing the number of unknowns.
The in-plane component of the crack tip field can be well approximated by the 2D plane stress condition. On the other hand, the out-of-plane component
The analysis on a first image pair on silica glass provided the coefficients: aDIC=0.28, bDIC=0.67, and cDIC=-0.72. These values were found to be compatible with all ensuing analyses on silica glass, in agreement with that expected by the conjecture of Dimitrov et al. (2006), which lets them depend only on the Poisson’s ratio. We thus fixed their values in the IDIC code for silica glass, reducing the analysis to the determination of one single unknown physical parameter corresponding to the mode I SIF K. An example of application of the final technique to a silica glass sample can be found in Figure 10. For this first investigation, the crack propagation velocity is v=(0.7±0.1) nm/s, the applied force F=(1844±4) N, and the average crack length a=(6145±10) μm. The SIF can be estimated to
A series of five images of the same 1×1 μm2 zone swept by a crack is first analyzed. As an example, we report in Figure 10 the steps of the IDIC analysis of the first two AFM height images of the series. The reference and deformed height images are represented in Figure 10A and B. The residual map without out-of-plane displacement is shown in Figure 10C, and the corresponding elastic solution is represented in Figure 10D. Figure 10E shows that no obvious long-range trend is left in the final residual. The out-of-plane displacement due to the opening of a crack at the origin is shown in Figure 10F. The quality of the IDIC measurement is evaluated by measuring the normalized residual, i.e. the standard deviation of the remaining residual, normalized by the peak-to-valley roughness of the original topographic image. In the present cases, even though the kinematic field was adjusted with very few parameters, the normalized residual n is very stable at 1.6%, a remarkably low value that gives confidence in the convergence of the procedure. The measured SIF values (using the elastic moduli for silica glass: Young modulus of 72GPa and a Poisson’s ratio of 0.17) is KDIC=(0.39±0.04) MPa.m1/2, which is in excellent agreement with the macroscopic value of (0.39±0.02) MPa.m1/2 estimated independently. Note the huge difference of length scale used in both estimates (millimeter vs. nanometers). A second image series was tested in Han et al. (2010) after zooming to 200×200 nm2 images around the crack tip. Although the residuals of 5% are slightly higher, they still do not show any trend out of a 10-nm distance from the crack tip, which represents the lateral resolution limit of the AFM related to the tip size. Moreover, the locally estimated value of KDIC of (0.41±0.05) MPa.m1/2 is still in excellent agreement with the macroscopic measurement.
6 3D elastic finite-element simulation
The 3D finite-element simulation used to represent the linear elastic stress and displacement fields of a realistic DCDC specimen with curved crack fronts is implemented by the finite-element code CAST3M (CAST3M software is developed by CEA-Saclay, France. Reference web page: http://www-cast3m.cea.fr/cast3m/index.jsp). The mesh is constituted of linear elastic isotropic eight-node elements. The details of the sample loading configuration and the mesh geometry are shown in Figure 11.
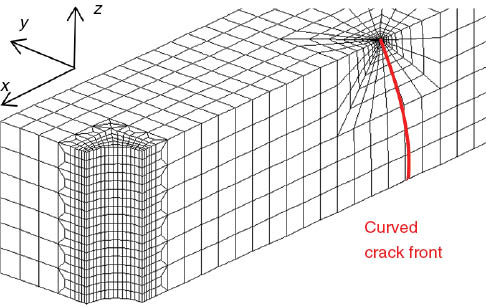
3D mesh for the finite-element simulation of the DCDC sample. Due to symmetry, only 1/8th of the specimen is meshed. The crack front is curved to a parabolic front with terminal angle α, and the mesh is densified at the corner point singularity.
The material’s linear elastic response is defined by the Young’s modulus E and Poisson’s ratio ν of silica glass, as defined in Section 3. Thanks to the symmetry of the geometry, we can limit the simulation to one-eighth of the specimen by imposing the boundary conditions ux=0 along the symmetry plan normal to
To investigate the influence of the geometrical parameters on the corner singularity λ, a series of meshes was designed with 25 values for the terminal angle α ranging from 6° to 17.5°. The rest of the geometry is kept constant, the external size and hole are as in our test samples, and the crack length and loading were the same as for the tests with optical profilometer in order to reproduce at best the macroscopic behavior of the out-of-plane displacement field. On the other hand, the local asymptotic behavior at the corner point should be independent of the crack length.
We already presented in Section 4 (Figure 9) the good performance of the 3D simulation against the out-of-plane measurement of the optical profilometer on a 1-mm large image. We will focus here on the description of the corner point singularity in order for the 3D FE simulation to bridge the two scales of experimental observation.
In order to extract the corner point singularity λ, three different indicators are investigated: these consist of the power law fit of the two main components ux and uy of the mode I displacement field and of the 2D SIF profile K(z) when approaching the corner point. For both components of the displacement fields, the fit is done at the free surface along the crack lips (x>0, y=0) in the distance range 1 nm<x<1 μm from the tip, which according to Pallares et al. (2009) is well included in the region of K-dominance (i.e. dominance of the Irwin square root singularity in a 2D analysis) of the DCDC. The SIF K(z) is evaluated along the crack front using the J integral estimators included in the code and then fitting a power law exponent according to Equation (4). The obtained values of the corner singularity exponent λ are shown in Figure 12 (left) as a function of the terminal angle α. We observe an overall good agreement between the estimates obtained using ux, uy, and K(z). By applying the conjecture of a corner singularity exponent λ=1/2 expected for a steady-state crack propagation, the first three indicators would predict a terminal angle α=7±1°, which is intermediate between the theoretical prediction of 5.1° according to Bažant and Estenssoro (1979) and our measured value of 8.5±1° (cf. Section 4.1). The agreement is quite satisfactory. Some more precise results may be achieved by refining the mesh along the crack front within the material bulk, but the reach of such a precision is out of the scope of the present investigation aimed at understanding the appropriate bridging over length scales.
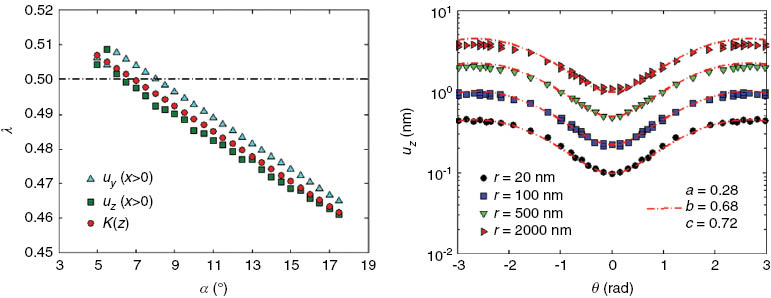
Finite-element calculations. Left: representation of the corner singularity exponent λ as a function of the terminal angle α obtained for the Poisson’s ratio ν=0.17 of silica glass. Right: representation of the out-of-plane displacement uz(r, θ) obtained by simulation (λ=1/2) as a function of θ for different r. The red dashed lines correspond to the fit according to Equation (10).
We can also use the FE simulation to test the angular functions determined by DIC for the corner point singularity. We represent in Figure 12 (right) the out-of-plane displacement uz(r, θ) obtained by the simulation as a function of the angle θ for different distances r from the crack tip in the domain 20<r<2000 nm. The expressions (8, 9, and 10) used to adjust the DIC results were also plotted in the same figure by using the same set of coefficients (aDIC=0.28, bDIC=0.67, and cDIC=-0.72). The residuals become larger than 10% only when r>2000 nm. This remarkable agreement is a further validation of the sound multiscale reconstruction of the 3D mechanics of the DCDC specimen from the macroscopic scale down to the asymptotic corner singularity field that dominates the in situ AFM images.
7 Discussion and conclusion
The present multiscale investigation offers a consistent mechanical view of the steady-state subcritical fracture propagation in a DCDC specimen. The 3D analysis of the crack tip field is shown to be an unavoidable step to link the macroscopic features of the loading and the nanoscale asymptotic crack tip field as measured at the accessible free surface of the sample. The macroscopic loading is transferred to the crack front singular fields through the structural response of the DCDC sample, which is essentially captured by a 2D analysis at large to intermediate scales. When approaching the crack front at distances comparable to the sample thickness w, the details of its non-straight geometry become dominant, yet locally we can still approximate the neighborhood of the crack front by a 2D fracture field. However, when approaching the incidence of the crack front onto the free surface, the 2D symmetry is essentially broken, and a different self-similar corner point singularity emerges with an intrinsic 3D structure. This allows a range of possible local corner singularities, yet it was argued that only the exponent λ=1/2 is compatible with a steady-state propagation of the crack front, inducing a prediction of the terminal angle α as only related to the Poisson’s ratio, together with a prescription of r1/2 fields also for the out-of-plane components of displacement (a result that is strongly different from the 2D predictions in either plane stress or plane strain conditions). Our multiscale experimental and numerical analysis provides a consistent validation of this global picture, and the ultimate proof is that the local SIF obtained through the DIC analysis of submicrometric sized AFM images close to the crack tip corner point provides a robust and consistent estimation of the macroscopically measured SIF under different propagation conditions. The key of this success is the quality of the steady-state crack propagation. By enforcing several hours of equilibrated slow crack growth in a very stable sample such as DCDC, the crack front progressively finds a shape that remains invariant throughout the entire propagation, equilibrated through all scales and under a very pure mode I loading (thanks to the principle of local symmetry). This allows both to relate the macroscopic and microscopic loading very accurately and to insure that the crack tip displacement field in a series of subsequent AFM images is substantially identical. This mechanical information is the key to separate this nanometric out-of-plane displacement field from the nanometric surface roughness, which has the same order of magnitude and which generally prevents quantitative evaluation of small displacement fields on AFM images. We underline that although AFM nanoscale measurements have generally a poor metrological content due to the interplay of drifts, tip/sample interactions, and imaging feedback details, the use of DIC to extract displacement fields from very similar images can provide very accurate and metrological results, especially when the singular nature of the crack tip fields under study allows a clear separation from the more regular AFM drifts. A second key of this success is the incredible mechanical properties of silicate glasses, which were proved to allow the use of continuum mechanics and linear elasticity down to 10-nm scales from the crack tip, which is by itself an amazing result. Full 3D elastic solutions were used here as a first reasonable guess to establish a connection from the macroscopic scale down to the nanometric neighborhood of the corner point singularity. However, the extremely low values of the residual fields measured by DIC and especially the absence of any observable trend in the residual fields out of a 10-nm region from the crack tip become a striking evidence of the appropriateness of these elastic solutions to describe the crack tip fields down to the extreme lateral resolution of AFM imaging. This set of measurements constitutes a clear and sound solution to the long debate on the length scales of the inelastic processes acting at the crack tip of glasses during stress-corrosion slow crack propagation (Wiederhorn et al., 2013).
What about the reported AFM observations suggesting crack tip plasticity at 100-nm scales? As discussed above, the crack tip topography as studied by Guilloteau et al. (1996) and Célarié et al. (2003) calls for proper 3D corner point solutions to be quantitatively interpreted, and these early experimental results should be revisited within such a framework. Lopez-Cepero, Wiederhorn, Fett, and Guin (2007) showed that the apparent nanoscale cavities observed by Celarié et al. (2003) (cf. Figure 2, right) could originate from the superposition of the out-of-plane crack tip elastic depression and of the surface roughness that has the same order of magnitude. In a previous investigation (Lechenault et al., 2010), we also showed that the 20- to 100-nm cutoff length observed in the correlation functions of the nanoscale roughness of the fracture surfaces can be generated by a subtle non-linear filtering induced by the geometrical interaction of the nanoscale-sized AFM tip (subject to wear) and the self-affine nanoscale roughness. These subtle artifacts should be used as an important lesson concerning the danger of misinterpreting very resolved nanoscale investigations. The multiscale mechanical consistency of the reported study is a precious safeguard against this risk.
Is this the end of the story concerning the active debate on plasticity and damage around the crack tip in glasses? We believe that the question is settled concerning the 100-nm scale, but our present analysis cannot resolve features below the 10-nm scale, which is the limit of lateral resolution of AFM in situ investigations (and even in post-mortem fractographic investigations when looking for a cutoff in the lateral lengths). And indeed when considering the separation of two atoms, non-linearities of interactions are evidently involved, resulting at least in non-linear elasticity and most probably in plasticity with irreversible reorganization of the amorphous atomic arrangement. Moreover, when examining more closely the literature on the evidences of water penetration at the crack tip, we find several experimental evidences of water penetration in regions of a few nanometers (yet no more than 10 nm). These are generally post-mortem investigations of the water concentration depth profile on crack surfaces in silicate glasses performed by resonant nuclear reaction (Lanford et al., 1979), optical reflectivity (Stavrinidis & Holloway, 1983), and more recently by small angle neutron reflectivity (Lechenault et al., 2011). These evidences are very strong, but as in all post-mortem investigations, they do not provide details on the moment where water really penetrated and on the mechanisms of coupling with the stress-corrosion crack propagation. A more recent AFM post-mortem investigation by Wiederhorn et al. (2011) has shown that a possible mechanical coupling between water penetration in the crack tip region and crack propagation in silica glass could come from the induced local swelling of the glass and the consequent build up of local compressive stresses, which can have an effect of shielding crack tip stresses. This mechanism is analogous to the well-studied coupling between ion exchange leaching in alkali-silicate glasses and the crack tip stresses (Fett, Guin, & Wiederhorn, 2005), which results in the presence of the stress-corrosion threshold of propagation described in Figure 1 (right). It is noteworthy that, even in the more highly corrosive context of leachable glasses, the volume affected by leaching and compressive stresses is limited to a region of size well below 10 nm from the crack tip (Célarié, Ciccotti, & Marlière, 2007; Wiederhorn et al., 2013).
In order to discuss the final implications of the present analysis on the understanding of the stress-corrosion mechanisms, we recall some recently performed complementary observations thanks to our in situ AFM investigation technique. By using a complementary AFM imaging technique called phase imaging, we showed that the crack tip cavity is so sharp that it is filled with a spontaneous water condensation from the ambient moist atmosphere in a submicrometric neighborhood of the crack tip (Grimaldi et al., 2008). While this condensate was shown to be close to pure water at condensation equilibrium in pure silica glass (Pallares, Grimaldi, George, Ponson, & Ciccotti, 2011), complementary observations on alkali–silicate-glasses (Célarié et al., 2007) have shown that the chemical composition of this condensate keeps evolving in time due to the leaching of sodium out from the glass. These observations are of the greatest importance to the understanding of the stress-corrosion kinetics under ordinary moist atmosphere since this condensate constitutes the effective local environmental condition at the crack tip region where the stress-corrosion occurs.
We can conclude our discussion by stating that the combination of the investigations of crack tip stresses along with the understanding of the local environmental condition is likely to offer an undisputable key to a thorough understanding of the role of glass composition on the measured phenomenological parameters of the stress-corrosion curves (Wiederhorn et al., 2013). Another major perspective comes from the recent outstanding developments in the performances of molecular dynamics towards the simulation of stress-corrosion reactions on space and time scales that could soon approach from below the limits of the measurable range accessible by our in situ AFM experimental investigations (Du & Cormack, 2005; Kermode et al., 2008; Mischler, Horbach, Kob, & Binder, 2005), thereby opening a formidable opportunity for a novel experimental/modeling dialog.
Acknowledgments
We wish to thank S. Wiederhorn, D. Bonamy, E. Bouchaud, K. Ravi-Chandar, T. Fett, J.P. Guin, and C. Marlière for fruitful scientific discussions; I. Serre and A. Van Gorp for helping us using their optical profilometer; S. Chapuliot and C. Kumar for helping us in the design of the finite-element mesh; and B. Rufflé for the Brillouin measurements of the Poisson’s ratios. All co-authors of this work wish to acknowledge the financial support of ANR Grant “Corcosil” No. ANR-07-BLAN-0261-02.
References
Bažant ZP, Estenssoro LF. Surface singularity and crack propagation. Int J Solids Struct 1979; 15: 405–426.10.1016/0020-7683(79)90062-3Search in Google Scholar
Benthem JP. State of stress at the vertex of a quarter-infinite crack in a half-space. Int J Solids Struct 1977; 13: 479–492.10.1016/0020-7683(77)90042-7Search in Google Scholar
Bonamy D, Ponson L, Prades S, Bouchaud E, Guillot C. Scaling exponents for fracture surfaces in homogeneous glass and glassy ceramics. Phys Rev Lett 2006; 97: 135504.10.1103/PhysRevLett.97.135504Search in Google Scholar PubMed
Brambilla G, Payne DN. The ultimate strength of glass silica nanowires. Nano Lett 2009; 9: 831–835.10.1021/nl803581rSearch in Google Scholar PubMed
Bunker BC. Molecular mechanisms for corrosion of silica and silicate glasses. J Non-Cryst Solids 1994; 179: 300–308.10.1016/0022-3093(94)90708-0Search in Google Scholar
Célarié F, Prades S, Bonamy D, Ferrero L, Bouchaud E, Guillot C, Marlière C. Glass breaks like metal, but at the nanometer scale. Phys Rev Lett 2003; 90: 075504.10.1103/PhysRevLett.90.075504Search in Google Scholar PubMed
Célarié F. Dynamique de fissuration a basse vitesse des matériaux vitreux. PhD thesis, Université Montpellier 2, 2004.Search in Google Scholar
Célarié F, Ciccotti M, Marlière C. Stress-enhanced ion diffusion at the vicinity of a crack tip as evidenced by atomic force microscopy in silicate glasses. J Non-Cryst Solids 2007; 353: 51–68.10.1016/j.jnoncrysol.2006.09.034Search in Google Scholar
Ciccotti M. Stress-corrosion mechanisms in silicate glasses. J Phys D: Appl Phys 2009; 42: 214006.10.1088/0022-3727/42/21/214006Search in Google Scholar
Dimitrov A, Buchholz FG, Schnack E. 3D-corner effects in crack propagation. Comput Model Eng Sci 2006; 12: 1–25.Search in Google Scholar
Du J, Cormack AN. Molecular dynamics simulation of the structure and hydroxylation of silica glass surfaces. J Am Ceram Soc 2005; 88: 2532–2539.10.1111/j.1551-2916.2005.00352.xSearch in Google Scholar
Dugdale DS. Yielding of steel sheets containing slits. J Mech Phys Solids 1960; 8: 100–104.10.1016/0022-5096(60)90013-2Search in Google Scholar
Fett T, Guin JP, Wiederhorn SM. Interpretation of effects at the static fatigue limit of soda-lime-silicate glass. Eng Fract Mech 2005; 72: 2774–2791.10.1016/j.engfracmech.2005.07.002Search in Google Scholar
Fett T, Rizzi G, Creek D, Wagner S, Guin JP, Lopez-Cepero JM, Wiederhorn SM. Finite element analysis of a crack tip in silicate glass: no evidence for a plastic zone. Phys Rev B 2008; 77: 174110.10.1103/PhysRevB.77.174110Search in Google Scholar
Freiman SW, Wiederhorn SM, Mecholsky JJ. Environmentally enhanced fracture of glass: a historical perspective. J Am Ceram Soc 2009; 92: 1371–1382.10.1111/j.1551-2916.2009.03097.xSearch in Google Scholar
Gehrke E, Ullner C, Mahnert M. Fatigue limit and crack arrest in alkalicontaining silicate glasses. J Mater Sci 1991; 26: 5445–5455.10.1007/BF02403942Search in Google Scholar
Griffith AA. The phenomena of rupture and flow in solids. Phil Trans R Soc London A 1920; 221: 163–198.10.1098/rsta.1921.0006Search in Google Scholar
Grimaldi A, George M, Pallares G, Marlière C, Ciccotti M. The crack tip: a nanolab for studying confined liquids. Phys Rev Lett 2008; 100: 165505.10.1103/PhysRevLett.100.165505Search in Google Scholar PubMed
Guilloteau E, Charrue H, Creuzet F. The direct observation of the core region of a propagating fracture crack in glass. Europhys Lett 1996; 34: 549–553.10.1209/epl/i1996-00493-3Search in Google Scholar
Guin JP, Wiederhorn SM. Fracture of silicate glasses: ductile or brittle? Phys Rev Lett 2004; 92: 215502.10.1103/PhysRevLett.92.215502Search in Google Scholar PubMed
Han K, Ciccotti M, Roux S. Measuring nanoscale stress intensity factors with an atomic force microscope. EPL 2010; 89: 66003.10.1209/0295-5075/89/66003Search in Google Scholar
Janssen C. Specimen for fracture mechanics studies on glass. Proc. 10th Int. Cong. on Glass, Kyoto, Japan, 1974, pp. 10.23–10.30.Search in Google Scholar
Kermode JR, Albaret T, Sherman D, Bernstein N, Gumbsch P, Payne MC, Csanyi G, De Vita A. Low-speed fracture instabilities in a brittle crystal. Nature 2008; 455: 1224–1228.10.1038/nature07297Search in Google Scholar
Lanford WA, Davis K, Lamarche P, Laursen T, Groleau R, Doremus RH. Hydration of soda-lime glass. J Non-Cryst Sol 1979; 33: 249–266.10.1016/0022-3093(79)90053-XSearch in Google Scholar
Lawn BR. Fracture of brittle solids, 2nd ed., Cambridge: Cambridge University Press, 1993.10.1017/CBO9780511623127Search in Google Scholar
Lechenault F, Pallares G, George M, Rountree C, Bouchaud E, Ciccotti M. Effects of finite probe size on self-affine roughness measurements. Phys Rev Lett 2010; 104: 025502.10.1103/PhysRevLett.104.025502Search in Google Scholar PubMed
Lechenault F, Rountree C, Cousin F, Bouchaud JP, Ponson L, Bouchaud E. Evidence of deep water penetration in silica during stress corrosion fracture. Phys Rev Lett 2011; 106: 165504.10.1103/PhysRevLett.106.165504Search in Google Scholar PubMed
Lopez-Cepero JM, Wiederhorn SM, Fett T, Guin JP. Do plastic zones form at crack tips in silicate glasses? Int J Mater Res 2007; 98: 1170–1176.10.3139/146.101583Search in Google Scholar
Marsh DM. Plastic flow and fracture of glass. Proc R Soc London A 1964; 282: 33–43.10.1098/rspa.1964.0210Search in Google Scholar
Maugis D. Review: subcritical crack growth, surface energy, fracture toughness, stick-slip and embrittlement. J Mater Sci 1985; 20: 3041–3073.10.1007/BF00545170Search in Google Scholar
Michalske TA, Freiman SW. A molecular mechanism for stress corrosion in vitreous silica. J Am Ceram Soc 1983; 66: 284–288.10.1111/j.1151-2916.1983.tb15715.xSearch in Google Scholar
Mischler C, Horbach J, Kob W, Binder K. Water adsorption on amorphous silica surfaces: a Car–Parrinello simulation study. J Phys: Cond Matt 2005; 17: 4005–4013.10.1088/0953-8984/17/26/001Search in Google Scholar
Pallares G, Ponson L, Grimaldi A, George M, Prevot G, Ciccotti M. Crack opening profile in DCDC specimen. Int J Fracture 2009; 156: 11–20.10.1007/s10704-009-9341-8Search in Google Scholar
Pallares G, Grimaldi A, George M, Ponson L, Ciccotti M. Quantitative analysis of crack closure driven by Laplace pressure in silica glass. J Am Ceram Soc 2011; 94: 2613–2618.10.1111/j.1551-2916.2011.04471.xSearch in Google Scholar
Prades S, Bonamy D, Dalmas D, Bouchaud E, Guillot C. Nano-ductile crack propagation in glasses under stress corrosion: spatiotemporal evolution of damage in the vicinity of the crack tip Int. J Solids Struct 2005; 42: 637–645.10.1016/j.ijsolstr.2004.06.024Search in Google Scholar
Roux S, Hild F. Stress intensity factor measurements from digital image correlation: post-processing and integrated approaches. Int J Fracture 2006; 140: 141–157.10.1007/s10704-006-6631-2Search in Google Scholar
Stavrinidis B, Holloway DG. Crack healing in glass. Phys Chem Glasses 1983; 24: 19–25.Search in Google Scholar
Taylor EW. Mechanisms of fracture in glass and similar brittle solids. Nature 1949; 163: 323–323.10.1038/163323a0Search in Google Scholar
Tomozawa M. Effect of stress on water diffusion in silica glass. J Am Ceram Soc 1984; 67: 151–154.10.1111/j.1151-2916.1984.tb09634.xSearch in Google Scholar
Tomozawa M. Fracture of glasses. Ann Rev Mater Sci 1996; 26: 43–74.10.1146/annurev.ms.26.080196.000355Search in Google Scholar
Wiederhorn SM. Influence of water vapor on crack propagation in soda–lime glass. J Am Ceram Soc 1967; 50: 407–414.10.1111/j.1151-2916.1967.tb15145.xSearch in Google Scholar
Wiederhorn SM. Fracture surface energy of glass. J Am Ceram Soc 1969; 52: 99–105.10.1111/j.1151-2916.1969.tb13350.xSearch in Google Scholar
Wiederhorn SM, Bolz LH. Stress-corrosion and static fatigue of glass. J Am Ceram Soc 1970; 53: 543–548.10.1111/j.1151-2916.1970.tb15962.xSearch in Google Scholar
Wiederhorn SM, Fett T, Rizzi G, Fünfschilling S, Hoffmann MJ, Guin JP. Effect of water penetration on the strength and toughness of silica glass. J Am Ceram Soc 2011; 94: S196–S203.10.1111/j.1551-2916.2011.04530.xSearch in Google Scholar
Wiederhorn SM, Fett T, Guin JP, Ciccotti M. Griffith cracks at the nanoscale. Int J Appl Glass Science 2013; 4: 76–86.10.1111/ijag.12025Search in Google Scholar
©2015 by De Gruyter
Articles in the same Issue
- Frontmatter
- In this issue
- Editorial
- International Symposium on Environmental Damage Under Static and Cyclic Loads in Structural Metallic Materials at Ambient Temperatures III (Bergamo, Italy, June 15–20, 2014)
- Overviews and reviews
- U.S. Naval Aviation: operational airframe experience with combined environmental and mechanical loading
- Thirty-five years in environmentally assisted cracking in Italy: a point of view
- Fatigue and corrosion fatigue
- Transgranular corrosion fatigue crack growth in age-hardened Al-Zn-Mg (-Cu) alloys
- Effect of cyclic frequency on fracture mode transitions during corrosion fatigue cracking of an Al-Zn-Mg-Cu alloy
- Crack growth behavior of 4340 steel under corrosion and corrosion fatigue conditions
- Modeling of environmentally assisted fatigue crack growth behavior
- Factors influencing embrittlement and environmental fracture
- Pre-exposure embrittlement of an Al-Cu-Mg alloy, AA2024-T351
- Electrochemical approach to repassivation kinetics of Al alloys: gaining insight into environmentally assisted cracking
- Localized dissolution of grain boundary T1 precipitates in Al-3Cu-2Li
- Grain boundary anodic phases affecting environmental damage
- Defect tolerance under environmentally assisted cracking conditions
- Role of Mo/V carbides in hydrogen embrittlement of tempered martensitic steel
- Stress corrosion cracking
- The role of crack branching in stress corrosion cracking of aluminium alloys
- An atomistically informed energy-based theory of environmentally assisted failure
- Discrete dislocation modeling of stress corrosion cracking in an iron
- Quasi-static behavior of notched Ti-6Al-4V specimens in water-methanol solution
- Role of excessive vacancies in transgranular stress corrosion cracking of pure copper
- Multiscale investigation of stress-corrosion crack propagation mechanisms in oxide glasses
- Hydrogen assisted cracking
- Hydrogen effects on fracture of high-strength steels with different micro-alloying
- Environmentally assisted cracking and hydrogen diffusion in traditional and high-strength pipeline steels
- Multiscale thermodynamic analysis on hydrogen-induced intergranular cracking in an alloy steel with segregated solutes