Effect of curved geometrical aspects of Savonius rotor on turbine performance using factorial design analysis
-
Dandun Mahesa Prabowoputra
 ,
Iwan Istanto
,
Iwan Istanto

Abstract
Electricity consumption is expected to increase significantly by 2050. It is essential to ensure that as the increase occurs, there is also a corresponding increase in the proportion of renewable energy sources in the electricity supply. Wind energy has great potential as a promising source of renewable energy. One alternative method for harvesting wind energy is the use of Savonius turbines, which can help expand the collaboration between renewable energy and conventional resources. The critical parts in deploying the Savonius are the consideration of the curved geometrical factor. Thus, this study aims to assess how the geometrical factors of the Savonius turbine affect its performance, and the findings from this research can offer valuable insights for designing an optimal Savonius rotor that aligns with specific requirements. As part of geometrical variations, three different shapes are being modeled and analyzed: one with a phase-shift angle (PSA) of 0°, another with 25°, and a third with 35°. To produce the calculation results, the research employed advanced three-dimensional modeling techniques and the computational fluid dynamics (CFD) method, considering steady conditions and the shear stress transport model. A factorial design analysis was then conducted based on the obtained CFD results to validate the significance of the data research results regarding the impact of these factors on performance. Based on the summarized result trends, the type-1 rotor, with a PSA of 25°, exhibits excellent CPmax performance, achieving a value of 0.32. The results of the factorial design approach analysis indicate that the blade shape, tip-speed ratio, and PSA factors have a significant influence on the performance of the Savonius Rotor.
1 Introduction
The Sustainable Development Goals comprise 17 main agendas, compiled in 2015. One of the critical issues today is Affordable and Clean Energy, the seventh agenda of the SDGs. Agenda 7, with its statement “Ensure access to affordable, reliable, sustainable and modern energy for all,” has five targets to be achieved by 2030 [1]. The agenda has five leading indicators, namely, the proportion of the population with access to electricity, Proportion of population with primary reliance on clean fuels and technology for cooking, Renewable energy share in total final energy consumption, Energy intensity measured as a ratio of primary, and International financial flows to developing countries in support of clean energy research and development and renewable energy. In the renewable energy mix indicator of global final energy consumption, there was only a 1.6% increase over the past decade. In 2020, the renewable energy mix was only 17.7%, which is still far from the target of 30% to be achieved by 2030 [2].
Electrical energy is one of the forms of energy that is consumed at a high rate. The world’s electrical energy consumption is estimated to increase by 80–150% by 2050. The Stated Policies Scenario shows an increase of up to 80%, the Net Zero Emissions Scenario shows an increase of up to 150%, and the Announced Pledges Scenario shows up to 120%. Electricity supply is expected to be dominated by renewable energy sources, including photovoltaic (PV) solar, wind energy, hydropower, geothermal energy, and bioenergy. In general, for all scenarios, the supply of electricity consumption sourced from renewable energy rises to 95%. Of the total renewable energy mix, an estimated 12–30% comes from PV solar and wind energy [3,4,5,6,7,8,9].
Southeast Asian countries possess excellent wind energy potential, which can significantly contribute to the world’s renewable energy consumption. Vietnam, Indonesia, Malaysia, the Philippines, and Thailand are Southeast Asian countries with excellent wind energy potential. The overall wind energy potential in Southeast Asia is 1317.3 GW. Figure 1 shows the distribution of wind energy potential in Southeast Asia [10,11,12,13,14]. This potential indicates that the development of wind energy power plants in Southeast Asia holds significant promise. Developing wind turbines to support the growth of wind energy power plants in Southeast Asia is a valuable effort. Southeast Asia has a significant opportunity to address the deficit in the global renewable energy mix objective. Figure 2 [15] illustrates the annual mix percentages from 2000–2021, highlighting the necessity to expedite the adoption of renewable energy. The advancement of wind turbines in Southeast Asia can facilitate the attainment of SDG 7 objectives for renewable energy composition and installation benchmarks.
![Figure 1
Wind energy potential in Southeast Asia [10].](/document/doi/10.1515/cls-2025-0039/asset/graphic/j_cls-2025-0039_fig_001.jpg)
Wind energy potential in Southeast Asia [10].
![Figure 2
The world’s achievements in renewable energy mix [15].](/document/doi/10.1515/cls-2025-0039/asset/graphic/j_cls-2025-0039_fig_002.jpg)
The world’s achievements in renewable energy mix [15].
The wind power generation system has a main component: the turbine. Turbines are devices that convert mechanical energy into electrical energy. Where the rotor converts the potential energy in the fluid into kinetic energy, several types of rotors can be implemented in water and wind. Cross-flow and Savonius-type rotors are types of rotors that can be implemented in both liquid and gaseous fluids. The cross-flow rotor, combined with the computational fluid dynamics (CFD) method, can achieve a Coefficient of Power (CP) performance of 0.28 with blade angle variations [16,17], and a performance of 0.27 at variations in the number of blades [18]. Savonius, with its blade variation and dual-use capabilities, can enhance rotor performance. The double Savonius modeling research was conducted at tip-speed ratio (TSR) intervals of 0.2–1.4 [19].
Savonius rotors have a simple shape and can be implemented in both wind and water, making this rotor attractive for development. Savonius has good potential for use in energy conversion processes to reduce fossil fuel needs [20,21,22,23,24,25,26,27]. Geometry factors have a significant influence on the performance of the Savonius rotor. Savonius rotors can improve performance by 8–25% [28]. Geometry factors have a considerable influence. These factors are aspect ratio (AR), number of stages, and twist angle. The study shows that the two-stage performs well when applied in the wind, where the resulting Cpmax is close to 0.18 [29]. In other studies, helical blades treated on hydro turbines achieved the best performance at a torsion angle of 135° [30]. The optimum AR in the research conducted is 1. The AR has a significant impact on the performance of Savonius hydro turbines, but not with wind turbines [31]. The phase-shift angle (PSA) on the Savonius wind rotor shows that performance improvement occurs at a PSA less than 60° [32,33]. Changes in blade shape can improve Savonius’ performance – modified forms of new blade shapes, such as Bach-type Savonius and Elliptical Savonius [34]. A study found the best overlap ratio to be 0.167 [35]. Stage-ratio (SR) modification shows an interaction with a PSA on the effect of Savonius performance [36]. Savonius research can be done using experiments, analytical methods, and CFD modeling, so it is highly flexible for development. Material factors also influence the performance of Savonius rotors, where aluminum alloy is a suitable material for the Savonius design [18,37,38,39,40].
Research conducted on modifying the geometry of the Savonius rotor reveals that geometric factors significantly impact turbine performance. Unfortunately, some previous research still examines each factor independently, without considering the relationships between factors. This can be achieved by employing factorial design analysis (FDA) and ANOVA, which are used to refine the analysis of factor influence and scientifically highlight their impact. Savonius rotor, with its advantages, can be an alternative rotor developed to increase the installation of wind power plants. Therefore, research on the performance of the Savonius wind rotor is the right step in supporting the achievement of the seventh Agenda of the SDGs. This research employed three-dimensional modeling to investigate the impact of blade shape and PSA on the performance of a two-stage Savonius wind rotor. This research will be supported by FDA to determine the significance of the influence of these geometries on the performance of the Savonius rotor. FDA will strengthen the results by showing the significance of a factor’s effect on turbine performance [41,42,43,44,45]. This research provides support for achieving the SDG7 target of substantially increasing the share of renewable energy in the global energy mix, expanding infrastructure, and enhancing technology to supply modern and sustainable energy services to all in developing countries.
2 Design and methodology
2.1 Savonius rotor
1920 was the year that saw the publication of the Savonius rotor’s initial design, and this rotor was later used in fluids that were composed of water and wind [46]. One type of vertical-axis turbine is known as a Savonius turbine. The conventional Savonius is composed of blades formed from cut pipe cylinders, positioned on opposite sides to form the letter “S” [47]. The Savonius shape, as seen in Figure 3a, is a straightforward design consisting of a blade, a shaft, and an endplate. The Savonius design is inspired by the concept of the Flanner ship turbine, which enables the rotation of two semi-circular blades in a sideways direction. This principle is illustrated in the schematic shown in Figure 3b [48]. It is possible to enhance the performance of the Savonius rotor by conducting extensive research on its advantages, including its straightforward shape, which facilitates easy construction [49].
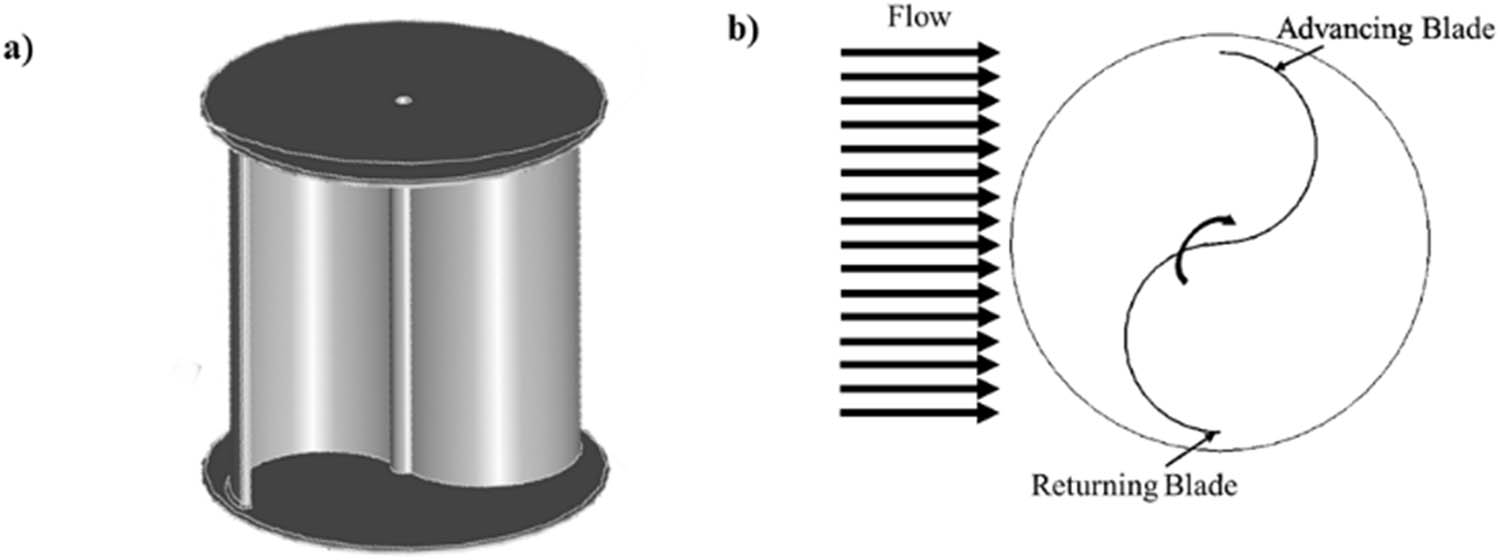
(a) Design of Savonius, and (b) working principle of Savonius.
Savonius’s research is facilitated by the ability to use CFD modeling, as many of his developments are driven by geometric changes and are progressing rapidly. Table 1 summarizes several advancements in wind-Savonius rotor design over the past 5 years, emphasizing geometry factors and utilizing CFD techniques. Lajnef et al. [50] investigated the modification of the helix rotor using two methods: modeling and experimentation. The validation of the modeling research conducted is demonstrated through both methods. The research aimed to enhance comprehension of the aerodynamic working principles of blade modification by analyzing the pressure distribution contours. Therefore, the optimal angle for the geometry change in this analysis remains to be determined due to deficiencies in comparing helix angle variations. Patel et al. [51] researched the effect of changing the blade’s shape to elliptical and applying it to a two-stage Savonius. The research was conducted experimentally and using numerical 3D modeling. The results show that the two-stage elliptical shape performs better than the single-stage.
Savonius’ research in recent years
| Year | Authors | Findings |
|---|---|---|
| 2024 | Lajnef et al. [50] | Knowing the impact of the helix shape on the Savonius rotor, where the resulting CPmax is 0.214 |
| 2024 | Patel et al. [51] | According to both numerical and experimental assessments, the one-stage rotor’s maximum power coefficient (CPmax) is 0.19, although the numerical analysis suggests a value of 0.12. In the case of the two-stage rotor, the maximum CP value corresponds to 0.21 for the numerical analysis and 0.17 for the experimental analysis |
| 2023 | Prabowoputra et al. [36] | The 2:1 stage ratio achieves a CPmax of 0.29, indicating optimal performance of the wind turbine |
| 2023 | Chegini et al. [52] | Combining the Darrieus and Savonius turbines enhances the self-start capability by 26.91%. Front and side deflectors significantly enhance the efficiency of the hybrid turbine, resulting in a 30 and 26% increase, respectively |
| 2023 | Kumar and Kumar [53] | “Divergent slot” improves the performance of the Savonius rotor, and CPmax is produced by Savonius with “Divergent slot” blade variation |
| 2022 | Torres et al. [54] | Based on the findings, it is determined that the most efficient turbine has an AR of 8.38, an overlap ratio of 0.08, a twist angle of 174.05°, and is equipped with two blades |
| 2022 | Prabowoputra and Prabowo [32] | PSA has a significant influence on the performance of the Savonius rotor. The CPmax modeling result is generated by PSA 30° with a value of 0.29 |
| 2021 | Hassanzadeh et al. [55] | Through extensive research, it has been found that the rotor with a blade depth to diameter (s/d) ratio of 0.5 outperforms all other rotors in terms of power coefficients across various free-wind speeds and TSR values. However, the rotor with a s/d ratio of 1 performs the least effectively |
| 2020 | Saad et al. [56] | According to the results, the Savonius rotor design with a twist angle of 45°, an overlapping ratio of zero, and an endplate size ratio of 1.1 achieves the highest net output power |
| 2019 | Alom and Saha [57] | The elliptical-bladed rotor achieves a CPmax of 0.19 at TSR 0.78, while the semicircular-bladed rotor achieves a CPmax of 0.158 at the same TSR. Therefore, the elliptical-bladed rotor performs 20.25% better under identical conditions than the semicircular-bladed rotor |
| 2018 | Ibrahim and Elbas [58] | A cluster of ten turbines has a CP 40% higher than a single rotor |
In another study, Prabowoputra et al. [36] examined the stage ratio of a two-stage Savonius turbine with a PSA of 30°. The choice of a 30° PSA was made based on the findings of Prabowoputra and Prabowo [28], who concluded that a 30° PSA was the optimal choice. Research on the stage ratio [36] indicates that optimal performance is achieved at a ratio of 2:1. However, this research is limited to a PSA of 30°. Hence, the relationship between the PSA factor and stage ratio remains uncertain. The CFD research employs a mesh-independent investigation phase to select the most suitable mesh for modeling [32].
Chegini et al. [52] performed CFD simulations on a hybrid rotor system consisting of Savonius and Darrieus rotors. This study demonstrates that incorporating a Savonius rotor enhances the Darrieus turbine’s ability to start independently and improves its overall efficiency when combined with a deflector. Nevertheless, this research continues to prioritize high TSR. Modifications to the design of the “divergent slot” and “convergent slot” have been implemented in the Savonius rotor investigation [53]. This study focused on examining the parameters related to the slot position on the blade. In general, the research being conducted on the Savonius rotor focuses on optimizing rotor design to examine the influence of rotor geometry on turbine performance. Table 1 shows various studies conducted to develop geometry modifications to improve Savonius performance. The research optimizes several geometric ratios or changes the shape of the main rotor components, such as blades, and adds guide blades or deflectors.
2.2 Rotor design and design parameters
This research uses three-dimensional modeling with the CFD method. The factors used in this study are PSA, blade shape, and TSR. The purpose of varying the PSA on the Savonius rotor is to investigate its effect on fluid flow around the rotating body. The PSA influences pressure distribution, flow pattern, and forces acting on the rotor. By testing from various angles, it is possible to understand how the air or fluid flow functions around the rotor under different conditions. TSR significantly influences rotor performance [59]; therefore, this factor is considered in this study with four levels. Previous research has shown that the PSA influences the performance of two-stage Savonius turbines [12]. Based on this research, the PSA factor was retested in combination with modifications to the blade shape. The PSA in this research employed three levels: 0°, 25°, and 35°. The two-stage Savonius rotor’s PSA is varied to 0°, 25°, and 35° to understand the influence of different angles on fluid flow, pressure distribution, and rotational efficiency. This research is crucial for determining the optimal angle to maximize the power generated by the rotor, enhance energy efficiency, and enable the turbine to adapt to varying fluid flow speeds and directions. The shape of the blade used in this study is categorized into three types based on its size, height, and length, as shown in Figure 3. The dimensions of the Savonius rotor used are shown in Table 2. Figure 4 shows the three-dimensional shape of the rotor used in this study. The AR of this Savonius rotor is 1 using Eq. (1) [60]. For the overlap ratio design parameter, an overlap ratio value of 0 was used, as specified in Eq. (2) [60]. The endplate ratio (ER) used in this study is 1.095, as calculated using Eq. (3) [60]. Figure 4 also illustrates the three-dimensional forms of rotor type-1 at PSA angles of 0°, 25°, and 35°, rotor type-2 at PSA angles of 0°, 25°, and 35°, and rotor type-3 at PSA angles of 0°, 25°, and 35°. The blade shape in this variation can be expressed in terms of an elliptical ratio (ELR), as shown in Eq. (4), where the ELR used is 0.5, 0.33, and 0.25. The stage ratio used here is 1, which is obtained from Eq. (5) [36]. The variation design shown in Figure 5 was obtained using a factorial design with factors of PSA, TSR, and blade shape.
Specification of the Savonius rotor
| Symbol | Name | Dimension |
|---|---|---|
| tb | Height of the blade | Type-1: 52.5 mm |
| Type-2: 26.25 mm | ||
| Type-3: 35 mm | ||
| d | Diameter of the blade | 105 mm |
| D 1 | Diameter of the rotor | 210 mm |
| D 0 | Diameter of the endplate | 230 mm |
| θ | PSA | 0°, 25°, 35° |
| h | Height of stages | 102 mm |
| H | Height of rotor | 210 mm |
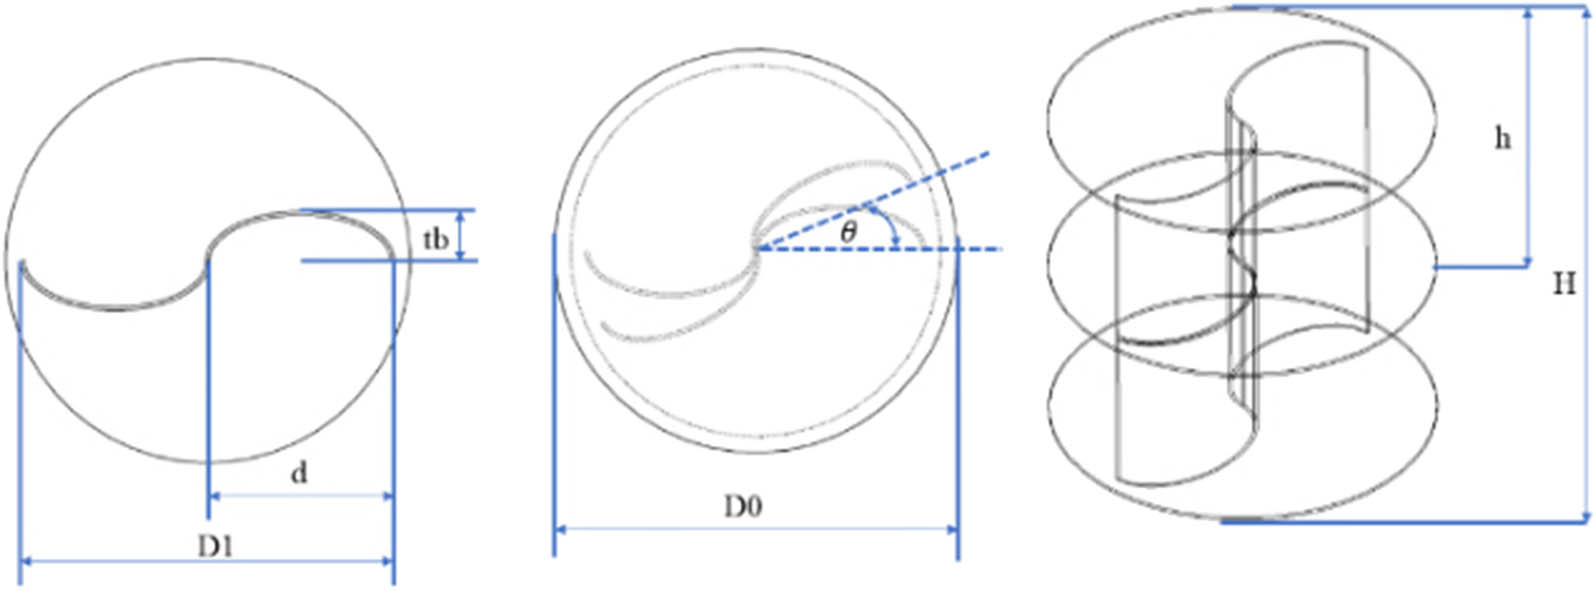
Savonius rotor design with dimension information.
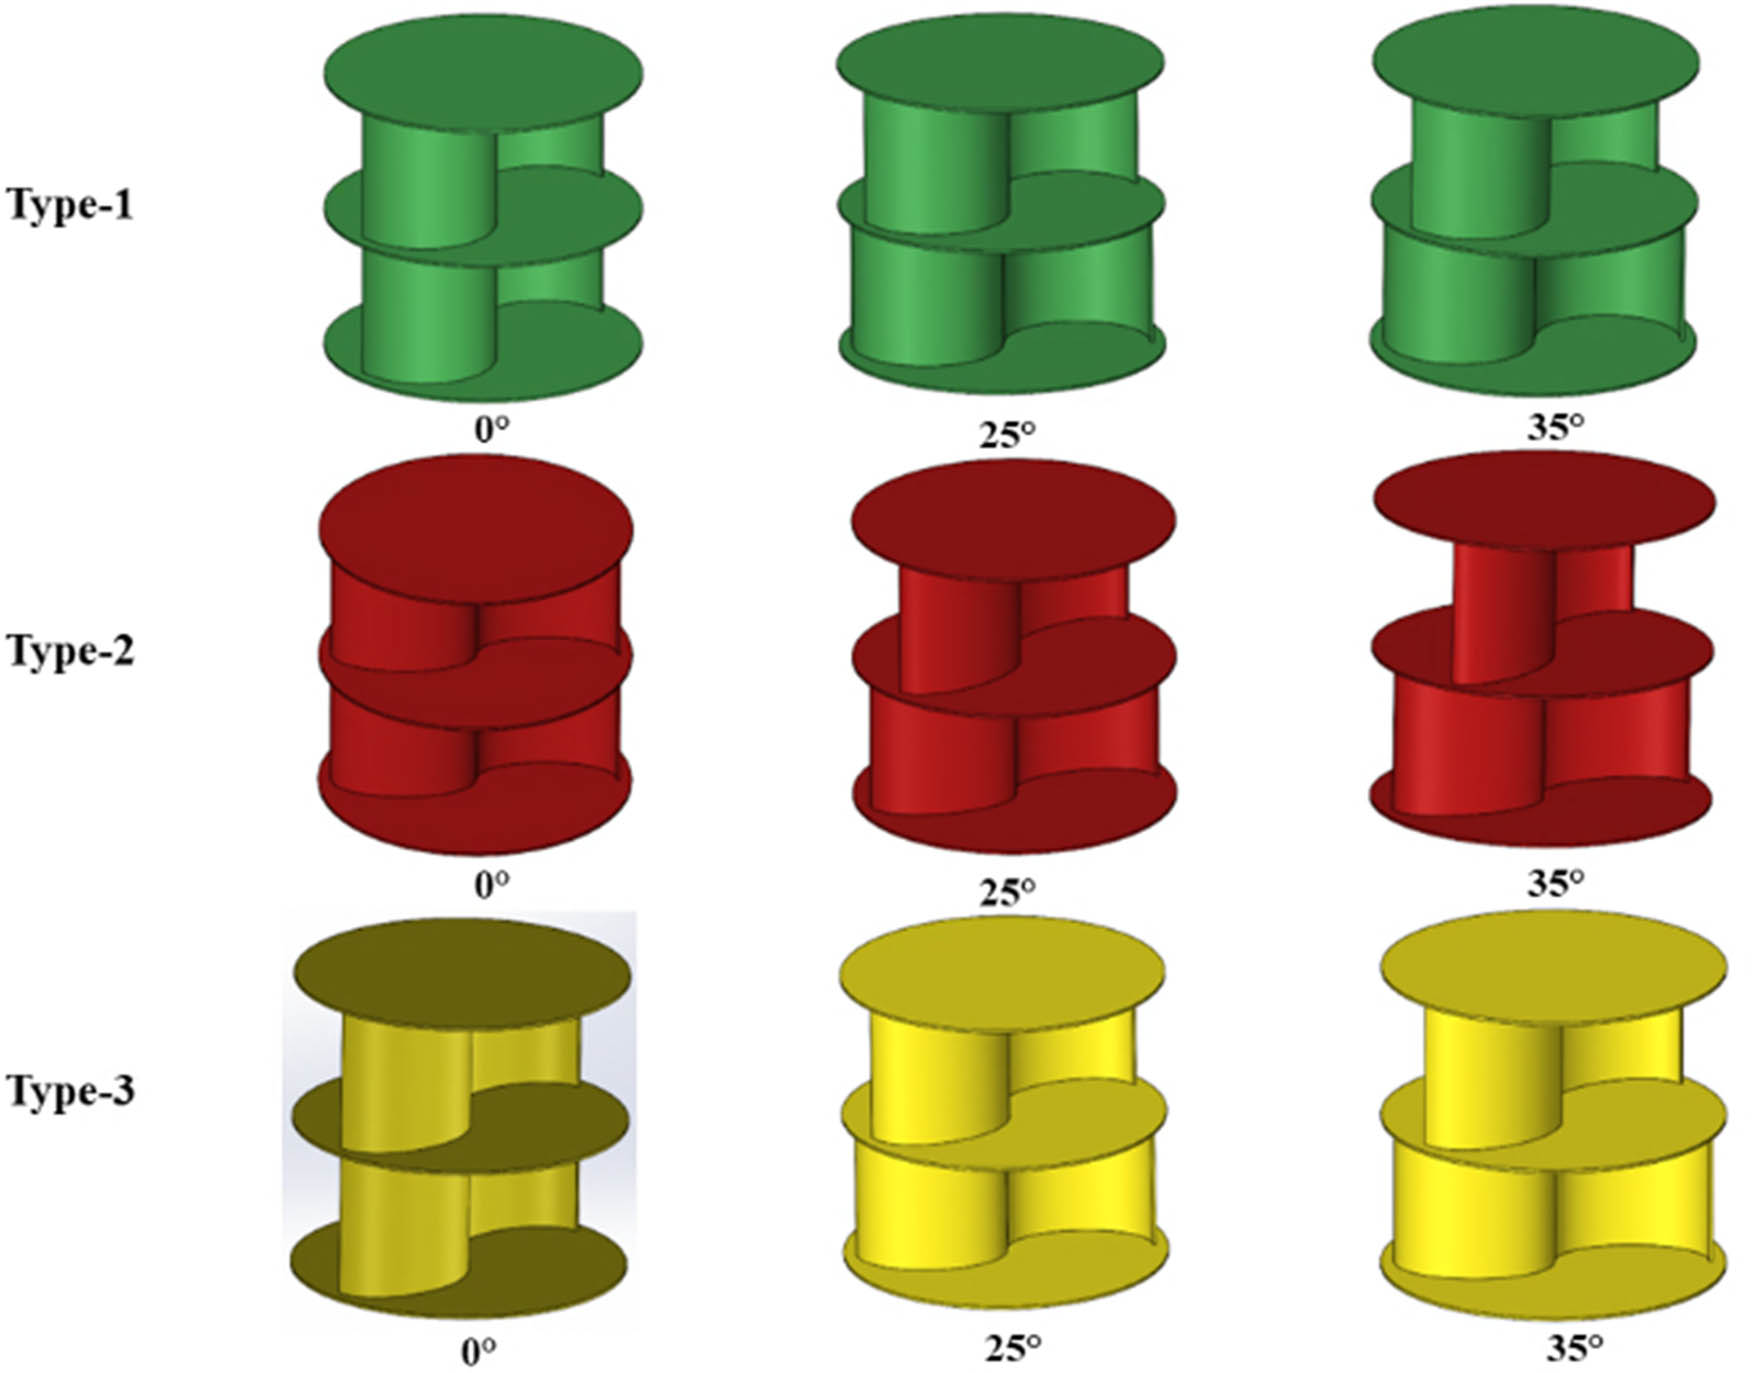
The three-dimensional design of the Savonius rotor.
AR:
Overlap ratio (OR):
ER:
ELR:
SR:
Turbine performance in fluid energy systems, such as wind and hydrokinetic turbines, is primarily governed by the interaction between the fluid’s mass flow rate and the turbine’s swept area. The mass flow rate, expressed in Eq. (6), quantifies the rate at which kinetic energy is transferred to the turbine. This leads to the theoretically available power, as shown in Eq. (7), which depends on the cube of the free stream velocity [60].
where
where
Hence, plotting
where
The
One last important Savonius parameter is the
Bézier curves are widely used in geometric modeling due to their mathematical elegance and intuitive control. These curves are generated by a set of control points that form a polygon, defining the curve’s general shape. The Bézier curve
The
![Figure 6
Third-order Bézier curve representation [60].](/document/doi/10.1515/cls-2025-0039/asset/graphic/j_cls-2025-0039_fig_006.jpg)
Third-order Bézier curve representation [60].
To guarantee continuity between two adjacent Bézier curves, defined by
Eqs. (17) and (18) describe the conditions to make continuous two-degree curves, one defined by
![Figure 7
First derivative continuity for third-order Bézier curves [60].](/document/doi/10.1515/cls-2025-0039/asset/graphic/j_cls-2025-0039_fig_007.jpg)
First derivative continuity for third-order Bézier curves [60].
An n-degree Bezier curve of order
The coefficients
where the function
A general expression for cubic polynomial forms can be written as Eq. (23).
2.3 Turbine performance
The CP value shows the rotor performance parameter, as shown in Eq. (24) [61]. P t is the rotor power and is shown in Eq. (25) [62]. A non-dimensional TSR indicates the speed ratio between angular and fluid velocities. The TSR formula is shown in Eq. (26), and the torque coefficient is shown in Eq. (27) [63], where T is the torque, ρ is the fluid density, ω is the angular velocity, A is the projection area, and U is the fluid velocity.
2.4 Numerical modeling
The research was conducted using three-dimensional modeling with the CFD method. The governing equation of CFDs comprises several equations, including the continuity and Navier-Stokes equations. The continuity equation is shown in Eq. (28), and the Navier-Stokes equation is shown in Eqs. (29)–(31), where x, y, and z are coordinate axes. Eq. (29) is the x-axis direction, Eq. (30) is the y-axis direction, and Eq. (31) is the z-axis direction. The equation variables are as follows: p represents density, t represents time, u, v, w represent velocities in three Cartesian coordinates, and x, y, and z represent the Cartesian coordinates [62,63].
Savonius modeling consists of two rotary and stationary zones. Figure 8 shows the zone design in the modeling. The next step is to perform the meshing process. Meshing utilizes the tetrahedral method, which offers the advantage of being able to adjust the shape of complex geometries compared to other meshing methods [64,65]. Figure 9 shows the meshing results for the rotary and stationary zones.
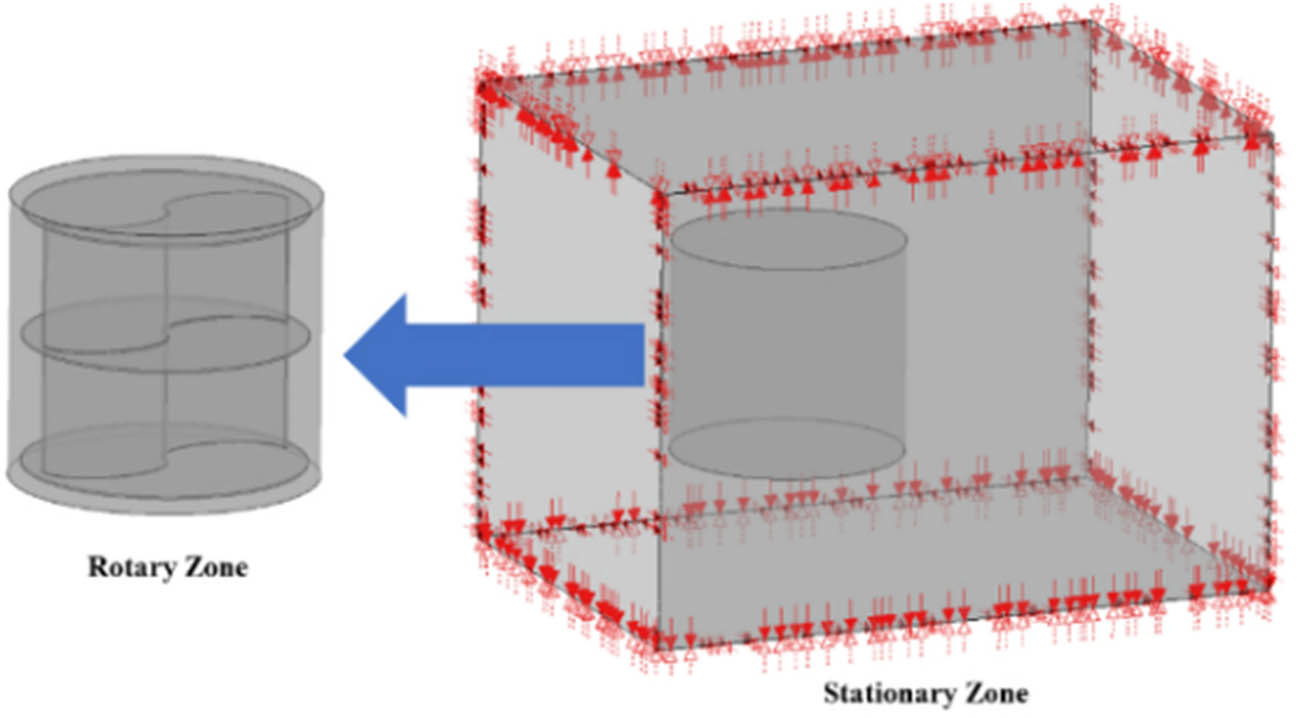
Rotary zone and stationary zone.
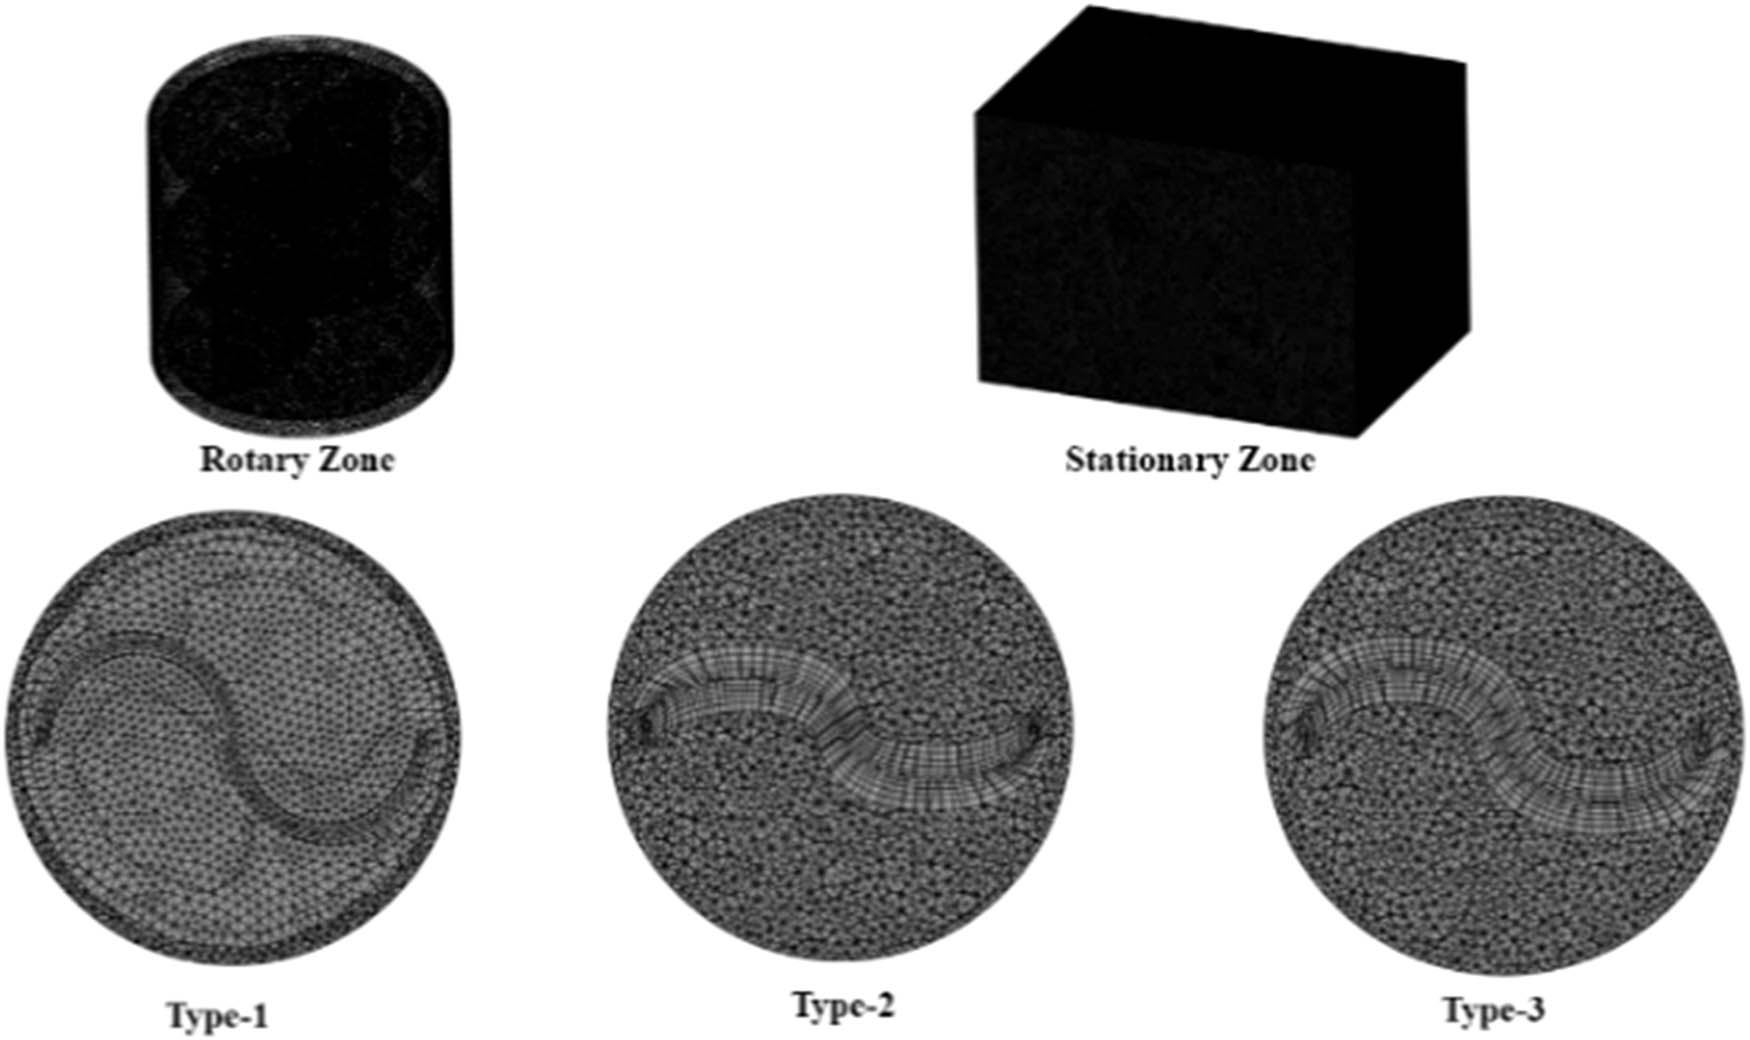
Results of the meshing process.
Modeling boundary conditions is found in the stationary zone. The boundary conditions used are inlet, outlet, and wall. The inlet has a wind speed of 6 m/s, and the outlet uses a static pressure of 1 atm. The modeling schematic is shown in Figure 10, where the wall uses symmetry conditions. This study employs the shear stress transport (SST) turbulence model. Modeling is done at a steady state. The fluid properties used and boundary conditions are shown in Table 3. This study was conducted at a TSR with values of 0.2–1.1.
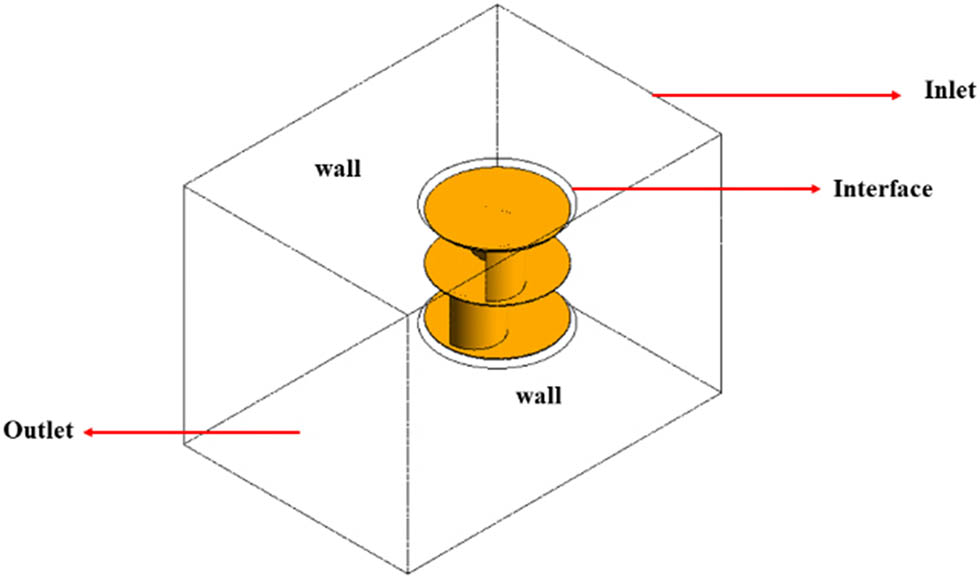
Schematic illustration of the Savonius modeling and simulation.
Boundary conditions and modeling properties
| No. | Parameter | Value |
|---|---|---|
| 1 | Fluid type | Wind |
| 2 | Domain motion | Rotating |
| 3 | Turbulence model | SST |
| 4 | Boundary condition inlet flow | Subsonic |
| 5 | Density | 1.185 kg/m3 |
| 6 | Outlet pressure | 1 atm |
| 7 | Velocity | 6 m/s |
| 8 | Gravity | 9.81 m/s2 |
| 9 | Wall | No slip condition |
2.5 Mesh study and benchmarking
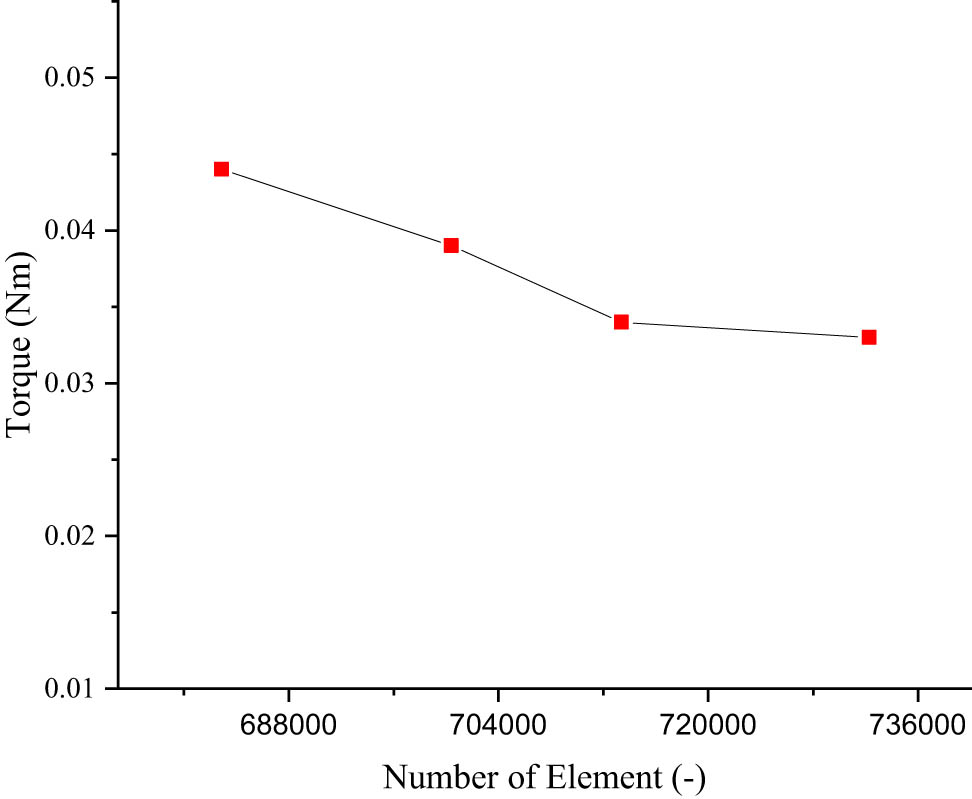
Most modeling research using the CFD method involves a mesh study. This mesh study aims to determine the optimal mesh. Some methods for conducting mesh studies, as employed by researchers, are presented in Table 4. Multiple adjustments are made when determining the appropriate meshing settings. This is done to determine the optimal number of meshes in the modeling process, commonly referred to as a mesh study. The number of meshes will affect the modeling’s running time. Figure 11 shows the ratio of the mesh study process graph, where the setting ratio with 713,385 elements produces the optimal mesh.
Mesh study in previous modeling research
| Year | Author | Mesh study |
|---|---|---|
| 2024 | Babay et al. [64] | The mesh quality analysis in ANSYS Fluent includes statistical parameters such as skewness angles. The average angle is approximately 0.31095, indicating favorable skewness quality for high-quality meshing |
| 2023 | Prabowoputra et al. [61] | The meshing process is repeated several times to obtain the best mesh. Mesh study is crucial in determining the best mesh by changing the mesh size. Up to eight size settings were made during the mesh study process to optimize the mesh |
| 2020 | Saad et al. [56] | A grid study is conducted by varying the mesh resolution. The mesh resolution used is coarse, medium, and fine. From the mesh, the study obtained optimal results at a medium mesh resolution |
| 2018 | Chan et al. [66] | A mesh study is done by changing the mesh resolution, which can be coarse, medium, or fine. The study yields optimal results at medium mesh resolution |
| 2016 | Balduzzi et al. [67] | The mesh study process involved generating different mesh configurations. The meshing process settings have seven configurations. Each configuration is based on changing the mesh size to have a different number of mesh elements |
Graph of the mesh convergence study.
Roy and Saha conducted experimental research to conduct benchmarking [68]. The benchmarking results are presented in Figure 12. The difference between the benchmarking results of the modeling performed and Roy’s experiment is 3%. Benchmarking errors are calculated by determining the difference between the simulation results and those of other studies, using the mean absolute error (MAE), as presented in Eq. (32).
where
![Figure 12
Benchmarking of the numerical model with experiment [27].](/document/doi/10.1515/cls-2025-0039/asset/graphic/j_cls-2025-0039_fig_012.jpg)
Benchmarking of the numerical model with experiment [27].
2.6 Factorial design approach
Factorial design is an experimental method used to study the effects of several factors simultaneously, and it is constructive in strengthening the conclusions of the research [70,71,72,73,74,75,76]. Through this analysis, it is possible to determine the significance of a factor and the involvement of interactions between factors, thereby deepening the analysis. On the other hand, analysis of variance (ANOVA) can be used to determine the main effects and interactions between factors [77,78,79,80,81]. In ANOVA, the F-value is calculated and compared with the F-table value at a 95% confidence level. The 95% confidence level or α value of 0.05 is commonly used in analyzing the significance test of a factor. The three variables analyzed in this investigation using a factorial design are the rotational speed factor, blade shape, and PSA. Using a factorial design, we can determine the interaction between the two factors and assess the significance of each factor. To conclude from the FDA results, compare the F value of the results to the F value in the table, which is based on the degrees of freedom for that factor. The fundamental calculations are provided in Eqs. (33)–(40) and are subsequently presented in Table 5 [60,61,62]. The sum of squares equation for each effect is [70]
Presentation of factorial design [60]
| Var | SS | DOF | Mean square | F 0 |
|---|---|---|---|---|
| A | SSA | a−1 |
|
|
| B | SSB | b−1 |
|
|
| C | SSC | c−1 |
|
|
| AB | SSAB | (a−1)(b−1) |
|
|
| AC | SSAC | (a−1)(c−1) |
|
|
| BC | SSBC | (b−1)(c−1) |
|
|
| Error | SSE | Abc(n−1) |
|
|
| Total | SST | Abcn−1 |
When referring to a research factor denoted by A, B, and C, the notations “a,” “b,” and “c” denote its degree of freedom. The AB notation is used to estimate the interaction between components A and B. The AC notation is used to assess the interaction of components A and C. The BC notation is used to assess the interaction of components B and C. Table 6 shows the results of the computations performed using Eqs. (33)–(40) [70].
Analysis of variance
| Source | DF | Adj SS | Adj MS | F-value | F-table [58] |
|---|---|---|---|---|---|
| Rotor | 2 | 3.6944 | 1.84718 | 90.28 | 3.89 |
| PSA | 2 | 2.2237 | 1.11187 | 54.34 | 3.89 |
| TSR | 3 | 10.9089 | 3.63629 | 177.72 | 3.49 |
| Rotor*PSA | 4 | 0.2427 | 0.06069 | 2.97 | 3.26 |
| Rotor*TSR | 6 | 0.8377 | 0.13962 | 6.82 | 3 |
| PSA*TSR | 6 | 0.9594 | 0.15991 | 7.82 | 3 |
| Error | 12 | 0.2455 | 0.02046 | ||
| Total | 35 | 19.1124 |
3 Results and discussion
3.1 Aerodynamic performance of Savonius turbine
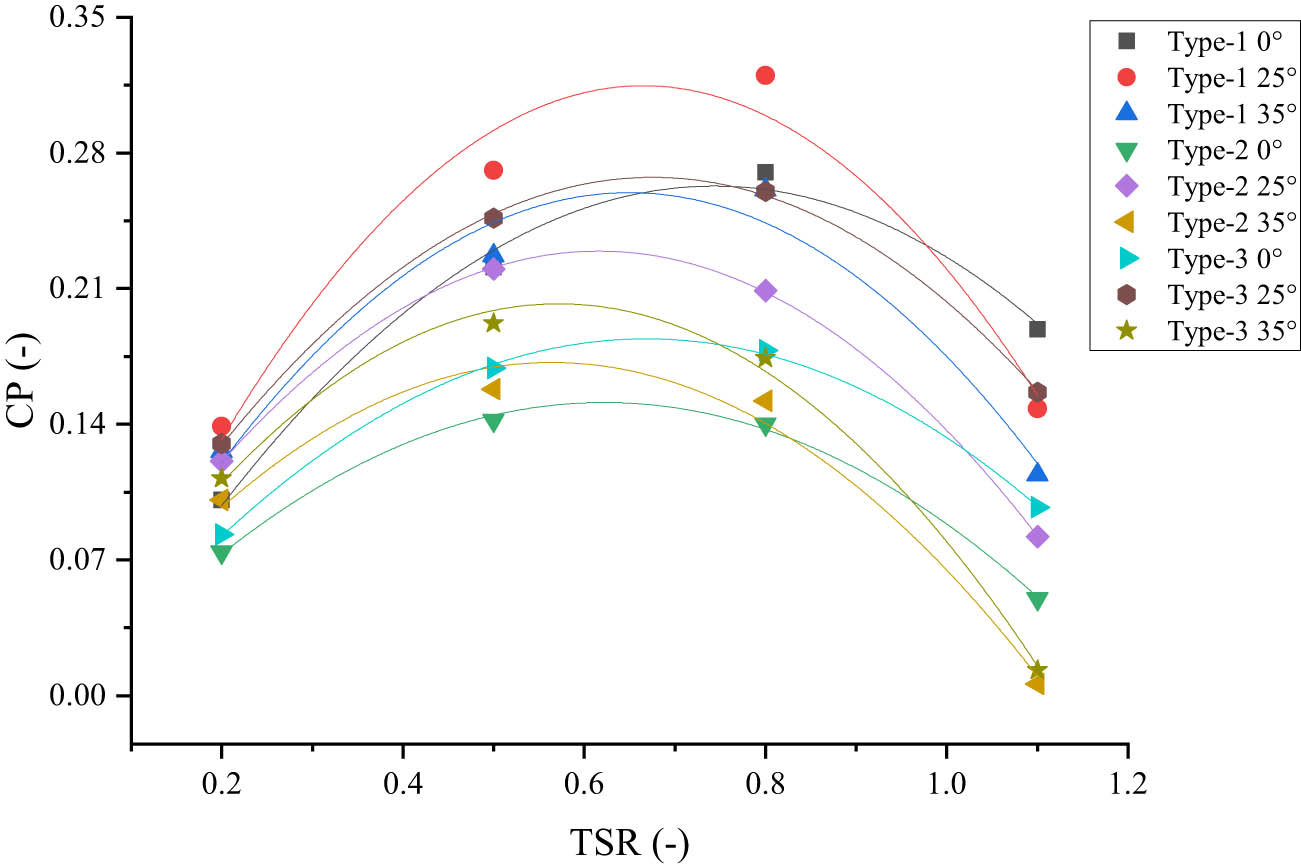
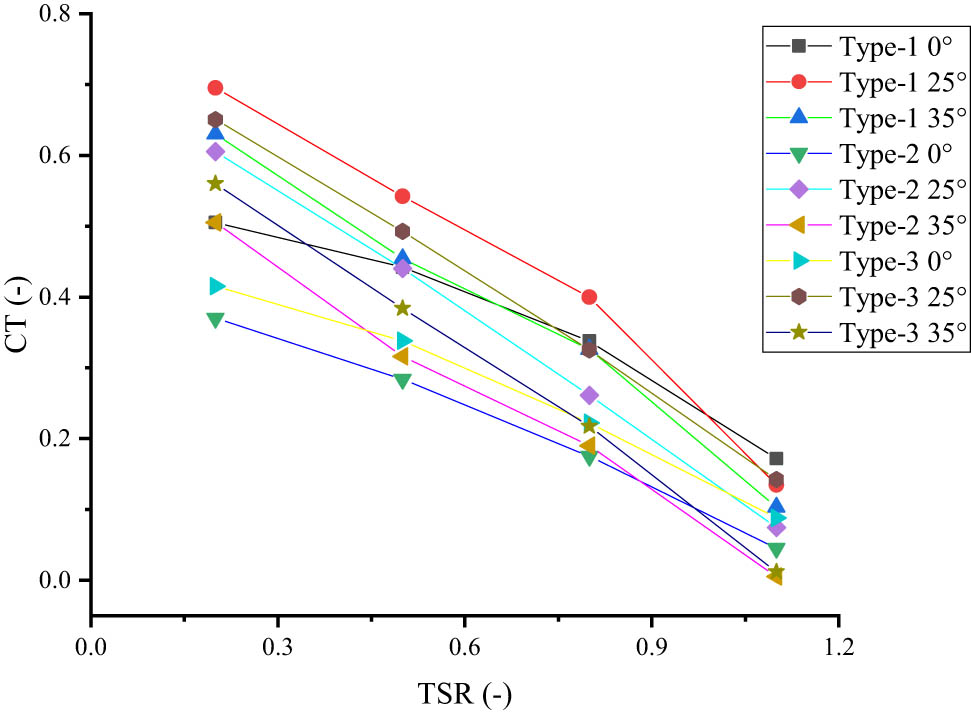
The modeling results are torque values and pressure contours in the fluid. The torque value is converted to CP, where CP is the performance parameter of the rotor. Then, the results of the CP are analyzed using factorial design and ANOVA to determine the significance of these factors. Figure 13 illustrates the modeling results in a graph that displays the relationship between CP and TSR. The type-1 rotor reaches CPmax at TSR 0.8 for all PSA variations. The CPmax values for each PSA are 0.27 at 0° PSA, 0.32 at 25° PSA, and 0.26 at 35° PSA. Unlike the type-1 rotor, the CPmax on the type-2 rotor is achieved at TSR 0.5 for all PSA variations. PSA 0° produces a CPmax of 0.14, PSA 25° of 0.22, and PSA 35° of 0.158. The type-3 rotor produces a CPmax of 0.178 at PSA 0° and a CPmax of 0.26 at PSA 25°. PSA 0° and PSA 25° reached CPmax at TSR 0.8, while PSA 35° reached TSR 0.5 at 0.192. This research shows an increase when compared to previous research [32], where research on PSA variations obtained a CPmax value of only 0.29 at a 30° PSA rotor. when compared to this research, there is an increase in Cpmax by 10%.
Relationship graph of TSR and CP on the Savonius rotor.
The performance of the Savonius turbine can also be assessed by examining the coefficient of thrust (C t), as depicted in Figure 14. The maximum Coefficient of Torque (CTmax) was achieved at a pressure of 25° PSA for rotor types 1 and 2. Type-1 achieved a CTmax of 0.695 at a phase-shift angle (PSA) of 25°, 0.63 at a PSA of 35°, and 0.505 at a PSA of 0°. Type-2 achieved a CTmax of 0.605 at a PSA of 25°. In type-2, the pattern is analogous to type-1, with PSA 25° followed by the production of PSA 35° and finally PSA 0° in consecutive order. The specific figures for these PSAs are 0.505 and 0.37, respectively. Type-1 achieved a CTmax of 0.65 at a PSA of 25°. At a PSA of 35 °, it yielded a CTmax of 0.56; at a PSA of 0 °, it yielded a CTmax of 0.415.
Relationship graph of TSR and Ct on the Savonius rotor.
3.2 Pressure contours
Modeling performed on the Savonius rotor, in addition to generating torque, also produces pressure contours. The pressure contours of type-1 rotor are shown in Figure 15, type-2 in Figure 16, and type-3 in Figure 17. Stage 1 in Figure 15 displays similar pressure contours, with the maximum pressures at PSA 0°, PSA 25°, and PSA 35° being 64.4, 67.1, and 68.2 MPa, respectively. The maximum pressure in each variation at stage 1 is located at the same position, which is at the bottom edge of the blade. The contour shape at stage 2 is different due to the change in angle at the PSA formed at stage 2. The maximum pressure at stage 2 includes 64.6 MPa at PSA 0°, 66.6 MPa at PSA 25°, and 57.57 MPa at PSA 35°. Stage 2 shows the maximum pressure position at the bottom of the blade for all PSA variations; however, at this stage, there are differences in the wake zone area. The 35° PSA has the most expansive wake zone among other variations. Particularly at PSA angles of 0° and 25°, stage 1 exhibits a pressure distribution that is somewhat centered on the rotor’s leading edge. This can suggest the first phase of the rotor’s contact with the fluid flow, where the high pressure is more confined to one side. Particularly at 35°, stage 2 exhibits a more diffuse high-pressure pattern. This could mean that the rotor has turned so that the lift force exceeds the drag force, distributing the high pressure more fairly around the rotor.
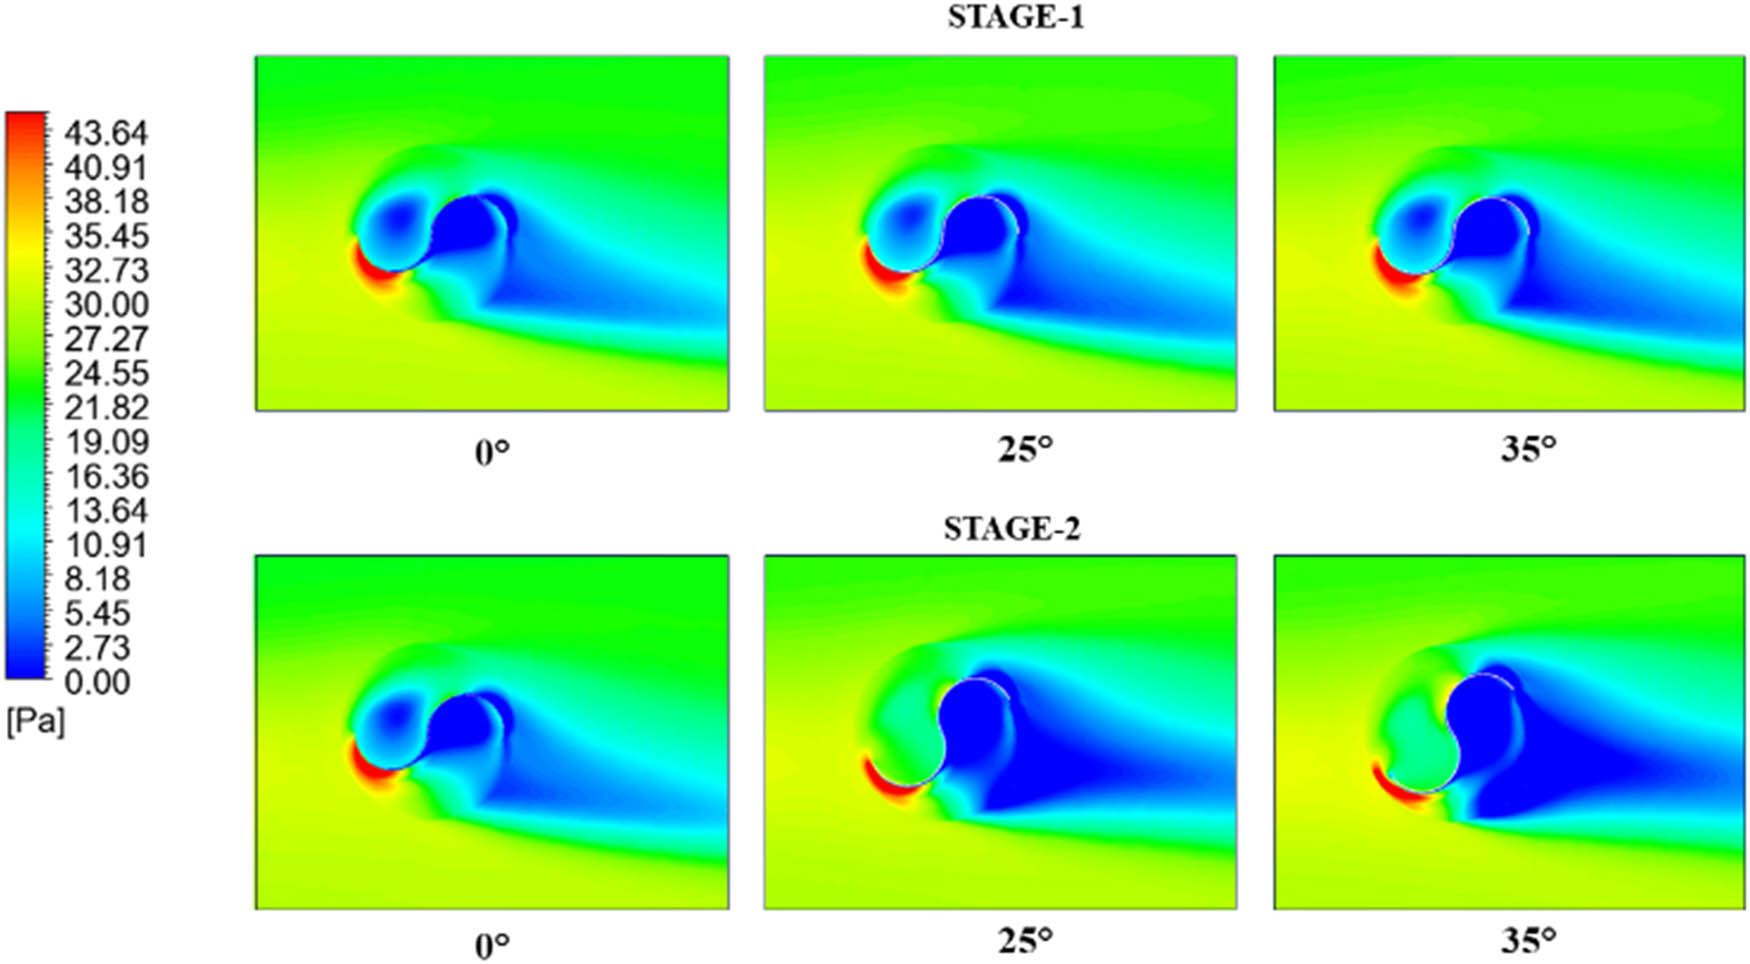
Pressure contour of Savonius type-1 rotor.
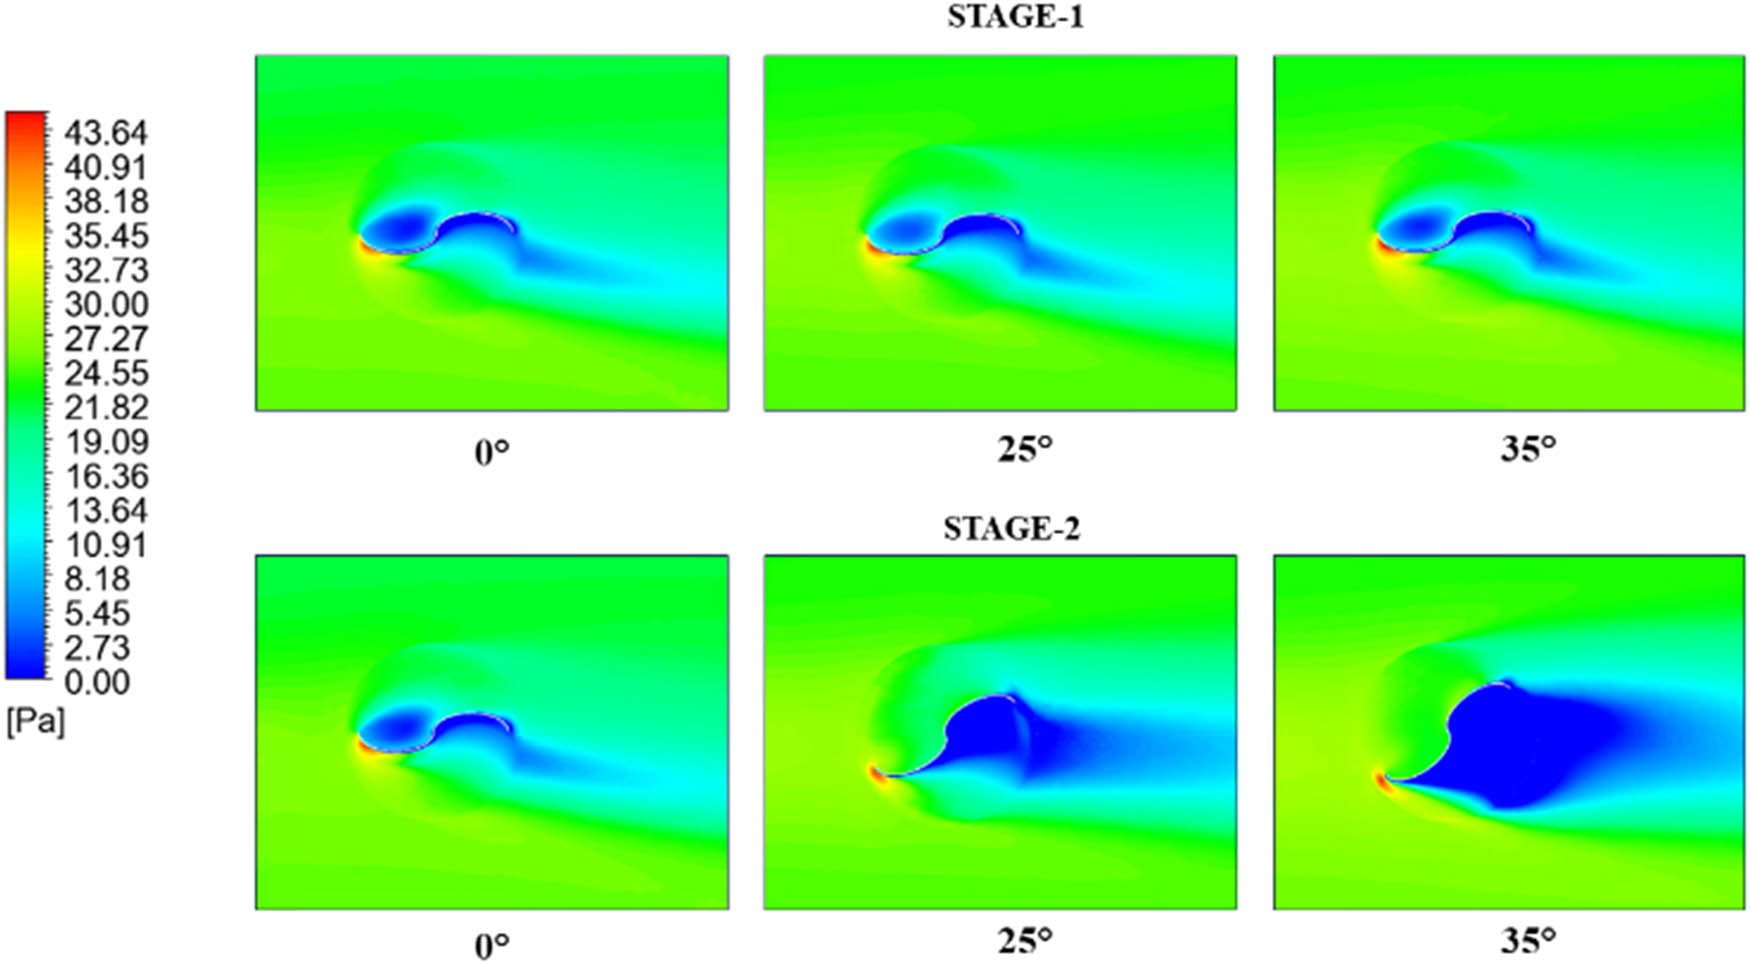
Pressure contour of Savonius type-2 rotor.
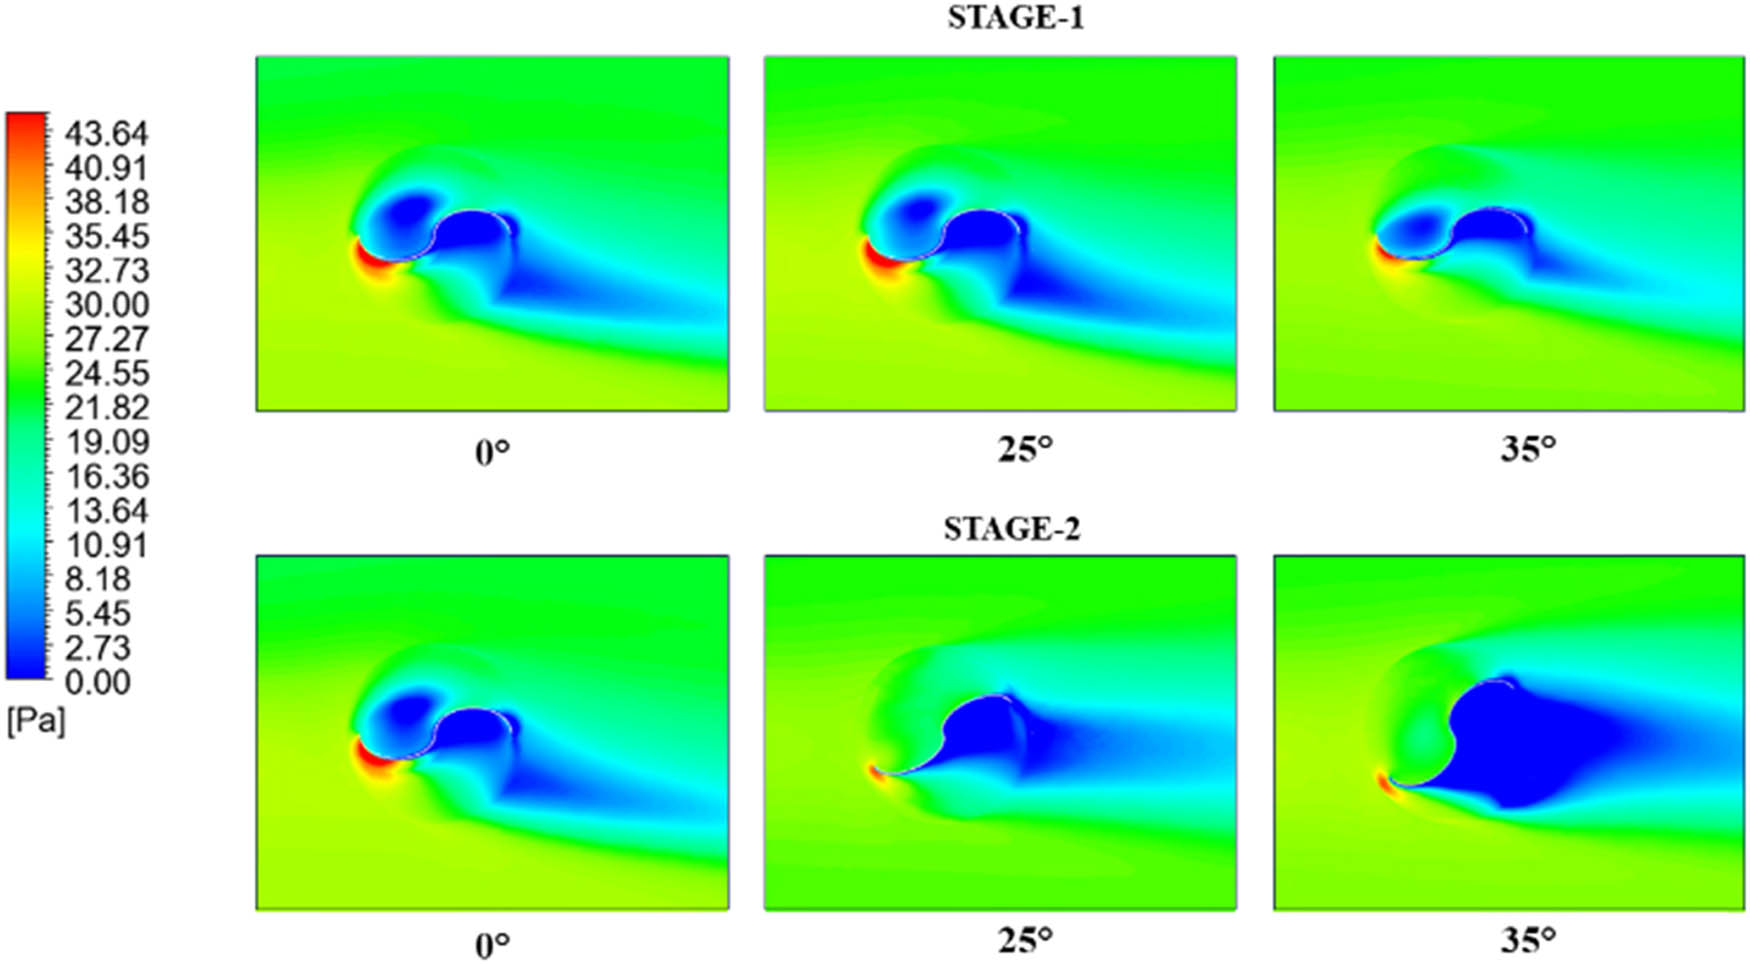
Pressure contour of Savonius type-3 rotor.
The maximum pressure on stage-1 type-2 rotor shown in Figure 15 is 43.7 MPa at PSA 0°, 45.36 MPa at PSA 25°, and 50.8 MPa at PSA 35°. Savonius type-2 shows similar contours at stage 1, and stage 2 shows that the 35° PSA variation has the most expansive wake zone among other variations. The maximum pressure at stage 2 is 46.6 MPa at PSA 0°, 42.8 MPa at PSA 25°, and 50.8 MPa at PSA 35°. Stage 1 in Figure 16 displays similar pressure contours, with the maximum pressures at PSA 0°, PSA 25°, and PSA 35° being 61.6, 62.5, and 50.7 MPa, respectively. The location of the maximum pressure at stage 1 for rotors of types 1, 2, and 3 is similar, positioned at the lower edge of the blade. The maximum pressure at stage 2 is 60.3 MPa at PSA 0°, 59 MPa at PSA 25°, and 42.9 MPa at PSA 35°.
3.3 Factorial analysis design
The results of the CPmax calculation for each variation were analyzed using a factorial design and analysis of variance to reinforce conclusions from existing results. The results of the variance analysis are shown in Table 6. The plot of the response is shown in Figure 18. The plot indicates that the best performance is achieved with rotor type-1, at a PSA of 0° and a TSR of 0.8. The plot shows the same thing as the graph in Figure 13. The results of the variance analysis show that the rotor shape factor, PSA, and TSR have a significant influence on the performance of the Savonius rotor. This is significant because the F-value on the rotor shape factor, PSA, and TSR are higher than those on the F-table [58]. Table 6 shows that the TSR factor is the most dominant, followed by the rotor shape factor, and finally, the PSA factor is based on the F-value of each factor. This confirms that these factors influence the performance of the Savonius rotor.
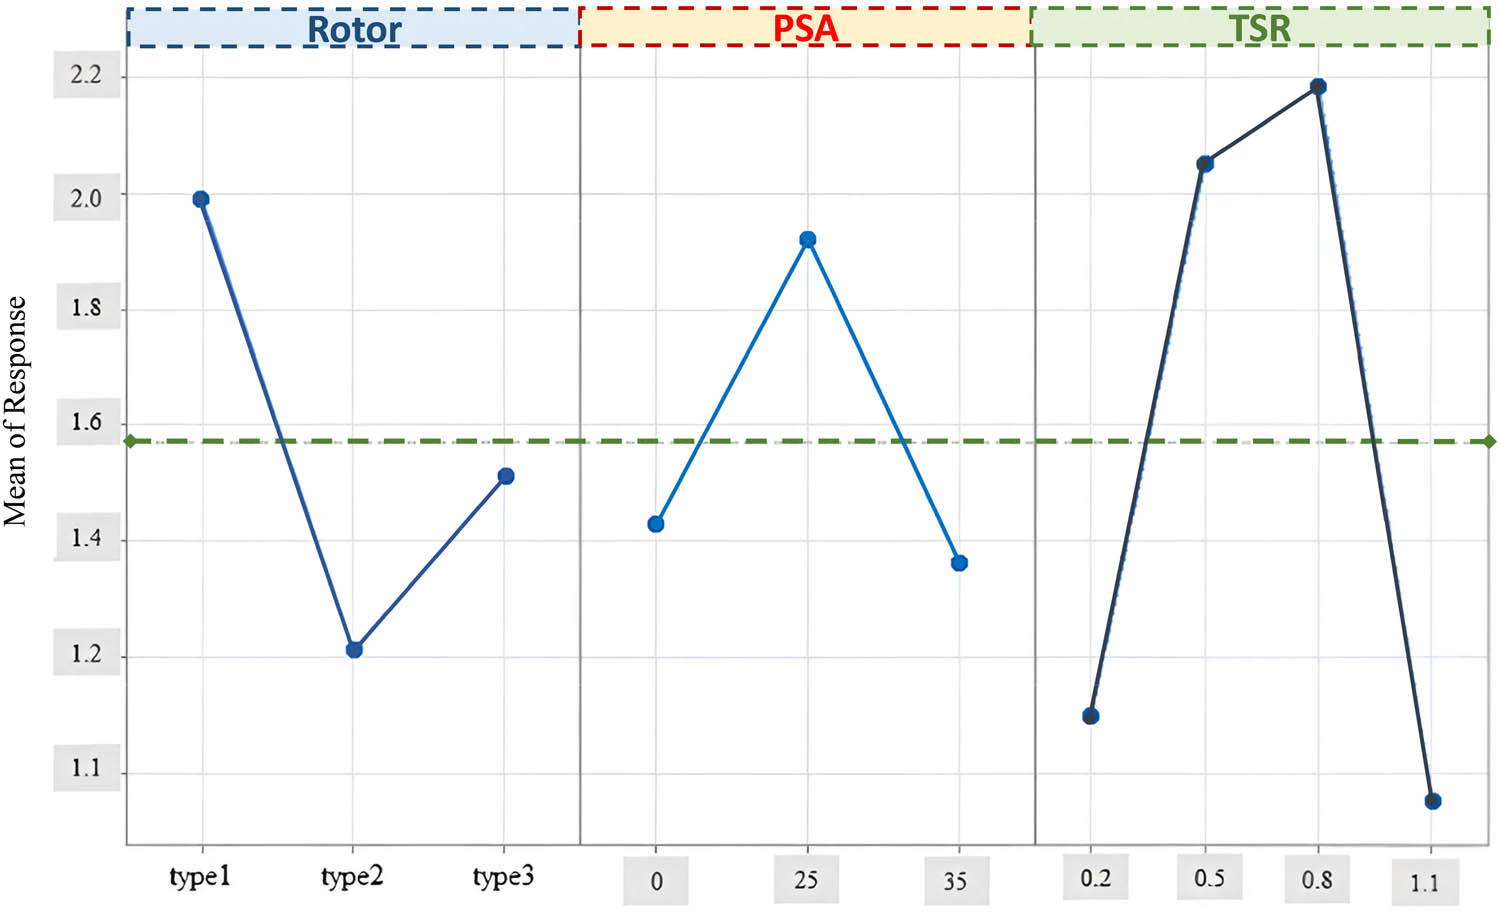
Main effect plot for a response.
Then, the interaction between factors shows an insignificant interaction between the rotor shape factor and PSA. This is indicated by the fact that the F-value of the interaction of the two factors is smaller than the F-table [60]. However, the rotor and TSR factors show a significant interaction. This also occurs in the interaction of the PSA factor with TSR. The interaction between rotor vs TSR and PSA vs TSR shows an F-value greater than the F-table, and the PSA vs TSR interaction is more significant than rotor vs TSR.
Since the F-value is greater than the F-table (90.28 > 3.89), the rotor factor is statistically significant at the 95% confidence level. This suggests that variations in rotor design or type have a significant influence on the responses measured in this research. The TSR factor has a high F value and is well above the critical value (177.72 > 3.49). This indicates that the variation in the TSR significantly influences the system response, perhaps even the most significant factor in this experiment. The interaction between rotor and PSA is insignificant (2.97 < 3.26), which means the variation in rotor type and PSA has no significant influence on the response in this context. The interaction between the rotor and TSR is significant (6.82 > 3), indicating that the combination of rotor type and TSR has a significant effect on the response. This means that the effect of TSR on performance may differ depending on the type or design of the rotor used. The interaction between PSA and TSR is also significant (7.82 > 3), indicating that variations in PSA and TSR jointly affect performance. This indicates that changes in PSA can influence the effect of TSR on the rotor.
The data analysis reveals that the three main factors – rotor, PSA and TSR – have a significant influence on the measured responses. In particular, the effect of each factor proved to be significant and needs to be considered individually in process optimization. Furthermore, the interactions between rotor and TSR, as well as PSA and TSR, also showed significance, indicating that the effect of TSR on the response highly depends on the levels of rotor and PSA used. The interaction between rotor and PSA did not provide any significant additional influence, so the combined effect is additive. Thus, adjusting the TSR according to the rotor and PSA levels is necessary to achieve optimal results in practical applications. At the same time, the insignificant interaction can be simplified in the analysis model.
4 Conclusion
The Savonius rotor was the subject of an investigation that utilized three-dimensional modeling to evaluate the influence that the rotor form factor and PSA have on the model. Compared with other tests, the modeling has been shown to have a 3% difference, a value considered acceptable. It was determined that 713,385 components comprised the ideal mesh. According to the findings, it is clear that the rotor type-1 with a PSA of 25° produces the best CPmax value, which works out to 0.32. According to the investigation’s findings, which employed a factorial design technique, the rotor shape factor and PSA have a substantial impact on the performance of the Savonius rotor. On the other hand, it has been discovered that the interaction between these elements is not substantial. Rotor shape vs TSR and PSA vs TSR are the interaction relationships between components that show significant values. Both of these relationships are substantial. Therefore, it is possible to consider a rotor type-1 with a PSA of 25° as an alternative design for Savonius wind turbine rotors. From another perspective, the 25° PSA has the best CTmax among all types, but the most significant CTmax value is found in type-2.
Acknowledgments
This research is designated as dissemination of the Research Scheme of “Pengabdian Mandiri Universitas Sebelas Maret Tahun Anggaran 2025,” with Contract No. 1298/UN27.22/PT.01.03/2025. The authors gladly welcome the assistance.
-
Funding information: The authors state no funding involved.
-
Author contributions: D.M.P.: conceptualization, investigation, formal analysis, validation, writing – original draft; A.P.: writing – review and editing; A.R.P.: conceptualization, methodology, supervision, project administration, and funding acquisition; I.I.: data curation and project administration; R.W.: data curation and project administration; Q.T.D.: writing – review and editing and conceptualization; J.M.S.: software and visualization; H.C.: funding acquisition and visualization; I.Y.: methodology and project administration; W.W.: validation and funding acquisition; D.D.S.: visualization and funding acquisition.
-
Conflict of interest: The authors state no conflict of interest.
-
Data availability statement: The authors declare that the data supporting the findings of this study are available within the article.
References
[1] UN General Assembly. Transforming our world: the 2030 Agenda for Sustainable Development 2015;A/RES/70/1. https://www.refworld.org/legal/resolution/unga/2015/en/111816 (accessed January 4, 2025).Search in Google Scholar
[2] World Bank Group. Tracking SDG 7 – The Energy Progress Report 2022. Washington D.C., United States: World Bank Group. https://www.worldbank.org/en/topic/energy/publication/tracking-sdg-7-the-energy-progress-report-2022 (accessed January 5, 2025).Search in Google Scholar
[3] Birol F, Cozzi L, Gould T. World energy outlook 2023. Paris, France: International Energy Agency; 2023. www.iea.org, accessed January 5, 2025.Search in Google Scholar
[4] Muldarisnur M, Fahendri F, Perdana I, Abdullah Z, Yusfi M. Light absorption enhancement in organic solar cell using non-concentric Ag:SiO2 core-shell nanoparticles. Commun Sci Technol. 2023;8(1):50–6. 10.21924/cst.8.1.2023.1076.Search in Google Scholar
[5] Shame BH, Tjahjana DDDP, Arifin Z, Aziz M, Harwijayanti W, Haji MM. The renewable energy research contribution of Tanzania: A review. Commun Sci Technol. 2024;9(1):65–86. 10.21924/cst.9.1.2024.1348.Search in Google Scholar
[6] Ma J, Wang C, Cao Y, Wu Z, Lu C, Sun K, et al. Transient energy transfer of wind-photovoltaic-storage grid-connected system under virtual synchronous coupling. Energy Rep. 2024;12:4805–12. 10.1016/j.egyr.2024.10.049.Search in Google Scholar
[7] Qian K, Xia H, Xia Y. A self-powered interface circuit for piezoelectric and photovoltaic energy extracting. Microelectron J. 2024;154:106466. 10.1016/j.mejo.2024.106466.Search in Google Scholar
[8] Maia F, Leitão S, Marques MC. Energy transition in Portugal: The harnessing of solar photovoltaics in electric mobility and its impact on the carbon footprint. J Clean Prod. 2024;477:143834. 10.1016/j.jclepro.2024.143834.Search in Google Scholar
[9] Chung IH. Using break-even analysis to explore the cost and carbon reduction benefits of solar and wind energy integration in microgrids for convenience stores. Heliyon. 2024;10(21):e39644. 10.1016/j.heliyon.2024.e39644.Search in Google Scholar PubMed PubMed Central
[10] IRENA ACE. Renewable energy outlook for ASEAN: Towards a regional energy transition. Abu Dhabi; and ASEAN centre for energy. 2nd edn. Jakarta: International Renewable Energy Agency; 2022.Search in Google Scholar
[11] Azhgaliyeva D, Le H, Olivares RO, Tian S. Renewable energy investments and feed-in tariffs: Firm-level evidence from Southeast Asia. Appl Energy. 2024;374:123986. 10.1016/j.apenergy.2024.123986.Search in Google Scholar
[12] Nian V, Liu Y, Zhong S. Life cycle cost-benefit analysis of offshore wind energy under the climatic conditions in Southeast Asia – Setting the bottom-line for deployment. Appl Energy. 2019;233–234:1003–14. 10.1016/j.apenergy.2018.10.042.Search in Google Scholar
[13] Nian V, Hari MP. Incentivizing the adoption of nuclear and renewable energy in Southeast Asia. Energy Procedia. 2017;105:3683–9. 10.1016/j.egypro.2017.03.849.Search in Google Scholar
[14] Quirapas MAJR, Taeihagh A. Ocean renewable energy development in Southeast Asia: Opportunities, risks and unintended consequences. Renew Sustainable Energy Rev. 2021;137:110403. 10.1016/j.rser.2020.110403.Search in Google Scholar
[15] Our World in Data team. Ensure access to affordable, reliable, sustainable and modern energy for all. Our World in Data. 2023; https://ourworldindata.org/sdgs/affordable-clean-energy (accessed January 5, 2025).Search in Google Scholar
[16] Prabowoputra DM. The blade’s angle affects banki-turbine performance as an alternative design for clean energy generation. Math Model Eng Prob. 2023;10(1):259–65. 10.18280/mmep.100130.Search in Google Scholar
[17] Budiono HP, Prabowoputra DM. Simulation Study on Cross Flow Turbine Performance with an Angle of 20° to the Variation of the Number of Blades. Int J Mech Eng Robot Res. 2022;11(1):31–6. 10.18178/ijmerr.11.1.31-36.Search in Google Scholar
[18] Prabowoputra DM, Prabowo AR, Nubli H, Harsito C, Ubaidillah, Susilo DD, et al. Forecasting effect of blade numbers to cross-flow hydro-type turbine with runner angle 30° using CFD and FDA approach. Math Model Eng Prob. 2023;10(2):419–24. 10.18280/mmep.100205.Search in Google Scholar
[19] Tata M, Bekhti A, Maizi M, Cherifi NO, Tamoum A, Hamane D, et al. Aerodynamic performance investigations of savonius twin-rotor wind turbines. J Appl Fluid Mech. 2024;17(2):442–60. 10.47176/jafm.17.02.2044.Search in Google Scholar
[20] Prabowo AR, Prabowoputra DM. Investigation on Savonius turbine technology as harvesting instrument of non-fossil energy: Technical development and potential implementation. Theo Appl Mech Lett. 2020;10(4):262–9. 10.1016/j.taml.2020.01.034.Search in Google Scholar
[21] Kumar R, Kumar A. Optimization of slot parameters for performance enhancement of slotted Savonius hydrokinetic turbine using Taguchi analysis. Renew Energy. 2024;237:121608. 10.1016/j.renene.2024.121608.Search in Google Scholar
[22] Sashikumar CM, Kadam AR, Parida RK. Numerical studies on the performance of Savonius turbines for hydropower application by varying the frontal cross-sectional area. Ocean Eng. 2024;306:117922. 10.1016/j.oceaneng.2024.117922.Search in Google Scholar
[23] Chaudhari VN, Shah SP. Performance enhancement of savonius hydrokinetic turbine using split airfoil blade: A numerical investigation. Renew Energy. 2024;224:120158. 10.1016/j.renene.2024.120158.Search in Google Scholar
[24] Rengma TS, Gupta MK, Subbarao PMV. A novel method of optimizing the Savonius hydrokinetic turbine blades using Bezier curve. Renew Energy. 2023;216:119091. 10.1016/j.renene.2023.119091.Search in Google Scholar
[25] Kamal MM, Abbas A, Alam T, Gupta NK, Khargotra R, singh T. Hybrid cross-flow hydrokinetic turbine: Computational analysis for performance characteristics with helical Savonius blade angle of 135°. Results Eng. 2023;20:101610. 10.1016/j.rineng.2023.101610.Search in Google Scholar
[26] Chaudhari VN, Shah SP. Numerical investigation on the performance of an innovative Airfoil-Bladed Savonius Hydrokinetic Turbine (ABSHKT) with deflector. Int J Thermofluid. 2023;17:100279. 10.1016/j.ijft.2023.100279.Search in Google Scholar
[27] Nikbakhsh AA, Mehraein M, Karami M, Khani MS, Mohajeri SH. Performance assessment of savonius hydrokinetic turbine in a sharp 90° channel bend. Energy Sustainable Dev. 2023;76:101259. 10.1016/j.esd.2023.101259.Search in Google Scholar
[28] Prabowoputra DM, Prabowo AR. Effect of geometry modification on turbine performance: mini-review of savonius rotor. Int J Mech Eng Robot Res. 2022;11(10):777–83. 10.18178/ijmerr.11.10.777-783.Search in Google Scholar
[29] Farozan I, Soelaiman TAF, Soetikno P, Indartono YS. The effect of rotor aspect ratio, stages, and twist angle on Savonius wind turbine performance in low wind speeds environment. Res Eng. 2025;25:104041. 10.1016/j.rineng.2025.104041.Search in Google Scholar
[30] Kamal MM, Abbas A, Alam T, Gupta NK, Khargotra R, Singh T. Hybrid cross-flow hydrokinetic turbine: Computational analysis for performance characteristics with helical Savonius blade angle of 135°. Res Eng. 2023;20:101610. 10.1016/j.rineng.2023.101610.Search in Google Scholar
[31] Yigit C. Numerical investigation of specific performance parameters of the S-ROTOR; A savonius type turbine design. Ocean Eng. 2024;291:116314. 10.1016/j.oceaneng.2023.116314.Search in Google Scholar
[32] Prabowoputra DM, Prabowo AR. Effect of the phase-shift angle on the vertical axis Savonius wind turbine performance as a renewable-energy harvesting instrument. Energy Rep. 2022;8:57–66. 10.1016/j.egyr.2022.06.092.Search in Google Scholar
[33] Tjahjana DDDP, Arifin Z, Suyitno S, Juwana WE, Prabowo AR, Harsito C. Experimental study of the effect of slotted blades on the Savonius wind turbine performance. Theo Appl Mech Lett. 2021;11(3):100249. 10.1016/j.taml.2021.100249.Search in Google Scholar
[34] Kacprzak K, Liskiewicz G, Sobczak K. Numerical investigation of conventional and modified Savonius wind turbines. Renew Energy. 2013;60:578–85. 10.1016/j.renene.2013.06.009.Search in Google Scholar
[35] Jian C, Kumbernuss J, Linhua Z, Lin L, Hongxing Y. Influence of phase-shift and overlap ratio on savonius wind turbine’s performance. J Sol Energy Eng. 2012;134(1):011016. 10.1115/1.4004980.Search in Google Scholar
[36] Prabowoputra DM, Krisnawati M, Sari Nurhidayat AR, Khosyi M, Febrian Nur Halim R, Zumara H. CFD analysis of the stage-ratio factor on savonius wind turbine performance to optimize clean-energy conversion. E3S Web Conf. 2023;465:01007. 10.1051/e3sconf/202346501007.Search in Google Scholar
[37] Prabowoputra DM, Hadi S, Prabowo AR, Sohn JM. Performance investigation of the savonius horizontal water turbine accounting for stage rotor design. Int J Mech Eng Robot Res. 2020;9(2):184–9. 10.18178/ijmerr.9.2.184-189.Search in Google Scholar
[38] Haddad HZ, Mohamed MH, Shabana YM, Elsayed K. Optimization of Savonius wind turbine with additional blades by surrogate model using artificial neural networks. Energy. 2023;270:126952. 10.1016/j.energy.2023.126952.Search in Google Scholar
[39] Okokpujie IP, Tartibu LK, Babaremu K, Akinfaye C, Ogundipe AT, Akinlabi ET. Study of the corrosion, electrical, and mechanical properties of aluminium metal composite reinforced with coconut rice and eggshell for wind turbine blade development. Clean Eng Technol. 2023;13:100627. 10.1016/j.clet.2023.100627.Search in Google Scholar
[40] Shanks J, Chernjavsky P, Dey R, Tian Y, Zheng Y. Hydrodynamic flexible spindle (HydroFlex) polishing of turbine blade internal cooling channels for oxide removal. Manuf Lett. 2024;41:691–5. 10.1016/j.mfglet.2024.09.087.Search in Google Scholar
[41] Prabowoputra DM, Prabowo AR, Bahatmaka A, Hadi S. Analytical review of material criteria as supporting factors in horizontal axis wind turbines: effect to structural responses. Procedia Struct Integr. 2020;27:155–62. 10.1016/j.prostr.2020.07.021.Search in Google Scholar
[42] Ginting A, Masyithah Z. Predictive mapping of surface roughness in turning of hardened AISI 4340 using carbide tools. Commun Sci Technol. 2024;9(1):179–84. 10.21924/cst.9.1.2024.1417.Search in Google Scholar
[43] Khorram A, Rezaeian M, Bakhtiari-Nejad F. Multiple cracks detection in a beam subjected to a moving load using wavelet analysis combined with factorial design. Euro J Mech – A/Sol. 2013;40:97–113. 10.1016/j.euromechsol.2012.12.012.Search in Google Scholar
[44] Suard S, Hostikka S, Baccou J. Sensitivity analysis of fire models using a fractional factorial design. Fire Saf J. 2013;62:115–24. 10.1016/j.firesaf.2013.01.031.Search in Google Scholar
[45] Gelis K. Factorial experimental design for second law analysis of panel radiators as a function of radiator dimension. J Build Eng. 2021;43:102872. 10.1016/j.jobe.2021.102872.Search in Google Scholar
[46] Prabowoputra DM, Hadi S, Prabowo AR, Sohn JM. Performance assessment of water turbine subjected to geometrical alteration of Savonius rotor. Proceedings of the 6th International Conference and Exhibition on Sustainable Energy and Advanced Materials: ICE-SEAM 2019, 16-17 October 2019. Surakarta, Indonesia: Springer; 2020. p. 351–65, 10.1007/978-981-15-4481-1_35.Search in Google Scholar
[47] Abulnaga B. Water power without waterfalls. Water Res J. 1988;57–60.Search in Google Scholar
[48] Patel V, Eldho TI, Prabhu SV. Theoretical study on the prediction of the hydrodynamic performance of a Savonius turbine based on stagnation pressure and impulse momentum principle. Energy Convers Manag. 2018;168:545–63. 10.1016/j.enconman.2018.04.065.Search in Google Scholar
[49] Maldar NR, Ng CY, Oguz E. A review of the optimization studies for Savonius turbine considering hydrokinetic applications. Energy Convers Manag. 2020;226:113495. 10.1016/j.enconman.2020.113495.Search in Google Scholar
[50] Lajnef M, Mosbahi M, Hasna A, Driss Z, Amato E, Tucciarelli T, et al. Numerical model parameters choice of helical savonius wind rotor: CFD investigation and experimental validation. CFD Lett. 2024;16(10):94–111. 10.37934/cfdl.16.10.94111.Search in Google Scholar
[51] Patel UK, Alom N, Saha UK. Aerodynamic analysis of a 2-stage elliptical-bladed Savonius wind rotor: Numerical simulation and experimental validation. Int J Green Energy. 2024;21(1):102–15. 10.1080/15435075.2023.2194975.Search in Google Scholar
[52] Chegini S, Asadbeigi M, Ghafoorian F, Mehrpooya M. An investigation into the self-starting of darrieus-savonius hybrid wind turbine and performance enhancement through innovative deflectors: A CFD approach. Ocean Eng. 2023;287:115910. 10.1016/j.oceaneng.2023.115910.Search in Google Scholar
[53] Kumar R, Kumar A. Investigation of slot parameters on the performance of Savonius hydrokinetic turbine: a CFD study. J Braz Soc Mech Sci Eng. 2024;46(8):506. 10.1007/s40430-024-05071-x.Search in Google Scholar
[54] Torres S, Marulanda A, Montoya MF, Hernandez C. Geometric design optimization of a Savonius wind turbine. Energy Convers Manag. 2022;262:115679. 10.1016/j.enconman.2022.115679.Search in Google Scholar
[55] Hassanzadeh R, Mohammadnejad M, Mostafavi S. Comparison of various blade profiles in a two-blade conventional savonius wind turbine. J Energy Resour Technol. 2021;143(2):021301. 10.1115/1.4047757.Search in Google Scholar
[56] Saad AS, El-Sharkawy II, Ookawara S, Ahmed M. Performance enhancement of twisted-bladed Savonius vertical axis wind turbines. Energy Convers Manag. 2020;209:112673. 10.1016/j.enconman.2020.112673.Search in Google Scholar
[57] Alom N, Saha UK. Examining the aerodynamic drag and lift characteristics of a newly developed elliptical-bladed savonius rotor. J Energy Resour Technol. 2019;141(5):051201. 10.1115/1.4041735.Search in Google Scholar
[58] Ibrahim A, Elbaz AMR. Investigating Efficient Clusters of Savonius Wind Turbines - Volume 9: Oil and Gas Applications; Supercritical CO2 Power Cycles. ASME Turbo Expo 2018: Turbomachinery Technical Conference and Exposition, Oslo, Norway, 2018. 10.1115/GT2018-75405.10.1115/GT2018-75405Search in Google Scholar
[59] Prabowoputra DM, Prabowo AR, Hadi S, Sohn JM. Assessment of turbine stages and blade numbers on modified 3D Savonius hydrokinetic turbine performance using CFD analysis. Multidiscip Model Mater Struct. 2021;17(1):253–72. 10.1108/MMMS-12-2019-0224.Search in Google Scholar
[60] Paniagua-García E, Taborda E, Nieto-Londoño C, Sierra-Pérez J, Vásquez RE, Perafán-López JC. A meta-model based cross-sectional shape of a Savonius hydrokinetic turbine for sustainable power generation in remote rural areas. Renew Energy. 2025;244:122647. 10.1016/j.renene.2025.122647.Search in Google Scholar
[61] Prabowoputra DM, Hadi S, Prija Tjahjana DDD, Aziz M. Single-factor analysis of variance on the effect of blade’s number on rotor drag-type performance. ASEAN Eng J. 2023;13(4):7–12. 10.11113/aej.v13.18651.Search in Google Scholar
[62] Saikot MMH, Rahman M, Hosen MA, Ajwad W, Jamil MF, Islam MQ. Savonius wind turbine performance comparison with one and two porous deflectors: A CFD study. Flow Turbul Combust. 2023;111(4):1227–51. 10.1007/s10494-023-00459-6.Search in Google Scholar
[63] Prabowoputra DM, Prabowo AR, Yaningsih I, Tjahjana DDDP, Laksono FB, Adiputra R, et al. Effect of blade angle and number on the performance of bánki hydro-turbines: assessment using CFD and FDA approaches. Evergreen. 2023;10(1):519–30. 10.5109/6782156.Search in Google Scholar
[64] Babay MA, Adar M, Chebak A, Mabrouki M. Exploring the sustainability of serpentine flow-field fuel cell, straight channel PEM fuel cells hight temperature through numerical analysis. Energy Nexus. 2024;14:100283. 10.1016/j.nexus.2024.100283.Search in Google Scholar
[65] Prabowoputra DM, Hadi S, Sohn JM, Prabowo AR. The effect of multi-stage modification on the performance of Savonius water turbines under the horizontal axis condition. Open Eng. 2020;10(1):793–803. 10.1515/eng-2020-0085.Search in Google Scholar
[66] Chan CM, Bai HL, He DQ. Blade shape optimization of the Savonius wind turbine using a genetic algorithm. Appl Energy. 2018;213:148–57. 10.1016/j.apenergy.2018.01.029.Search in Google Scholar
[67] Balduzzi F, Bianchini A, Maleci R, Ferrara G, Ferrari L. Critical issues in the CFD simulation of Darrieus wind turbines. Renew Energy. 2016;85:419–35. 10.1016/j.renene.2015.06.048.Search in Google Scholar
[68] Roy S, Saha UK. Wind tunnel experiments of a newly developed two-bladed Savonius-style wind turbine. Appl Energy. 2015;137:117–25. 10.1016/j.apenergy.2014.10.022.Search in Google Scholar
[69] Abdullah MS, Ismail F. Optimization of Savonius rotor blade performance using Taguchi method: Experimental and 3D-CFD approach. Energy. 2024;303:131801. 10.1016/j.energy.2024.131801.Search in Google Scholar
[70] Montgomery DC. Design and analysis of experiments. New Jersey, United States: John Wiley & Sons; 2017.Search in Google Scholar
[71] Lee B, Pourmousavian N, Hensen JLM. Full-factorial design space exploration approach for multi-criteria decision making of the design of industrial halls. Energy Build. 2016;117:352–61. 10.1016/j.enbuild.2015.09.028.Search in Google Scholar
[72] Buragohain M, Mahanata C. A novel approach for ANFIS modelling based on full factorial design. Appl Soft Comput. 2008;8(1):609–25. 10.1016/j.asoc.2007.03.010.Search in Google Scholar
[73] López RAC, Espinal AAC, Manco OCÚ, Duque PAM. Run orders in factorial designs using the assignment–expansion method. Comput Indus Eng. 2025;200:110844. 10.1016/j.cie.2024.110844.Search in Google Scholar
[74] Janković A, Chaudhary G, Goia F. Optimization through classical design of experiments (DOE): An investigation on the performance of different factorial designs for multi-objective optimization of complex systems. J Build Eng. 2025;102:111931. 10.1016/j.jobe.2025.111931.Search in Google Scholar
[75] Colette DA, Martial AKD, Joseph AY, Benjamin YK, Patrick DA. Optimization of the compressive strength of used tire/cement phase composite concretes using a full factorial design. Constr Build Mat. 2023;404:133252. 10.1016/j.conbuildmat.2023.133252.Search in Google Scholar
[76] Dasgupta R, Mondal DP, Roy A. Slurry wear behaviour of steels—a computer aided-factorial design approach. Wear. 1999;231(2):235–41. 10.1016/S0043-1648(99)00108-8.Search in Google Scholar
[77] Taher MAB, Pelay U, Russeil S, Bougeard D. A novel design to optimize the optical performances of parabolic trough collector using Taguchi, ANOVA and grey relational analysis methods. Renew Energy. 2023;216:119105. 10.1016/j.renene.2023.119105.Search in Google Scholar
[78] Jasim DJ, Ali ABM, Qali DJ, Mahdy OS, Salahshour S, Efrekhari SA. Using design of experiment via the linear model of analysis of variance to predict the thermal conductivity of Al2O3/ethylene glycol-water hybrid nanofluid. Int J Thermofluid. 2024;24:100829. 10.1016/j.ijft.2024.100829.Search in Google Scholar
[79] Mirzabaghi F, Saidi MH, Aghanajafi C. Cooling optimization of developing, pulsating, incompressible airflow through a 4-rifled aluminum microtube using statistical approach based on analysis of variance (ANOVA). Res Eng. 2025;27:105566. 10.1016/j.rineng.2025.105566.Search in Google Scholar
[80] Xie H. Analysis of interaction function of modern graphic design based on technical-aided design. J King Saud Univ Sci. 2023;35(8):102828. 10.1016/j.jksus.2023.102828.Search in Google Scholar
[81] Naik AB, Reddy AC. Optimization of tensile strength in TIG welding using the Taguchi method and analysis of variance (ANOVA). Therm Sci Eng Prog. 2018;8:327–39. 10.1016/j.tsep.2018.08.005.Search in Google Scholar
© 2025 the author(s), published by De Gruyter
This work is licensed under the Creative Commons Attribution 4.0 International License.
Articles in the same Issue
- Research Articles
- Layerwise generalized formulation solved via a boundary discontinuous method for multilayered structures. Part 1: Plates
- Thermoelastic interactions in functionally graded materials without energy dissipation
- Layerwise generalized formulation solved via boundary discontinuous method for multilayered structures. Part 2: Shells
- Visual scripting approach for structural safety assessment of masonry walls
- Nonlinear analysis of generalized thermoelastic interaction in unbounded thermoelastic media
- Study of heat transfer through functionally graded material fins using analytical and numerical investigations
- Analysis of magneto-aerothermal load effects on variable nonlocal dynamics of functionally graded nanobeams using Bernstein polynomials
- Effective thickness of gallium arsenide on the transverse electric and transverse magnetic modes
- Investigating the behavior of above-ground concrete tanks under the blast load regarding the fluid-structure interaction
- Numerical study on the effect of V-notch on the penetration of grounding incidents in stiffened plates
- Thermo-elastic analysis of curved beam made of functionally graded material with variable parameters
- Effect of curved geometrical aspects of Savonius rotor on turbine performance using factorial design analysis
- A mechanical and microstructural investigation of friction stir processed AZ31B Mg alloy-SiC composites
- Mechanical design of engineered-curved patrol boat hull based on the geometric parameters and hydrodynamic criteria
- Analysis of functionally graded porous plates using an enhanced MITC3+ element with in-plane strain correction
- Review Article
- Technological developments of amphibious aircraft designs: Research milestone and current achievement
- Special Issue: TS-IMSM 2024
- Influence of propeller shaft angles on the speed performance of composite fishing boats
- Design optimization of Bakelite support for LNG ISO tank 40 ft using finite element analysis
- The topology optimization applied to the evaluation study of bracket caliper by using finite element method