Numerical study on the effect of V-notch on the penetration of grounding incidents in stiffened plates
-
Berlian Arswendo Adietya
 ,
Tuswan Tuswan
,
Tuswan Tuswan

Abstract
Grounding is an accident on the ship that can hit the bottom ship, propeller, rudder, and other ship structure. Notch is a defect often appearing in ship structures, aircraft structures, bridges, welded joints, and even microstructures. The most formed notch shape is a notch with a V-like shape called a V-notch. The present study relies on the finite element approach to analyze the impact of the V-notch defect on the grounding penetration simulation on a stiffened bottom plate. This study models 28 distinct scenarios distinguished by the quantity, size, and distance between V-notches. Study outputs in reaction force, resistance, and plate deformation due to penetration, stress concentration, and penetration depth of grounding impact on the stiffened bottom plate are obtained using dynamic explicit simulation in the form of penetration. The outcomes of the numerical simulation demonstrate that the existence of V-notch defects causes stress concentration, reducing the plate structure’s resistance and allowable penetration. The plate with one V-notch defect can reduce the resistance to 29.7% of the resistance of the plate without defects. Besides that, the resistance of the plate with two defects drops by only 5.2%, while when there are three defects simultaneously on the stiffener plate, the plate resistance is reduced by 31.4%. This research shows that the number of V-notches does not determine resistance in a plate, but the position of the V-notch on the plate is close to the penetration area, which is about 100 mm from the center of the plate. V-notch defects with smaller opening angles reduce resistance by 34.38% compared to larger opening angles, which only reduce resistance by 29.77%. Therefore, reducing the strength of the ship in grounding will increase the possibility of losing ship buoyancy, cargo leaks, engine and electrical failure, and loss of propulsion.
1 Introduction
The strength of a ship’s structure can be affected by factors such as the load received by the ship, impact, explosion, accident, and others. One example of an accident on a ship is a grounding incident. Grounding is a type of maritime accident in which a vessel comes into unintended contact with the seabed, potentially causing damage to critical components such as the bottom, propeller, rudder, and other structural elements of the ship. The effect of grounding can cause several accidents on the ship, so it greatly influences the strength of the ship’s structure. According to data from the National Transportation Safety Committee [1], 10 of the total 152 ship accidents that occurred in Indonesia between 2008 and 2021 were due to ship grounding incidents at sea. Other European ship accident statistics [2] show that grounding incidents caused 13% of ship accidents at sea between 2014 and 2021. Another statistical data from Japan on maritime accidents in 2011–2020 [3] show that grounding accidents accounted for 24.1%. A ship that runs aground due to grounding can get stuck in the shipping lane, the ship’s structure will crack, and potentially cause fatalities.
This grounding might result in many incidents on the ship, significantly affecting the ship’s structural integrity [4]. The process of grounding is complex and involves several energy-absorbing systems. The structure’s response depends on the ship’s position with the object hit or how the object hits the hull itself, from the shape and hardness of the object [5]. Damage to the ship during grounding does not stop at the phase when the ship is moving toward the object that is hit, but the ship also suffers damage when the ship has stopped on the reef or the object it hit [6]. The consequences of a grounding incident are not only on the damaged structure of the ship’s bottom but also on the environmental aspect where the grounding incident also causes oil spills or ship fuel that spills into the sea because the hull of the ship’s bottom is damaged and torn as a result of hitting a hard and sharp object or seabed so that the ship’s oil or fuel cargo spills into the sea [7]. The grounding in the bottom is illustrated by Figure 1. According to Simonsen in his thesis [8], based on the cause of the impact and the result of the ship’s collision with objects or the seabed, overall grounding incidents are divided into two major groups: (1) Grounding incidents that hit the soft seabed, so they are called Soft Groundings. Damage to the hull in the event of a grounding accident at the point of contact with the seabed or soft seabed is minimal. (2) Grounding incidents of striking hard sea objects are called hard groundings. The main focus in this group is on localized collisions and torn bottom plate structures resulting from striking the seabed or hard, sharp sea objects.

Grounding illustration.
Ship construction consists of many reinforcing structures, such as profile plates, arranged into a framework to form a ship’s construction [9]. However, over time, defects or damage to the plate structure will usually appear on the plate, such as corrosion, cracks, laps, scabs, etc. [10]. One of the defects that can appear on the plate is the notch. Notches are frequently seen in welded joints, microstructures, ship structures, aircraft structures, propellers, and bridges. According to Shen et al. [11], notches are commonly seen in welded joints, microstructures, ship and aircraft structures, and bridges. V-notch is the most common type of notch shape that resembles the letter V. The V-notch stress concentration will weaken the ship structure’s resistance. The primary factors that determine how notches affect the strength of ship structural plates are material properties, crack opening angle, starting fracture, and notch shape parameters. The notch stress approach is one of several local stress approaches that include the effects of a combination of global and local geometry, one of which is caused by V-shaped notches such as on the ship’s bottom structure [12].
Research on the effect of V-notch and notch stress has been widely studied [11–18] such as Shen et al. [11] examined the effect of V-notch on orthotropic plates due to bending-tensile loads and analyzed its effect on the stress generated in the V-notch area of the plate in the form of notch stress and stress intensity factor (SIF). In his thesis, Agung [13] used a fracture mechanics approach to investigate the notch stress and SIF in the notch generated in the ship plate welding joint and its impact on fatigue evaluation. Zappalorto and Ricotta [14] examined how the elastic characteristics of orthotropic materials affect the SIFs of pointed V-notched plates subjected to tensile loading using both theoretical and numerical approaches. Yi et al. [15] assessed the SIFs of a bi-material V-notch configuration by employing the conversation integral method alongside the extended finite element method.
Grounding research has also been widely studied with several variables and research objects, such as initial velocity, impactor dimensions, and impactor material. Previous studies [4] used the finite element method (FEM) to investigate how pitting corrosion affected the strength of the ship bottom plate strength in grounding accidents. According to the study, the plate was weakened by pitting corrosion closer to the stress concentration ring, as shown by the stress concentration at the crack nucleation. Another study [5] was an experiment to measure the resistance of a stiffened bottom plate to grounding incident penetration. The experiments showed that the stiffener plates were subjected to bending and failed due to excessive strain. Although the stiffener plate did not crack, it triggered cracks in the bottom plate. Naar et al. [19] investigated the stranding response of the double-bottom structure of ships. Various double bottoms were investigated under the same grounding conditions to obtain a double bottom structure highly resistant to grounding incidents. In another study, Samuelides et al. [20] examined the response and behavior of multiple bottom structures subjected to grounding incidents.
The mechanics of the grounding phenomenon that occurs on ships can also be studied in the entire response of the ship when experiencing grounding, including ground response, stability, damping, added mass, etc. [21]. The stability of the ship when experiencing a grounding incident can be studied through various load cases of the ship when it hits the beach so that it gives rise to ground response, weight distribution centered on the ship’s body that is hit by the beach, and seakeeping performance analysis [22]. Other ship stability can also be studied through the type of propeller used by the grounding ship, from which we will know whether the ship is able to maintain its stability even when the ship’s body hits other objects at sea so that improvements in propeller performance are needed, which can be analyzed on the propeller type [23]. Damaged ship caused by grounding is exposed to oblique waves and makes the ship unstable until the damaged ship faces rolling dynamics. To analyze this, multi-degree-of-freedom motions of the ship are needed. The motions of sway and heave are essential to understanding the rolling hydrodynamics of a damaged ship, as the rolling hydrodynamic coefficients can differ significantly based on the phase relationships among sway, heave, and roll motions [24].
The damage and impact of ship accidents can be further comprehended by reviewing various things such as ship construction [25], ship materials [26,27], impact loads [28], and others. To analyze these things, accurate research is needed either experimentally or using computational simulations such as FEMs, computational fluid dynamics, and others. The FEM is currently a widely used method to simulate events or situations that need to be analyzed computationally [29]. FEM method models objects or objects using an approach to the relationship between nodes or what is called a mesh [30]. Mesh refers to the surface of an object that has mechanical properties and formulas that are made close to the real world [31].
The previous studies underline this research to analyze further the effect of grounding incident penetration on the stiffened bottom plate by adding plate defects in the form of V-notches. Previously, no one had examined V-notch defects in grounding incidents. Therefore, the author wants to numerically analyze the effect of V-notch defects on grounding incident penetration. In this study, we will focus on the object of V-notch defects on the stiffened bottom plate of the ship’s bottom construction structure with 28 scenarios that are distinguished based on the number of V-notches on the plate, the distance between V-notches and the shape of the V-notch adjusted from the material characteristics, opening angle, initial crack, and depth of the V-notch. This study examines which factors can significantly reduce the plate resistance, whether from the number, position, dimensions, or distance between notches. The grounding incident is simulated under different V-notch conditions using the numerical method of LS-DYNA software. Dynamic explicit simulation in penetration is used to obtain research outputs in reaction force, maximum stress, plate resistance and deformation, stress distribution, and penetration depth of the grounding incident on the stiffened bottom plate.
2 Materials and methods
This section presents a detailed description of the grounding scenario, the setup of the FEM model, and the definition of the notch variable used in the analysis.
2.1 Grounding scenario
The initial step to simulate grounding is to create a model of the object to be simulated. A part assembly is modeled in this study to simulate the ship grounding incident simplified from the grounding experiments of Alsos and Amdahl [5]. The grounding simulation will be assembled into two main parts consisting of an impactor that represents a marine object that strikes the ship’s body and a bottom plate structure, which is the bottom shell plate and the stiffener plate with the addition of a V-notch defect on the stiffener plate as shown in Figure 2. The dimensions of the impactor and the bottom plate structure that will be the object of research follow the bottom plate criteria from the experiments by Alsos and Amdahl [5]. The dimensions of the stiffener attached to the bottom plate have a plate width of 120 mm and a plate thickness of 6 mm, while the bottom plate has length and width dimensions of 1,200 mm and 720 mm with a plate thickness of 5 mm. The dimensions of the impactor have a radius of 200 mm and an angle of 45°, as shown in Figure 3.
![Figure 2
Modeling setup: (a) Alsos’ experiment [5] and (b) numerical simulation.](/document/doi/10.1515/cls-2025-0035/asset/graphic/j_cls-2025-0035_fig_002.jpg)
Modeling setup: (a) Alsos’ experiment [5] and (b) numerical simulation.

Dimension of the numerical simulation model: (a) side view and (b) front view.
Generally, numerical simulation of grounding incidents uses shell elements because solid elements are longer and more complicated to calculate. Therefore, in this study, the grounding numerical simulation model will be modeled using a four-node shell element commonly called the Belytschko-Tsay element [19], as shown in Figure 4. This type of element is often used in numerical analysis of impact mechanics of steel plate structures. It has been proven in many examples that the Belytschko–Tsay element accurately captures the plastic fracture of the plate structure as long as there is no crack propagation. The initiation and propagation of cracks in a stiffened bottom plate structure can be modeled in LS-DYNA by removing the element from the system after the plastic strain reaches a certain level. The failure of the shell element in the time logger during the simulation run is usually recorded by:

Finite element of grounding simulation.
18:05:02
failed element report time = 6.0172 × 10⁻²
number of failed shell elements = 3
number of failed tshell elements = 0
shell element 250,176 failed at time 6.0172 × 10⁻².
The impactor component was converted into an element using an eight-node hexahedron mesh type with solid elements, as depicted in Figure 4. In the case of solid elements, the nodal coordinates (
There will be a moment of penetration in a grounding incident between objects at sea and the ship’s bottom structure, where the penetration will affect the configuration of the ship’s bottom structure and can even damage and weaken the strength of the ship’s bottom structure [31]. This is consistent with Alsos and Amdahl’s experiments [5], as illustrated in Figure 5. Measurements of U z and h are made from point λ, where λ is the impactor’s centerline distance, h is the distance from the impactor radius point to the bottom plate’s surface, and U z is the depth of deformation in the plate. δ represents the distance of impactor translation, which can be seen in Eq. (2)

Contact due to grounding simulation.
The collision under ship grounding conditions in the numerical simulation is represented by the interaction between two objects consisting of a slave part, namely the impactor, and a master part, namely the ship’s bottom structural plate, where the slave part cannot penetrate the master part [16]. A contact force will be created when the slave and master parts collide. This study will also investigate stress distribution and crack nucleation – the first stage of a crack forming, since the grounding simulation will run until the bottom plate structure is cracked [5].
2.2 V-Notch scenario
An important object of this study is the V-notch on the stiffener plate on the ship. It is necessary to model several different shapes and sizes of V-notches in this study to get accurate results of the effect of V-notches on the ship. The V-notch in this study follows the simulation standard by Shen et al. [11], who used an orthotropic plate with two V-notches in the center of the plate and opposite directions between the V-notches. In this study, testing the V-notch on only one side of the stiffener will be planned with 28 scenarios. In this study, the ship is modeled and represented as a rectangular plate with stiffener, neglecting the ship load, engine, propeller, and other factors. Figure 6 shows the V-notch model on the plate; the dimensions of the V-notch defects follow the V-notch dimension criteria from the research of Shen et al. [11], who simulated V-notch on an orthotropic plate. In the V-notch model, the length of the first crack is represented by a, the opening angle of the produced V-notch is shown by θ, l indicates the depth of the V-notch defect, and the spacing between V-notch defects on the plate is shown by h.

V-notch model of numerical simulation.
The V-notch model applied to the FEM to be simulated is shown in Figure 7. As indicated in Table 1, the V-notch dimensions in this study scenario will be split into four categories. The number of notches planned to be simulated is 1–3 pieces, with the distance between V-notches (notch spacing) planned as far as h = 200–300 mm. The scenarios in this simulation will combine all conditions, namely the number of V-notches, the distance between V-notches, and the dimensions of the V-notch itself. The planned scenarios are 28 scenarios, as shown in Table 2. The scenario modeling with the minor condition is when the bottom plate has one notch defect with the most diminutive V-notch dimensions of notch depth of 15 mm, the opening angle of 30°, and crack length of 1 mm. The most extreme condition is when the bottom plate has three notch defects with adjacent notch spacing of 200 mm, with the largest notch dimensions of 25 mm notch depth, 120° opening angle, and 5 mm crack length.

FEM of V-notch.
Dimension of the V-notch scenario
| Dimension code | θ | l (mm) | a (mm) |
|---|---|---|---|
| A | 30° | 15 | 2 |
| B | 60° | 20 | 3 |
| C | 90° | 25 | 4 |
| D | 120° | 25 | 5 |
Numerical simulation scenario
| Number of V-notch | V-notch spacing | Dimension code | Scenario code |
|---|---|---|---|
| — | — | — | 0 |
| 1 | — | A | 1 |
| B | 2 | ||
| C | 3 | ||
| D | 4 | ||
| 2 | 200 | A | 5 |
| B | 6 | ||
| C | 7 | ||
| D | 8 | ||
| 250 | A | 9 | |
| B | 10 | ||
| C | 11 | ||
| D | 12 | ||
| 300 | A | 13 | |
| B | 14 | ||
| C | 15 | ||
| D | 16 | ||
| 3 | 200 | A | 17 |
| B | 18 | ||
| C | 19 | ||
| D | 20 | ||
| 250 | A | 21 | |
| B | 22 | ||
| C | 23 | ||
| D | 24 | ||
| 300 | A | 25 | |
| B | 26 | ||
| C | 27 | ||
| D | 28 |
2.3 Numerical variable
Equation With today’s modern computer capabilities in structural mechanics, the FEM is gaining popularity as a numerical solution. This includes studies to check the validity of explicit dynamic analysis approaches such as impact, contact, etc. [29], including penetration or bending, which is the primary variable in this study. The present study simulation uses LS-Dyna v.11.2.0 software, as shown in Figures 4 and 7, and the model uses a four-node shell element commonly called the Belytschko-Tsay element [10] with a mesh adjusted to the dimensions of the impactor and impactor bottom plate model. The numerical model for grounding simulation consists of 427,095 elements and 469,575 nodes overall. Boundary conditions are used in the stiffened bottom plate structural model to provide a fixed (non-moving) plate side [31]. That is, Ux = Uy = Uz = Rx = Ry = Rz = 0 for the bottom plate side, and Ux = Uz = Rz = Ry = Rz = 0 for the right and left sides of the stiffener plate. Figure 8 shows the definition of the applied boundary conditions.

Boundary condition of FEM.
The AUTOMATIC_SURFACE_TO_SURFACE algorithm models penetrating contact between the impactor and the stiffened bottom plate structure. In explicit dynamic FEM analysis, this automatic contact algorithm is most frequently utilized to characterize a part making contact with another part [30]. The static and dynamic friction coefficient between the impactor and the plate structure is 0.35. The penetration velocity of the impactor against the concave bottom plate was also defined by the INITIAL_VELOCITY_GENERATION algorithm with a velocity on the y-axis of 0.001667 m/s corresponding to the Alsos experimental hydraulic machine speed of 10 mm/min for the numerical simulation to obtain reaction force and plastic strain results that match the experimental results of Alsos and Amdahl [5].
The material of the numerical model of the impactor and the tensioned bottom plate structure is implemented with the MAT_003_PLASTIC_KINEMATIC card. Eq. (3) uses the material’s hardness to obtain the dynamic stress (
Since the study’s model makes use of shell elements, a deformed material element may be taken into consideration to derive an engineering correction for the element size effect in shell elements. The material element that is stressed to the point of fracture is assumed to be composed of two halves. There is a local neck with volume
Fractures in sheet metal typically occur after there has been considerable plastic deformation localized in narrow regions, known as local necks [5]. While the material does not break apart instantly, the occurrence of local necking is critical. This is due to the formation of a notable weakness in the material, which is rapidly succeeded by fracture. The following assumes just similar strains [21]. The “instability” volume produces
This expression is similar to that presented by Alsos et al. [21], though the basis for the derivation and input values is slightly different.
The materials used in the ship’s body structure usually vary from composite materials, natural materials such as wood and bamboo [26], fiber materials, and even to using steel materials to increase the strength of the ship’s structure when sailing at sea. In this research, the ship’s structure, namely the stiffened bottom plate, will use mild steel and high-strength steel materials. Mild steel material (S235JR EN10025) is utilized for the stiffener plate. Table 3 lists the characteristics of the S235 material that Alsos and Amdahl [5] utilized, while the bottom plate will use high-strength steel material (S355NH EN10210). Table 4 contains the material properties of S355, which will be inputted into the MAT_003 card. The MAT_020_RIGID card will be used as a rigid material [30] that will penetrate the stiffened bottom plate structure for the part impactor material. The simulation time of one scenario run takes more than 20 h for scenarios with the number of V-notch defects 1 and 3 piece(s), while for scenarios with the number of V-notch 2 pieces, it takes about 6 h on a PC with CPU 8-core Intel i7-11700F.
Material properties of S235 [27]
| Material properties | Value | Unit |
|---|---|---|
| Yield stress | 235 | MPa |
| Tan modulus | 672 | MPa |
| Density | 7,850 | kg/m3 |
| Young’s modulus | 210 | GPa |
| Strain rate | 500 | s−1 |
| Beta | 0.30 | |
| Poisson ratio | 0.225 |
Material properties of S355 [27]
| Material properties | Value | Unit |
|---|---|---|
| Yield stress | 355 | MPa |
| Tan modulus | 680 | MPa |
| Density | 7,850 | kg/m3 |
| Young’s modulus | 210 | GPa |
| Strain rate | 850 | s−1 |
| Beta | 0.571 | |
| Poisson ratio | 0.280 |
3 Benchmark test with experimental data
The simulation model that has been made at the beginning needs to be benchmark tested in order to get a model that matches the real-world situation, also identify the best analysis results and the validity of the numerical simulations in this study. Also, Alsos and Amdahl’s experiment [5] on the resistance of a stiffened plate structure to grounding penetration will be compared to the FE model of this study. Figure 9 illustrates how the FE model’s numerical simulation findings in this study correspond to the outcomes of Alsos and Amdahl’s experiment with only a slight difference in the maximum reaction force and displacement of about 0.371%. The numerical simulation and experimental results have a difference at 136 mm penetration, whereas the numerical simulation results show no dip in the reaction force curve at 136 mm penetration. This is similar to other studies [21] where numerical simulation results show no symptoms of a dip in reaction force at certain penetration levels (Table 5).
![Figure 9
Comparison between Alsos’ experiment [5] and numerical simulation of reaction force and displacement.](/document/doi/10.1515/cls-2025-0035/asset/graphic/j_cls-2025-0035_fig_009.jpg)
Comparison between Alsos’ experiment [5] and numerical simulation of reaction force and displacement.
Numerical error with experiment [5]
| Variable | Also’s experiment [5] | Present study with FEM | Error (%) |
|---|---|---|---|
| Reaction force (kN) | 1415.29 | 1410.04 | 0.37 |
| Penetration (mm) | 170.41 | 171.22 | −0.48 |
Figure 10 demonstrates that the stiffener plate deformation in this simulation matches the plate deformation observed in Alsos and Amdahl’s experiment [5]. The cracks in the penetrated stiffened bottom plate structure correspond to the experimental cracks at the joint area between the bottom plate and the stiffener plate. One might expect a crack to occur at the center of the stiffener plate due to the penetration causing an excessive bending moment. But rather than breaking, the stiffener plate folds and bends to one side. As a result, the stiffener plate’s cross-section will experience a bending moment. Following that, fractures appear in the bottom plate’s cross-section near the joint location. This is due to the stiffener plate’s ability to support a substantial load in the longitudinal direction as it distributes stress along it. Its residual capacity is between 50 and 60% of the maximum plate resistance [4]. Although the numerical simulation was stopped as soon as the plate broke, the reaction force graph showed that the initial crack did not indicate a complete loss of plate functionality.
![Figure 10
Comparison of plate deformation (a) numerical simulation and (b) Alsos and Amdahl’s experiment [5].](/document/doi/10.1515/cls-2025-0035/asset/graphic/j_cls-2025-0035_fig_010.jpg)
Comparison of plate deformation (a) numerical simulation and (b) Alsos and Amdahl’s experiment [5].
4 Results and discussion
In the Results and Discussion section, the outcomes of each scenario will be compared to evaluate the effect of the notch. The comparison will be based on reaction forces, penetration depth, and visualizations of material failure.
4.1 Effect of the number of V-notches
This research classifies the object of study, namely the V-notch, into several variables such as the number of V-notches, the dimensions of the V-notch, and the distance between V-notches. The stiffener plate is simulated to have one to three V-notch defects with different positions in this study. One defect is at the center point of the stiffener plate in a scenario. When two defects are present in a scenario, the distance between the notches on the right and left sides of the plate is measured from the stiffener plate’s center line. The defects are on the stiffener plate’s right, left, and center in the scenario with three defects. Figure 11a illustrates the impact of the plate’s number of V-notches. It shows that when the plate has no V-notch defects, it has the most significant reaction force, meaning that the plate resistance is the greatest compared to when there are V-notch defects.
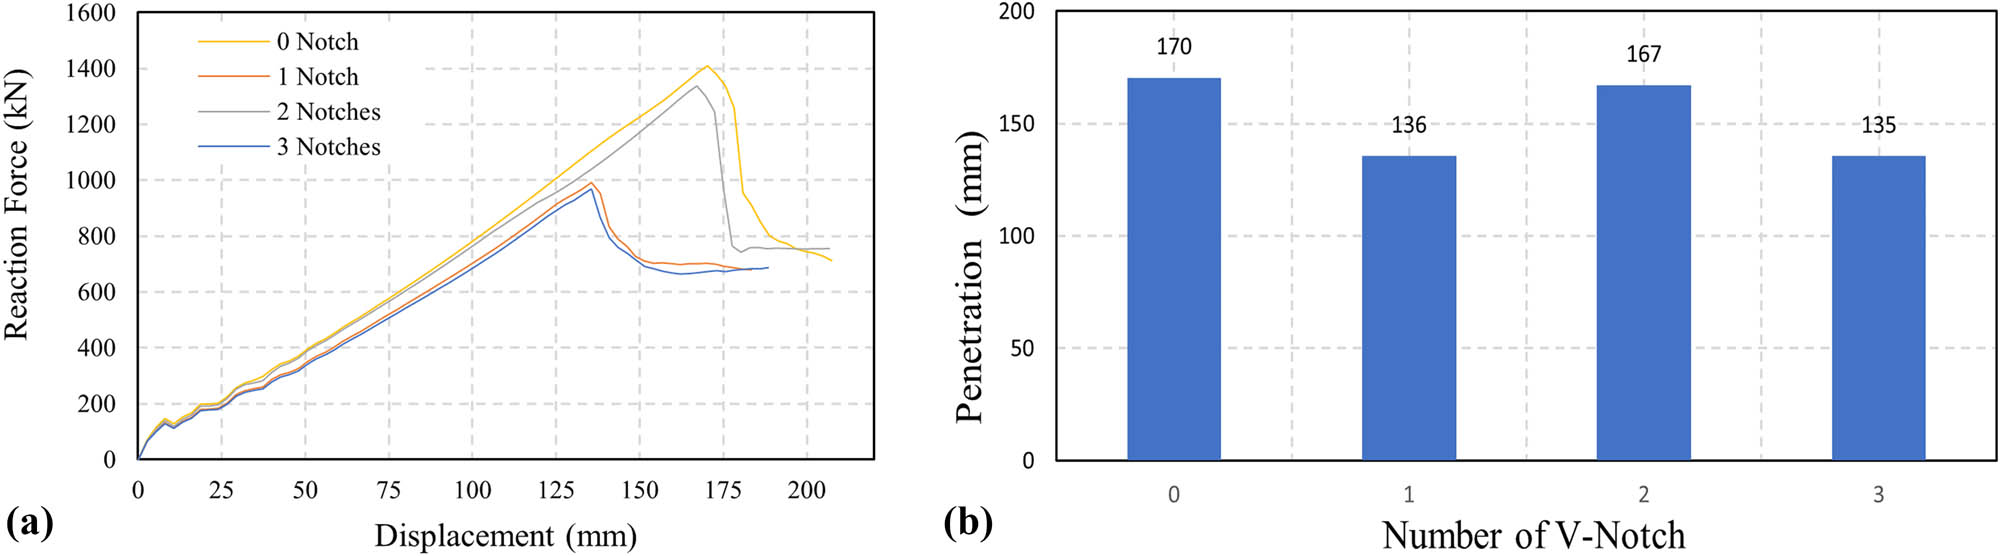
Graph of the number of V-notch effects: (a) reaction forces and (b) penetration.
Figure 11a also shows that when there is one defect, the plate resistance is reduced to 29.7% of the plate’s resistance without defects. While the plate’s resistance when there are two defects decreases by only 5.2%, when there are three defects on the stiffener plate at once, the plate resistance drops to 31.4%. This shows that plates with two defects have higher resistance than plates with one and three defects. Figure 11b shows the depth of penetration that can be applied to the plate until it cracks or fractures. When the plate has no defects, penetration can be up to 170 mm. In contrast, penetration can only be as deep as 136 mm when the plate has one defect. For the scenario of two defects, penetration can be given up to 167 mm, which is only a 3 mm difference from the penetration that can be given for plates without defects. When there are three defects, the penetration can only be done as far as 135 mm until the plate fractures.
This result disproves the assumption that the more defects in the plate, the more susceptible the plate is to fracture. The plate’s resistance is not determined by the number of V-notch defects present on the plate but is influenced by the position of the V-notch defect. V-notch defects located in the center of the plate or parallel to the impactor’s penetration direction will clearly reduce the stiffener plate’s resistance. This is because the load distributed along the plate in the longitudinal direction could be more optimal. After all, the centered V-notch defect in the plate causes the nucleation of cracks to occur in the center of the plate. Plates with two defects can stretch more than plates with one or three V-notches.
4.2 Effect of V-notch dimension
In addition to the number of V-notches, this study also examined the effect of V-notch dimensions on grounding penetration. This dimension variable is presented to determine whether the size of the V-notch has much effect on the resistance of the ship plate. The simulated plate defects’ dimensions are divided into four dimensions of V-notch defects with codes A–D, as shown in Table 1. Figure 12a shows the reaction force results of plates having one V-notch defect. It can be seen that plates having V-notch codes A and B have lower resistance than plates having V-notch code C and code D. Figure 12b shows that the plate with V-notch code A is only able to be penetrated by 130 mm, the same amount as the penetration that can be given to the plate with V-notch code B, which is 130 mm. For plates with V-notch code C, penetration up to 136 mm is the same as for V-notch code D.

Graph of the dimension of V-notch: (a) reaction force and (b) penetration.
The reaction force and penetration graphs for each defect code show that V-notch codes A and B decrease the plate resistance by 34.32 and 34.38%, respectively. Meanwhile, V-notch codes C and D reduce the plate resistance by 31.10 and 29.77%, respectively. In Table 1, it can be seen that code D has the largest opening angle of 120° compared to codes A, B, and C, which have opening angles of 30°, 60°, and 90°, respectively. One might expect that the larger the shape of the V-notch, the lower the plate resistance. However, the results show the opposite: the two V-notch with larger opening angles, codes C and D, reduce the resistance less than those with smaller opening angles, codes A and B.
This phenomenon is explained by previous studies by Liu et al. [17] in their paper “An improved semi-analytical solution for stress at round-tip notches.” According to their studies, when the fracture at the notch’s tip widens under continuous pressure, the maximum stress initially falls and then rises. It was discovered that the maximum stress decreased monotonically with an increasing notch tip radius for the same notch depth [17]. In the present numerical simulation, when loading this case, penetration is applied to a V-notch defect, the maximum stress at the notch tip reduces proportionately to the notch radius or opening angle increase.
The maximum stress of a V-notch with large dimensions can be calculated using the stress concentration factor (SCF) formula, which is often used to find the maximum stress of a V-notch on a plate. The SCF formula uses the ratio between the depth of the V-notch and the width of the plate, which is the main variable in obtaining the SCF value. The maximum stress equation on the V-notch is as follows [18]:
where
where F is the applied force, w is the width of the plate, d is the depth of the V-notch, and t is the thickness of the plate itself. The equation can be studied further by finding the ratio of the V-notch depth and the plate’s width, namely the d/w ratio. This d/w value will be the primary variable in finding the SCF obtained from the following equation [18]:
From Eq. (9), it can be seen that the value of
This explanation reinforces the simulation results in the study that V-notch defects with larger dimensions – in this case, the V-notch depth – have a greater maximum stress before cracking so that the plate structure is more resistant or has greater resistance to penetration loads compared to plates that have V-notches with smaller dimensions.
4.3 Effect of V-Notch spacing
In addition to the number of V-notches and different V-notch dimensions, it is also necessary to analyze the distance between V-notches. This is necessary because steel plates have different strain-hardening and strain-rate effects depending on the defects present in the plate [28]. This study modeled more than one V-notch defect on the stiffener plate with different V-notch spacing between 200 and 300 mm, as shown in Table 2. Figure 13a shows the reaction force graph for notch spacing in the two-notches scenario, where the graph shows that the plate having two V-notches defects with notch spacing of 200 mm has the lowest resistance compared to other notch spacing of 250 and 300 mm, where notch spacing of 300 mm affects the least resistance.

Graph of the spacing of two V-notches’ effects: (a) reaction force and (b) penetration.
Figure 13b shows that the penetration that can be given to plates with two V-notches with a notch spacing of 200 mm is the least, which is only 167 mm, in contrast to plates that have two defects with notch spacing of 250 and 300 mm, which can be given up to 168 and 170 mm, respectively. These results show that plates with two defects with a notch spacing of 200 mm have a decrease in resistance of up to 5.39% compared to plates without V-notch defects. Meanwhile, 250 and 300 mm notch spacing decreased the resistance by only 3.79 and 2.43%, respectively. This is following the previous explanation, where the location of the V-notch defect influences the decrease in resistance. The plate with two defects with a notch spacing of 200 mm is located close to the center area of the stiffener plate, which is parallel to the penetration area so that it clearly reduces the resistance compared to notch spacing of 250 and 300 mm, which are located further from the penetration area located at the stiffener plate’s center.
Figure 14a compares the reaction force on plates with three V-notch defects with 200–300 mm notch spacing. The graph shows different results from the graph in Figure 13b, where the three defects with a notch spacing of 200 mm actually have the highest resistance compared to notch spacing of 250 and 300 mm. The penetration that can be given to the plate with three V-notch defects with a notch spacing of 200 mm is the largest at 139 mm, greater than the notch spacing of 250 and 300 mm, which can only be given penetration as far as 138 and 136 mm, respectively, as shown in Figure 14. These results show that the plate with three V-notch defects with a notch spacing of 200 mm only reduces resistance by 28.94% compared to notch spacing of 250 and 300 mm, which reduces resistance to 29.34 and 30.89%, respectively.

Graph of the spacing of three V-notches: (a) reaction force and (b) penetration.
4.4 Stress concentration (Von-Mises stress)
The results of the simulation also need to be reviewed from the distribution and concentration of stress and deformation that occurred on the stiffened bottom plate when undergoing grounding penetration. Stress concentration is a technique for predicting a structure’s material failure point when there is an elevated risk of failure in that area. Before that, it is necessary to analyze the comparison of the reaction forces results of all 28 scenarios. Figure 15 shows the overall numerical simulation results in 28 scenarios. The results are divided into scenarios with a maximum reaction force of about 1,315–1,400 kN and scenarios with a maximum reaction force of about 925–1,000 kN. This phenomenon is based on the reaction of the stiffened bottom structure in the form of plate resistance, strain due to bending, and penetration. Besides, it is also necessary to analyze stress concentration. Figure 16 shows the maximum reaction force of plates for each of the 28 scenarios. It shows that the reaction force of a scenario with one V-notch defect (scenarios 1–4) is similar to a scenario with three V-notch defects (scenarios 17–28), about 925–1,000 kN. Besides, the reaction force of the scenario with two V-notch defects is about 1,315–1,400 kN, which is close to the reaction force of the scenario when the stiffened bottom plate has no defects, about 1410.03 kN.

Reaction force graph of stiffened plates in 28 scenarios.

Maximum reaction force of stiffened plates in 28 scenarios.
Stress concentration is a technique for predicting a structure’s material failure point when there is an elevated risk of failure in that area. In the stiffener bottom plate structure, stress concentrations of all 28 scenarios can be seen collectively both before and after crack nucleation (Figures 17 and 18). The stress concentration in the stiffener plate before crack nucleation, or the start of the crack, is shown in Figure 16. The stress concentration is highest in the area parallel to the impact penetration direction or the center of the stiffener plate (around 100 mm from the center). The stress concentration centered at the tip of the V-notch defect can be seen in scenarios with one V-notch defect on the plate, which are scenarios 1–4 (Figure 16a–d), and scenarios with three V-notch defects on the plate, which are scenarios 17–28 (Figure 16q–16ab). As for the scenario with two defects on the plate, the stress concentration is not concentrated on the notch defect, so the V-notch defect does not have much effect on the structural resistance of the plate.

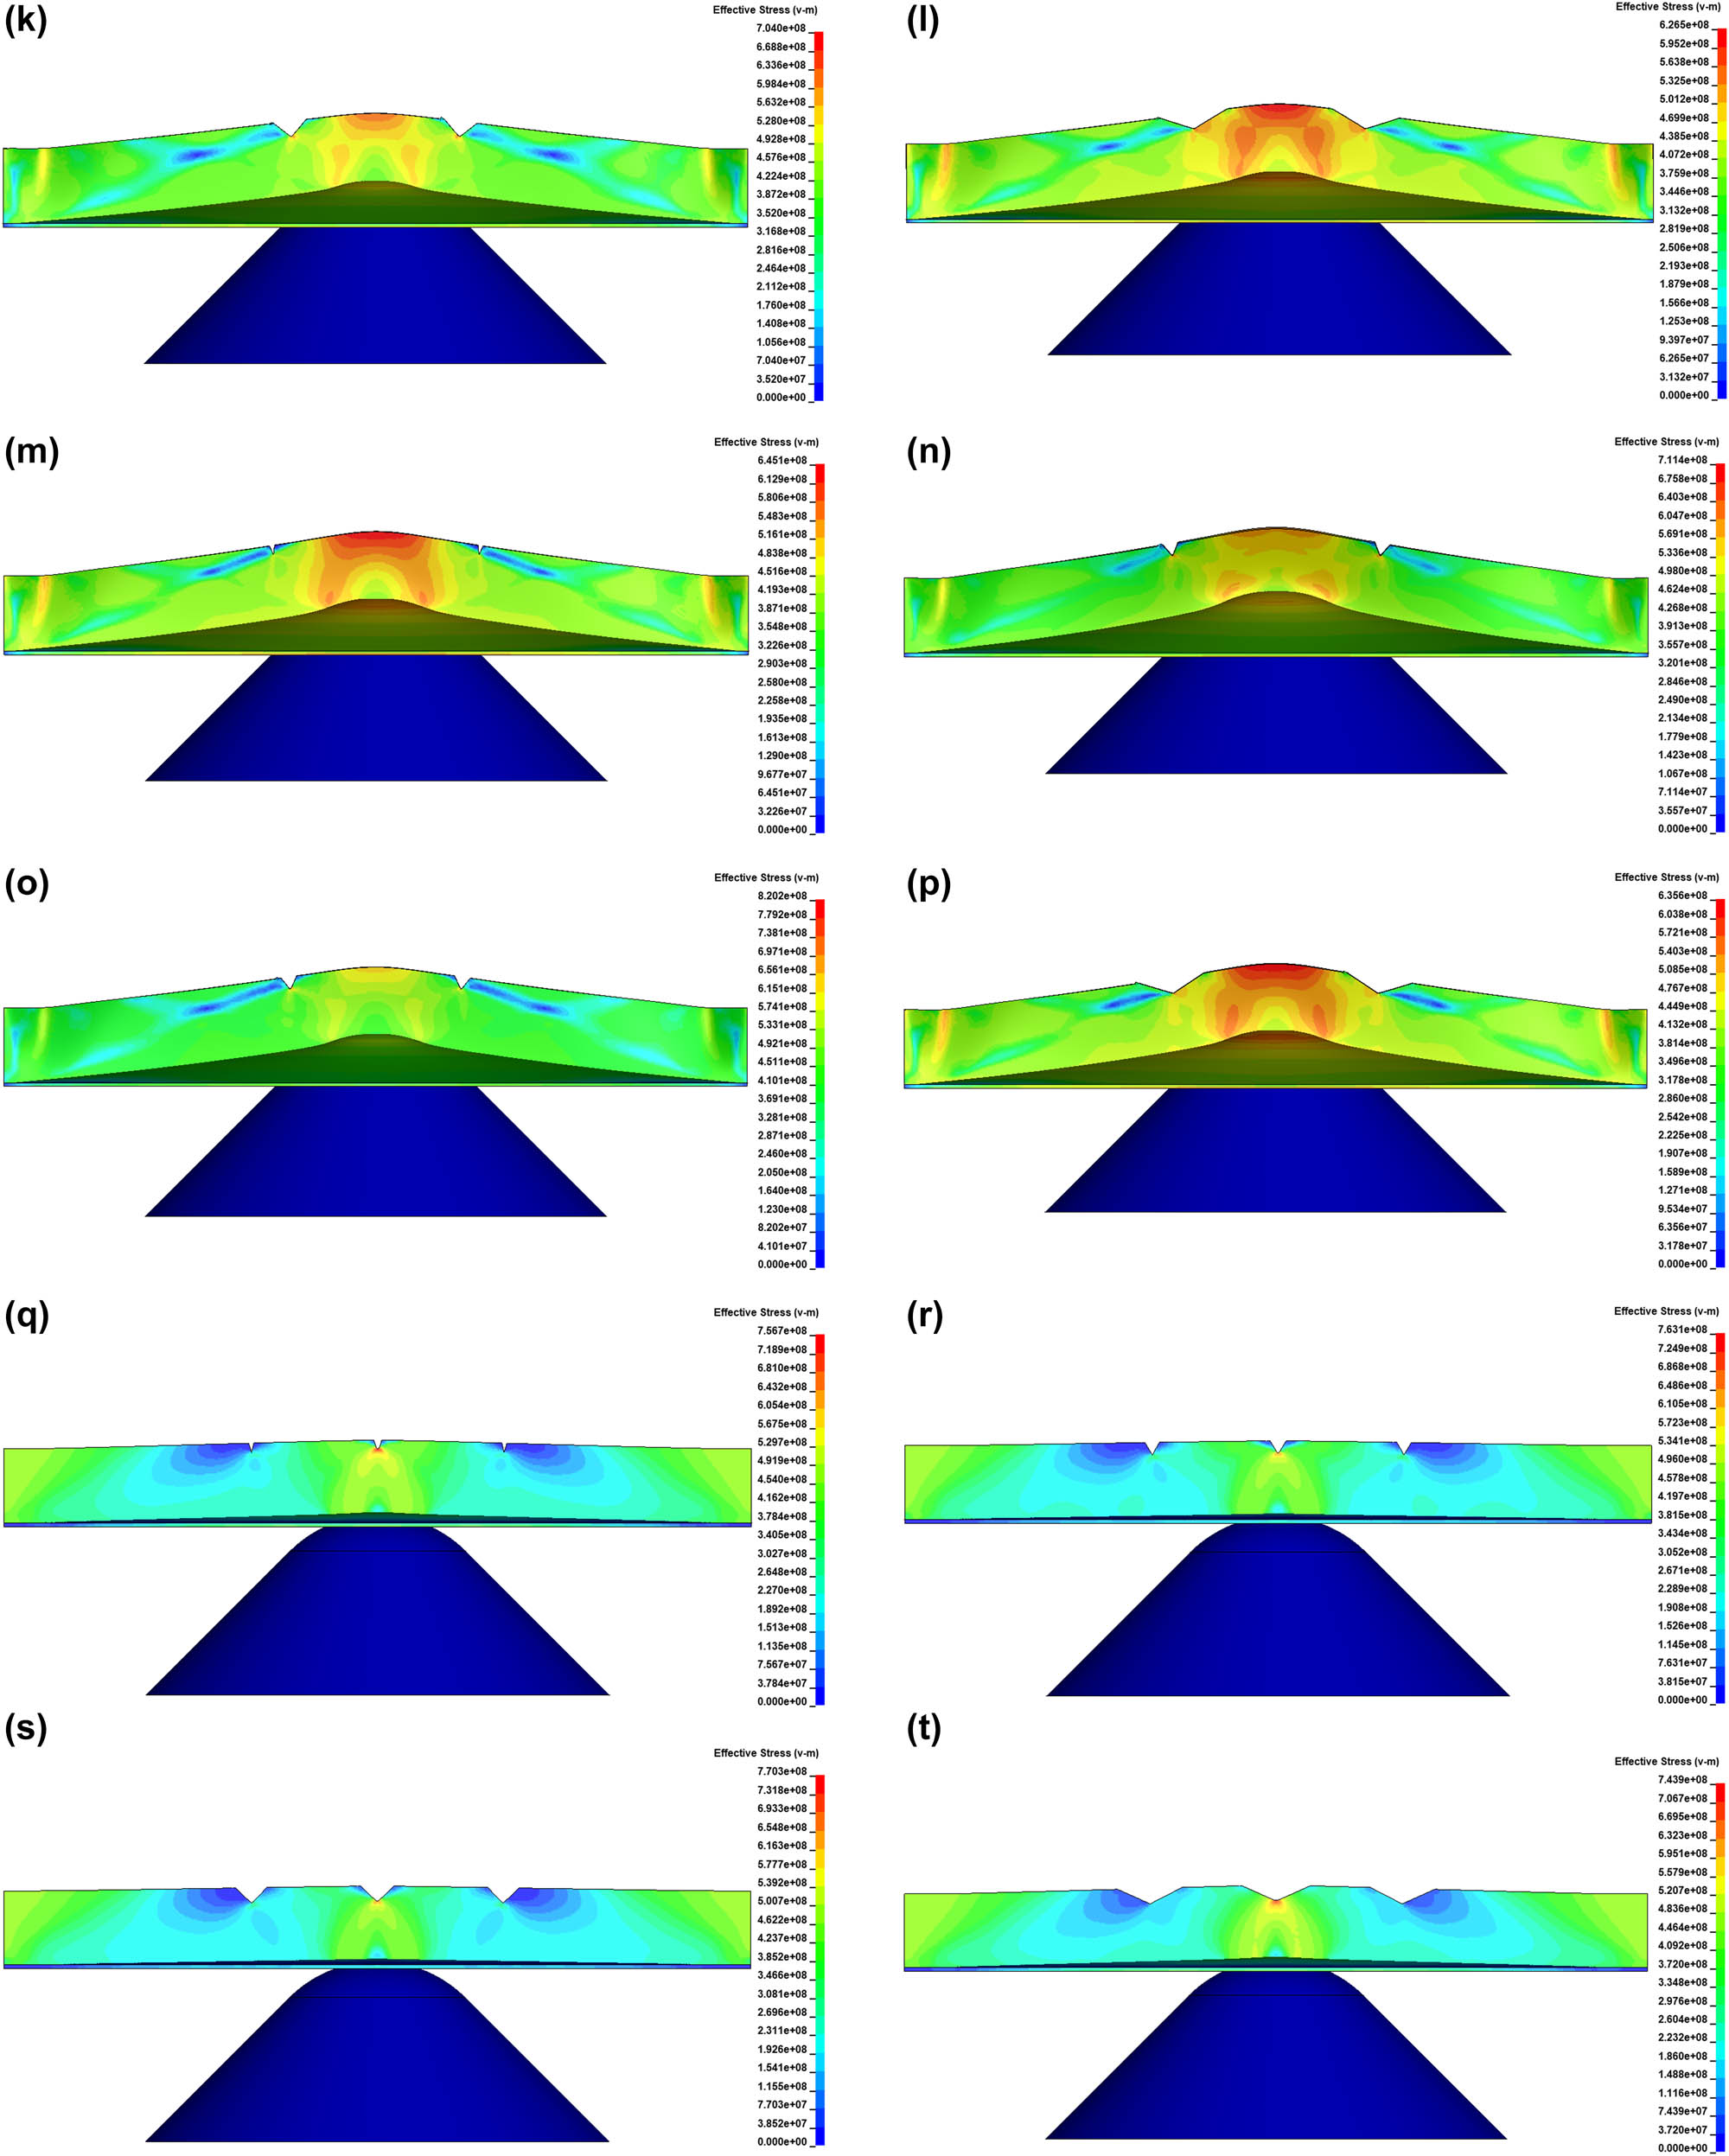

Stress distribution before the plate cracks initiation: (a) Scenario 1, (b) Scenario 2, (c) Scenario 3, (d) Scenario 4, (e) Scenario 5, (f) Scenario 6, (g) Scenario 7, (h) Scenario 8, (i) Scenario 9, (j) Scenario 10, (k) Scenario 11, (l) Scenario 12, (m) Scenario 13, (n) Scenario 14, (o) Scenario 15, (p) Scenario 16, (q) Scenario 17, (r) Scenario 18, (s) Scenario 19, (t) Scenario 20, (u) Scenario 21, (v) Scenario 22, (w) Scenario 23, (x) Scenario 24, (y) Scenario 25, (z) Scenario 26, (aa) Scenario 27, and (ab) Scenario 28.


Stress distribution before the plate cracks initiation: (a) Scenario 1, (b) Scenario 2, (c) Scenario 3, (d) Scenario 4, (e) Scenario 5, (f) Scenario 6, (g) Scenario 7, (h) Scenario 8, (i) Scenario 9, (j) Scenario 10, (k) Scenario 11, (l) Scenario 12, (m) Scenario 13, (n) Scenario 14, (o) Scenario 15, (p) Scenario 16, (q) Scenario 17, (r) Scenario 18, (s) Scenario 19, (t) Scenario 20, (u) Scenario 21, (v) Scenario 22, (w) Scenario 23, (x) Scenario 24, (y) Scenario 25, (z) Scenario 26, (aa) Scenario 27, and (ab) Scenario 28.
This strengthens the explanation that the plate resistance is not affected by the number of V-notches in a plate but rather by the position of the plate; V-notch defects in the area of stress concentration will drastically decrease the plate’s resistance capacity, reducing the reaction and penetration forces that can be applied. Figure 16a–d show a greater stress concentration in V-notch defects with smaller opening angles, resulting in faster cracking. Meanwhile, V-notch defects with larger opening angles can reduce the maximum stress as the V-notch end radius strain increases, making cracking take longer. This is also confirmed by the results of research by Liu et al. [17].
Figure 18 shows the notched bottom plate’s stress concentration and structural deformation after the final crack. The deformation of the plate structure is divided into two types. The first type can be seen in the scenario with one V-notch defect (Figure 18a–d) and three V-notch defects on the plate (Figure 18q–18ab). The numerical simulation results show that the plate with one V-notch defect and three V-notch defects on the center line of the stiffener plate tears right at the center line of the stiffener plate parallel to the penetration direction, after which the plate splits into two and bends simultaneously in the right direction in scenarios 1, 2, 18, 22, and 26 (Figure 18a, b, r, v, z) or bent in the opposite direction in scenarios 3, 4, 17, 19, 20, 21, 23, 24, 25, 27, 28 (Figure 18c, 18d, 18q, 18s, 18t, 18u, 18w, Figure 17x, 17y, 17aa, 17ab) before finally the bottom plate also cracked precisely at the joint area between the bottom plate and the stiffener plate. The second type can be seen in the scenario with two V-notch defects (scenarios 5–16); the plate with two V-notch failures first bends to the left, extending the tear at the V-notch end line on both the left and right sides of the plate center line. Then, the stiffener plate bends to the left, extending the tear as it folds to the left. This deformation occurs in Figure 18e–p. The longest tear is seen in scenarios 5–8 (Figure 17e–h), which have the closest notch spacing of 200 mm because the V-notch defect is close to the stress concentration in the penetration area.
5 Conclusion
The V-notch defect will obviously reduce the bearing capacity of the stiffened plate structure in the penetration of a grounding incident; the influence of the V-notch can be studied through the graph of reaction force, plate resistance, penetration depth, plate deformation, and stress concentration.
The significant decrease in plate resistance to penetration load is not affected by the number of V-notch defects in a plate but depends on the position of the V-notch defects on the plate. V-notches located at the penetration area (about 100 mm) from the center point of the bottom plate will significantly lower the plate’s resistance. The decrease in plate resistance to penetration load can be reduced by up to 34.4% of the plate resistance without a V-notch. The maximum reduction in reaction force that can be achieved when the V-notch is present is only 924.92 kN, while when the plate is without a V-notch, the reaction force reaches 1,410.4 kN. The penetration depth that can be provided when there are V-notches on the plate is only 130.05 mm, while when the plate is without V-notches, the penetration can be provided up to 170.29 mm, a reduction of 23.68%.
The maximum stress distribution is seen around the penetration area, about 100 mm from the center point of the bottom plate. The stiffener plate can be deformed in the form of a tear right at the centerline or bent and folded sideways, with the tear occurring at the end of the V-notch defect. For the base plate, deformations are in the form of cracks at the joint area between the bottom plate and the stiffener plate.
A reduction in structural strength in the bottom area of the ship increases the likelihood of hull breach, which can result in water ingress. This may lead to a loss of buoyancy, damage to the engine and electrical systems, failure of the propulsion system, and potential harm to the cargo.
Acknowledgments
The authors would like to express their gratitude to the Laboratory of Ship Material and Strength in the Department of Naval Architecture at Diponegoro University, Indonesia, for providing research resources and assistance with numerical simulations.
-
Funding information: The authors state no funding involved.
-
Author contributions: All contributors have acknowledged their responsibility for the complete content of this manuscript and have given their approval for its submission.
-
Conflict of interest: The authors state no conflict of interest.
-
Data availability statement: The data supporting this study will be made available upon reasonable request.
References
[1] Komite Nasional Keselamatan Transportasi. Transportasi KNKT. Laporan Investigasi. Accessed: Mar. 22, 2024. [Online]. http://knkt.dephub.go.id/knkt/ntsc_maritime/maritime_investigation_report1.htm.Search in Google Scholar
[2] EMSA Lisbon. EMSA: Annual overview of marine casualties and incidents 2022. Accidents. Accessed: Mar. 22, 2024. [Online]. https://safety4sea.com/emsa-annual-overview-of-marine-casualties-and-incidents-2022/#:∼:text=In%202021%2C%202%2C637%20marine,casualties%20between%202014%20and%202019.Search in Google Scholar
[3] Japan Transport Safety Board. Statistics of marine accidents. Accessed: Sep. 08, 2024. [Online]. https://www.mlit.go.jp/jtsb/statistics_mar.html.Search in Google Scholar
[4] Mursid O, Tuswan T, Samuel S, Trimulyono A, Yudo H, Huda N, et al. Effect of pitting corrosion position to the strength of ship bottom plate in grounding incident. Curved Layer Struct. Jan. 2023;10(1):1–12. 10.1515/cls-2022-0199.Search in Google Scholar
[5] Alsos HS, Amdahl J. On the resistance to penetration of stiffened plates, Part I – Experiments. Int J Impact Eng. Jun. 2009;36(6):799–807. 10.1016/J.IJIMPENG.2008.10.005.Search in Google Scholar
[6] Broek D. Elementary engineering fracture mechanics. Dordrecht: Springer Netherlands; 1982. 10.1007/978-94-011-9055-8.Search in Google Scholar
[7] National Research Council. Tanker spills: Prevention by design. Washington, DC: The National Academies Press; 1991. 10.17226/1621.Search in Google Scholar
[8] Simonsen BC. Mechanics of ship grounding. Lyngby, Denmark: Technical University of Denmark; 1997. Accessed: May 23, 2024. [Online]. http://www.ish.dtu.dk.Search in Google Scholar
[9] Biro Klasifikasi Indonesia. Rules for classification and construction. 2021. [Online]. www.bki.co.id.Search in Google Scholar
[10] Niklas K, Bera A, Garbatov Y. Impact of steel grade on a ship colliding with an offshore wind turbine monopile supporting structure. Ocean Eng. Nov. 2023;287:1–16. 10.1016/j.oceaneng.2023.115899.Search in Google Scholar
[11] Shen W, Chen Y, Li G, Lei J, Chen W, Qiu Y. Semi-empirical formulas on notch stress field and SIF of orthotropic V-shaped thin plate with initial crack under tensile-bending loads. Eng Fract Mech. Mar. 2023;281:109040. 10.1016/j.engfracmech.2022.109040.Search in Google Scholar
[12] Li Y, Song M. Method to calculate stress intensity factor of V-notch in bi-materials. Acta Mech Solida Sin. Aug. 2008;21(4):337–46. 10.1007/s10338-008-0840-3.Search in Google Scholar
[13] Agung P, Notch-stress and stress intensity factor analysis for fatigue assessment of gusset fillet welded joints. Institut Teknologi Sebelas Maret, Surabaya, 2016. Accessed: May 23, 2024. [Online]. https://repository.its.ac.id/74295/1/4114201003-Master_Thesis.pdf Search in Google Scholar
[14] Zappalorto M, Ricotta M. Effect of material orthotropy on the notch stress intensity factors of sharp V-notched plates under tension. Theor Appl Fract Mech. Dec. 2019;104:102375. 10.1016/J.TAFMEC.2019.102375.Search in Google Scholar
[15] Yi G, Yu T, Bui TQ, Tanaka S. Bi-material V-notched SIFs analysis by XFEM and conservative integral approach. Comput Struct. Feb. 2018;196:217–32. 10.1016/J.COMPSTRUC.2017.10.014.Search in Google Scholar
[16] Cai W, Zhou Z, Qian X, Cao D, Li S, Zhu L, et al. Numerical study on ductile failure behaviours of steel structures under quasi-static punch loading. J Mar Sci Eng. 2023;11(6):1197. 10.3390/jmse11061197.Search in Google Scholar
[17] Liu M, Gan Y, Hanaor D, Liu B, Chen C. An improved semi-analytical solution for stress at round-tip notches. Eng Fract Mech. Nov. 2015;149:134–43. 10.1016/j.engfracmech.2015.10.004.Search in Google Scholar
[18] Bestari M, Setyawan D, Misbach M. Analisa SCF (Stress Concentration Factor) Menggunakan Pendekatan Numerik Pada Pelat dengan Fillet Asimetris Akibat Beban Tarik. J Teknik ITS. Aug. 2021;10:1–6. 10.12962/j23373539.v10i1.59243.Search in Google Scholar
[19] Naar H, Kujala P, Simonsen BC, Ludolphy H. Comparison of the crashworthiness of various bottom and side structures. Mar Struct. Dec. 2001;15(4):443–60. 10.1016/S0951-8339(02)00012-6.Search in Google Scholar
[20] Samuelides MS, Amdahl J, Dow R. Studies on the behaviour of bottom structures during grounding. Adv Mar Struct. Mar. 2007;1:12–4. Accessed: May 18, 2024. [Online]. https://repository.tudelft.nl/record/uuid:ae37cc16-3467-42b5-a98f-4ce64ddd7120.Search in Google Scholar
[21] Alsos HS, Amdahl J, Hopperstad OS. On the resistance to penetration of stiffened plates, Part II: Numerical analysis. Int J Impact Eng. Jul. 2009;36(7):875–87. 10.1016/J.IJIMPENG.2008.11.004.Search in Google Scholar
[22] Adietya BA, Windyandari A, Zakki AF. The study on stability and seakeeping characteristics of the glass bottom boat trimaran in Karimunjawa Island. In IOP Conference Series: Earth and Environmental Science. Institute of Physics Publishing; Mar. 2018. 10.1088/1755-1315/135/1/012007.Search in Google Scholar
[23] Chrismianto D, Zakki AF, Arswendo B, Abdilla I, Abar C. Comparison of propeller type B-series and Au-outline gawn series for improving on submarine propulsion performance using Cfd. Int J Adv Res Eng Technol (IJARET). Apr. 2019;10(2):647–51. [Online]. http://iaeme.com/Home/journal/IJARET647editor@iaeme.comhttp://iaeme.com/Home/issue/IJARET?Volume=10&Issue=2http://iaeme.com.10.34218/IJARET.10.2.2019.061Search in Google Scholar
[24] Shi Z, Gao Z, Wang W, Zheng Z. Multi-degree-of-freedom motions and effect on rolling dynamics of damaged ship in oblique waves. Ocean Eng. Dec. 2024;313:119518. 10.1016/J.OCEANENG.2024.119518.Search in Google Scholar
[25] Ramadhan A, Mulyatno PI, Yudo H. Analisa Kekuatan Konstruksi Double Bottom Pada Frame 46 Sampai Frame 50 Akibat Perubahan Dari Single Hull Ke Double Hull Pada Kapal Tanker 13944 Ltdw Dengan Metode Elemen Hingga. J Teknik Perkapalan. Oct. 2016;4(4):858–67. Accessed: May 23, 2024. [Online]. https://ejournal3.undip.ac.id/index.php/naval/article/view/14797.Search in Google Scholar
[26] Manik P, Yudo H, Arswendo B. Laminated from combination of apus bamboo and meranti wood as an alternative material component in timber shipbuilding. Int J Civ Eng Technol (IJCIET). 2018;9(7):1800–11.Search in Google Scholar
[27] Eurocode Applied. Table of design material properties for structure steel. Accessed: Sep. 08, 2024. [Online]. https://eurocodeapplied.com/design/en1993/steel-design-properties.Search in Google Scholar
[28] Cowper G, Symonds PS. Strain-hardening and strain-rate effects in the impact loading of cantilever beams. 1957. [Online]. https://api.semanticscholar.org/CorpusID:135389032.10.21236/AD0144762Search in Google Scholar
[29] Logan DL. A first course in the finite element method. 6th edn. Canada: Thomson; 2007. Accessed: May 18, 2024. [Online]. https://www.cengage.com/c/a-first-course-in-the-finite-element-method-6e-logan/9781305635111/.Search in Google Scholar
[30] Hallquist J, LS-Dyna Theory Manual, 3. Livermore: Livermore Software Technology Corp., 2006. Accessed: Aug. 23, 2024. [Online]. https://www.scirp.org/reference/referencespapers?referenceid=1482411.Search in Google Scholar
[31] Wang ED, Bone S, Ma M, Dinovitzer MA. Guidelines for evaluation of marine finite element analyses. 1st edn. Canada: Ship Structure Committee; 2019. Accessed: May 18, 2024. [Online]. http://shipstructure.org/.Search in Google Scholar
© 2025 the author(s), published by De Gruyter
This work is licensed under the Creative Commons Attribution 4.0 International License.
Articles in the same Issue
- Research Articles
- Layerwise generalized formulation solved via a boundary discontinuous method for multilayered structures. Part 1: Plates
- Thermoelastic interactions in functionally graded materials without energy dissipation
- Layerwise generalized formulation solved via boundary discontinuous method for multilayered structures. Part 2: Shells
- Visual scripting approach for structural safety assessment of masonry walls
- Nonlinear analysis of generalized thermoelastic interaction in unbounded thermoelastic media
- Study of heat transfer through functionally graded material fins using analytical and numerical investigations
- Analysis of magneto-aerothermal load effects on variable nonlocal dynamics of functionally graded nanobeams using Bernstein polynomials
- Effective thickness of gallium arsenide on the transverse electric and transverse magnetic modes
- Investigating the behavior of above-ground concrete tanks under the blast load regarding the fluid-structure interaction
- Numerical study on the effect of V-notch on the penetration of grounding incidents in stiffened plates
- Thermo-elastic analysis of curved beam made of functionally graded material with variable parameters
- Effect of curved geometrical aspects of Savonius rotor on turbine performance using factorial design analysis
- A mechanical and microstructural investigation of friction stir processed AZ31B Mg alloy-SiC composites
- Mechanical design of engineered-curved patrol boat hull based on the geometric parameters and hydrodynamic criteria
- Analysis of functionally graded porous plates using an enhanced MITC3+ element with in-plane strain correction
- Review Article
- Technological developments of amphibious aircraft designs: Research milestone and current achievement
- Special Issue: TS-IMSM 2024
- Influence of propeller shaft angles on the speed performance of composite fishing boats
- Design optimization of Bakelite support for LNG ISO tank 40 ft using finite element analysis
- The topology optimization applied to the evaluation study of bracket caliper by using finite element method