Mechanical design of engineered-curved patrol boat hull based on the geometric parameters and hydrodynamic criteria
-
Aria Pranata

 ,
Jung Min Sohn
,
Tuswan Tuswan
,
Rahimuddin Samad
,
Martin Jurkovič
,
Oleksiy Melnyk
,
Teguh Muttaqie
and
Nurul Muhayat
,
Jung Min Sohn
,
Tuswan Tuswan
,
Rahimuddin Samad
,
Martin Jurkovič
,
Oleksiy Melnyk
,
Teguh Muttaqie
and
Nurul Muhayat

Abstract
This comprehensive study meticulously analyzes the hydrodynamic performance of various patrol boat designs to enhance maritime security in the Arafura Sea, Indonesia. We evaluated three hull types – monohull, catamaran, and trimaran – based on resistance, stability, seakeeping, and passenger comfort. The study generated nine hull variations using regression analysis. The multi-attribute decision making method and sensitivity analysis were applied to determine the optimal design. The results, a testament to our thorough approach, showed that Catamaran Hull C had the best performance, with the lowest resistance, better stability, and improved seakeeping characteristics. This design is recommended for patrol operations in the Arafura Sea, supporting maritime security and the achievement of the Sustainable Development Goals.
1 Introduction
The introduction provides a comprehensive background and rationale for this research, outlining the importance of maritime security in the Arafura Sea and the relevance of patrol boat hull design. As an archipelagic country, Indonesia possesses vast water territories which is rich with natural resources. The Arafura Sea, located in the eastern part of Indonesia, is one such region abundant in marine resources, but it is frequently targeted by illegal activities such as illegal fishing, drug smuggling, and various other security threats [1,2]. According to a report by Indonesia’s National Narcotics Agency (BNN), the majority of drug smuggling into Indonesia is still carried out via maritime routes, accounting for up to 80% of the total cases [3]. This indicates that the Arafura Sea has become one of the primary corridors for narcotics trafficking into the country. The annual drug smuggling cases recorded by BNN RI are shown in Figure 1 [4].
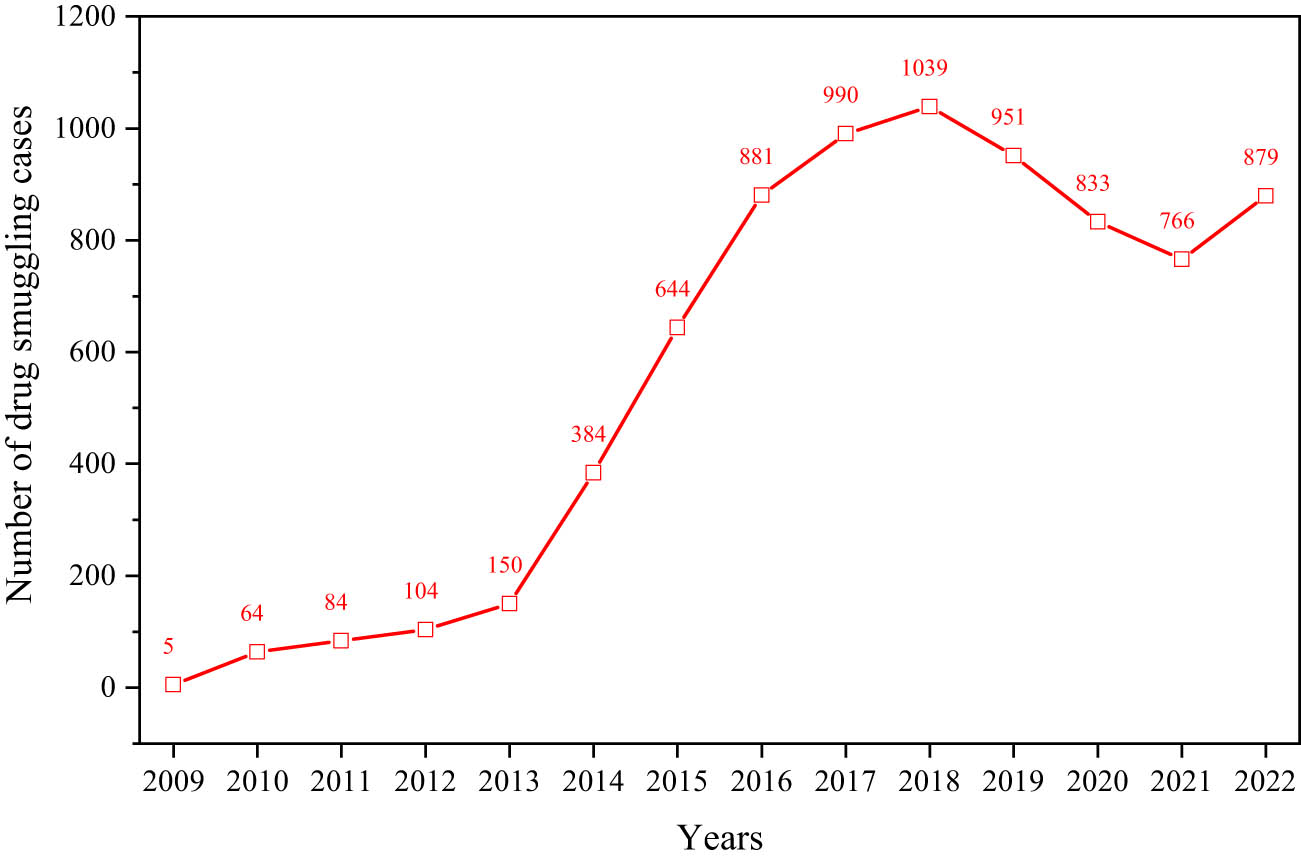
Number of drug smuggling cases per year.
Additionally, illegal fishing poses a significant threat to the Arafura Sea. This practice not only results in significant economic losses for the country but also has detrimental effects on the environment and the sustainability of marine resources. The National Development Planning Agency (Bappenas) has recorded economic losses due to illegal fishing in the Arafura Sea, which amount to approximately 40 trillion Rupiah annually. Moreover, illegal fishing threatens the sustainability of marine resources, which are the primary livelihood for coastal communities [2]. To maintain national sovereignty and protect the maritime wealth in this area, patrol boats that can operate optimally under the challenging hydrodynamic conditions of these waters are essential [5]. The Arafura Sea, the focus of this study, is one of Indonesia’s strategic maritime areas.
In addition to safeguarding security and sovereignty, patrol boats also play a crucial role in supporting the achievement of the Sustainable Development Goals (SDGs). Practical patrol boats can contribute to SDG 14, Life Below Water, which aims to conserve and sustainably use marine resources [6]. By monitoring and preventing illegal activities, patrol boats help protect marine ecosystems and ensure that marine resources are used sustainably for future generations. Furthermore, by preventing drug smuggling and other illegal activities, patrol boats also support SDG 16, Peace, Justice, and Strong Institutions, which aims to reduce crime and strengthen the rule of law [7].
This study analyzes the hydrodynamic performance of various patrol boat hull designs intended for operation in the Arafura Sea. The research investigates the effects of different hull sizes and types on the patrol boat’s hydrodynamic performance, including monohull, catamaran, and trimaran designs. This includes resistance, stability, motion sickness incidence (MSI), floodable length, and other hydrodynamic factors. These variables are analyzed through simulations to determine the most effective and efficient patrol boat design for this region [8].
The results of this study are expected to provide recommendations on the most suitable patrol boat design for the Arafura Sea, taking into account various aspects of hydrodynamic performance [9]. The proposed patrol boat design is anticipated to enhance security and operational effectiveness and provide an optimal solution for protecting natural resources in the region, which aligns with the SDGs.
2 Literature review
The literature review section examines relevant literature on existing hull design studies, including geometric modeling of curved hulls, regression, resistance simulation, stability simulation, seakeeping simulations, floodable length simulation, multi-attribute decision-making, and sensitivity analysis.
2.1 Geometric modeling of curved hull design
The geometric representation of an ellipse is conventionally expressed through the implicit Eq. (1) [10].
where
![Figure 2
The plot of an ellipse [10].](/document/doi/10.1515/cls-2025-0041/asset/graphic/j_cls-2025-0041_fig_002.jpg)
The plot of an ellipse [10].
This transformation permits the numerical rendering of the ellipse, such as in MATLAB, where the coordinates can be computed and visualized efficiently.
The concept of curvature is central to understanding the geometry of curves. It quantifies the extent to which a curve bends at a particular point [11]. For a curve passing through three successive points,
![Figure 3
An illustration of curvature. The illustration is drawn based on data in [10].](/document/doi/10.1515/cls-2025-0041/asset/graphic/j_cls-2025-0041_fig_003.jpg)
An illustration of curvature. The illustration is drawn based on data in [10].
This definition captures the localized angular deviation of the curve per unit length. When an explicit function defines a curve
This equation demonstrates that curvature increases with the second derivative of the function, implying sharper bending. For a circle, which has a constant radius
Bézier curves are a class of parametric curves extensively used in computer-aided geometric design (CAGD), computer graphics, and hull form modeling due to their intuitive control and smooth shape representation. Introduced by Pierre Bézier in the 1960s for automobile body design at Renault, these curves have since become a foundational tool for modeling smooth and visually appealing curves in both two and three dimensions [13]. The general form of a Bézier curve of degree n is shown in Eqs. (5)–(7).
where the blending function is
and
![Figure 4
Combining two cubic Bézier splines [10].](/document/doi/10.1515/cls-2025-0041/asset/graphic/j_cls-2025-0041_fig_004.jpg)
Combining two cubic Bézier splines [10].
Surfaces in three-dimensional space are often described using implicit equations of the form
In computational graphics, however, the most effective and widely adopted approach involves parametric surface representations [15]. In this format, the coordinates
This parametric representation allows for the efficient and flexible modeling of complex surfaces [16]. A wireframe view of a surface is shown in Figure 5. For instance, the upper half of an ellipsoid can be represented parametrically as
![Figure 5
The u and w nets on a parametric ellipsoidal surface [10].](/document/doi/10.1515/cls-2025-0041/asset/graphic/j_cls-2025-0041_fig_005.jpg)
The u and w nets on a parametric ellipsoidal surface [10].
Mathematical modeling of hulls has long been integral to naval architecture. Chapman pioneered early analytical approaches using parabola-based expressions for waterlines and sections [13]. His formulations are shown in Eqs. (10) and (11).
and
Further advancements were made by David Watson Taylor in the early twentieth century, who employed fifth-degree polynomials to improve the accuracy of hull shape representation. These mathematical formulations allow naval architects to model hull forms with high precision and repeatability [14]. In modern applications, B-splines and Non-uniform rational B-splines are widely utilized due to their flexibility and smoothness in modeling complex surfaces [13].
Fairing is refining the geometry of hull lines to ensure smooth and continuous curves across the hull surface. The primary objective is to eliminate irregularities affecting hydrodynamic performance or visual aesthetics. Historically, this process was performed manually by skilled designers, but the advent of digital computing has significantly enhanced its practicality and efficiency [16]. Early computational methods used finite differences and plotting of first and second offsets to detect and correct unfair segments [10]. More recently, software packages such as FORAN, Maxsurf, and MultiSurf have enabled the interactive visualization and manipulation of hull curves using advanced algorithms. These tools often incorporate mathematical techniques such as B-spline curve smoothing and parametric modeling to facilitate fairing [13]. Fairing ensures structural and hydrodynamic integrity and manufacturing consistency by preventing abrupt curvature changes, which are crucial for accurate plate forming and welding processes.
2.2 Regression
In this study, the linear regression method was employed to establish relationships between the primary dimensions of the patrol boat, following a standard linear relationship. This linear regression analysis achieved 99.474% accuracy in predicting the reference boat’s main dimensions and proved to be more efficient than scaling and other reference methods, with a shorter processing time [17]. The regression equation used is expressed in the form shown in Eqs. (12)–(16).
where y is the dependent variable, x is the independent variable,
This regression analysis generated three variations in the size of the patrol boat. These size variations were combined with three hull types: monohull, catamaran, and trimaran, resulting in a total of nine hull variations. Once the prototype modeling was completed, analyses of resistance, wave pattern, stability, seakeeping, and floodable length were conducted to evaluate the hydrodynamic performance of each model [18]. This analysis was used to assess the hull’s motion response to sea conditions and the passengers’ susceptibility to seasickness during navigation [19]. The environmental parameter data for the Arafura Sea, obtained from meteorology, climatology, and geophysical agency (Badan Meteorologi, Klimatologi, dan Geofisika-BMKG), is presented in Table 1 [20].
Environmental parameter data for the Arafura Sea
| Parameter | Value |
|---|---|
| Water density | 1,022 kg/m3 |
| Wind speed | 12.96 m/s |
| Wave height | 1.28 m |
In this study, the effects of propulsion type and hull construction were excluded from consideration, as the focus was on analyzing the hydrodynamic characteristics of the hull by examining the vessel’s movement in water related to resistance and hull form.
2.3 Resistance simulation
The hull resistance analysis was conducted using the Savitsky method, which is widely employed to calculate the wetted surface, center of pressure, drag, and resistance in planing hulls under steady-state conditions without acceleration in any direction [13,14]. The resistance analysis was conducted over a speed range of 15–50 knots, yielding graphs that illustrate the relationship between speed, hull resistance, and required power. This analysis aims to identify the design model with the lowest resistance and power requirements. Forces acting on a planing hull are shown in Figure 6. The Savitsky method equation is shown in Eqs. (17)–(20) [21,22].
where D is the total resistance, Δ is the total displacement force,
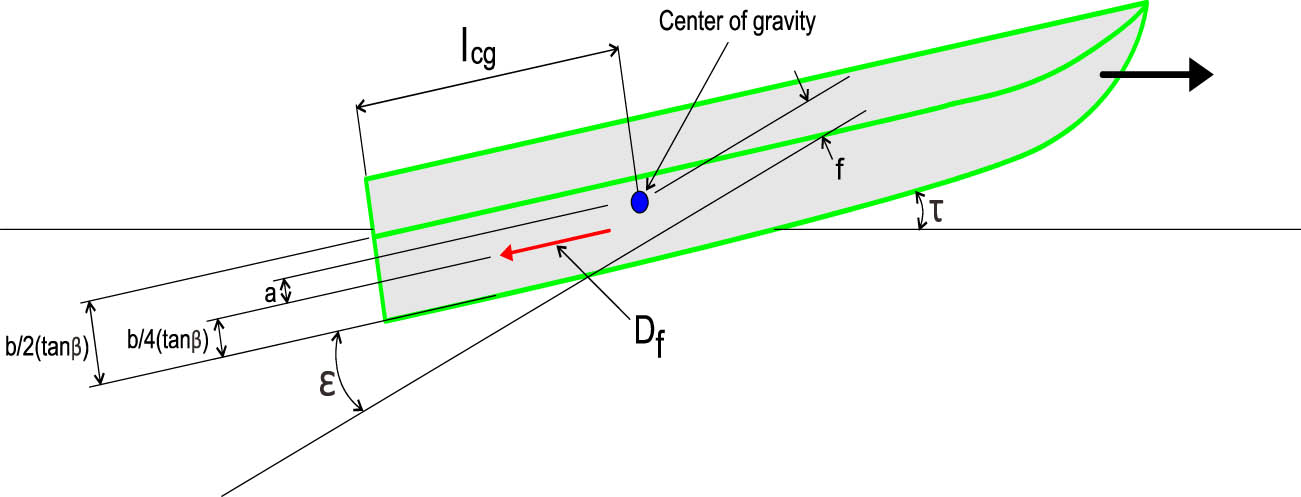
Diagram of forces acting on a planing hull.
2.4 Stability simulation
The hull stability assessment considered a heel angle range of 0–180°. The large-angle stability method was used, with the load case set to free trim [23]. The simulation results produced righting lever (GZ) curves that indicate the hull’s stability in a static condition [24]. This analysis was used to determine the design model with the best stability. According to International Maritime Organization (IMO) standards, the hull’s maximum righting lever occurs at a heel angle of at least 25°, as shown in Eq. (21). The righting lever is calculated using Eqs. (22)–(25), which incorporate the residual stability lever. Essential points in hull stability are shown in Figure 7.
where θ s the angle of heel, GZ is the righting lever, M 0 S is the residual stability lever, G 0 M is the metacentric height, Δ is the displacement.
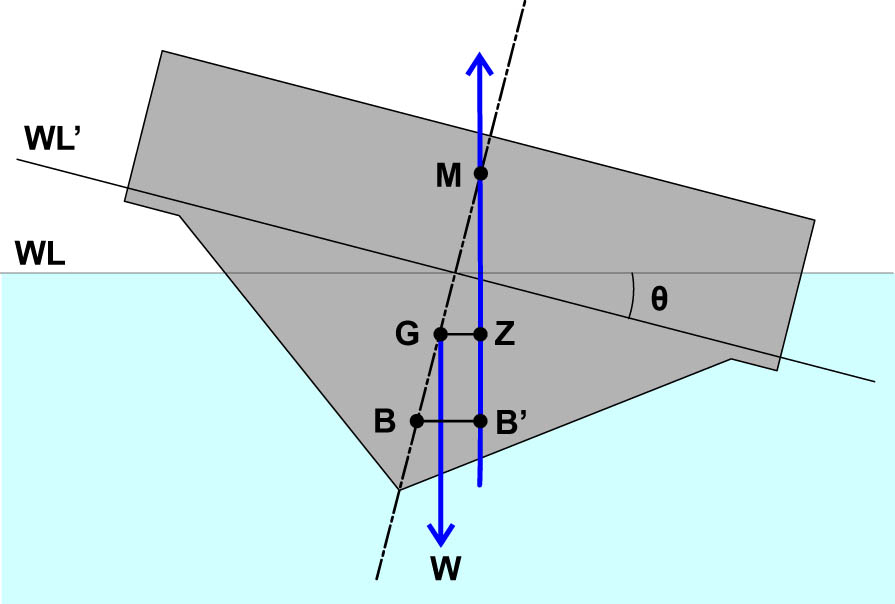
Essential points in hull stability.
2.5 Seakeeping simulations
Seakeeping simulations were performed to analyze the hull’s movement. The strip theory method was applied, with variations in wave direction of 90° (beam sea), 135° (bow quartering), and 180° (head sea). The wave spectrum used was JONSWAP, which corresponds to the conditions of the Arafura Sea. The simulation results included response amplitude operator (RAO) graphs for heaving, rolling, pitching, and MSI. Heave motion refers to the vertical movement of a hull along the Z-axis due to the impact of waves, which can pose risks to safety and operational efficiency. This motion can be determined using Eq. (26). Six degrees of freedom on the hull design are shown in Figure 8.
where
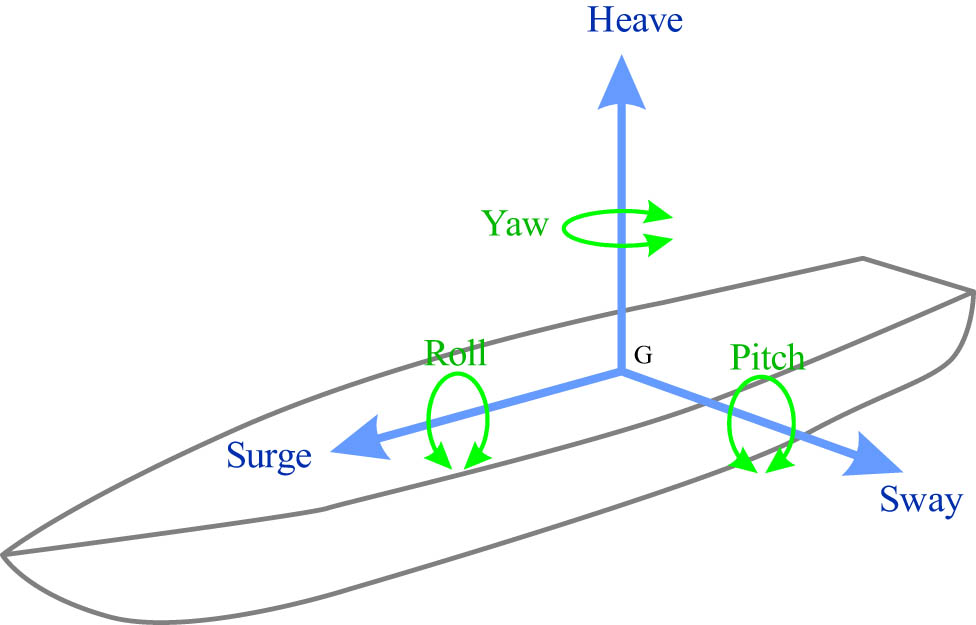
Six degrees of freedom on the hull design.
Roll motion, along the X-axis, is induced by waves hitting the sides of the hull, which affects stability, passenger comfort, and navigational safety. This is modeled by Eq. (27).
where
where
Additionally, MSI quantifies the likelihood of passengers experiencing seasickness due to wave reflections, calculated via Eq. (29).
where
2.6 Floodable length simulation
The floodable length simulation is a crucial tool used to determine the maximum permissible length of a flooded compartment to ensure vessel safety. The floodable length can be calculated using linear interpolation, as shown in Eq. (30). The calculation of the total involves adding the floodable length from the aft section to the afterpeak and from the forward section to the forepeak, following the formulas provided in Eqs. (31) and (32). The floodable length illustration is shown in Figure 9.
where
Schematic diagram of the floodable length.
2.7 Multi-attribute decision making (MADM)
Following the simulations, statistical analysis was conducted to assess the impact of variations in hull dimensions and hull types on the vessel’s hydrodynamic performance. The appropriate method for evaluating alternative designs was MADM using the Simple Additive Weighting (SAW) method and sensitivity analysis. This calculation aimed to assess the influence of the hull’s main dimensions on hull type variations and their effect on hydrodynamic performance [25‒27].
Each model was evaluated to determine the most optimal patrol boat design using the MADM method. MADM involves evaluating several attributes or alternative criteria. One of the most common MADM methods is the SAW method, which is widely used due to its straightforward approach. In SAW, the total performance ratings for each alternative are calculated by applying weighting factors to various attributes. The decision matrix, which contains the criteria values, is normalized to ensure that comparisons across alternatives are valid. The normalization process follows Eqs. (33)–(37), and the preference value of each alternative is subsequently determined using Eq. (38).
where
2.8 Sensitivity analysis
Following this, a sensitivity analysis was performed to assess the impact of input variables on each tested variation [18,19]. The relationship between the independent variables and the dependent variable is expressed through the linear regression model in Eq. (4). The model’s fit is evaluated using the R Squared value, which measures the proportion of variance in the dependent variable explained by the independent variables. The formula for R 2 is provided in Eqs. (39)–(43).
where y is the dependent variable, x is the independent variable,
3 Methodology
This section describes the methodology used in this study to evaluate the hydrodynamic performance of various patrol boat hull designs. The methodological framework adopted in this study represents a significant integration and advancement of prior approaches extensively utilized in the design of high-speed vessels and patrol boats. While Ghazali et al. provided a crucial foundation by delineating the fundamental considerations for hull form selection (monohull, catamaran, trimaran) concerning stability and hydrodynamics, their work did not incorporate quantitative decision-making methodologies; our research progresses beyond this by employing the SAW method to integrate diverse performance criteria and ascertain the optimal design objectively [28]. Conversely, Tavakoli et al. offered an in-depth exploration of planing hull hydrodynamics, primarily focusing on simulation-based approaches for monohulls without incorporating geometric regression or multi-hull evaluations; our methodology expands this scope considerably by systematically assessing nine distinct hull geometric variations and applying linear regression to key parameters (Length Overall (LOA), Beam, Draft) to facilitate a data-driven design process [29]. From a structural perspective, Han et al. elucidated ISO standards pertinent to composite material design, yet their analysis did not extend to the operational efficiency of hull forms; this study addresses that gap by synergistically combining critical safety aspects, such as floodable length analysis, with dynamic vessel performance, thus establishing a more holistic evaluation framework [30]. Furthermore, the comparative resistance calculation methodologies, as presented by Bahatmaka et al. through the comparison of Holtrop and Savitsky methods, served as a foundational inspiration for the comparative approach within this study, which we have subsequently broadened to encompass a broader spectrum of performance parameters, including stability, seakeeping, and MSI [31]. Finally, the investigation into flat-sided hull geometries by Windyandari et al. acted as a catalyst for our exploration of more complex, engineered-curved hull designs, while rigorously maintaining a focus on achieving superior operational efficiency and reliability [32]. In summary, the methodology employed herein not only synthesizes the strengths derived from previous scholarly works but also pioneers a more integrated and highly applicable approach tailored to the demanding requirements of high-speed patrol boat design in dynamic maritime regions.
The research methodology employed in this study encompasses data collection, processing, design, simulation, and analysis. A patrol boat was the primary reference during the data collection phase. The critical parameters obtained include Length Overall (LOA), beam (B), depth (D), draft, and displacement [33]. Subsequently, regression analysis was conducted on the reference data to determine the main dimensions of the patrol boat, using the relationships between LOA, beam, depth, and displacement [34]. The aim of this study is to optimize the hull design based on hydrodynamic characteristics. The flowchart of this research is shown in Figure 10.
Flowchart of the current methodology.
3.1 Design references
This study used patrol boats with an LOA between 18 and 20 m as references. The reference vessels utilized in this research are presented in Table 2.
Hull design references
| Hull references | LOA (m) | Beam (m) | Depth (m) | Draft (m) | Displacement (ton) |
|---|---|---|---|---|---|
| X19 Combat Boat | 19.40 | 4.25 | 1.96 | 0.85 | 17.50 |
| Damen Stand Patrol 1905 FRP | 19.30 | 4.80 | 2.10 | 1.10 | 33.80 |
| Marsun M18-S Fast Assault Boat | 18.30 | 4.40 | 1.94 | 0.80 | 16.69 |
| Kewatec Fast Patrol 1850 | 18.50 | 4.20 | 2.49 | 0.92 | 16.92 |
| KingTough 19.5 m FPB | 19.50 | 4.58 | 2.74 | 1.00 | 29.00 |
3.2 Regression variations
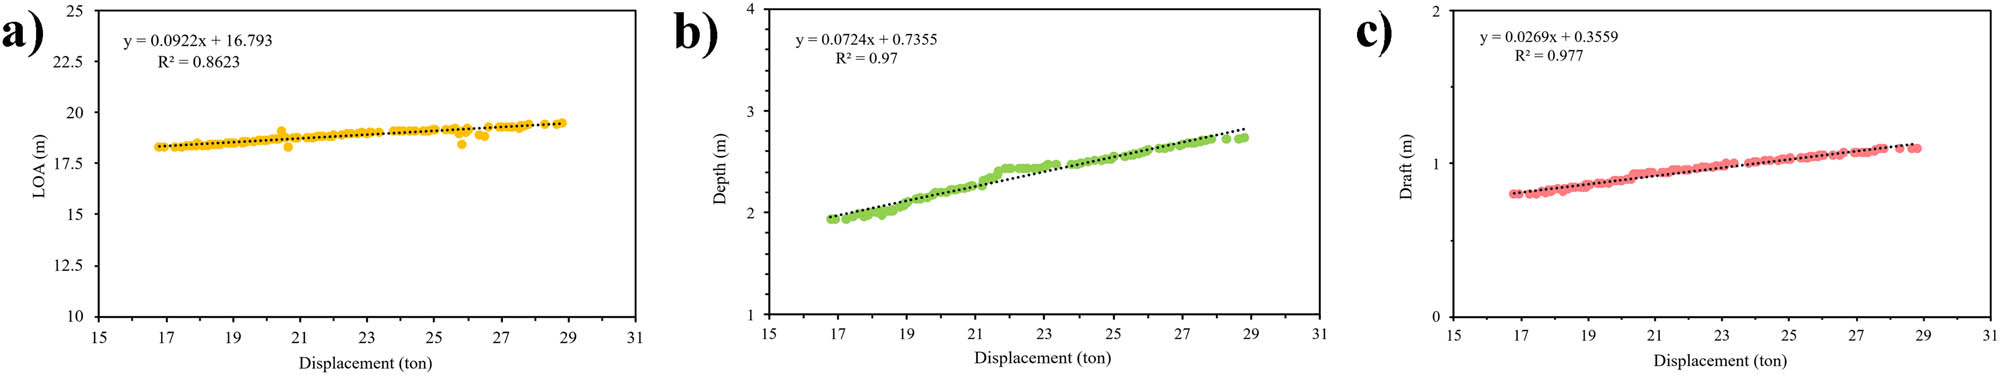
The main dimensions of the patrol boat were determined using a linear regression approach based on five reference vessels. This study used displacement as the independent variable, while LOA, beam, depth, and draft were considered as dependent variables. The relationship between these variables is represented by a straight-line curve that approximates the causal relationship [35,36,37,38,39,40]. The regression graph from the five reference vessels is shown in Figure 11. The linear equation was used to form the dependent variables based on the linear regression analysis. The study utilized a target displacement value of 22.78 tons derived from the average displacement of the five reference vessels. Calculations were then performed to obtain the Y value, using the target displacement as the X value [9]. The regression results for the main dimensions are presented in Table 3.
Regression results: (a) LOA vs displacement; (b) beam vs displacement; (c) depth vs displacement; and (d) draft vs displacement.
Dimension of regression results
| Parameter | Value |
|---|---|
| LOA (m) | 18.87 |
| Beam (m) | 4.48 |
| Depth (m) | 2.33 |
| Draft (m) | 0.94 |
| Displacement (ton) | 22.78 |
This study also evaluated the influence of hydrodynamic characteristics on variations in dimension sizes and hull types. Additional regression analysis was conducted to obtain three variations in the main dimensions. These variations were derived by locking one of the three dependent variables: displacement with LOA, displacement with beam, and displacement with draft. One of these variables was kept constant, while the others were regressed again. The regression results for the first variation, locking LOA with displacement, are shown in Figure 12. The results for the second variation, locking beam with displacement, are shown in Figure 13. Finally, the results for the third variation, locking depth with displacement, are shown in Figure 14. The summarized dimensions for Variations A, B, and C are presented in Table 4.
Regression result for Variation A with the locking of the LOA with displacement: (a) Beam vs displacement; (b) depth vs displacement; and (c) draft vs displacement.
Regression result for Variation B with the locking of the beam with displacement: (a) LOA vs displacement; (b) depth vs displacement; and (c) draft vs displacement.
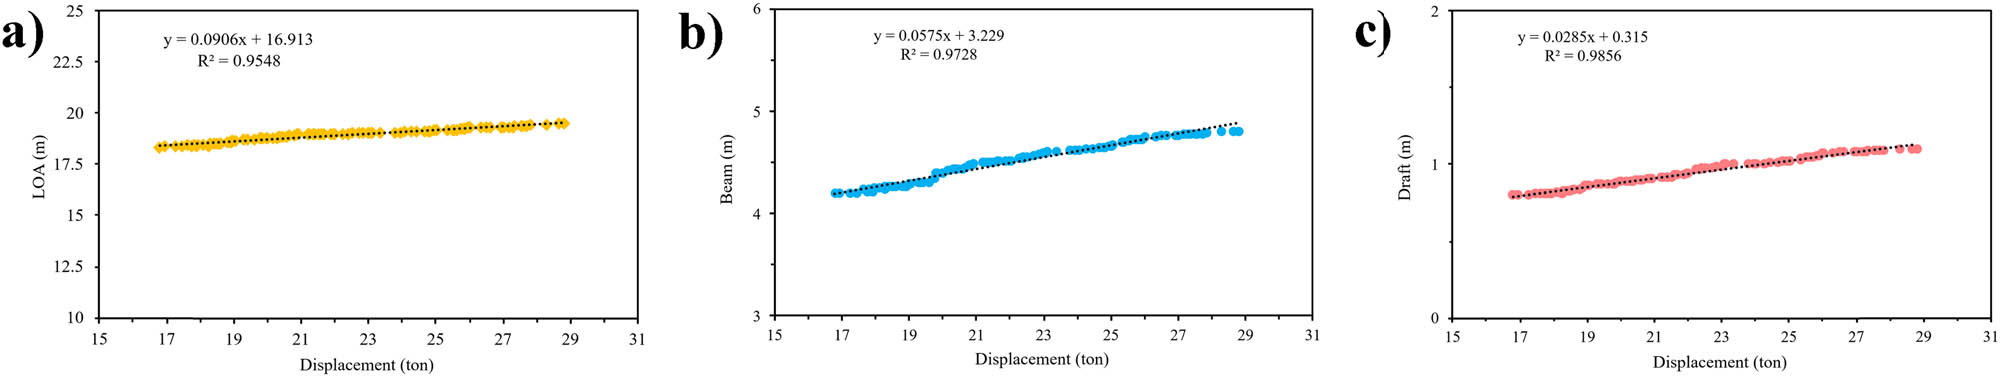
Regression result for Variation C with the locking of the depth with displacement: (a) LOA vs displacement; (b) beam vs displacement; and (c) depth vs displacement.
3.3 Simulation analysis
After the design process, simulations were conducted to evaluate the hydrodynamic characteristics of each model. There are nine models, each with three size variations and three hull type variations. The simulations in this study include resistance, stability, and seakeeping for each model. Additionally, the authors considered the environmental conditions of the Arafura Sea, using data provided by BMKG as a parameter.
4 Results and discussion
This section comprehensively presents and discusses the key findings obtained from the hydrodynamic analysis and multi-criteria evaluation of the nine proposed patrol boat hull design variations. Furthermore, this section also compares the performance of different hull types and provides an in-depth interpretation of the practical implications of these results.
4.1 Resistance simulations
The resistance analysis was conducted to determine the resistance and power requirements for nine variations of hull designs. The resistance and power analysis results for the nine hull variations are presented in Tables 5 and 6, while the graphs depicting the relationship between speed, resistance, and power are shown in Figure 15.
Resistance results of nine variations of the hull design
| Speed (knots) | Resistance (kN) | ||||||||
|---|---|---|---|---|---|---|---|---|---|
| Monohull A | Monohull B | Monohull C | Catamaran Hull A | Catamaran Hull B | Catamaran Hull C | Trimaran Hull A | Trimaran Hull B | Trimaran Hull C | |
| 15 | 15.3 | 15.5 | 15.2 | 26.4 | 21 | 21.1 | 21.2 | 23.5 | 23.6 |
| 20 | 21.3 | 21.6 | 21.2 | 35.8 | 30.1 | 30.3 | 30.1 | 32.6 | 32.7 |
| 25 | 27.9 | 28.1 | 27.8 | 43.2 | 39.4 | 39.7 | 38.9 | 40.5 | 40.8 |
| 30 | 34.4 | 34.5 | 34.3 | 48.5 | 47.9 | 48.5 | 46.7 | 46.9 | 47.2 |
| 35 | 40.5 | 40.4 | 40.3 | 53.3 | 56 | 56.8 | 54 | 52.8 | 53.2 |
| 40 | 46.2 | 45.8 | 46 | 58.7 | 64.3 | 65.4 | 61.8 | 59.3 | 59.8 |
| 45 | 52 | 51.4 | 51.7 | 65.2 | 73.4 | 74.7 | 70.4 | 66.7 | 67.4 |
| 50 | 58.1 | 57.4 | 57.9 | 72.7 | 83.5 | 85.1 | 80 | 75.3 | 76.1 |
Power results of nine variations in the hull design
| Speed (knots) | Power (kW) | ||||||||
|---|---|---|---|---|---|---|---|---|---|
| Monohull A | Monohull B | Monohull C | Catamaran Hull A | Catamaran Hull B | Catamaran Hull C | Trimaran Hull A | Trimaran Hull B | Trimaran Hull C | |
| 15 | 147.284 | 149.839 | 146.401 | 254.3 | 202.522 | 203.122 | 204.76 | 227.148 | 227.807 |
| 20 | 273.847 | 277.218 | 272.459 | 460.494 | 387.024 | 389.519 | 387.184 | 418.773 | 420.514 |
| 25 | 448.312 | 451.692 | 446.132 | 695.132 | 633.052 | 638.857 | 624.876 | 651.831 | 655.147 |
| 30 | 664.184 | 665.493 | 660.824 | 934.933 | 924.796 | 935.970 | 900.099 | 904.145 | 909.846 |
| 35 | 911.610 | 908.178 | 906.848 | 1199.276 | 1260.194 | 1278.731 | 1215.474 | 1188.179 | 1197.248 |
| 40 | 1188.612 | 1179.116 | 1182.615 | 1511.022 | 1653.877 | 1681.547 | 1588.369 | 1524.978 | 1538.44 |
| 45 | 1503.411 | 1487.844 | 1496.57 | 1886.621 | 2123.224 | 2161.882 | 2035.984 | 1931.247 | 1950.181 |
| 50 | 1867.554 | 1846.237 | 1860.262 | 2338.26 | 2683.175 | 2734.88 | 2572.423 | 2419.846 | 2445.407 |
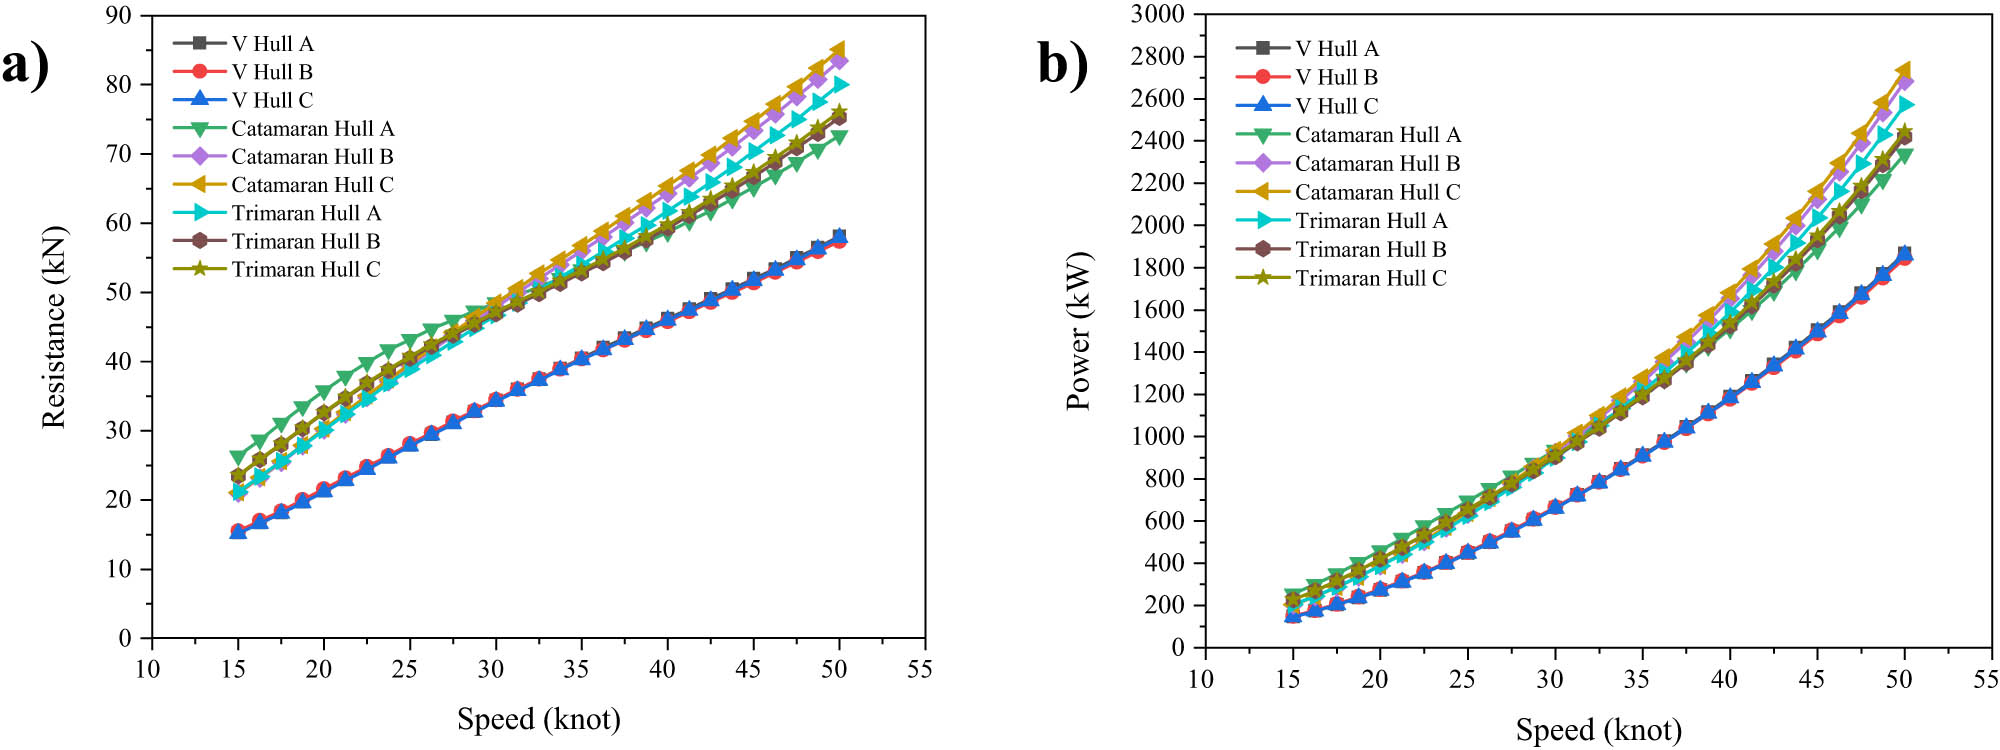
Resistance simulations of of nine variations in the hull design: (a) speed vs resistance; and (b) speed vs power.
The resistance simulations, as presented in Tables 4 and 5, reveal that variations in dimensions with the exact hull type yield nearly identical resistance and power values. The model with the lowest resistance was Monohull C, registering 34.300 kN at 30 knots. In contrast, the highest resistance was observed in Catamaran Hull C, with 48.500 kN at the same speed. Furthermore, the power requirement results show that Monohull C had the lowest power demand, 660.824 kW at 30 knots. At the same time, Catamaran Hull C exhibited the highest power demand, 935.970 kW at 30 knots. These findings demonstrate a clear trend: resistance and power requirements also rise as the vessel’s speed increases.
Recapitulation of the dimension using the regression method
| Parameter | Variation 1 | Variation 2 | Variation 3 |
|---|---|---|---|
| LOA (m) | 18.92 | 18.89 | 18.98 |
| Beam (m) | 4.52 | 4.51 | 4.54 |
| Depth (m) | 2.37 | 2.39 | 2.36 |
| Draft (m) | 0.97 | 0.97 | 0.96 |
| Displacement (ton) | 22.78 | 22.78 | 22.78 |
4.2 Wave pattern analysis
Following the resistance simulations, a wave pattern analysis was performed. When the hull encounters resistance, wave patterns form as a response to the hull’s shape and movement through the water. Larger waves generated by the hull indicate a higher energy demand to sustain movement, which in turn reduces the vessel’s operational efficiency [41,42,43,44,45,46]. Understanding the impact of hull type on wave formation and resistance is essential. More significant fluctuations in wave patterns suggest that the hull produces significant waves, thereby consuming more energy. Conversely, minimal fluctuations imply low wave resistance and more efficient energy usage. The wave pattern graphs resulting from the resistance simulations are depicted in Figure 16.
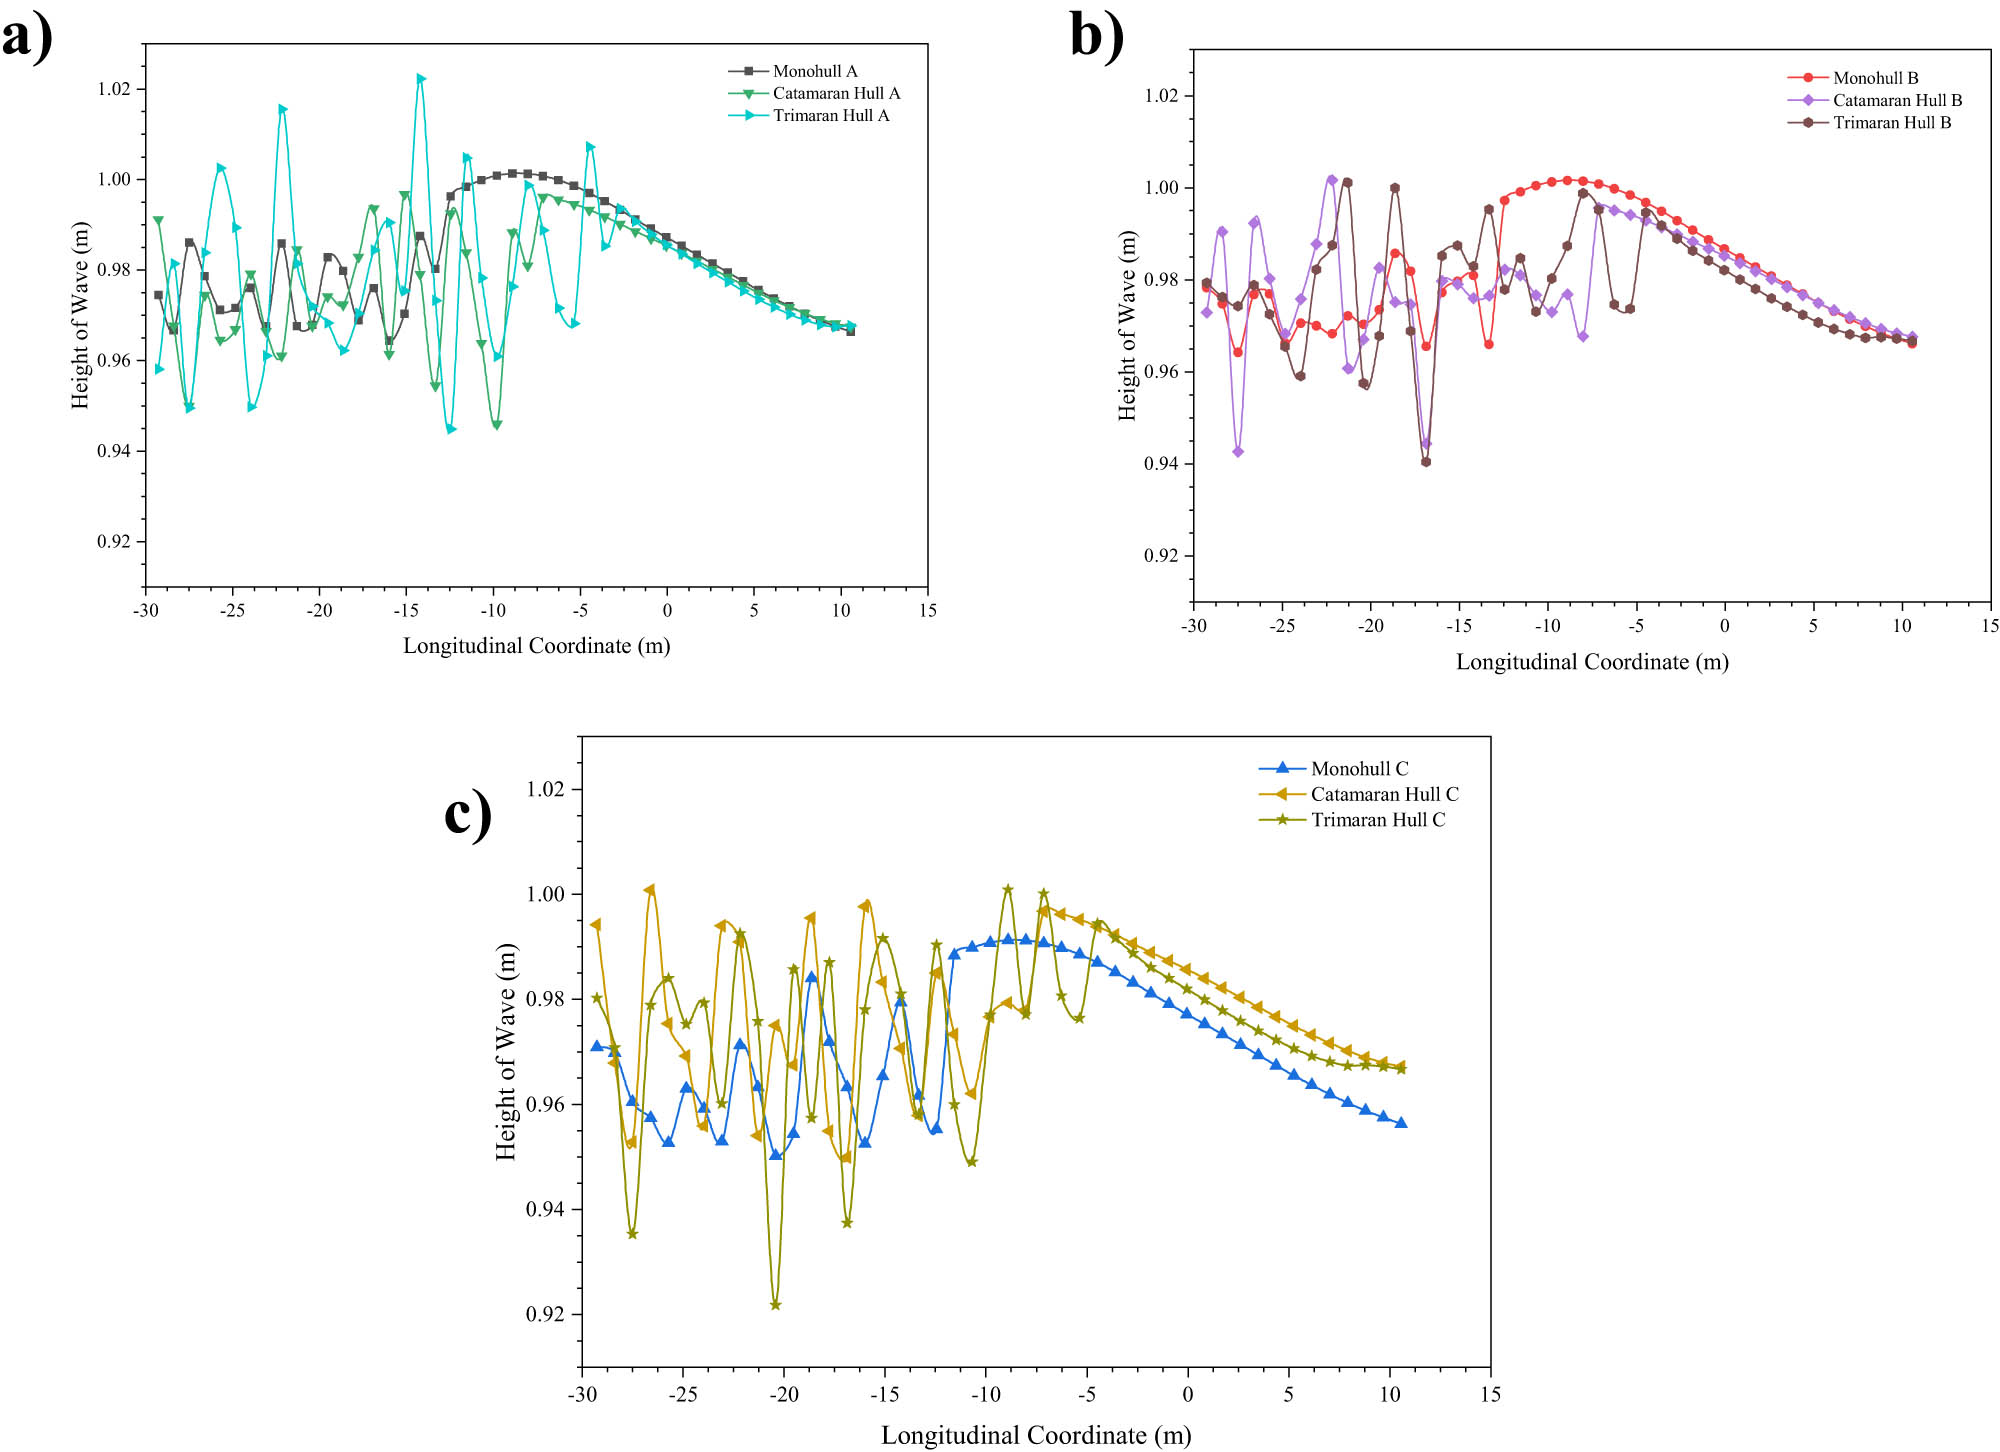
Wave pattern graphs: (a) Variation A; (b) variation B; and (c) variation C.
Based on the wave pattern simulation results, Monohull C demonstrated the best performance, characterized by the most minimal wave pattern, with an average wave height ranging from 0.971 to 0.983, indicating minimal interaction with the water and higher energy efficiency. In contrast, Trimaran Hull C produced the largest wave pattern, with an average wave height of 1.001 and fluctuations of up to 1.022, indicating a more significant interaction with the water and a higher energy demand to maintain speed. These results suggest that the Monohull is the most efficient option for minimizing wave resistance, while the Trimaran exhibits the highest resistance, with the Catamaran positioned between the two.
4.3 Stability simulations
Stability analysis was conducted to evaluate the hull’s balance when subjected to wave forces. The results are presented as GZ righting lever curves, which illustrate the relationship between the GZ value and the vessel’s heel angle. The stability values for the nine model variations are presented in Table 7, while a comparison of GZ values across different heel angles is illustrated in Figure 17.
Stability results of nine variations in the hull design
| Model | Maximum GZ arm (m) | α (deg) | Area (m deg) | Angle of Vanishing Point (deg) |
|---|---|---|---|---|
| Monohull A | 0.549 | 52.7 | 33.64 | 97.87 |
| Monohull B | 0.558 | 52.7 | 34.37 | 98.21 |
| Monohull C | 0.573 | 51.8 | 35.24 | 97.52 |
| Catamaran Hull A | 1.073 | 28.2 | 55.19 | 90.14 |
| Catamaran Hull B | 1.063 | 29.1 | 54.60 | 89.49 |
| Catamaran Hull C | 1.083 | 28.2 | 55.81 | 90.55 |
| Trimaran Hull A | 0.986 | 23.6 | 55.56 | 97.56 |
| Trimaran Hull B | 0.918 | 34.5 | 51.75 | 95.89 |
| Trimaran Hull C | 0.913 | 34.5 | 51.22 | 96.26 |
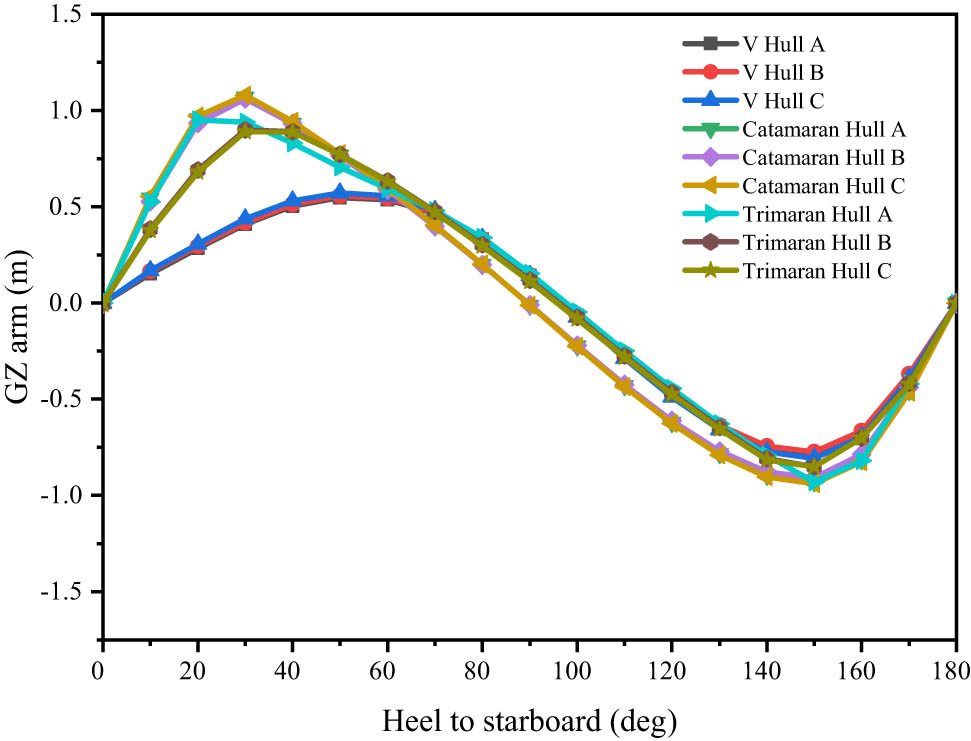
Comparison of GZ values with the hull’s tilt angle of nine hull variations.
The stability simulation results indicate that catamarans provide the highest level of stability among the three types of vessels, with the largest Maximum GZ arm, notably seen in Catamaran Hull C, which reaches 1.083 m. Despite having smaller heel angles, catamarans maintain superior overall stability. In contrast, monohulls, while capable of sustaining the largest heel angles of up to 52.7°, exhibit lower stability, with Maximum GZ arm values ranging from 0.549 to 0.573 m. Trimarans offer moderate stability, with GZ values ranging from 0.913 to 0.986 m, and a broader variation in heel angles. In summary, catamarans show the best overall stability, while monohulls can tolerate larger heel angles before losing stability.
4.4 Seakeeping simulations
Seakeeping analysis was conducted to assess the vessel’s response to specific sea conditions, ensuring the comfort of both the crew and passengers during navigation. In this study, the wave directions were set at 90° (beam seas), 135° (bow quarter seas), and 180° (head seas). The seakeeping analysis of the nine vessel variations resulted in RAO graphs covering heaving, rolling, and pitching motions. Heaving refers to the vertical up-and-down movement of the hull along its axis. The RAO graph for heaving under a 180° wave direction is presented in Figure 18.
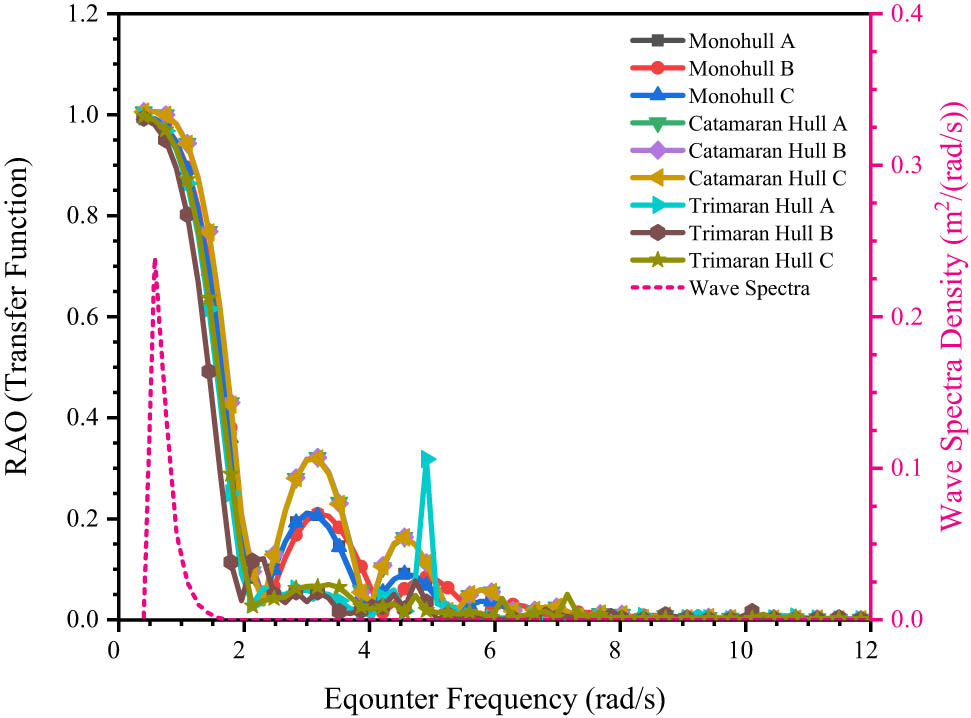
Heaving patterns of nine hull variations.
Based on the heaving motion graph, all model variations exhibited similar trends in their heaving responses. The model with the smallest motion response was Trimaran Hull B, with an RAO value of 0.993 at an encounter frequency of 0.04 rad/s. Conversely, the highest motion response was observed in Catamaran Hull B, with an RAO value of 1.007 at the same encounter frequency. The catamaran hull showed less favorable motion response, experiencing significant heaving when encountering large waves head-on. Regarding the heave motion response, the order from smallest to largest is Trimaran, Monohull, and Catamaran. The RAO results indicate that none of the nine models experienced superposition, as the maximum encounter wave frequency did not coincide with the overall pitching frequency of the models, preventing multiple wave superpositions and contributing to vessel stability.
Following the analysis of the heaving motion, a rolling motion analysis was conducted. Rolling refers to the side-to-side tilting of the hull during navigation [47,48,49,50,51,52]. Through this study, the authors analyzed a rolling motion with waves approaching 90° (beam seas). The RAO rolling graphs for the nine models are presented in Figure 19.
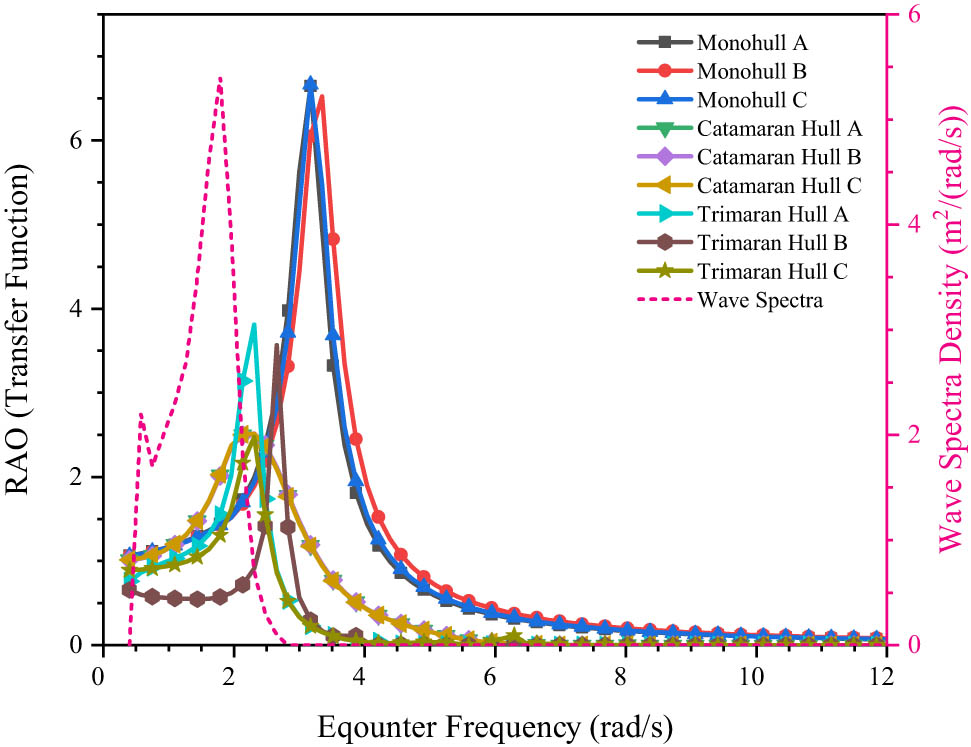
Rolling patterns of nine hull variations.
Based on the results, the highest motion response was observed in Monohull C, with an RAO value of 6.665 at an encounter frequency of 0.431 rad/s. In contrast, the lowest motion response was recorded for Trimaran Hull C, with an RAO value of 2.475 at an encounter frequency of 0.493 rad/s. The Monohull type exhibited the poorest motion response compared to the other models, making it more susceptible to rolling when struck by large waves from the side. The RAO results indicate that none of the nine design variations experienced wave superposition, preventing multiple wave superpositions and contributing to the vessel’s stability. Following the analysis of heaving and rolling motions, the next step was to analyze pitching motion. Pitching refers to the rotational movement of the vessel around its y-axis, causing changes in the trim of the bow and stern. In this study, the authors analyzed pitching with waves approaching from a 180° direction (head seas). The RAO pitching graphs for the nine models are presented in Figure 20.
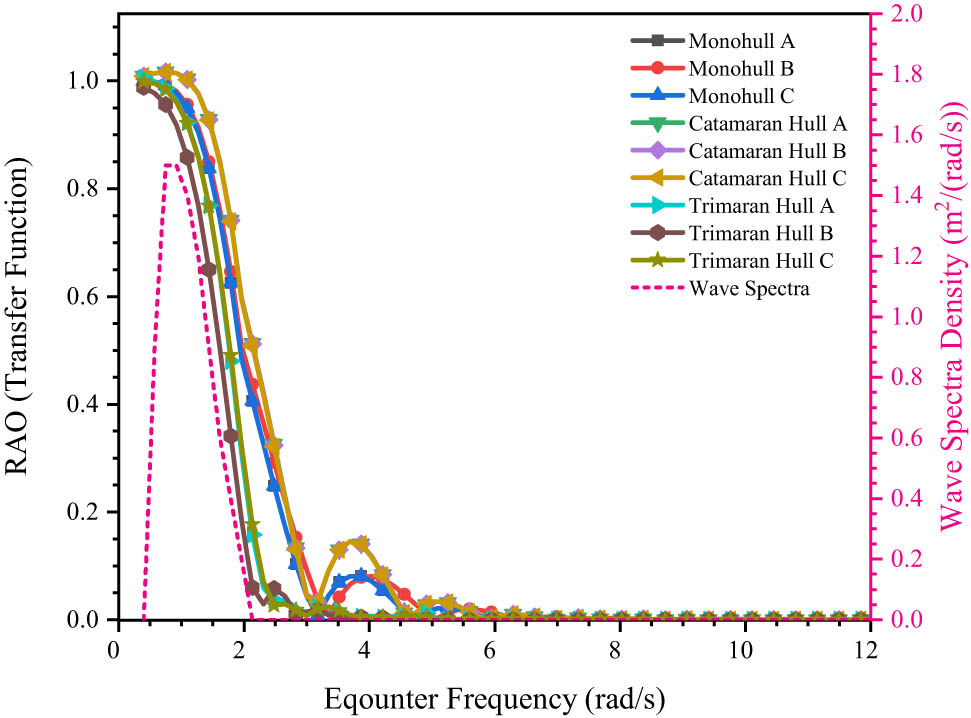
Pitching patterns of nine hull variations.
Based on the pitching motion graph, each model variation exhibited a similar trend in pitching behavior. The model with the smallest pitching response was Trimaran Hull B, with an RAO value of 0.988 at an encounter frequency of 0.504 rad/s, outperforming other hull types. In contrast, the highest pitching response was observed in the Catamaran hull, with an RAO value of 1.017 at an encounter frequency of 0.486 rad/s. The Catamaran hull is more prone to pitching when subjected to large waves from the front. The RAO results indicate that none of the nine wave variations experienced superposition, as the maximum wave encounter frequency differed from the overall pitching frequency of the models, preventing multiple simultaneous wave impacts and ensuring vessel stability. The summary of the seakeeping analysis results is presented in Table 8.
Recapitulation of the seakeeping results
| Model | Seakeeping result | ||
|---|---|---|---|
| Heaving (m/m) | Rolling (rad/rad) | Pitching (rad/rad) | |
| Monohull A | 0.998 | 6.647 | 1.000 |
| Monohull B | 0.998 | 6.522 | 1.000 |
| Monohull C | 0.998 | 6.665 | 1.000 |
| Catamaran Hull A | 1.007 | 2.516 | 1.017 |
| Catamaran Hull B | 1.007 | 2.517 | 1.017 |
| Catamaran Hull C | 1.006 | 2.514 | 1.017 |
| Trimaran Hull A | 0.996 | 2.514 | 1.005 |
| Trimaran Hull B | 0.993 | 3.565 | 0.988 |
| Trimaran Hull C | 0.997 | 1.573 | 0.999 |
As a patrol boat is designed for maritime patrols, passenger comfort is a critical aspect of its design. The incidence of seasickness measures passenger comfort. Seakeeping analysis allows the evaluation of comfort levels using the MSI [53,54,55,56,57]. In this study, MSI analysis was conducted with waves approaching from a 135° direction. The MSI graphs for the nine model variations are presented in Figure 21. The MSI table for the nine model variations is presented in Table 9.
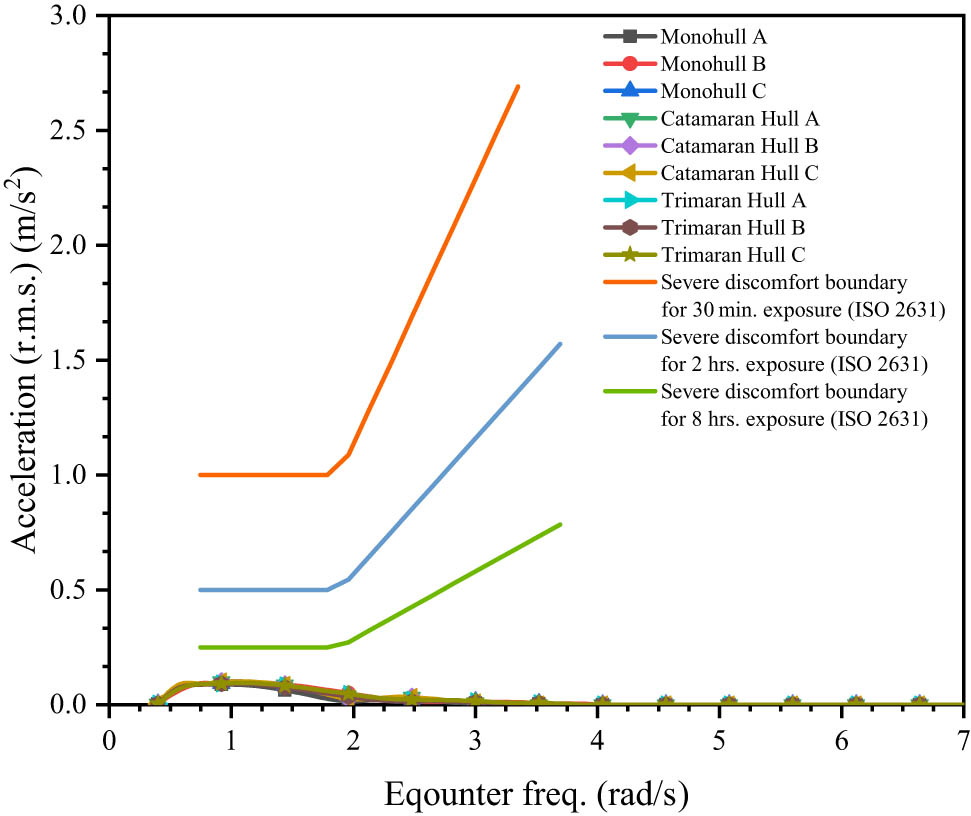
MSI graphic of nine hull designs.
MSI results of nine hull designs
| Model | MSI (m/s2) |
|---|---|
| Monohull A | 0.089 |
| Monohull B | 0.095 |
| Monohull C | 0.095 |
| Catamaran Hull A | 0.102 |
| Catamaran Hull B | 0.102 |
| Catamaran Hull C | 0.102 |
| Trimaran Hull A | 0.094 |
| Trimaran Hull B | 0.091 |
| Trimaran Hull C | 0.095 |
Based on the above graph, the design model with the highest level of comfort is Monohull A, as it has the lowest acceleration value of 0.089 m/s2, which is within the comfort limits as per International Standards (ISO 2631). In contrast, the Catamaran hull variation exhibits lower comfort than the other models, as it has the highest MSI value. However, this value remains within the acceptable comfort limits.
4.5 Floodable length simulations
The floodable length simulation accounts for preventing the hull from sinking in the event of hull damage. The graph illustrates the maximum allowable compartment height and floodable length for the vessel [24]. Designs where the compartment triangle does not cross the boundary line are associated with a higher survival rate and are deemed safer. The results of the floodable length simulation are presented in Figure 22. The results of the recapitulation of the floodable length are presented in Table 10.
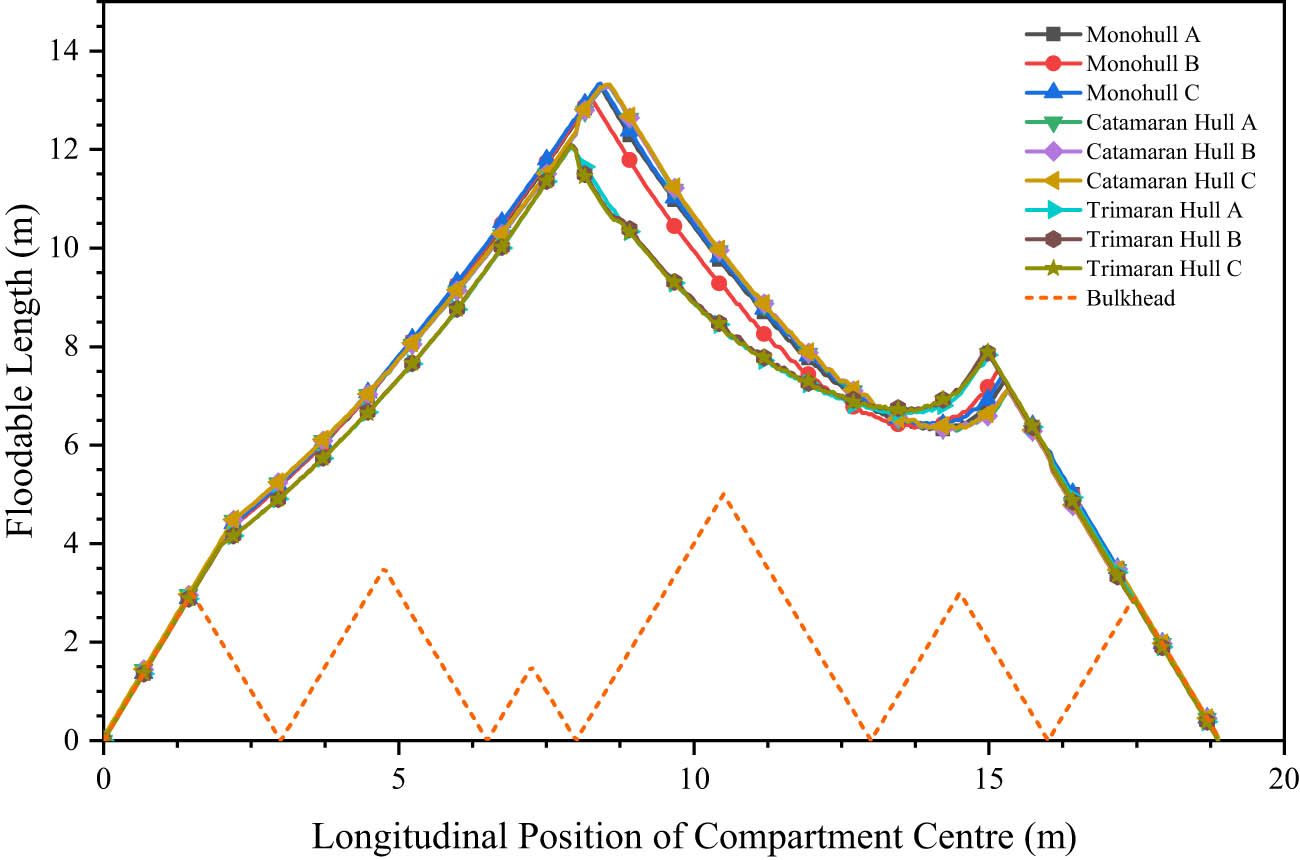
Floodable length graph of nine hull designs.
Recapitulation of the floodable length results
| Model | Floodable length (m) |
|---|---|
| Monohull A | 13.25 |
| Monohull B | 13.02 |
| Monohull C | 13.34 |
| Catamaran Hull A | 13.28 |
| Catamaran Hull B | 13.27 |
| Catamaran Hull C | 13.32 |
| Trimaran Hull A | 12.06 |
| Trimaran Hull B | 12.09 |
| Trimaran Hull C | 12.07 |
The floodable length simulation results indicate that none of the compartments exceed the allowable flood limits. Among the design models, Monohull C demonstrated the best performance, with the highest average peak value of 13.34 m. In contrast, Trimaran Hull A exhibited the shortest floodable length, measuring 12.06 m.
4.6 MADM
This study employed the MADM method to determine the optimal patrol boat design by evaluating various hull types and dimensions based on hydrodynamic characteristics. The SAW method was used for the analysis. Data processing was conducted based on the weight values and importance levels of each hydrodynamic criterion, aligning with the operational requirements of patrol boats in the Arafura Sea. The design with the highest total score from this calculation was selected as the best model for potential application. The scores and importance levels in the MADM calculations are presented in Table 11, while the summary of scores for each criterion is provided in Table 12.
MADM of value and importance
| Criteria | Value |
|---|---|
| Very important | 5 |
| Quite important | 4 |
| Important | 3 |
| Not important | 2 |
| Very unimportant | 1 |
Weight for each hydrodynamics parameter
| Parameter | Criteria | Value | Score (%) | |
|---|---|---|---|---|
| Resistance | C1 | Very important | 5 | 17.241 |
| Stability | C2 | Quite important | 4 | 13.793 |
| Heaving | C3 | Important | 3 | 10.345 |
| Rolling | C4 | Important | 3 | 10.345 |
| Pitching | C5 | Important | 3 | 10.345 |
| MSI | C6 | Quite important | 4 | 13.793 |
| Floodable length | C7 | Quite important | 4 | 13.793 |
| Wave pattern | C8 | Important | 3 | 10.345 |
Each hydrodynamic criterion carries its value and level of importance. Resistance is assigned a value of 5 (Very important) because patrol boats require high speed during operation, making resistance a crucial factor in selecting the best model. Stability, MSI, and floodable length are assigned a value of 4 (Quite important), as they are essential for ensuring the vessel’s safety and comfort during navigation. Meanwhile, heaving, pitching, rolling, and wave patterns are rated at 3 (Important) due to their significant impact on passenger comfort during sailing. Therefore, designing a vessel with optimal resistance, high stability, good response to specific sea conditions, and a low probability of seasickness is necessary.
For this calculation, resistance data were taken at an operating speed of 30 knots, and stability data were based on the maximum GZ arm. Seakeeping data, which include heaving, rolling, and pitching motions, were collected using the highest RAO values for each motion. MSI was evaluated with waves approaching from a 135° angle. The floodable length was measured by the highest peak value for each model, and wave pattern data were derived from the average wave height generated by the vessel at 30 knots. The parameter values for the nine model variations are presented in Table 13.
Parameter values of the nine model variations
| Model | C1 | C2 | C3 | C4 | C5 | C6 | C7 | C8 |
|---|---|---|---|---|---|---|---|---|
| Monohull A | 34.400 | 0.549 | 0.998 | 6.647 | 1.000 | 0.089 | 13.25 | 0.983 |
| Monohull B | 34.500 | 0.558 | 0.998 | 6.522 | 1.000 | 0.095 | 13.02 | 0.982 |
| Monohull C | 34.300 | 0.573 | 0.998 | 6.665 | 1.000 | 0.095 | 13.34 | 0.971 |
| Catamaran Hull A | 48.100 | 1.073 | 1.006 | 2.513 | 1.017 | 0.102 | 13.28 | 0.978 |
| Catamaran Hull B | 47.900 | 1.063 | 1.007 | 2.517 | 1.017 | 0.102 | 13.27 | 0.979 |
| Catamaran Hull C | 48.500 | 1.08 | 1.006 | 2.514 | 1.017 | 0.102 | 13.32 | 0.978 |
| Trimaran Hull A | 46.700 | 0.986 | 0.996 | 2.514 | 1.005 | 0.094 | 12.06 | 0.979 |
| Trimaran Hull B | 46.900 | 0.918 | 0.993 | 3.565 | 0.988 | 0.091 | 12.09 | 0.979 |
| Trimaran Hull C | 47.200 | 0.913 | 0.997 | 2.475 | 0.999 | 0.095 | 12.07 | 0.975 |
The next step is to normalize the data to minimize deviations during the calculation process. For the criteria of resistance (C1), heaving (C3), rolling (C4), pitching (C5), MSI (C6), and wave pattern (C8), the smallest values are selected, as lower values indicate a better hull design. However, for the criteria of stability (C2) and floodable length (C7), the best data are the ones with the highest values. The normalized data for all hull variations are presented in Table 14.
Recapitulation of normalized data
| Model | C1 | C2 | C3 | C4 | C5 | C6 | C7 | C8 |
|---|---|---|---|---|---|---|---|---|
| Monohull A | 0.997 | 0.508 | 0.995 | 0.372 | 0.988 | 1.000 | 0.993 | 0.988 |
| Monohull B | 0.994 | 0.517 | 0.995 | 0.379 | 0.988 | 0.937 | 0.976 | 0.989 |
| Monohull C | 1.000 | 0.531 | 0.995 | 0.371 | 0.988 | 0.937 | 1.000 | 1.000 |
| Catamaran Hull A | 0.713 | 0.994 | 0.987 | 0.985 | 0.971 | 0.873 | 0.996 | 0.993 |
| Catamaran Hull B | 0.716 | 0.984 | 0.986 | 0.983 | 0.971 | 0.873 | 0.995 | 0.992 |
| Catamaran Hull C | 0.707 | 1.000 | 0.987 | 0.984 | 0.971 | 0.873 | 0.999 | 0.993 |
| Trimaran Hull A | 0.734 | 0.913 | 0.997 | 0.984 | 0.983 | 0.947 | 0.904 | 0.992 |
| Trimaran Hull B | 0.731 | 0.850 | 1.000 | 0.694 | 1.000 | 0.978 | 0.906 | 0.993 |
| Trimaran Hull C | 0.727 | 0.845 | 0.996 | 1.000 | 0.989 | 0.937 | 0.905 | 0.996 |
After data normalization, calculations are performed using the weight values assigned to each criterion. The design model with the highest weighted score is considered the optimal design. The total weighted values for each hydrodynamic criterion are presented in Table 15.
Total weight for each hydrodynamic criterium
| Model | C1 | C2 | C3 | C4 | C5 | C6 | C7 | C8 | Total weight |
|---|---|---|---|---|---|---|---|---|---|
| Monohull A | 17.191 | 7.011 | 10.293 | 3.852 | 10.221 | 13.793 | 13.700 | 10.225 | 86.286 |
| Monohull B | 17.141 | 7.126 | 10.293 | 3.926 | 10.221 | 12.922 | 13.462 | 10.232 | 85.323 |
| Monohull C | 17.241 | 7.318 | 10.293 | 3.841 | 10.221 | 12.922 | 13.793 | 10.345 | 85.974 |
| Catamaran Hull A | 12.295 | 13.704 | 10.211 | 10.188 | 10.050 | 12.035 | 13.731 | 10.276 | 92.490 |
| Catamaran Hull B | 12.346 | 13.576 | 10.201 | 10.172 | 10.050 | 12.035 | 13.721 | 10.266 | 92.367 |
| Catamaran Hull C | 12.193 | 13.793 | 10.211 | 10.184 | 10.050 | 12.035 | 13.772 | 10.270 | 92.510 |
| Trimaran Hull A | 12.663 | 12.593 | 10.314 | 10.184 | 10.170 | 13.059 | 12.470 | 10.262 | 91.715 |
| Trimaran Hull B | 12.609 | 11.724 | 10.345 | 7.182 | 10.345 | 13.490 | 12.501 | 10.268 | 88.463 |
| Trimaran Hull C | 12.529 | 11.660 | 10.303 | 10.345 | 10.231 | 12.922 | 12.480 | 10.308 | 90.779 |
The optimal patrol boat design model can be determined based on the total weighted values in Table 14. Therefore, the total weighted score data for each model are ranked. The ranking of the total weighted values is presented in Table 16.
Total values of the assessed hull designs
| Rank | Model | Total weight |
|---|---|---|
| 1 | Catamaran Hull C | 92.510 |
| 2 | Catamaran Hull A | 92.490 |
| 3 | Catamaran Hull B | 92.367 |
| 4 | Trimaran Hull A | 91.715 |
| 5 | Trimaran Hull C | 90.779 |
| 6 | Trimaran Hull B | 88.463 |
| 7 | Monohull A | 86.286 |
| 8 | Monohull C | 85.974 |
| 9 | Monohull B | 85.323 |
Based on the MADM calculation results, the best patrol boat hull model is Catamaran Hull C, as determined by the critical criteria. This model, derived from a regression approach with displacement and depth as the key variables, achieved a total score of 92.510. In contrast, the model with the lowest score is Monohull B, with a total score of 85.323, resulting from a regression analysis that identified displacement and beam as the key variables.
4.7 Sensitivity analysis
In this study, a sensitivity analysis was conducted to evaluate the effect of variations in hull type and dimensions on hydrodynamic performance. The calculations considered factors such as resistance, stability, seakeeping, MSI, floodable length, and wave pattern behavior. For hull type variations, the block coefficient (Cb) was used as the input variable, while displacement volume represented dimension variations. The analysis generated key results, including coefficient values, standard errors, p-values, R-squared values, and F-statistic significance. A higher R 2 indicates a more substantial influence of the independent variable on the hydrodynamic characteristics. The coefficient measures the effect of each unit change in the independent variable x on the dependent variable y, with larger coefficients corresponding to smaller overall impacts. The standard error reflects the variability between the observed and predicted values, where a larger standard error indicates a more negligible influence on the results. The p-value reveals the probability of the coefficient’s significance, with lower p-values indicating greater impact. The F significance indicates the overall effect of the independent variables, where a lower F significance value indicates a stronger relationship. Results for hydrodynamic resistance are detailed in Table 17, with a graphical representation in Figure 23.
Results of the sensitivity analysis: Resistance
| Indicator | Variable | |
|---|---|---|
| Hull dimension | Hull type | |
| Coefficients | −1489.47 | 53.58138 |
| R Squared | 0.196759 | 0.020114 |
| p-value | 0.243804 | 0.093092 |
| Standard error | 6.323396 | 6.984177 |
| Significance F | 0.231717 | 0.715879 |
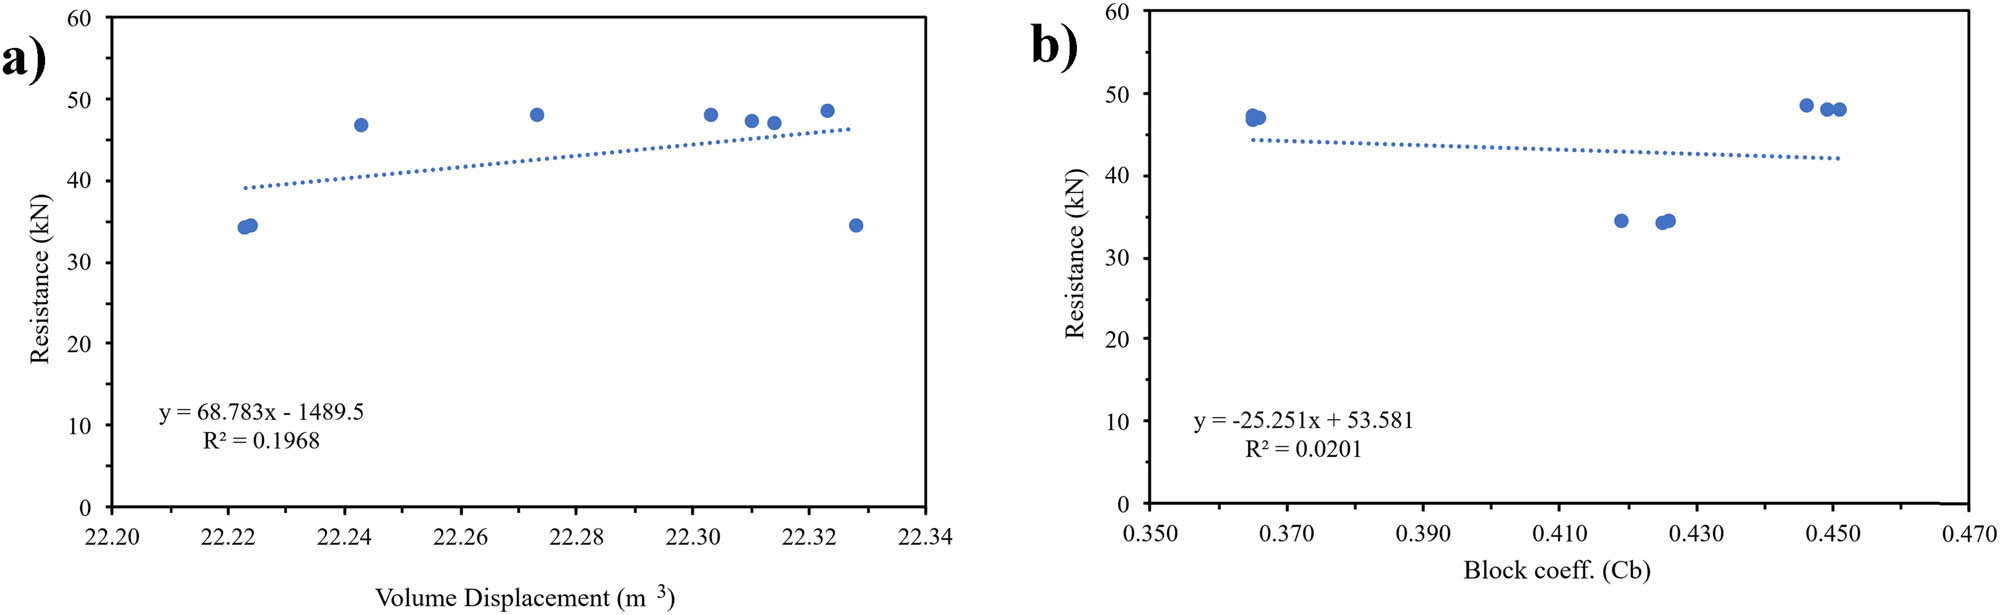
Sensitivity analysis of resistance: (a) Dimension; and (b) hull type.
Dimensional variations were found to exert a greater influence on resistance values compared to variations in hull type, as reflected by the higher R 2 value of 0.196759 vs 0.020114. Furthermore, the higher significance values, coefficients, standard errors, and p-values imply that changes in hull form had a less pronounced effect on the outcomes. The results of the sensitivity analysis related to stability criteria are presented in Table 18 and Figure 24.
Results of the sensitivity analysis: Stability
| Indicator | Variable | |
|---|---|---|
| Hull dimension | Hull type | |
| Coefficients | −45.645 | 0.781582 |
| R Squared | 0.147733 | 0.00086 |
| p-value | 0.315428 | 0.449095 |
| Standard error | 0.228073 | 0.246945 |
| Significance F | 0.30709 | 0.940292 |
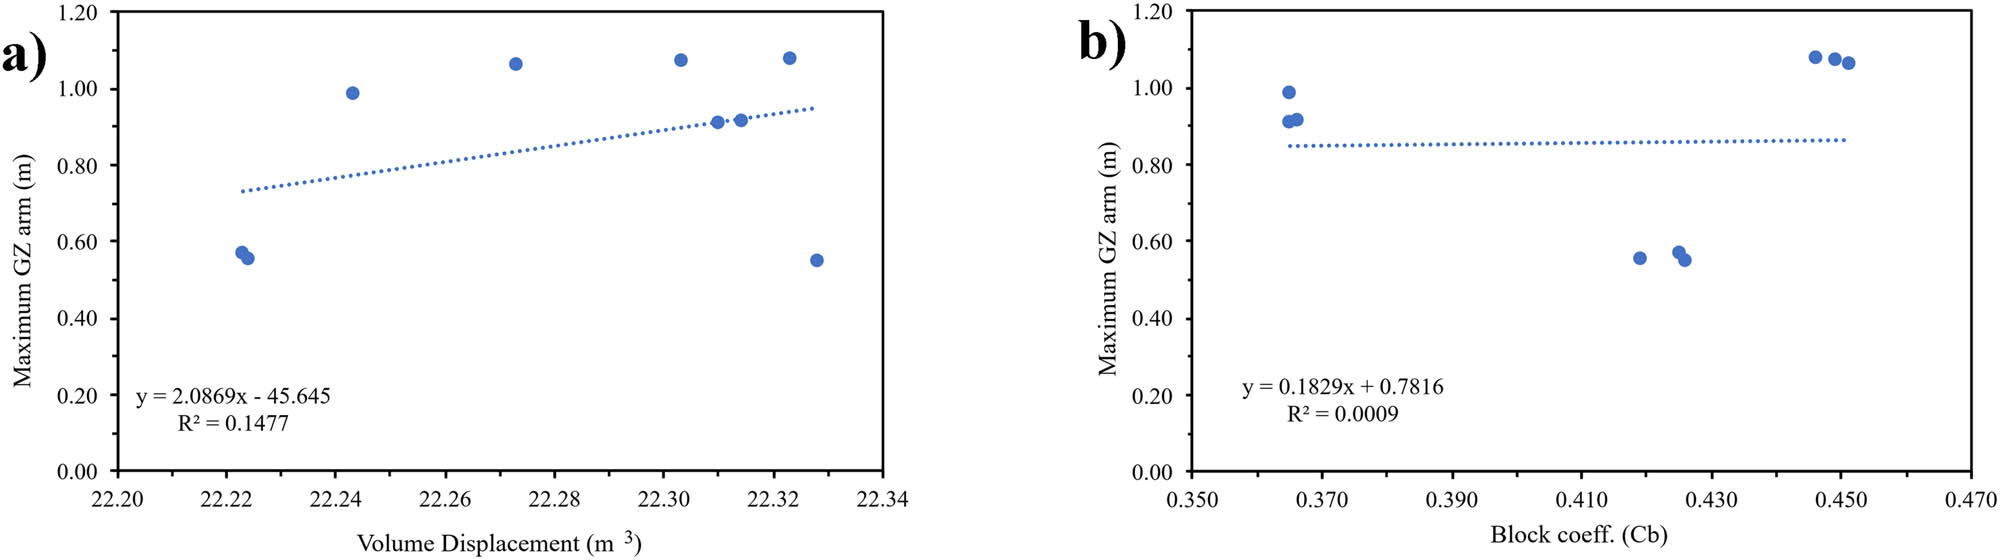
Sensitivity analysis of stability: (a) Dimension; and (b) hull type.
The analysis indicated that dimensional variations had a more substantial impact on stability values than hull-type changes, as demonstrated by the higher R 2 value of 0.147733 compared to 0.00086. In addition, the larger significance values, coefficients, standard errors, and p-values imply that dimensional variations exerted a negligible influence on the final results. Table 19 and Figure 25 present the findings of the sensitivity analysis for the heaving motion criteria.
Results of the sensitivity analysis: Heaving
| Indicator | Variable | |
|---|---|---|
| Hull dimension | Hull type | |
| Coefficients | 0.539646 | 0.95177 |
| R squared | 0.029884 | 0.723193 |
| p-value | 0.603017 | 8.71 × 10⁻¹² |
| Standard error | 0.005355 | 0.00286 |
| Significance F | 0.656483 | 0.003671 |
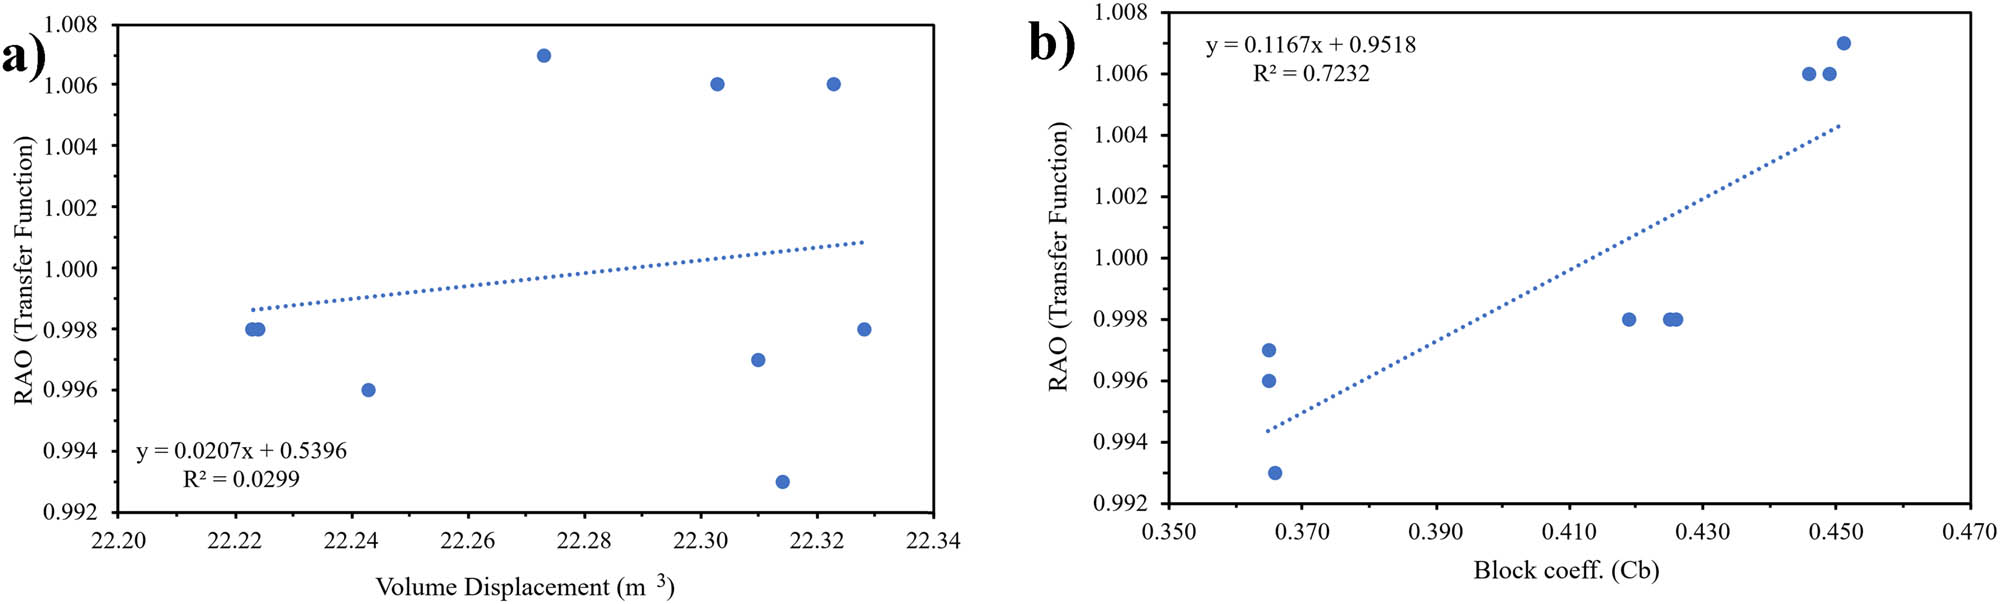
Sensitivity analysis of heaving: (a) Dimension; and (b) hull type.
The findings revealed that dimensional variations had a lesser effect on heaving motion compared to hull-type variations, as shown by the R 2 values of 0.029884 for dimensions and 0.723193 for hull types. Furthermore, the increased significance values, coefficients, standard errors, and p-values suggest that the impact of hull shape variations on the final result was relatively minor. Sensitivity analysis for rolling motion criteria is provided in Table 20 and Figure 26.
Results of the sensitivity analysis: Rolling
| Indicator | Variable | |
|---|---|---|
| Hull dimension | Hull type | |
| Coefficients | 402.5257 | 0.708031 |
| R squared | 0.145736 | 0.021913 |
| p-value | 0.3062 | 0.934592 |
| Standard error | 1.9703 | 2.108264 |
| Significance F | 0.310663 | 0.703888 |
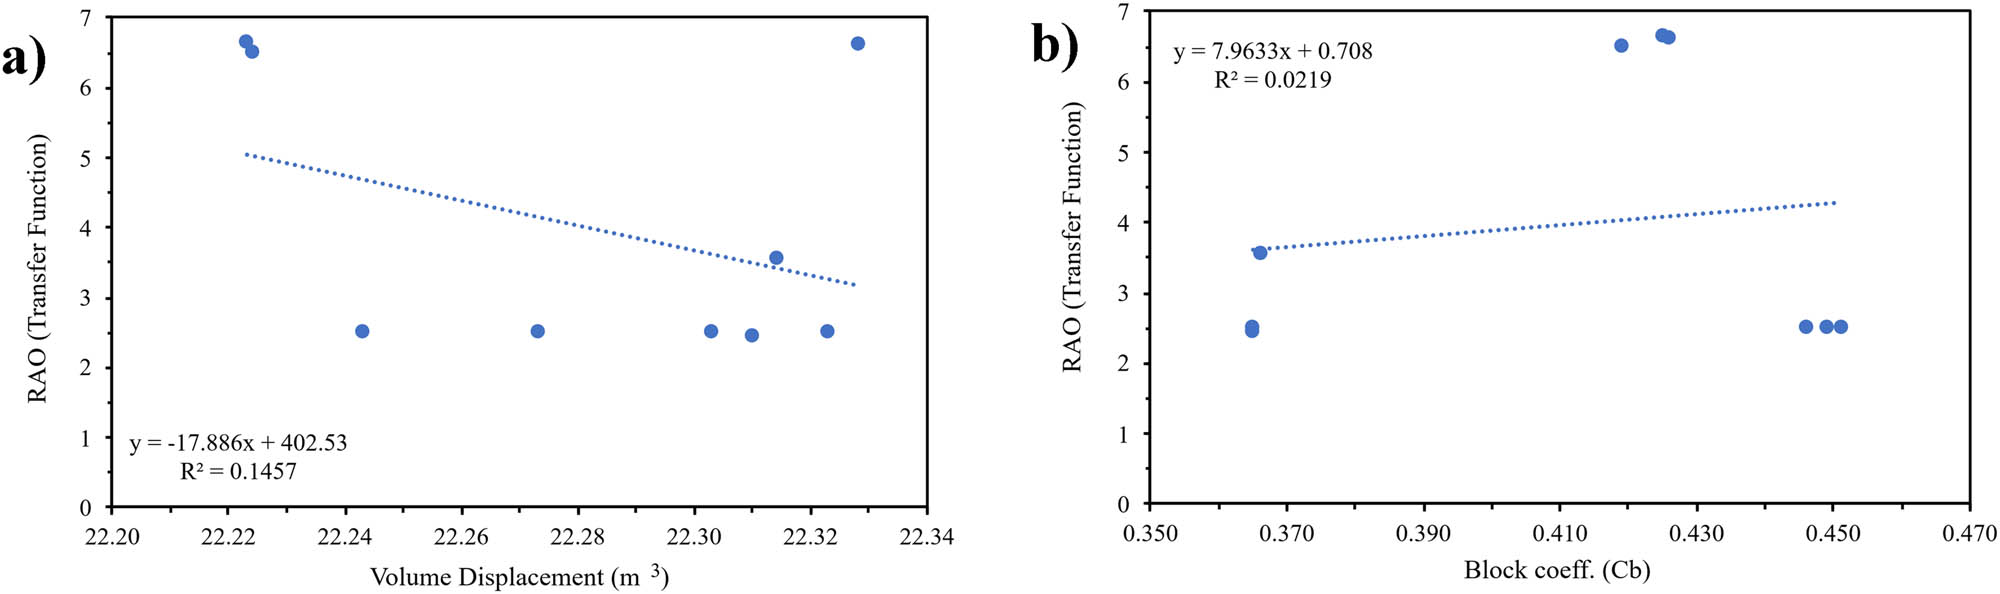
Sensitivity analysis of rolling: (a) Dimension; and (b) hull type.
Variations in hull type were determined to have a minor impact on rolling motion than dimensional changes, as evidenced by the R 2 values of 0.021913 for hull type and 0.145736 for dimensions. Additionally, the higher significance values, coefficients, standard errors, and p-values suggest that dimensional variations contributed less to the final result. The sensitivity analysis findings for pitching motion criteria are displayed in Table 21 and Figure 27.
Results of the sensitivity analysis: Pitching
| Indicator | Variable | |
|---|---|---|
| Hull dimension | Hull type | |
| Coefficients | 0.574773 | 0.921672 |
| R squared | 0.00649 | 0.536694 |
| p-value | 0.783277 | 8.46 × 10⁻⁹ |
| Standard error | 0.010864 | 0.007419 |
| Significance F | 0.836765 | 0.024773 |
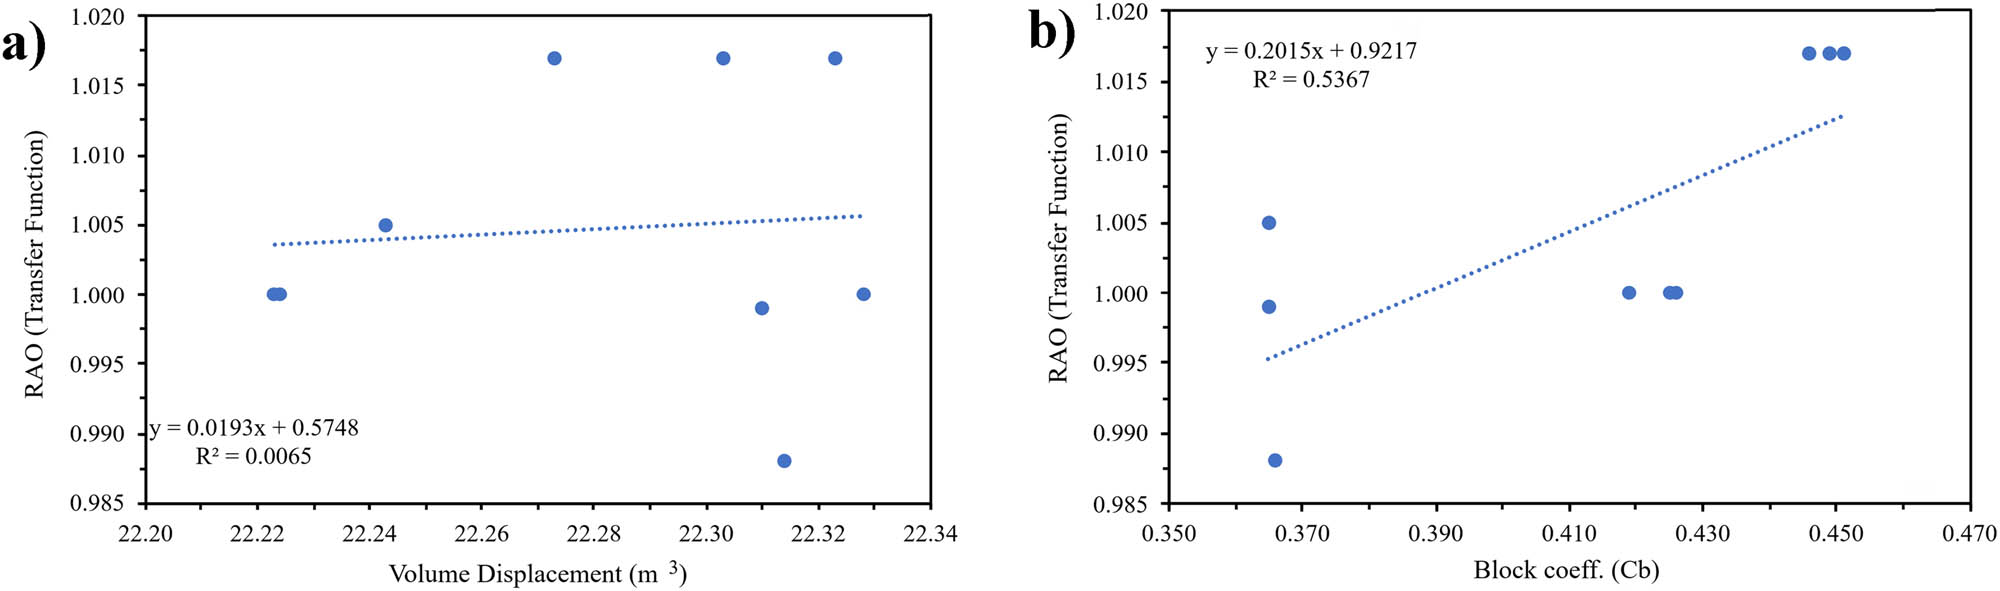
Sensitivity analysis of pitching: (a) Dimension; and (b) hull type.
Dimensional variations were found to have a less pronounced impact on pitching values than hull type variations, as indicated by the R 2 values of 0.00649 for dimensions and 0.536694 for hull types. Moreover, higher significance values, coefficients, standard errors, and p-values imply that hull shape variations had a minimal effect on the outcome. The sensitivity analysis results for MSI motion criteria are illustrated in Table 22 and Figure 28.
Results of the sensitivity analysis: MSI
| Indicator | Variable | |
|---|---|---|
| Hull dimension | Hull type | |
| Coefficients | 0.092011 | 0.061871 |
| R squared | 2.6 × 10⁻⁶ | 0.401076 |
| p-value | 0.926445 | 0.005912 |
| Standard error | 0.005195 | 0.00402 |
| Significance F | 0.996717 | 0.067101 |
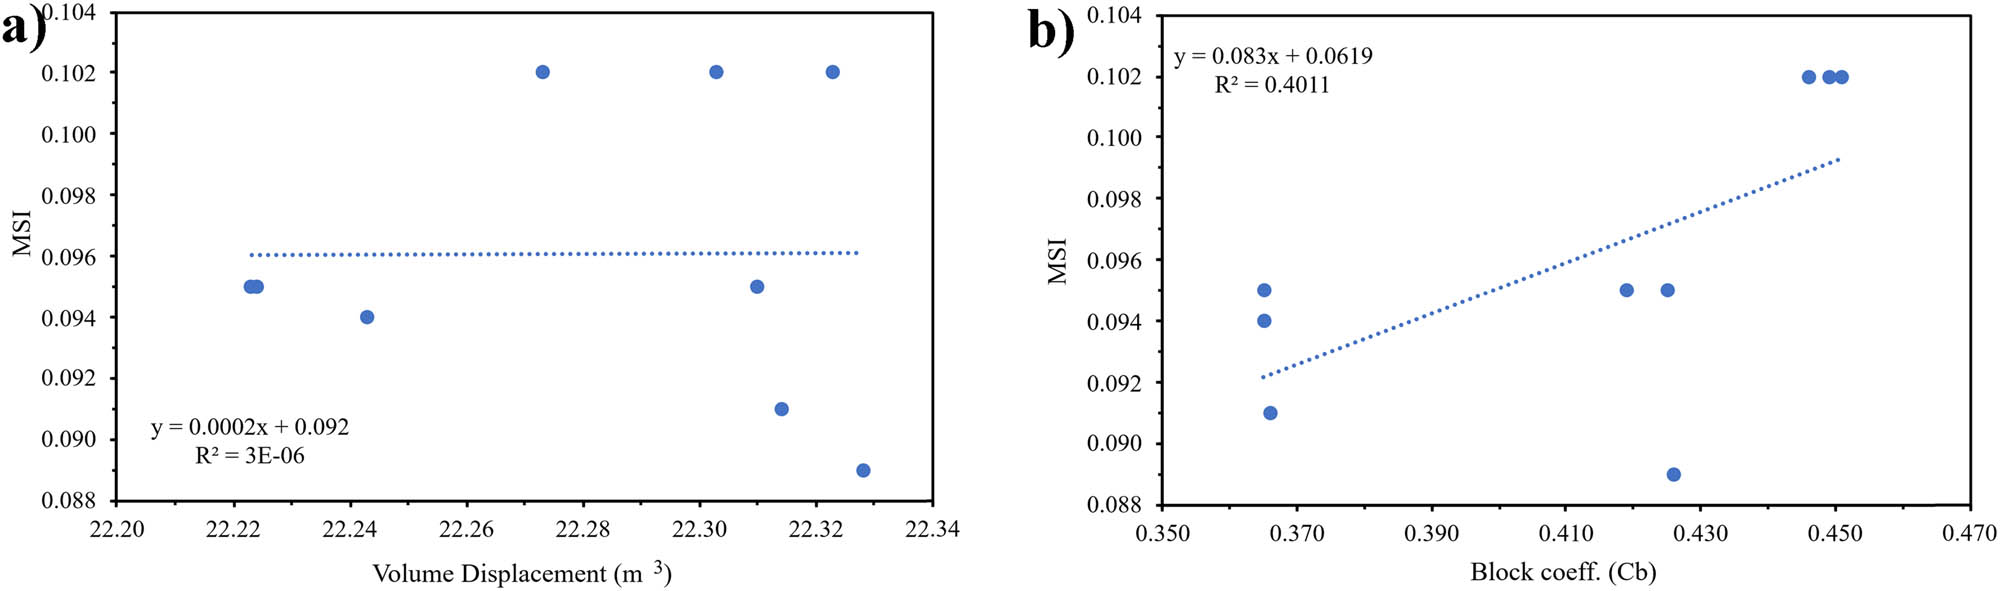
Sensitivity analysis of MSI: (a) Dimension; and (b) hull type.
Results indicate that the influence of hull type variations on MSI values was more substantial than that of dimensional variations, evidenced by an R 2 value of 0.401076 for hull types and 2.6 × 10⁻⁶ for dimensional changes. Additionally, the greater significance values, coefficients, standard errors, and p-values suggest a limited effect of dimensional variations on the overall results. The sensitivity analysis concerning floodable length criteria is presented in Table 23 and Figure 29.
Results of the sensitivity analysis: Floodable length
| Indicator | Variable | |
|---|---|---|
| Hull dimension | Hull type | |
| Coefficients | 30.10186 | 6.470984 |
| R squared | 0.003077 | 0.933709 |
| p-value | 0.804886 | 2.1 × 10⁻⁵ |
| Standard error | 0.633848 | 0.163449 |
| Significance F | 0.887277 | 2.24 × 10⁻⁵ |
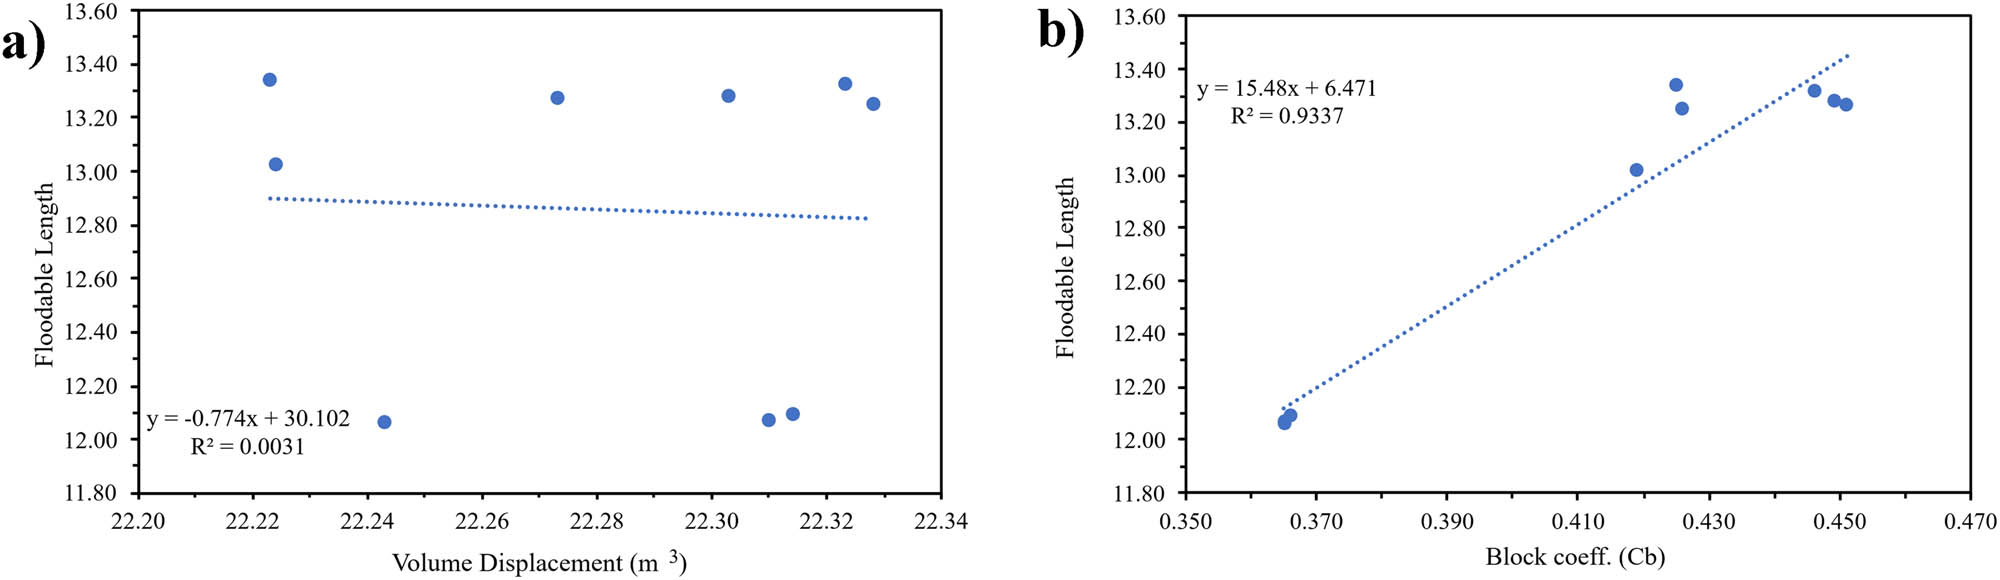
Sensitivity analysis of floodable length: (a) Dimension; and (b) hull type.
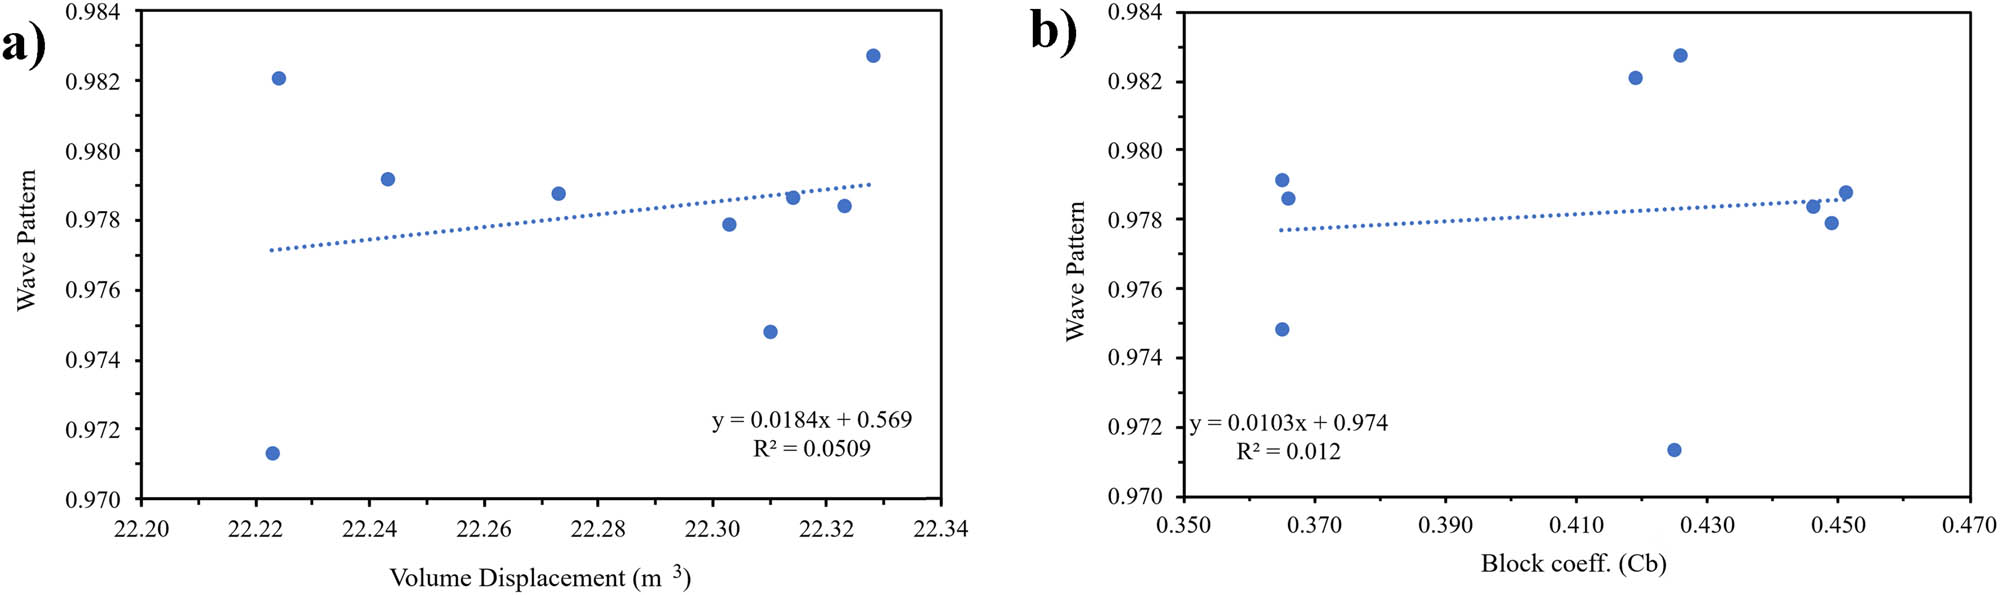
Hull type variations were found to have a greater influence on Floodable Length values compared to dimensional variations, with an R 2 value of 0.933709 for hull types and 0.003077 for dimensions. Additionally, larger significance values, coefficients, standard errors, and p-values indicate that dimensional variations played a negligible role in the outcome. Sensitivity analysis results for wave pattern criteria are presented in Table 24 and Figure 30.
Results of the sensitivity analysis: Wave pattern
| Indicator | Variable | |
|---|---|---|
| Hull dimension | Hull type | |
| Coefficients | 0.568974 | 0.973968 |
| R squared | 0.050885 | 0.012047 |
| p-value | 0.42253 | 4.34 × 10⁻¹¹ |
| Standard error | 0.003609 | 0.003682 |
| Significance F | 0.5595 | 0.778638 |
Sensitivity analysis of wave pattern: (a) Dimension; and (b) hull type.
The analysis revealed that hull type variations had a lesser impact on wave pattern values than dimensional variations, as evidenced by the R 2 value of 0.012047 for hull types and 0.050885 for dimensions. Additionally, larger significance values, coefficients, standard errors, and p-values suggest that dimensional variations exerted a negligible influence on the outcome.
5 Conclusion
Based on the study, a hydrodynamic analysis was conducted, encompassing resistance, stability, and seakeeping, utilizing two parameters: hull type variation and dimensions derived from regression analysis. The study concludes the following: From the MADM calculations, the best model was determined to be Catamaran Hull C, with a total score of 92.510, derived from the regression approach of displacement and depth. In order of performance, the ranking of hull types for patrol boat designs is Catamaran, Trimaran, and Monohull. Therefore, Catamaran Hull C is recommended as the optimal design for patrol boat hulls in the Arafura Sea region, contributing to the achievement of the SDGs. Sensitivity analysis revealed that hull type variation has a significant impact on stability, rolling motion, and MSI, while hull dimension variation affects resistance, heaving, and pitching motion. These sensitivity analysis findings influence the hydrodynamic performance of each variation, providing essential considerations for patrol boat design based on the specific hydrodynamic characteristics of each criterion.
Acknowledgments
This work was supported by Universitas Hasanuddin – Funding Year 2025, under the Research Scheme of “Riset Kolaborasi Indonesia” (RKI) – Skema C, with research grant/contract no. 01319/UN4.22/PT.01.03/2025. The authors highly acknowledge the support.
-
Funding information: Riset Kolaborasi Indonesia” (RKI) – Skema C; 01319/UN4.22/PT.01.03/2025; Rahimuddin Samad.
-
Author contributions: Aria Pranata: data curation, formal analysis, investigation, validation, and writing – original draft. Aditya Rio Prabowo: conceptualization, funding acquisition, methodology, writing – original draft, writing – review and editing, project administration, and supervision. Jung Min Sohn: conceptualization and methodology. Tuswan Tuswan: funding acquisition, data curation, and software. Rahimuddin Samad: funding acquisition and methodology. Martin Jurkovič: investigation and writing – review and Editing. Oleksiy Melnyk: Conceptualization and writing – review and editing. Teguh Muttaqie: methodology, resource, and software. Nurul Muhayat: writing – original draft and supervision. All authors have read and agreed to the published version of the manuscript.
-
Conflict of interest: The authors state no conflict of interest.
-
Data availability statement: The authors confirm that the data supporting the findings of this study are available within the article.
-
Supporting Information: Not applicable.
References
[1] Prasetyo AP. Potensi Konflik dari Interaksi Perikanan Pukat Hela dalam Pemanfaatan Sumber Daya Ikan di Perairan Arafura. J Lit Perikan Ind. 2012;18(2):101–8.Search in Google Scholar
[2] Tuanger AS, Massie CD, Sinaga TB. Mekanisme Penyelesaian Hukum Illegal Fishing Di Perbatasan Indonesia Dan Australia. J Fak Huk Univ Sam Ratulangi Lex Priv. 2023;12(3):1–12.Search in Google Scholar
[3] Lembaga Ketahanan Nasional RI. Kepala BNN: Penyelundupan Narkoba 80% Lewat Jalur Laut. Lemb Ketahanan Nas RI. Jakarta, Indonesia:: National Defense Institute (Lemhannas); 2019. https://www.lemhannas.go.id/index.php/berita/berita-utama/734-kepala-bnn-penyelundupan-narkoba-80-lewat-jalur-laut (accessed March 8, 2024).Search in Google Scholar
[4] Badan Narkotika Nasional Republik Indonesia. Data Statistik Kasus Narkoba. Jakarta, Indonesia: National Narcotics Agency of Indonesia (BNN); 2022. https://puslitdatin.bnn.go.id/portfolio/data-statistik-kasus-narkoba/ (accessed March 20, 2024).Search in Google Scholar
[5] Tapilatu Y, Fauzan I, Pradipta A, Kusuma AB. A first report on prokaryotic diversity in northwestern Arafura deep-sea sediments, Indonesia. Sci Rep. 2024;14(1):895. 10.1038/s41598-024-51614-6.Search in Google Scholar PubMed PubMed Central
[6] Gil JDB, Reidsma P, Giller K, Todman L, Whitmore A, van Ittersum M. Sustainable Development Goal 2: Improved targets and indicators for agriculture and food security. Ambio. 2019;48(7):685–98. 10.1007/s13280-018-1101-4.Search in Google Scholar PubMed PubMed Central
[7] Kayikci Y, Kazancoglu Y, Gozacan‐Chase N, Lafci C. Analyzing the drivers of smart sustainable circular supply chain for sustainable development goals through stakeholder theory. Bus Strateg Env. 2022;31(7):3335–53. 10.1002/bse.3087.Search in Google Scholar
[8] Pratama AS, Prabowo AR, Tuswan T, Adiputra R, Muhayat N, Cao B, et al. Fast patrol boat hull design concepts on hydrodynamic performances and survivability evaluation. J Appl Eng Sci. 2023;21(2):501–31. 10.5937/jaes0-40698.Search in Google Scholar
[9] Diatmaja H, Prabowo AR, Adiputra R, Muhayat N, Baek SJ, Huda N, et al. Comparative evaluation of design variations in prototype fast boats: A hydrodynamic characteristic-based approach. Math Model Eng Probl. 2023;10(5):1487–507. 10.18280/mmep.100501.Search in Google Scholar
[10] Biran A, López-Pulido R. Chapter 13 - Computer methods. In: Biran A, López-Pulido R, editors. Sh. Hydrostatics Stab. 2nd edn. Oxford: Butterworth-Heinemann; 2014. p. 321–61. 10.1016/B978-0-08-098287-8.00013-X.Search in Google Scholar
[11] Jiang X, Lin Y. Reparameterization of B-spline surface and its application in ship hull modeling. Ocean Eng. 2023;286:115535. 10.1016/j.oceaneng.2023.115535.Search in Google Scholar
[12] Pérez F, Clemente JA. Constrained design of simple ship hulls with B-spline surfaces. Comput Des. 2011;43(12):1829–40. 10.1016/j.cad.2011.07.008.Search in Google Scholar
[13] de Heere RFS, Gerritsma J, Bakker AR. Buoyancy and stability of ships. Culemborg, Netherlands: Technical Publications H. Stam; 1969.Search in Google Scholar
[14] Rodríguez A, Fernández-Jambrina L. Programmed design of ship forms. Comput Des. 2012;44(7):687–96. 10.1016/j.cad.2012.03.003.Search in Google Scholar
[15] Zhang Y, Ma N, Gu X, Shi Q. Geometric space construction method combined of a spline-skinning based geometric variation method and PCA dimensionality reduction for ship hull form optimization. Ocean Eng. 2024;302:117604. 10.1016/j.oceaneng.2024.117604.Search in Google Scholar
[16] Pérez F, Suárez JA. Quasi-developable B-spline surfaces in ship hull design. Comput Des. 2007;39(10):853–62. 10.1016/j.cad.2007.04.004.Search in Google Scholar
[17] Rahmaji T, Prabowo AR, Tuswan T, Muttaqie T, Muhayat N, Baek S-J. Design of Fast Patrol Boat for Improving Resistance, Stability, and Seakeeping Performance. Designs. 2022;6(6):105. 10.3390/designs6060105.Search in Google Scholar
[18] Deng R, Wang S, Hu Y, Wang Y, Wu T. The effect of hull form parameters on the hydrodynamic performance of a bulk carrier. J Mar Sci Eng. 2021;9(4):373. 10.3390/jmse9040373.Search in Google Scholar
[19] Lutfi MA, Prabowo AR, Do QT, Muttaqie T, Cho JH. Analysis of the internal-design factor to the patrol boat: A study of hull resistance using Savitsky and Holtrop approaches. IOP Conf Ser Earth Env Sci. 2023;1278(1):012014. 10.1088/1755-1315/1278/1/012014.Search in Google Scholar
[20] Meteorology, Climatology, and Geophysical Agency. Pusat Meteorologi Maritim. Badan Meteorol Klimatologi, Dan Geofis. 2024; https://maritim.bmkg.go.id/ (accessed October 11, 2024).Search in Google Scholar
[21] Yusfianda AR, Prabowo AR, Do QT, Adiputra R, Putranto T, Bae DM. Investigation of environmental factors on the resistance characteristic: Study case of the designed patrol boat hull. IOP Conf Ser Earth Env Sci. 2023;1278(1):012013. 10.1088/1755-1315/1278/1/012013.Search in Google Scholar
[22] Savitsky D. Hydrodynamic design of planing hulls. Mar Technol SNAME N. 1964;1(4):71–95.10.5957/mt1.1964.1.4.71Search in Google Scholar
[23] Ruponen P. Principles of ship buoyancy and stability. Aalto: Aalto University; 2021.Search in Google Scholar
[24] Pratama AS, Prabowo AR, Muhayat N, Putranto T, Tuswan T. Analysis of hull performance on fast patrol boat with an extended study of survivability under damaged conditions. IOP Conf Ser Earth Env Sci. 2023;1166(1):012046. 10.1088/1755-1315/1166/1/012046.Search in Google Scholar
[25] Zanakis SH, Solomon A, Wishart N, Dublish S. Multi-attribute decision making: A simulation comparison of select methods. Eur J Oper Res. 1998;107(97):507–29.10.1016/S0377-2217(97)00147-1Search in Google Scholar
[26] Zhang H, Liu Z, Zhan C, Feng B. A sensitivity analysis of a hull’s local characteristic parameters on ship resistance performance. J Mar Sci Technol. 2016;21(4):592–600. 10.1007/s00773-016-0378-x.Search in Google Scholar
[27] Saifullah NN, Prabowo AR, Muhayat N, Tuswan T, Harsito C, Adiputra R, et al. Leisure boat design: A comprehensive study of the shape and dimension effects on hydrodynamic performances. Evergreen. 2024;11(3):2091–119. 10.5109/7236854.Search in Google Scholar
[28] Ghazali MHM, Satar MHA, Rahiman W. Unmanned surface vehicles: From a hull design perspective. Ocean Eng. 2024;312:118977. 10.1016/j.oceaneng.2024.118977.Search in Google Scholar
[29] Tavakoli S, Zhang M, Kondratenko AA, Hirdaris S. A review on the hydrodynamics of planing hulls. Ocean Eng. 2024;303:117046. 10.1016/j.oceaneng.2024.117046.Search in Google Scholar
[30] Han Z, Jang J, Souppez J-BRG, Seo H-S, Oh D. Comparison of structural design and future trends in composite hulls: A regulatory review. Int J Nav Archit Ocean Eng. 2023;15:100558. 10.1016/j.ijnaoe.2023.100558.Search in Google Scholar
[31] Bahatmaka A, Wibowo MY, Ghyfery AA, Harits M, Anis S, Fitriyana DF, et al. Numerical approach of fishing vessel hull form to measure resistance profile and wave pattern of mono-hull design. J Adv Res Fluid Mech Therm Sci. 2023;104(1):1–11. 10.37934/arfmts.104.1.111.Search in Google Scholar
[32] Windyandari A, Sugeng S, Ridwan M, Yusim AK. Study on resistance performance of hexagonal hull form with variation of angle of attack, deadrise, and stern for flat-sided catamaran vessel. Curved Layer Struct. 2024;11(1):20240016. 10.1515/cls-2024-0016.Search in Google Scholar
[33] Ihsanudin WN, Prabowo AR, Muhayat N, Adiputra R, Bahatmaka A, Baek SJ. Estimating hydrodynamic performances of the designed leisure boats: a study considering hull shape and dimension variations. Eng Res Express. 2024;6(3):035506. 10.1088/2631-8695/ad5c28.Search in Google Scholar
[34] Fairlie-Clarke AC. Regression analysis of ship data. Int Shipbuild Prog. 1975;22(251):227–50. 10.3233/ISP-1975-2225101.Search in Google Scholar
[35] Julianto RI, Prabowo AR, Muhayat N, Putranto T, Adiputra R. Investigation of hull design to quantify resistance criteria using Holtrop’s regression-based method and Savitsky’s mathematical model: a study case of fishing vessels. J Eng Sci Technol. 2021;16(2):1426–43.Search in Google Scholar
[36] Ouyang ZL, Chen G, Zou ZJ. Identification modeling of ship maneuvering motion based on local Gaussian process regression. Ocean Eng. 2023;267:113251. 10.1016/j.oceaneng.2022.113251.Search in Google Scholar
[37] Kim M, Pipiras V, Reed AM, Weems K. Calibration of low-fidelity ship motion programs through regressions of high-fidelity forces. Ocean Eng. 2023;290:116321. 10.1016/j.oceaneng.2023.116321.Search in Google Scholar
[38] Hocek H, Yay S, Yazir D. Comprehensive analysis of ship detention probabilities using binary logistic regression method with machine learning. Ocean Eng. 2025;315:119889. 10.1016/j.oceaneng.2024.119889.Search in Google Scholar
[39] Shajaripour M, Zeraatgar H. Investigating the aerodynamic characteristics of high-speed planing catamarans through wind tunnel tests, CFD simulations, and regression analysis. Ocean Eng. 2025;338:121950. 10.1016/j.oceaneng.2025.121950.Search in Google Scholar
[40] Zhu M, Hahn A, Wen YQ, Sun WQ. Optimized support vector regression algorithm-based modeling of ship dynamics. Appl Ocean Res. 2019;90:101842. 10.1016/j.apor.2019.05.027.Search in Google Scholar
[41] Prabowo AR, Martono E, Muttaqie T, Tuswan T, Bae DM. Effect of hull design variations on the resistance profile and wave pattern: A case study of the patrol boat vessel. J Eng Sci Technol. 2022;17(1):106–26.Search in Google Scholar
[42] Chen X, Okada T, Kawamura Y, Mitsuyuki T. Estimation of directional wave spectra and hull structural responses based on measured hull data on 14,000 TEU large container ships. Mar Struct. 2021;80:103087. 10.1016/j.marstruc.2021.103087.Search in Google Scholar
[43] Takeuchi T, Osawa N, Tatsumi A, Inoue T, Hirakawa S, Seki N, et al. Fatigue assessment of ship structures based on equivalent wave probability (EWP) concept (1st report): Proposal of EWP concept and its verification by 8600TEU container ship’s onboard hull monitoring. Mar Struct. 2023;91:103476. 10.1016/j.marstruc.2023.103476.Search in Google Scholar
[44] Yu P, Qu S, Wang Q, Xie H. Numerical investigation on the slamming loads of a truncated trimaran hull entering regular waves. Appl Ocean Res. 2024;153:104253. 10.1016/j.apor.2024.104253.Search in Google Scholar
[45] Julianto RI, Muttaqie T, Adiputra R, Hadi S, Hidajat RLLG, Prabowo AR. Hydrodynamic and structural investigations of catamaran design. Proc Struct Integ. 2020;27:93–100. 10.1016/j.prostr.2020.07.013.Search in Google Scholar
[46] Thomson I. Virtual hull monitoring of a naval vessel using hindcast data and reconstructed 2-D wave spectra. Mar Struct. 2020;71:102730. 10.1016/j.marstruc.2020.102730.Search in Google Scholar
[47] Nguyen VM, Jeon M, Yoon HK. Study on the optimal weather routing of a ship considering parametric rolling, slamming and deck wetness. 13th International Symposium on Practical Design of Ships and Other Floating Structures (PRADS'2016). Copenhagen, Denmark: 2016.Search in Google Scholar
[48] Febrianto RA, Prabowo AR, Baek SJ, Adiputra R. Analysis of Monohull design characteristics as supporting vessel for the COVID-19 medical treatment and logistic. Transp Res Proc. 2021;55:699–706. 10.1016/j.trpro.2021.07.038.Search in Google Scholar
[49] Lutfi MA, Prabowo AR, Muslimy EM, Muttaqie T, Muhayat N, Diatmaja H, et al. Leisure boat concept design: Study on the influence of hull form and dimension to increase hydrodynamic performance. Int J Mech Eng Robot Res. 2024;13(1):139–61. 10.18178/ijmerr.13.1.139-161.Search in Google Scholar
[50] Belibassakis KA. Roll response of ship-hull sections in variable bathymetry regions by a hybrid BEM-vortex particle method. J Hydrodyn Ser B. 2010;22(5):413–8. 10.1016/S1001-6058(09)60229-8.Search in Google Scholar
[51] Hu Y, Tong Z, Tong S, Yang X. Investigating the dynamic behavior of marine gear transmission system considering ship rolling motion. Int J Mech Sci. 2025;290:110126. 10.1016/j.ijmecsci.2025.110126.Search in Google Scholar
[52] Wang M, Wei Z, Wang J, Yu X, Kapitaniak T. Stochastic bifurcation and chaos study for nonlinear ship rolling motion with random excitation and delayed feedback controls. Phys D Nonlinear Phenom. 2024;462:134147. 10.1016/j.physd.2024.134147.Search in Google Scholar
[53] Scamardella A, Piscopo V. Passenger ship seakeeping optimization by the overall motion sickness incidence. Ocean Eng. 2014;76:86–97. 10.1016/j.oceaneng.2013.12.005.Search in Google Scholar
[54] Faletans CDTD, Misericordia M, Vallier JM, Duché P, Watelain E. Effects of dynamic visual feedback system on seasickness. Appl Erg. 2024;119:104318. 10.1016/j.apergo.2024.104318.Search in Google Scholar PubMed
[55] Carchen A, Gaggero T, Besio G, Mazzino A, Villa D. A method for the probabilistic assessment of the on-board comfort on a passenger vessel route. Ocean Eng. 2021;225:108702. 10.1016/j.oceaneng.2021.108702.Search in Google Scholar
[56] Khalid H, Turan O, Bos JE, Incecik A. Application of the subjective vertical–horizontal-conflict physiological motion sickness model to the field trials of contemporary vessels. Ocean Eng. 2011;38(1):22–33. 10.1016/j.oceaneng.2010.09.008.Search in Google Scholar
[57] Piscopo V, Scamardella A. The overall motion sickness incidence applied to catamarans. Int J Nav Archit Ocean Eng. 2015;7(4):655–69. 10.1515/ijnaoe-2015-0046.Search in Google Scholar
© 2025 the author(s), published by De Gruyter
This work is licensed under the Creative Commons Attribution 4.0 International License.
Articles in the same Issue
- Research Articles
- Layerwise generalized formulation solved via a boundary discontinuous method for multilayered structures. Part 1: Plates
- Thermoelastic interactions in functionally graded materials without energy dissipation
- Layerwise generalized formulation solved via boundary discontinuous method for multilayered structures. Part 2: Shells
- Visual scripting approach for structural safety assessment of masonry walls
- Nonlinear analysis of generalized thermoelastic interaction in unbounded thermoelastic media
- Study of heat transfer through functionally graded material fins using analytical and numerical investigations
- Analysis of magneto-aerothermal load effects on variable nonlocal dynamics of functionally graded nanobeams using Bernstein polynomials
- Effective thickness of gallium arsenide on the transverse electric and transverse magnetic modes
- Investigating the behavior of above-ground concrete tanks under the blast load regarding the fluid-structure interaction
- Numerical study on the effect of V-notch on the penetration of grounding incidents in stiffened plates
- Thermo-elastic analysis of curved beam made of functionally graded material with variable parameters
- Effect of curved geometrical aspects of Savonius rotor on turbine performance using factorial design analysis
- A mechanical and microstructural investigation of friction stir processed AZ31B Mg alloy-SiC composites
- Mechanical design of engineered-curved patrol boat hull based on the geometric parameters and hydrodynamic criteria
- Review Article
- Technological developments of amphibious aircraft designs: Research milestone and current achievement
- Special Issue: TS-IMSM 2024
- Influence of propeller shaft angles on the speed performance of composite fishing boats
- Design optimization of Bakelite support for LNG ISO tank 40 ft using finite element analysis