Isotope dilution-liquid chromatography-tandem mass spectrometry-based candidate reference measurement procedures for the quantification of 24(R),25-dihydroxyvitamin D2 and 24(R),25-dihydroxyvitamin D3 in human serum and plasma
-
Kerstin Kandler


Abstract
Objectives
Isotope dilution-liquid chromatography-tandem mass spectrometry (ID-LC MS/MS)-based candidate reference measurement procedures (RMPs) for the quantification of 24,25(OH)2D2 and 24,25(OH)2D3 in human serum and plasma are presented.
Methods
Quantitative nuclear magnetic resonance (qNMR) spectroscopic methodology was utilized to assign absolute content (g/g) and SI-traceability to reference materials used as primary calibrators. For liquid chromatography-tandem mass spectrometry (LC-MS/MS) analysis a two-dimensional heart cut LC approach, in combination with a supported liquid extraction protocol, was established to mitigate matrix effects and prevent co-elution of interferences. Selectivity was determined by spiking the internal standards and similar compounds, in human serum. A post-column infusion experiment and comparison of standard line slopes was performed to evaluate matrix effects. Precision and accuracy were assessed via a multi-day validation experiment, utilizing certified secondary reference materials from the National Institute of Standards and Technology (NIST). Measurement uncertainty (MU) was evaluated per the Guide to the Expression of Uncertainty in Measurement (GUM). To demonstrate equivalence with the JCTLM-listed RMP, certified secondary reference materials were utilized. Additionally, a method comparison study was conducted with the 24,25(OH)2D3 method used by the CDC Vitamin D Reference Laboratory.
Results
The RMP allowed quantification of 24,25(OH)2D2 and 24,25(OH)2D3 within the range of 0.150–18.0 ng/mL (0.350–42.0 nmol/L 24,25(OH)2D2 and 0.360–43.2 nmol/L 24,25(OH)2D3) without interference from structurally-related compounds and no evidence of matrix effects. Intermediate precision was ≤2.3 % for 24,25(OH)2D2 and ≤2.9 % for 24,25(OH)2D3; repeatability was ≤1.4 % for 24,25(OH)2D2 and ≤2.1 % for 24,25(OH)2D3, across all concentration levels. The relative mean bias was −4.5 to 2.9 % for 24,25(OH)2D2, and −3.7 to 3.6 % for 24,25(OH)2D3. Expanded MU for reference value assignment for 24,25(OH)2D2 and 24,25(OH)2D3 for reference value assignment was ≤2.5 %, regardless of concentration level and sample type. Passing-Bablok regression revealed strong agreement between the 24,25(OH)2D3 results from the candidate RMPs and those provided by the CDC Vitamin D Reference Laboratory.
Conclusions
These RMPs permit accurate and reproducible determination of 24,25(OH)2D2 and 24,25(OH)2D3. Implementation of these methods supports routine assay standardization and patient sample measurement with confirmed traceability.
Introduction
Vitamin D refers to a group of lipophilic molecules with multisystemic importance, especially in the musculoskeletal system [1], [2], [3]. Deviations from the normal range of vitamin D metabolite concentrations are associated with a correspondingly wide range of pathologies [2], [3], [4], [5]. The major forms of vitamin D, ergocalciferol (D2) and cholecalciferol (D3), are first ingested or synthesized in the skin before being metabolized via multiple CYP-enzyme-mediated hydroxylation reactions. Following hydroxylation to 25-hydroxyvitamin D (25[OH]D), the major circulating form, 25(OH)D is converted to the active metabolite, 1,25-dihydroxyvitamin D (1,25[OH]2D) [6], [7], [8]. 25(OH)D and 1,25(OH)2D are both hydroxylated at position 24 by CYP24A1 to the inactive metabolites, 24,25-dihydroxyvitamin D (24,25[OH]2D) and 1,24,25-trihydroxyvitamin D (1,24,25[OH]3D), respectively, before excretion [6], 9].
While there is much clinical focus on vitamin D deficiency, hypervitaminosis D is associated with similar levels of morbidity [8]. This often manifests as hypercalciuria and hypercalcemia [8], [10], [11], [12], [13]. In addition to overdose of vitamin D supplementation, hypervitaminosis D can be a consequence of a genetic mutation in CYP24A1 [8], 12], 14]. Since 24,25(OH)2D is the main catabolite obtained from the reaction catalyzed by CYP24A1, its assessment is useful for identifying CYP24A1 mutations as a cause of hypercalcemia and recurrent kidney stones, especially in patients undergoing vitamin D supplementation. Current methodology for the identification of CYP24A1 mutations seeks to establish the vitamin D metabolite ratio (VMR) for 25(OH)D and 24,25(OH)2D, with an excess of 25(OH)D indicating potential mutations [14], 15]. Additionally, VMR shows a stronger association with clinical outcomes related to vitamin D status compared to 25(OH)D and has, therefore, been proposed as another indicator of vitamin D sufficiency [16], [17], [18], [19].
To assess VMR, serum levels of 25(OH)D and 24,25(OH)2D must be determined with accuracy and precision. It is only with the development of liquid chromatography-tandem mass spectrometry (LC-MS/MS) that rapid, specific, and selective determination of such analytes has become possible [20], 21]. Interlaboratory methodological heterogeneity and resulting variations in precision and accuracy, remain, however, a cause for concern [21], [22], [23]. There is, therefore, a strong need for a validated reference measurement procedure (RMP) to ensure measurement accuracy and reduce variability between laboratories [23], 24].
While the Joint Committee on Traceability in Laboratory Medicine (JCTLM) lists several higher-order RMPs for measuring serum 25(OH)D [25], [26], [27], there is only one listed for 24(R),25-dihydroxyvtiamin D3 (24,25[OH]2D3) [28], and none for 24(R),25-dihydroxyvtiamin D2 (24,25[OH]2D2). Nor are there any JCTLM-approved Certified Reference Materials (CRMs) for 24,25(OH)2D [20], though a 24,25(OH)2D3 neat solution for instrument calibration and secondary reference materials with reference values for 24,25(OH)2D3 are offered by the National Institute of Standards and Technology (NIST) [29], 30].
We aim to establish candidate RMPs for determining 24,25(OH)2D2 and 24,25(OH)2D3 in human serum and plasma that satisfy International Organization for Standardization (ISO) guidelines for reference measurement procedures (ISO 15193) [31].
We have employed quantitative nuclear magnetic resonance spectroscopy (qNMR) to characterize reference materials for 24,25(OH)2D2 and 24,25(OH)2D3 for the calibration of the LC-MS/MS assays in order to ensure correct mass fraction value and SI-traceability [32], 33]. The qNMR findings with respect to quantitative resonance, impurities, reactivity, solvent profile and kinetics of vitamin D vitamers have already been published by our group [34]. In this manuscript, we present our qNMR target value assignments for both the dihydroxyvitamin D analytes and provide an overview of the relevant vitamin D conformers and the probability of homolytic bond-cleavage based on high-level quantum chemical calculations.
Analytical performance specifications (APS) for these RMPs were assessed on the basis of biological variation data (BV). Since values for 24,25(OH)2D2 and D3 are not available in the European Federation of Clinical Chemistry and Laboratory Medicine (EFLM) database, we relied on literature data. In particular, we referred to results obtained by Cavalier et al. [35], demonstrating that methods to detect a significant change linked to the natural production of 24,25(OH)2D at a significance level of p<0.05 (less than 5 % probability that the observed change results from chance) would need a relative MU<14.9 %, while at a significance level of p<0.01, MU should be <10.5 % [36]. Based on these results and the rule that measurement uncertainty of an RMP should be less than one-third of the measurement uncertainty of a routine assay, an RMP able to detect a weekly variation in the metabolite should have an MU <3.3 % [23], 35], 37], 38].
Materials and methods
A detailed operations procedure for the test procedure methodology, as well as a list of laboratory equipment and relative requirements, can be found in Supplementary Material 1 and Supplementary Material 2.
Throughout the document, the abbreviations 25(OH)D and 24,25(OH)2D refer to the two major forms of vitamin D, vitamin D2 (ergocalciferol) and vitamin D3 (cholecalciferol).
Chemicals and reagents
24,25(OH)2D2 (CAS: 71183-99-8), its internal standard 24(R),25-dihydroxyvitamin D2-(26, 26, 26, 27, 27, 27-d6) (24,25(OH)2D2-d6; CAS: n.a.) and 3-epi-24(R),25-dihydroxyvitamin D2 (3-epi-24,25(OH)2D2; CAS: n.a.) from Endotherm–Life Science Molecules (Saarbruecken, Germany) were used.
24,25(OH)2D3 (CAS: 55721-11-4), obtained from MedChemExpress (MCE®, Monmouth Junction, USA), was purchased from Hoelzel Biotech (Cologne, Germany). The internal standards, 24,25(OH)2D3-(26, 26, 26, 27, 27, 27,-d6) (24,25(OH)2D3-d6; CAS: n.a.) in ethanol and 3-epi-24(R),25-dihydroxyvitamin D3 (CAS: 272776-87-1) in ethanol, were obtained from Entegris Inc-IsoSciences (Ambler, USA). 24,25(OH)2D3 calibration solution in ethanol (SRM 2971) and the secondary reference materials (SRM 972a, SRM 2973) were obtained from the National Institute of Standards and Technology (NIST, Gaithersburg, MD, USA). 1(α),25-dihydroxyvitamin D2 (1(α),25(OH)2D2; CAS: 60133-18-3) and 1(α),25-dihydroxyvitamin D3 (1(α),25(OH)2D3; CAS: 32222-06-3) were obtained from Cerilliant (Round Rock, TX, USA), 25,26-dihydroxyvitamin D3 (25,26(OH)2D3; CAS: 29261-12-9) from BOC Sciences (Shirley, NY, USA), and 23(S),25-dihydroxyvitamin D3 (23(S),25(OH)2D3; CAS: n.a.) from Endotherm (Saarbruecken, Germany). The qNMR internal standard, tecnazene (Batch No. BCCD1553), was obtained from Sigma-Aldrich, Germany.
Vitamin D-depleted human serum was obtained from Roche Diagnostics GmbH (Penzberg, Germany). Mixed gender native plasma pools (Li-heparin [CUST-BB-17022020-4C], dipotassium (K2)-ethylene diamine tetraacetic acid (EDTA) [CUST-BB-17022020-4D], and tripotassium (K3) EDTA [CUST-BB-17022020-4E] were purchased from Biotrend (Cologne, Germany). The native human serum pools for both analytes consisted of five samples. According to the Declaration of Helsinki, all native serum and plasma patient samples were anonymized samples.
Sodium carbonate (CAS: 497-19-8), sodium hydrogen carbonate (CAS: 144-55-8), ammonium fluoride (CAS: 12125-01-8), ethanol absolute for analysis (CAS: 64-17-5), and ethyl acetate (CAS: 141-78-6) were purchased from Merck (Darmstadt, Germany). Methanol (CAS: 67-17-5) LC-MS grade was obtained from Biosolve (Valkenswaard, The Netherlands). Water was purified in-house using a Millipore Milli-Q® IQ 7000 system from Merck (Darmstadt, Germany).
qNMR characterization of 24,25-dihydroxyvitamin D2/D3 and quantum chemical calculations
qNMR experiments were performed on a Jeol 600 MHz NMR equipped with a Helium-cryoprobe. For both the analytes, single-pulse-1H{13C}NMR was utilized for the quantitation (alkene proton; δ=6.25 ppm; 1H; tecnazene as qNMR internal standard; CDCl3 as solvent) with an inter-scan delay of 70 s (Supplementary Material 3 Figures 1–4). All the qNMR details about impurities, quantitative resonance, and chemistry in solution have already been published [33], 34]. Further details relevant to this manuscript are available in the Supplementary Material 3.
Additionally, we also performed quantum chemical calculations to ascertain the conformer distribution of both the vitamin D analytes in solution because the Boltzmann average of these structures constitute the NMR spectrum. Computational calculations to determine the most reactive chemical bond towards H-Atom transfer (HAT analysis) was also performed owing to the alleged photo-instability of the analytes. Finally DFT single-point calculations were performed at the wB97X-V/def2TZVP level of theory and all the information is presented in the Supplementary Material 3. These theoretical analyses contributed in the determination of ideal quantitative resonance for both the analytes along with experimentally available data in the literature.
Preparation of calibrators and quality control (QC) samples
The preparation of calibrator and quality control (QC) samples is described in detail in Supplementary Material 1 and Supplementary Material 2.
To summarize, three independently weighed calibration stock solutions were prepared for each of 24,25(OH)2D2 and 24,25(OH)2D3. For each stock solution, 1 mg of 24,25(OH)2D2 or 24,25(OH)2D3 was weighed using an ultra-microbalance (XP6U/M, Mettler Toledo) and dissolved in 1 mL ethanol, to obtain a concentration of 1.00 mg/mL (2.33 mmol/L 24,25(OH)2D2 and 2.40 mmol/L 24,25(OH)2D3). The exact concentration of each stock solution was calculated based on the purity determined by qNMR (24,25(OH)2D2: 91.1 ± 0.5 %; 24,25(OH)2D3: 97.1 ± 0.2 %). Primary stock solutions were diluted further with 50 % ethanol to achieve three working solutions per analyte; working solutions 1 and 3 with a concentration of 5.00 μg/mL (11.7 μmol/L 24,25(OH)2D2 and 12.0 μmol/L 24,25(OH)2D3) and working solution 2 with a concentration of 10.0 μg/mL (23.3 μmol/L 24,25(OH)2D2 and 24.0 μmol/L 24,25(OH)2D3). Working solutions 1 and 2 were used to prepare eight calibrator spike solutions per analyte, with concentrations of 7.50–900 ng/mL (17.5–2,100 nmol/L 24,25(OH)2D2 and 18.0–2,160 nmol/L 24,25(OH)2D3). These spike solutions were diluted in a vitamin D-depleted human serum matrix (1+49 v+v), resulting in uniformly distributed calibrator levels in the range of 0.150–18.0 ng/mL (0.350–42.0 nmol/L 24,25(OH)2D2 and 0.360–43.2 nmol/L 24,25(OH)2D3).
The third working solution prepared for each analyte was used to create three QC spike solutions for 24,25(OH)2D2, and two QC spike solutions for 24,25(OH)2D3. Furthermore, for 24,25(OH)2D3, the NIST calibration solution (SRM 2971) was used to prepare one spike solution (QC 2) by diluting the solution with Millipore water (1+1 v+v). For 24,25(OH)2D2 two QC samples were spiked in vitamin D depleted human serum matrix (1+49 v+v), resulting in QC 1 and QC 3 with concentrations of 0.450 ng/mL (1.05 nmol/L) and 15.0 ng/mL (35.0 nmol/L), respectively. The third QC level was spiked in a native patient sample with low endogenous content (1+49 v+v), resulting in a concentration of approximately 5.00 ng/mL (11.7 nmol/L). For 24,25(OH)2D3, all three QC spike solutions were diluted in vitamin D depleted human serum matrix (1+49 v+v) to produce QC samples with concentrations of 0.450, 8.31, and 15.0 ng/mL (1.08, 19.9 and 36.0 nmol/L). In addition to the three self-spiked QC samples, the secondary reference material SRM 2973 was used as a QC sample.
Internal standard (ISTD) solution
For 24,25(OH)2D2, the ISTD was prepared by dissolving the commercially available internal standard 24,25(OH)2D2-d6 in ethanol to produce a stock solution with a concentration of 1 mg/mL (2.30 mmol/L). The stock solution was diluted with 50 % ethanol to produce an ISTD dilution of 1,000 ng/mL (2,300 nmol/L). To generate the final ISTD working solution with a concentration of 16.5 ng/mL (38.0 nmol/L), the ISTD dilution was further diluted with 50 % ethanol.
For 24,25(OH)2D3, the ISTD was prepared by diluting the commercially available internal standard solution of 24,25(OH)2D3-d6 with 50 % ethanol to produce an ISTD solution with a concentration of 1,000 ng/mL (2,366 nmol/L). This ISTD solution was further diluted with 50 % ethanol to produce an ISTD working solution with a concentration of 17.7 ng/mL (41.9 nmol/L).
To enable quantification of both analytes from a single sample, an ISTD mix solution was created by combining 885 µL of the ISTD solution for 24,25(OH)2D2 with 825 µL of that for 24,25(OH)2D3 and 50 mL of 50 % ethanol. The resulting ISTD mix working solution contained approximate concentrations of 24,25(OH)2D2-d6 and 24,25(OH)2D3-d6 matching those in their individual ISTD working solutions.
Sample preparation
A sample preparation protocol based on Supported Liquid Extraction (SLE) has been optimized for use in both analytes. The decision to use an individual analyte ISTD solution or ISTD mix solution depends on whether one or both analytes are being quantified. As sample matrix serum, both plasma (Li-heparin plasma, K2EDTA plasma, and K3EDTA plasma) and vitamin D-depleted serum can be used.
Samples for both methods were prepared by mixing 400 µL of sample (unknown native sample, serum calibrator, or QC) with 40 µL of the appropriate ISTD working solution in a 2.0 mL brown micro tube. The samples were then incubated in an overhead mixer (Sarstedt Sarmix M2000) for 15 min (min) at 30 rpm, room temperature, centrifuged (Eppendorf 5430R or 5810R; 10 s, 3,000 rcf), and incubated in a thermomixer (Eppendorf 5382 thermomixer C; 10 min, 1,400 rpm) with 560 µL of protein release agent (50 mm aqueous carbonate buffer). Analyte extraction was performed by loading 950 µL of the sample onto an SLE cartridge (Phenomenex) with an initial vacuum (≥20 kPa) of 5 s; this was then allowed to settle for 15 min. Elution was performed twice using 2.5 mL ethyl acetate, with the extract evaporated to dryness in a nitrogen evaporation system (Biotage, Uppsala, Sweden; 30 °C, 1.3 mL/min, 45 min) and the residue reconstituted in 100 µL resuspension solution comprised of methanol and ultrapure water (4+1 v+v). The solution was filtered using centrifuge filter (0.22 µm, 5 min, 11000 rcf) and transferred into an amber 1.5 mL sample vial with a 100 µL insert. Precautions were taken to protect the samples from intense UV light, direct sunlight, and heat.
Liquid chromatography-tandem mass spectrometry (LC-MS/MS)
For quantification we used a triple quadrupole mass spectrometer (Thermo Fisher TSQ Altis) coupled to a high-pressure liquid chromatography (HPLC) system with two pumps and a two position 6-port switching valve (Thermo Fisher Vanquish Horizon).
Chromatographic separation of both analytes was achieved using two-dimensional heart-cut liquid chromatography with a combination of two orthogonal stationary phases, to minimize both matrix effects and the co-elution of isobaric interferences. In the first dimension, a Fisher Scientific Hypersil Gold C4 (50 × 2.1 mm; 1.9 µm) with UltraShield ultra-high pressure liquid chromatography (UHPLC) PreColumn Filter (Restek 0.5 µm frit) was utilized for both analytes. However, the column length of the stationary phase varied depending on analyte in the second dimension (Phenomenex Kinetex F5 150 × 2.1 mm, 1.7 µm for 24,25(OH)2D2 and 100 × 2.1 mm, 1.7 µm for 24,25(OH)2D3). In both dimensions, chromatographic separation was achieved using individual gradient programs over 12 min for 24,25(OH)2D2 and 14 min for 24,25(OH)2D3, respectively. Mobile phases consisted of water (A1), water containing 0.2 mM ammonium fluoride (A2), and methanol (B1 and B2). Column temperature was kept at 30 °C. The injection volume was 15 µL for both methods.
Both analytes were detected in multi-reaction monitoring (MRM) mode using a Thermo Fisher TSQ Altis mass spectrometer operating in positive electrospray ionization mode. The quantifier and corresponding internal standard ion transitions (24,25(OH)2D2 m/z 393.3 → 268.3 and 24,25(OH)2D2-d6 m/z 399.4 → 268.3; 24,25(OH)2D3 m/z 417.3 → 381.3 and 24,25(OH)2D2-d6 m/z 423.4 → 387.4) served as the basis for quantification, while additional qualifier transitions (24,25(OH)2D2 m/z 393.4 → 224.3 and 24,25(OH)2D3 m/z 417.3 → 121.1) were monitored to identify for unknown interferences. The LC and MS methods are fully reported in Supplementary Material 1 and Supplementary Material 2.
System suitability test (SST)
To assure the long-term stability of the method, a system suitability test (SST) was established to examine sensitivity and chromatographic resolution before every sequence. Two sample levels (SST1 and SST2) were prepared in 80 % methanol, containing 24,25(OH)2D2, 3-Epi-24,25(OH)2D2, and 24,25(OH)2D2-d6 for the 24,25(OH)2D2 method and 24,25(OH)2D3, 3-Epi-24,25(OH)2D3, and 24,25(OH)2D3-d6 for the 24,25(OH)2D3 method.
To pass the SST, signal-to-noise ratios (S/n) for the quantifier transition of sample SST1 were required to be ≥50 S/n and ≥200 S/n for 24,25(OH)2D2 and 24,25(OH)2D3, respectively. Additionally, retention times of 9.9 ± 0.6 min for 24,25(OH)2D2 and 12.7 ± 0.6 min for 24,25(OH)2D3 were required in order to pass the SST. In addition, the separation of the epimers from their respective analytes had to be shown with a resolution ≥1.5.
To examine potential carryover, sample SST2 was injected, followed by two solvent blanks. To pass the SST, the analyte peak areas observed in the first blank were required to be ≤20 % of the analyte peak areas of the respective SST1.
Calibration and structure of analytical series
Calibrator levels (1–8) were measured at increasing concentrations at the beginning and the end of every sequence. Calibration functions were obtained by quadratic regression of the area ratios of the analyte and ISTD (y) against the analyte concentration (x), resulting in the function y=a 2 x 2 + a 1 x + a 0. The regression is regression is weighted with the factor 1/x 2.
The individual sequence setup varied due to specific measurement requirements and the intended use of the RMP (see Supplementary Material 1 and Supplementary Material 2). If reference values were assigned, the number of sample preparations (n=x) was dependent on the desired measurement uncertainty, and samples were measured on at least two different days. If a method comparison study was performed, or complaint samples were measured, samples were prepared (n=1) and measured.
Data processing
To process the raw data file, ThermoScientific™ Dionex™ Chromeleon™ 7.2.10 software was used. Extracted ion chromatograms for each transition are smoothed with 3 point Gaussian smoothing. The Cobra algorithm is used for peak integration with analyte specific settings (see Supplementary Materials 1 and 2).
Method validation
Assay validation and determination of MU were performed in accordance with established guidelines. These guidelines include the Clinical and Laboratory Standards Institute’s C62A Liquid Chromatography-Mass Spectrometry Methods [39], 40], and the Guide to the expression of uncertainty in measurement (GUM) [41].
Selectivity/specificity
Selectivity was evaluated by spiking the ISTDs 24,25(OH)2D2-d6, 24,25(OH)2D3-d6, and the interferences 3-epi-24,25(OH)2D2 and 3-epi-24,25(OH)2D3, into a native human serum pool containing endogenous 24,25(OH)2D2 and 24,25(OH)2D3. Additional interferences, specifically 1(α),25(OH)2D2, 1(α),25(OH)2D3, 24(S),25-dihydroxyvitamin D3 (23(S),25(OH)2D3), and 25,26(OH)2D3, were spiked, along with the corresponding analyte, into vitamin D-depleted serum. All interferences had to be baseline separated from the corresponding analyte and show a resolution of ≥1.5.
To prove the method was specific, the vitamin D depleted serum and native human serum pool were checked at their expected retention times to identify possible interfering matrix signals. In addition, vitamin D-depleted serum was spiked with 24,25(OH)2D2-d6 and 24,25(OH)2D3-d6 then measured to determine the amount of residual unlabeled analyte in the ISTD.
Matrix effects
Possible matrix effects were determined by a post-column infusion experiment. A neat solution containing 24,25(OH)2D2, 24,25(OH)2D2-d6, and a solution containing 24,25(OH)2D3 and 24,25(OH)2D3-d6 was infused at a constant flow rate of 5 μL/min. Processed samples (80 % methanol [v+v], vitamin D depleted serum, native human serum pool, and plasma matrices [K2EDTA, K3EDTA, and Li-heparin]) were injected to evaluate ion enhancement or suppression effects.
In addition, a quantitative experiment based on the comparison of standard line slopes was performed. For this purpose, calibrator sets were prepared in 80 % methanol (v+v), vitamin D-depleted serum, native human serum pool, and Li-heparin plasma for both analytes. Additionally, an ethanolic calibration solution for 24,25(OH)2D3, available from NIST (SRM 2971), was used for the preparation of a calibrator set. All samples were measured once, then the resulting slopes, confidence intervals, and correlation coefficients were compared.
Furthermore, the neat calibration was set as standard and the calibrator levels prepared in matrix were examined as controls. Recoveries were reported as the percentage recovery of the measured concentration, relative to the nominal concentration.
Precision, trueness and accuracy
Precision of the method was assessed by performing a five-day validation experiment, as previously described by Taibon et al. [42]. An analysis of variance (ANOVA)-based variance component analysis was used to determine the total variability (type A uncertainty) of the method; this was performed in Biowarp, an internal statistics program based on the VCA Roche Open Source software package in R.
For 24,25(OH)2D3, two levels of the certified secondary reference material from the National Institute of Standards and Technology (NIST SRM 972a level 1: 2.66 ng/mL [6.38 nmol/L], and NIST SRM 972a level 2: 1.41 ng/mL [3.39 nmol/L]) were used. Furthermore, for each analyte, three levels of spiked vitamin D-depleted serum were used to cover the measuring range of both analytes. The spiked levels were set at 0.450, 5.00, and 15.0 ng/mL for 24,25(OH)2D2 (1.05, 11.7 and 35.0 nmol/L), and 0.450, 8.31, and 15.0 ng/mL for 24,25(OH)2D3 (1.08, 19.9 and 36.0 nmol/L). Additionally, a native serum sample was included, with approximate concentrations of 24,25(OH)2D2 at 0.241 ng/mL (0.562 nmol/L) and 24,25(OH)2D3 at 3.21 ng/mL (7.70 nmol/L). In this study, samples were prepared in triplicate for two distinct measuring parts, referred to as ‘part A’ and ‘part B’. Each sample was injected twice for each part, resulting in a total of 12 measurements per day and 60 measurements over a span of five days. Individual calibrator levels were prepared for each part of the study.
In order to evaluate the accuracy and trueness of the method, the same samples, excluding native serum samples, were employed. Additionally, to assess accuracy and trueness in plasma, Li-heparin plasma was fortified with the same concentration levels as in the serum samples. Determination of the nominal concentration took into consideration the concentration of residual endogenous 24,25(OH)2D2 and 24,25(OH)2D3.
For each part, all samples were prepared in triplicate on a single day, resulting in a total of six sample preparations. Accuracy was evaluated by examining the level of agreement between each test result and the accepted reference value. Trueness was assessed by comparing the average value obtained from a series of test results with the nominal concentration or accepted reference value to determine the level of agreement.
Linearity
In order to assess linearity, independent calibrator sets were spiked in triplicate with vitamin D depleted serum. These calibrator sets encompassed an extended calibration range of 20 % at both the upper and lower ends of the range (0.120–22.0 ng/mL, 0.280–51.3 nmol/L 24,25(OH)2D2 and 0.288–52.8 nmol/L 24,25(OH)2D3). Each calibrator set was prepared using individual weightings based on described test procedures. Calibration curves were evaluated using a linear and quadratic fit, both with 1/x 2 weighting. The correlation coefficient had to be ≥0.99 and the residuals, randomly distributed.
In addition, to confirm the linearity of the methods, a high concentration native sample was serially diluted with a low concentration native sample for 24,25(OH)2D2, while a high concentration native sample was serially diluted with vitamin D-depleted serum for 24,25(OH)2D3. To achieve the desired concentration for the upper limit of the measuring ranges the high concentration native samples were spiked with 24,25(OH)2D2 and 24,25(OH)2D3 to approximately 18.0 ng/mL (42.0 nmol/L 24,25(OH)2D2 43.2 nmol/L 24,25(OH)2D3). Final samples were prepared by serial dilution following specific ratios (10+0, 9+1, 8+2, 7+3, etc.). Recovery was reported as the measured concentration recovered, relative to the nominal concentration of the sample pools.
Lower limit of the measuring interval (LLMI)
The lower limit of the measuring interval (LLMI) was determined using spiked samples in vitamin D depleted serum at the concentration of the lowest calibrator level (0.150 ng/mL for both analytes; 0.350 nmol/L 24,25(OH)2D2 and 0.360 nmol/L 24,25(OH)2D3). Two sample preparations (n=1 for each part A and B) were performed over a period of five days and injected twice, resulting in a total of 20 measurements. Recovery, bias, and precision were determined.
Sample stability
The stability of processed samples stored at 6 °C in the autosampler was investigated over periods of 16 (24,25(OH)2D2) and 23 days (24,25(OH)2D3). To assess stability, spiked samples from the precision experiment were re-measured (n=1 for each time point), and recoveries were calculated by comparing the measured values with the nominal concentration.
In addition, the stability of spike solutions was evaluated by using spike solutions from three calibrator and QC levels (low, mid, high) that had been stored at −80 °C for durations of 81 (24,25(OH)2D2) and 71 weeks (24,25(OH)2D3). These spike solutions were then used to prepare matrix-based levels, which were quantified using a calibrator set spiked with freshly prepared spike solutions.
Furthermore, the stability of matrix-based calibrator and QC material stored at −80 °C was assessed over periods of 62 (24,25(OH)2D2) and 51 weeks (24,25(OH)2D3), and recoveries were determined using freshly prepared calibrator levels. All samples were prepared and measured once for each time point.
Method comparison study
A method comparison study was performed by analyzing 31 samples supplied by the Centers for Disease Control (CDC) Vitamin D Standardization-Certification Program (VDSCP) using the candidate RMP as the comparative method. The concentrations of 24,25(OH)2D3 provided by the CDC were considered target values rather than reference values, as they were not determined using a JCTLM-listed RMP.
Estimation of measurement uncertainty (MU)
The MU was determined following the guidelines provided in the GUM [41] and described in Taibon et al. [42]. The calculation involved several steps, including characterization of the qNMR reference material purity; weighing; preparation of stock, working, spike, and calibrator solutions; preparation of ISTD solutions, preparation of calibrator samples; measurement of calibrators and generation of the calibration curve; preparation of unknown samples, and, finally, measurement and evaluation of the sample results.
For the preparation of calibrators (unccal), estimation of MU was carried out using type B evaluation. For other aspects, such as precision (uncprec), type A evaluation was performed. Reference values were determined by averaging multiple sample preparations conducted on different days. The MU was obtained by combining the unccal with the uncertainty (SD) of the mean of the measurement results (uncmean). To achieve a confidence level of 95 %, assuming a normal distribution, the resulting MU was multiplied by a coverage factor of k=2. For more detailed information, please refer to Supplementary Material 4.
Results
Traceability
The most important aspect of the reference measurement procedure is its traceability to the SI-unit kilogram, which has been established by utilizing.
Tecnazene was used as the qNMR ISTD, which is directly traceable to the NIST PS1 (primary qNMR standard). Utilizing the above-mentioned parameters, n=3 measurements for 24,25-dihydroxyvitamin D2 (Endotherm, Lot No. ERI2483FR2A) yield an absolute content of 91.1±0.5 % (k=1). For 24,25-dihydroxyvitamin D3 (MedChemExpress, Lot No. 08808) an absolute content value of 97.1±0.2 % (k=1) was determined with n=3 measurements.
Selectivity/specificity
Chromatographic separation of 24,25(OH)2D2, 24,25(OH)2D3, and their interferences was achieved using the respective two-dimensional heart cut LC approach. The interferences 1(α),25(OH)2D2, 1(α),25(OH)2D3 and 25,26(OH)2D3 were separated from the analyte in the first dimension and not transferred to the second dimension. In contrast 3-epi-24,25(OH)2D2, 3-epi-24,25(OH)2D3, and 23(S),25(OH)2D3 were transferred to the second dimension and separated from 24,25(OH)2D2 and 24,25(OH)2D3 with a resolution of (R)≥2.1 and (R)≥1.7, respectively (Figure 1).
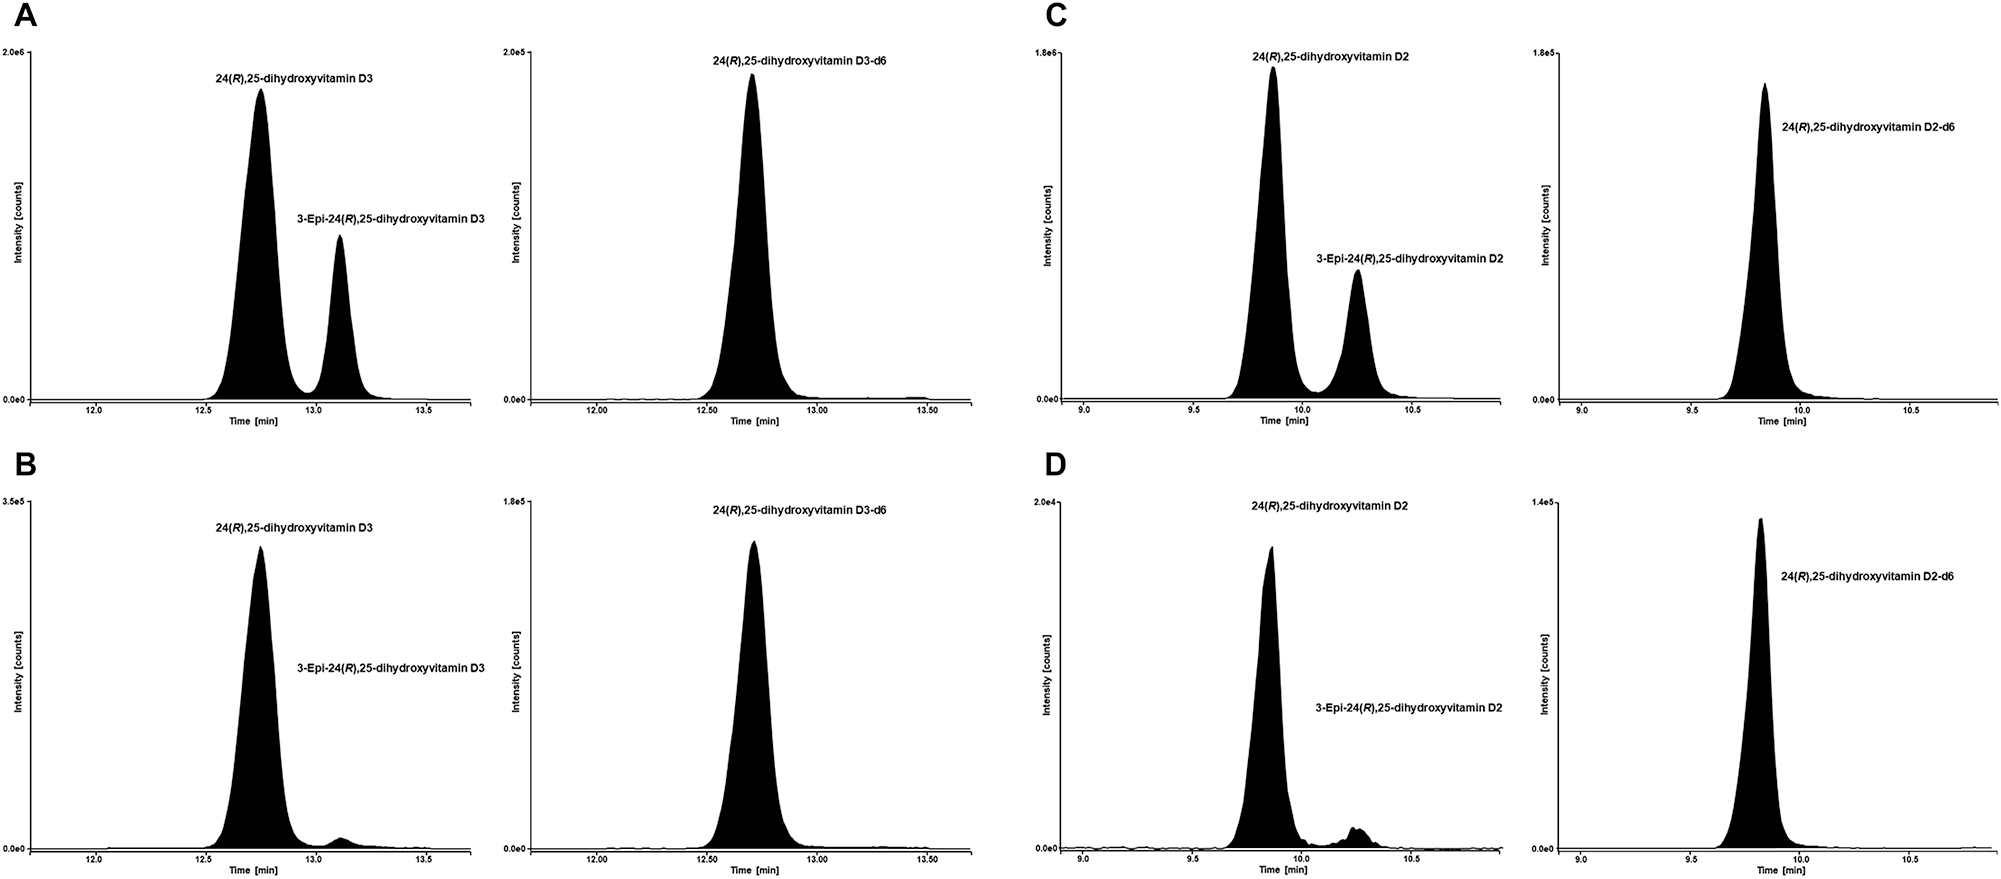
LC-MS/MS analytical readouts. (A) Chromatogram of SST sample 2. Analyte (24,25(OH)2D3) left and internal standard (24,25(OH)2D3-d6) right. (B) Chromatogram of NIST SRM 972a with a 24,25(OH)2D3 concentration of 3.13 ng/mL (7.51 nmol/L). Analyte (24,25(OH)2D3) left and internal standard (24,25(OH)2D3-d6) right. (C) Chromatogram of SST sample 2. Analyte (24,25(OH)2D2) left and internal standard (24,25(OH)2D2-d6) right. (B) Chromatogram of a native patient sample with a 24,25(OH)2D2 concentration of 0.241 ng/mL (0.562 nmol/L). Analyte (24,25(OH)2D2) left and internal standard (24,25(OH)2D2-d6) right.
The evaluation of quantifier and qualifier transition for both analytes showed no interfering signals at their respective retention times in all tested matrices. The ISTDs used in this method were evaluated for any residual unlabeled analyte and exhibited no significant analyte signal.
Matrix effects
The qualitative post-column infusion experiment showed no significant ion enhancement or suppression at the respective retention time for 24,25(OH)2D2 or 24,25(OH)2D3 and their ISTDs in all tested matrices.
In the quantitative experiment, a comparison of standard line slopes was performed. Since the endogenous content of the native matrices raised the nominal calibrator 8 concentration of these sets beyond the working range of the method, the values of calibrator 8 were not considered when determining calibration functions. The slopes of standard lines for 24,25(OH)2D2 were found to be 0.65 (95 % confidence interval [CI] 0.63–0.68) for the neat solution, 0.57 (95 % CI 0.54–0.60) for the vitamin D depleted serum, 0.61 (95 % CI 0.57–0.64) for native human serum pool, and 0.59 (95 % CI 0.58–0.61) for Li-heparin plasma. The correlation coefficients were ≥0.999 independent of calibration matrix. For 24,25(OH)2D3, slopes were found to be 0.60 (95 % CI 0.58 to 0.61) for neat solution, 0.58 (95 % CI 0.56 to 0.60) for NIST solution, 0.60 (95 % CI 0.58 to 0.63) for vitamin D depleted serum, 0.66 (95 % CI 0.57 to 0.75) for native serum pool and 0.56 (95 % CI 0.42 to 0.70) for Li-heparin plasma. Correlation coefficients (r) were ≥0.999 independent of the calibration matrix and the analyte. These data suggest that there is no significant difference between the different matrices, providing evidence for the absence of matrix effects. In addition, mean recoveries for both analytes were 93–100 %, independent of the matrix.
Precision, trueness, and accuracy
The accuracy and precision of the method were determined by performing a five-day validation experiment. Intermediate precision was found to be <2.3 % for 24,25(OH)2D2 and <2.9 % for 24,25(OH)2D3. Repeatability CV ranged from 1.1 to 1.4 % for 24,25(OH)2D2 and from 0.8 to 2.1 % for 24,25(OH)2D3 over all concentration levels, respectively (Table 1).
Precision performance parameters for 24,25(OH)2D2 and 24,25(OH)2D3 quantification using the candidate RMP (n=60 measurements).
| 24,25(OH)2D2 | ||||||
|---|---|---|---|---|---|---|
| Variance source | CV, % | |||||
| 0.450 ng/mL (1.05 nmol/L) | 5.00 ng/mL (11.7 nmol/L) | 15.0 ng/mL (35.0 nmol/L) | NIST SRM 972a, Level 1a | NIST SRM 972a, Level 2a | Patient sample | |
| Intermediate precision | 1.5 | 1.5 | 1.1 | – | – | 2.3 |
| Between-day | 0.0 | 0.0 | 0.0 | – | – | 1.7 |
| Between-calibration | 0.8 | 0.9 | 0.0 | – | – | 0.7 |
| Repeatability | 1.3 | 1.2 | 1.1 | – | – | 1.4 |
| Between-preparation | 1.0 | 1.1 | 0.9 | – | – | 1.1 |
| Between-injection | 0.8 | 0.3 | 0.5 | – | – | 1.0 |
| 24,25(OH)2D3 | ||||||
|---|---|---|---|---|---|---|
| Variance source | CV, % | |||||
| 0.450 ng/mL (1.08 nmol/L) | 8.31 ng/mL (19.9 nmol/L) | 15.0 ng/mL (36.0 nmol/L) | NIST SRM 972a, Level 1a | NIST SRM 972a, Level 2a | Patient sample | |
| Intermediate precision | 2.6 | 1.3 | 2.0 | 2.5 | 2.9 | 2.4 |
| Between-day | 0.0 | 0.4 | 0.9 | 1.4 | 2.0 | 1.5 |
| Between-calibration | 1.5 | 1.0 | 1.2 | 0.9 | 1.1 | 0.8 |
| Repeatability | 2.1 | 0.8 | 1.3 | 1.9 | 1.7 | 1.8 |
| Between-preparation | 2.0 | 0.6 | 1.3 | 1.8 | 1.6 | 1.6 |
| Between-injection | 0.8 | 0.5 | 0.5 | 0.6 | 0.7 | 0.6 |
-
aSample contains only 24,25(OH)2D3. CV, coefficient of variation; RMP, reference measurement procedure. Conversion factor ng/mL to nmol/L: 2.33 for 24,25(OH)2D2 and 2.40 for 24,25(OH)2D3. The coefficients of variation for repeatability and intermediate precision, which were determined from the individual variances, are printed in bold.
Accuracy and trueness were demonstrated using certified secondary reference material from NIST (SRM 972a Level 1 and Level 2) for 24,25(OH)2D3, as well as spiked vitamin D-depleted serum and Li-heparin plasma. NIST SRM 972a Level 1 and Level 2 were found with a mean bias (n=6 preparations) of −2.4 and −3.7 %, respectively. In vitamin D-depleted serum the mean bias was found to range from −1.4 to 2.9 % for 24,25(OH)2D2 and from −0.5 to 3.0 % for 24,25(OH)2D3, whereas for the plasma levels the mean bias was found to range from −4.5 to 1.5 % for 24,25(OH)2D2 and from 2.7 to 3.6 % for 24,25(OH)2D3.
High concentration levels were diluted with vitamin D-depleted serum before sample preparation. The bias ranged from −0.2 to 1.4 % and −0.3 to 1.0 % for 24,25(OH)2D2 and 24,25(OH)2D3, respectively (Table 2).
Bias and 95 % CI of vitamin D depleted serum, native serum and Li-heparin plasma samples and dilutions. The mean bias and corresponding confidence intervals were calculated using the individual sample biases of n=6 preparations.
| Nominal concentration, ng/mL (nmol/L) | Bias evaluation results | |||
|---|---|---|---|---|
| Bias, % | SD, % | 95 % CI | ||
| 24,25(OH)2D2 | ||||
| Vitamin D depleted serum | ||||
| Level 1 | 0.430 (1.00) | −1.4 | 2.1 | −3.1, 0.2 |
| Level 2 | 4.78 (11.2) | 2.9 | 1.7 | 1.5, 4.2 |
| Level 3 | 14.3 (33.4) | −0.5 | 1.6 | −1.7, 0.8 |
| Dilution 1 | 10.2 (23.8) | 1.4 | 1.1 | 0.5, 2.2 |
| Dilution 2 | 15.4 (35.9) | −0.2 | 1.2 | −1.2, 0.7 |
| Li-Heparin plasma | ||||
| Level 1 | 0.462 (1.08) | −4.5 | 0.8 | −5.1, −3.9 |
| Level 2 | 4.81 (11.2) | 1.5 | 1.5 | 0.3, 2.7 |
| Level 3 | 14.4 (32.9) | −1.7 | 1.0 | −2.5, −0.9 |
| 24,25(OH)2D3 | ||||
|---|---|---|---|---|
| Vitamin D depleted serum | ||||
| Level 1 | 0.448 (1.08) | −0.5 | 2.4 | −2.4, 1.3 |
| Level 2 | 8.31 (19.9) | 2.9 | 1.2 | 2.0, 3.9 |
| Level 3 | 14.9 (35.8) | 3.0 | 1.9 | 1.4, 4.5 |
| Dilution 1 | 10.0 (24.0) | 1.0 | 0.5 | 0.7, 1.4 |
| Dilution 2 | 15.1 (36.2) | −0.3 | 1.5 | −1.5, 0.9 |
| Secondary reference material | ||||
| NIST SRM 972a Level 1a | 2.66 (6.38) | −2.4 | 2.1 | −4.1, −0.8 |
| NIST SRM 972a Level 2a | 1.41 (3.39) | −3.7 | 1.9 | −5.2, −2.2 |
| Li-Heparin plasma | ||||
| Level 1 | 0.448 (1.08) | −0.5 | 2.4 | −2.4, 1.3 |
| Level 2 | 8.31 (19.9) | 2.9 | 1.2 | 2.0, 3.9 |
| Level 3 | 14.9 (35.8) | 3.0 | 1.9 | 1.4, 4.5 |
-
aSample contains only 24,25(OH)2D3. SD, standard deviation; CI, confidence interval. Conversion factor ng/mL to nmol/L: 2.33 for 24,25(OH)2D2 and 2.40 for 24,25(OH)2D3.
Linearity
Linearity was evaluated for an extended range of 20 % at the lower and upper end of the range. A quadratic regression with a 1/x 2 model was chosen for 24,25(OH)2D2 and 24,25(OH)2D3, due to the random and equal distribution of residuals. The correlation coefficients were ≥0.999 for both analytes.
The linearity was further confirmed by serial dilution of sample pools and showed a linear dependence with a correlation coefficient of 0.999 for both analytes. The correlation coefficients were >0.999 for both analytes. The recovery of the measured concentration, relative to the nominal concentration, ranged from 98 to 104 % for 24,25(OH)2D2, except for the lowest level where a recovery of 113 % was determined. For 24,25(OH)2D3, recovery was 102–110 %.
Lower limit of the measuring interval (LLMI)
The LLMI was determined using spiked, vitamin D depleted serum and corresponded to the lowest calibrator level. In the case of 24,25(OH)2D2, the relative bias (based on 20 preparations) was determined to be 2.2 % with a coefficient of variation (CV) of 2.2 %. Evaluation of 24,25(OH)2D3 resulted in a mean bias of 1.4 % and a CV of 2.3 %.
Sample stability
The stability of processed samples (autosampler stability) was determined at 6 °C by re-analyzing four different levels with freshly prepared calibrators. Processed samples were shown to be stable for 15 (24,25[OH]2D2) and 22 days (24,25[OH]2D3).
The stability of neat spike solutions was evaluated based on calibrator and QC levels, which were stored at −80 °C. Vitamin D-depleted serum was spiked with these solutions and recovery was determined using freshly prepared calibrators. It was found that the neat spike solutions remained stable when stored at −80 °C for 80 (24,25[OH]2D2) and 70 weeks (24,25[OH]2D3).
Stability of matrix-spiked calibrator and QC material were evaluated using four different levels (spiked stripped serum and NIST SRM 972a Level 4). Samples were found to be stable for 61 (24,25[OH]2D2) and 50 weeks (24,25[OH]2D3), when stored at −80 °C.
Method comparison study
Equivalence with results provided by the CDC Vitamin D Reference Laboratory was demonstrated by measuring 31 samples from the Vitamin D Standardization-Certification Program (VDSCP) using the candidate RMP for 24,25(OH)2D3. A Passing-Bablok regression showed very good agreement and yielded a regression equation with a slope of 1.01 (95 % CI 0.98–1.04), an intercept of −0.13 (95 % CI −0.29 to 0.01) and r=0.998 (Figure 2A). The data scatter (2 SD) found in the Bland-Altman plot was ±12.8 % (lower limit CI interval −25.9 to −14.8 %, upper limit CI interval 8.4–19.5 %) and the result bias in the patient cohort was −3.2 % (95 % CI interval −6.5 to 0.0 %) (Figure 2B). Results are in the range expected given the uncertainty associated both with these assays and the production of independent calibrator samples.
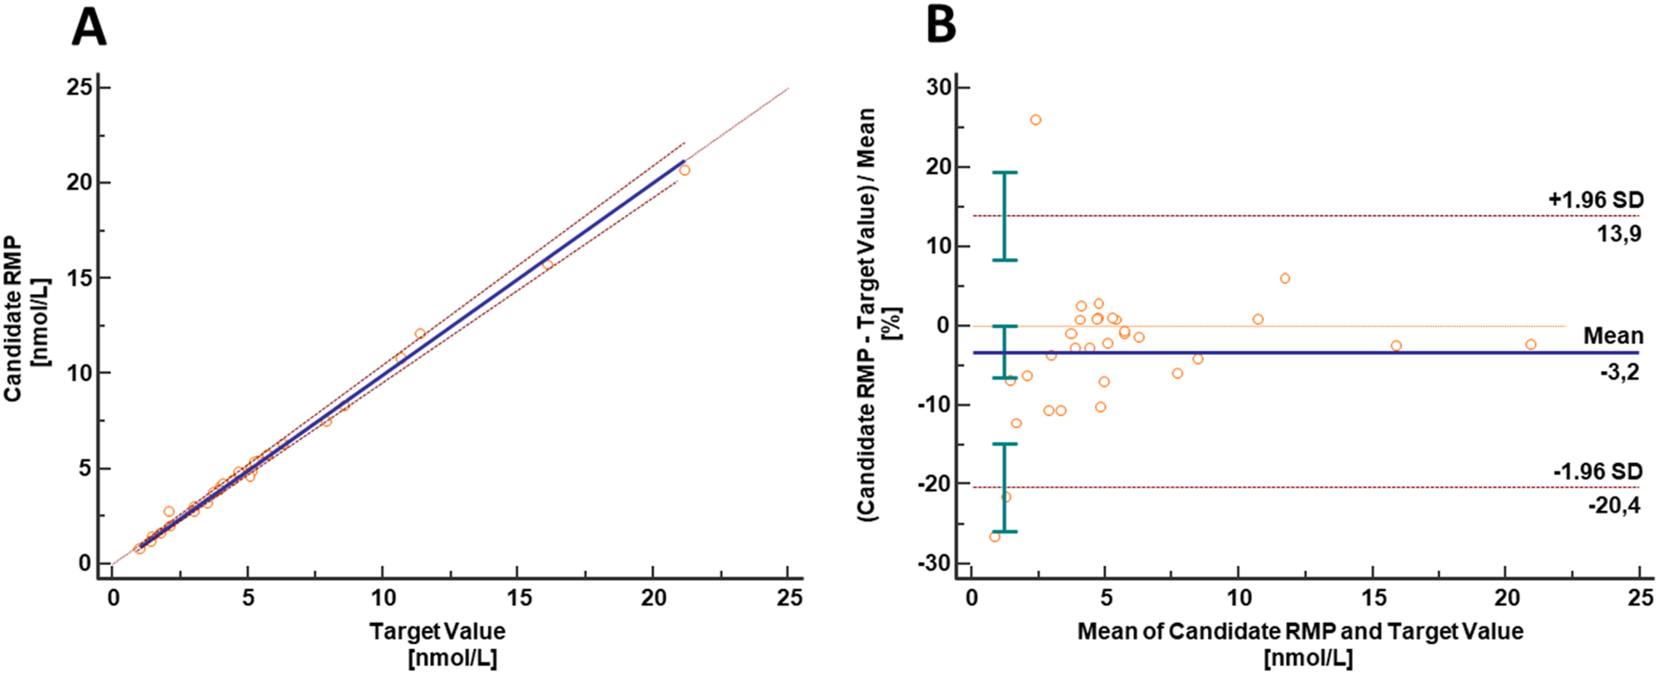
Results from equivalence study between the candidate RMP and the established University of Ghent/CDC vitamin D reference laboratory method: (A) The Passing-Bablok yielding a regression equation with a slope of 1.01 (95 % CI, 0.98 to 1.04) and an intercept of −0.13 (95 % CI, −0.29 to 0.01). The correlation coefficient was 0.998. The data scatter (two standard deviations) found in the Bland-Altman plot (B) was ±12.8 % (lower limit CI interval, −25.9 to −14.8 %; upper limit CI interval, 8.4–19.5 %) and the result bias in the patient cohort was −3.2 % (95 % CI interval, −6.5 to 0.0 %). Since target values are specified in nmol/L results are presented in this unit. Conversion factor ng/mL to nmol/L: 2.40 for 24,25(OH)2D3.
Estimation of measurement uncertainty (MU)
The measurement process exhibited an overall uncertainty ranging from 1.4 to 2.5 % for 24,25(OH)2D2 and from 1.5 to 3.0 % for 24,25(OH)2D3, regardless of the sample concentration, as indicated in Table 3. To account for a confidence level of approximately 95 %, assuming a normal distribution, the resulting overall MU was multiplied by a coverage factor of k=2. As a result, the expanded MUs were within 2.8–5.0 % for 24,25(OH)2D2 and 3.1–6.0 % for 24,25(OH)2D3.
Exemplary overview of measurement uncertainty for 24,25(OH)2D2 and 24,25(OH)2D3 quantification with the candidate RMP in serum samples for single measurements.
| 24,25(OH)2D2 | ||||||
|---|---|---|---|---|---|---|
| Level | ||||||
| 0.450 ng/mL (1.05 nmol/L) | 5.00 ng/mL (11.7 nmol/L) | 15.0 ng/mL (35.0 nmol/L) | NIST SRM 972a Level 1a | NIST SRM 972a Level 2a | Patient sample | |
| Type B uncertainty | 0.9 | 0.9 | 0.9 | – | – | 0.9 |
| Calibrator preparation, CV (%) | ||||||
| Characterization of reference material | 0.5 | 0.5 | 0.5 | – | – | 0.5 |
| Preparation of | ||||||
| Stock solution | 0.58 | 0.58 | 0.58 | – | – | 0.58 |
| Working solution | 0.66 | 0.66 | 0.66 | – | – | 0.66 |
| Spike solution | 0.77 | 0.74 | 0.77 | – | – | 0.77 |
| Matrix-based calibrator | 0.93 | 0.90 | 0.93 | – | – | 0.93 |
| Type A uncertainty | 1.5 | 1.5 | 1.1 | – | – | 2.3 |
| intermediate precision, CV (%) | ||||||
| Measurement uncertainty (k=1), CV (%) | 1.8 | 1.7 | 1.4 | – | – | 2.5 |
| Expanded measurement uncertainty (k=2), CV (%) | 3.5 | 3.5 | 2.8 | – | – | 5.0 |
| 24,25(OH)2D3 | ||||||
|---|---|---|---|---|---|---|
| Level | ||||||
| 0.450 ng/mL (1.08 nmol/L) | 8.31 ng/mL (19.9 nmol/L) | 15.0 ng/mL (36.0 nmol/L) | NIST SRM 972a Level 1a | NIST SRM 972a Level 2a | Patient sample | |
| Type B uncertainty | 0.8 | 0.7 | 0.8 | 0.8 | 0.8 | 0.7 |
| Calibrator preparation, CV (%) | ||||||
| Characterization of reference material | 0.2 | 0.2 | 0.2 | 0.2 | 0.2 | 0.2 |
| Preparation of | ||||||
| Stock solution | 0.29 | 0.29 | 0.29 | 0.29 | 0.29 | 0.29 |
| Working solution | 0.42 | 0.42 | 0.42 | 0.42 | 0.42 | 0.42 |
| Spike solution | 0.58 | 0.54 | 0.58 | 0.58 | 0.58 | 0.54 |
| Matrix-based calibrator | 0.77 | 0.74 | 0.78 | 0.78 | 0.78 | 0.74 |
| Type A uncertainty | 2.6 | 1.3 | 2.0 | 2.5 | 2.9 | 2.4 |
| intermediate precision, CV (%) | ||||||
| Measurement uncertainty (k=1), CV (%) | 2.7 | 1.5 | 2.1 | 2.7 | 3.0 | 2.6 |
| Expanded measurement uncertainty (k=2), CV (%) | 5.5 | 3.1 | 4.3 | 5.3 | 6.0 | 5.1 |
-
aSample contains only 24,25(OH)2D3. CV, coefficient of variation. Conversion factor ng/mL to nmol/L: 2.33 for 24,25(OH)2D2 and 2.40 for 24,25(OH)2D3. The measurement uncertainty of the whole approach for a single measurement estimated as a combination of the uncertainty of calibrator preparation (type B uncertainty) and uncertainty of the precision experiment (type A uncertainty) are given in bold.
For the establishment of reference values, multiple sample preparations were carried out for each sample on at least two different days. The average of these results, calculated using n=6, was used. The overall uncertainties ranged from 1.0 to 1.2 % for 24,25(OH)2D2 and from 0.9 to 1.2 % for 24,25(OH)2D3, with expanded uncertainties ranging from 1.9 to 2.3 % for 24,25(OH)2D2 (k=2) and 1.8–2.5 % for 24,25(OH)2D3, as shown in Table 4.
Exemplary overview of measurement uncertainty for 24,25(OH)2D2 and 24,25(OH)2D3 reference value assignment (n=6) with the candidate RMP in serum samples.
| 24,25(OH)2D2 | ||||||
|---|---|---|---|---|---|---|
| Level | ||||||
| 0.450 ng/mL (1.05 nmol/L) | 5.00 ng/mL (11.7 nmol/L) | 15.0 ng/mL (35.0 nmol/L) | NIST SRM 972a Level 1a | NIST SRM 972a Level 2a | Patient sample | |
| Type B uncertainty | 0.9 | 0.9 | 0.9 | – | – | 0.9 |
| Calibrator preparation, CV (%) | ||||||
| Characterization of reference material | 0.5 | 0.5 | 0.5 | – | – | 0.5 |
| Preparation of | ||||||
| Stock solution | 0.58 | 0.58 | 0.58 | – | – | 0.58 |
| Working solution | 0.66 | 0.66 | 0.66 | – | – | 0.66 |
| Spike solution | 0.77 | 0.74 | 0.77 | – | – | 0.77 |
| Matrix-based calibrator | 0.93 | 0.90 | 0.93 | – | – | 0.93 |
| Type A uncertainty | 0.5 | 0.7 | 0.3 | – | – | 0.6 |
| intermediate precision, CV (%) | ||||||
| Measurement uncertainty (k=1), CV (%) | 1.0 | 1.2 | 1.0 | – | – | 1.1 |
| Expanded measurement uncertainty (k=2), CV (%) | 2.1 | 2.3 | 1.9 | – | – | 2.2 |
| 24,25(OH)2D3 | ||||||
|---|---|---|---|---|---|---|
| Level | ||||||
| 0.450 ng/mL (1.08 nmol/L) | 8.31 ng/mL (19.9 nmol/L) | 15.0 ng/mL (36.0 nmol/L) | NIST SRM 972a Level 1a | NIST SRM 972a Level 2a | Patient sample | |
| Type B uncertainty | 0.8 | 0.7 | 0.8 | 0.8 | 0.8 | 0.7 |
| Calibrator preparation, CV (%) | ||||||
| Characterization of reference material | 0.2 | 0.2 | 0.2 | 0.2 | 0.2 | 0.2 |
| Preparation of | ||||||
| Stock solution | 0.29 | 0.29 | 0.29 | 0.29 | 0.29 | 0.29 |
| Working solution | 0.42 | 0.42 | 0.42 | 0.42 | 0.42 | 0.42 |
| Spike solution | 0.58 | 0.54 | 0.58 | 0.58 | 0.58 | 0.54 |
| Matrix-based calibrator | 0.77 | 0.74 | 0.78 | 0.78 | 0.78 | 0.74 |
| Type A uncertainty | 0.6 | 0.4 | 0.8 | 0.6 | 1.0 | 0.9 |
| intermediate precision, CV (%) | ||||||
| Measurement uncertainty (k=1), CV (%) | 1.0 | 0.9 | 1.1 | 1.0 | 1.2 | 1.2 |
| Expanded measurement uncertainty (k=2), CV (%) | 1.9 | 1.8 | 2.2 | 1.9 | 2.5 | 2.3 |
-
aSample contains only 24,25(OH)2D3. CV, coefficient of variation. Conversion factor ng/mL to nmol/L: 2.33 for 24,25(OH)2D2 and 2.40 for 24,25(OH)2D3. The measurement uncertainty of the whole approach for a target value assignment estimated as a combination of the uncertainty of calibrator preparation (type B uncertainty) and uncertainty of the precision experiment (type A uncertainty) are given in bold.
Discussion
Our candidate RMPs were developed to determine 24,25(OH)2D2 and 24,25(OH)2D3 in human serum and plasma using isotope dilution-liquid chromatography-tandem mass spectrometry (ID-LC-MS/MS) analysis.
Special attention was given to the characterization of the reference material, the preparation of calibrator material, and the calculation of the MU. The new candidate RMPs utilized an SI-traceable qNMR-characterized reference material to create matrix-based calibrators in order to achieve a calibrator material that closely matches the patient sample. Although a calibration solution (SRM 2971) is available for 24,25(OH)2D3, the use of qNMR-characterized reference material was necessary, since SRM 2971 contains an inadequate concentration for preparing calibrator levels in serum across the measurement range. A multi-point calibrator preparation scheme was individually optimized for both analytes to minimize the overall error of calibrator preparation. Comprehensive details of the materials utilized (such as analytical balance, volumetric flasks, and pipettes) and a thorough explanation of MU estimation are presented in Supplementary Material 1, Supplementary Material 2, and Supplementary Material 4.
To minimize matrix effects and the co-elution of isobaric interferences, individual protocols for 24,25(OH)2D2 and 24,25(OH)2D3 were optimized by employing two-dimensional heart-cut liquid chromatography with a combination of two orthogonal stationary phases. The SLE sample protocol was designed to be applicable to both analytes. Therefore, depending on whether one or both analytes are of interest for quantification, either an individual analyte ISTD solution or an ISTD mix solution may be utilized. Consequently, a single sample can be analyzed with both RMPs, allowing for both the measurement of low sample volume complaint samples and the performance of large method comparison studies within a reasonable timeframe, in addition to the intended use of reference value assignment.
It was verified that both candidate RMPs, for 24,25(OH)2D2 and 24,25(OH)2D3, fulfilled the criteria of accuracy, precision, selectivity, and specificity required for a higher-order RMP. The expanded MU of assigned reference values was ≤2.5 % regardless of analyte and sample concentration, aligning with the desired specification for these RMPs (MU<3.3 %) [35].
Furthermore, the 24,25(OH)2D3 RMP achieved a high level of agreement with samples from the CDC Vitamin D Reference Laboratory’s VDSCP. While the method used to quantify 24,25(OH)2D3 levels in these samples is not listed in the JCTLM database, it is in common use and was developed by well-regarded laboratory [43]. Nonetheless, as stated by CDC, the values provided by the VDSCP should be considered target, not reference, values for 24,25(OH)2D3 [43].
Given the absence of certified standard materials or JCTLM-listed methods, we present the first candidate reference measurement procedure for 24,25(OH)2D2. Extensive methodological validation demonstrates that this RMP is accurate, precise, selective, and specific for the determination of 24,25(OH)2D2.
Conclusions
In combination with the qNMR approach, these highly selective ID-LC-MS/MS-based candidate Reference Measurement Procedures (RMPs) provide accurate and reproducible results for determining 24,25(OH)2D2 and 24,25(OH)2D3 in human serum and plasma. They serve as a common metrological reference within the calibration hierarchy, allowing manufacturers of routine measurement procedures to establish metrological traceability.
Acknowledgments
We would like to thank Aline Hoffmeister, Silvia Bächer and Dominik Gruber for their support in selecting and providing samples. Editorial support, under the direction of the authors, was provided by Graziella Greco and Lucy Cooper of inScience Communications, Springer Healthcare Ltd, UK, and was funded by Roche Diagnostics GmbH (Penzberg, Germany).
-
Research ethics: All procedures were in accordance with the Helsinki Declaration. All samples used were exclusively anonymized samples.
-
Informed consent: Not applicable.
-
Author contributions: All authors have contributed to the manuscript conception and design; acquisition, or analysis and interpretation of data; drafting or revision; and final approval of the published article.
-
Use of Large Language Models, AI and Machine Learning Tools: Roche Chat, Roche’s artificial intelligence (AI) Technology, was used to improve the language of the manuscript.
-
Conflict of interest: Judith Taibon, Christian Geletneky, Neeraj Singh, Kerstin Kandler, and Andrea Geistanger are all employees of Roche Diagnostics GmbH. Michael Stadlmeier was an employee of Roche Diagnostics GmbH at the time the study was conducted. Friederike Bauland is an employee of Chrestos Concept GmbH and Co. KG, Essen, Germany. Roche employees holding Roche non-voting equity securities (Genussscheine) include Kerstin Kandler, Judith Taibon, Christian Geletneky, Andrea Geistanger.
-
Research funding: This research was funded by Roche Diagnostics GmbH.
-
Data availability: The raw data can be obtained on request from the corresponding author.
References
1. Carmeliet, G, Dermauw, V, Bouillon, R. Vitamin D signaling in calcium and bone homeostasis: a delicate balance. Best Pract Res Clin Endocrinol Metabol 2015;29:621–31. https://doi.org/10.1016/j.beem.2015.06.001.Suche in Google Scholar PubMed
2. Liu, M, Li, X, Sun, R, Zeng, Y, Chen, S, Zhang, P. Vitamin D nutritional status and the risk for cardiovascular disease. Exp Ther Med 2016;11:1189–93. https://doi.org/10.3892/etm.2016.3047.Suche in Google Scholar PubMed PubMed Central
3. Wu, J, Atkins, A, Downes, M, Wei, Z. Vitamin D in diabetes: uncovering the sunshine hormone’s role in glucose metabolism and beyond. Nutrients 2023;15. https://doi.org/10.3390/nu15081997.Suche in Google Scholar PubMed PubMed Central
4. Ström, O, Lauppe, R, Ljunggren, Ö, Spångéus, A, Ortsäter, G, O’Kelly, J, et al.. Real-world effectiveness of osteoporosis treatment in the oldest old. Osteoporos Int 2020;31:1525–33. https://doi.org/10.1007/s00198-020-05380-6.Suche in Google Scholar PubMed PubMed Central
5. Sluyter, JD, Manson, JE, Scragg, R. Vitamin D and clinical cancer outcomes: a review of meta-analyses. JBMR Plus 2021;5:e10420. https://doi.org/10.1002/jbm4.10420.Suche in Google Scholar PubMed PubMed Central
6. Bikle, DD. Vitamin D: production, metabolism and mechanisms of action. In: Feingold, KR, Anawalt, B, Blackman, MR, Boyce, A, Chrousos, G, Corpas, E, editors. Endotaext [Internet]. South Dartmouth, MA: MDText.com, Inc.; 2000.Suche in Google Scholar
7. Bikle, D, Christakos, S. New aspects of vitamin D metabolism and action – addressing the skin as source and target. Nat Rev Endocrinol 2020;16:234–52. https://doi.org/10.1038/s41574-019-0312-5.Suche in Google Scholar PubMed
8. Tebben, PJ, Singh, RJ, Kumar, R. Vitamin D-mediated hypercalcemia: mechanisms, diagnosis, and treatment. Endocr Rev 2016;37:521–47. https://doi.org/10.1210/er.2016-1070.Suche in Google Scholar PubMed PubMed Central
9. Meyer, MB, Pike, JW. Mechanistic homeostasis of vitamin D metabolism in the kidney through reciprocal modulation of Cyp27b1 and Cyp24a1 expression. J Steroid Biochem Mol Biol 2020;196:105500. https://doi.org/10.1016/j.jsbmb.2019.105500.Suche in Google Scholar PubMed PubMed Central
10. Grant, WB, Karras, SN, Bischoff-Ferrari, HA, Annweiler, C, Boucher, BJ, Juzeniene, A, et al.. Do studies reporting ‘U’-shaped serum 25-hydroxyvitamin D-health outcome relationships reflect adverse effects? Derm Endocrinol 2016;8:e1187349. https://doi.org/10.1080/19381980.2016.1187349.Suche in Google Scholar PubMed PubMed Central
11. Favus, MJ, Zeytinoglu, M, Coe, FL. Chapter 81 – Idiopathic hypercalciuria and nephrolithiasis. In: Feldman, D, editor. Vitamin D, 4th ed. Academic Press; 2018:485–505 pp.10.1016/B978-0-12-809963-6.00081-XSuche in Google Scholar
12. Dandurand, K, Ali, DS, Khan, AA. Hypercalcemia in pregnancy. Endocrinol Metabol Clin 2021;50:753–68. https://doi.org/10.1016/j.ecl.2021.07.009.Suche in Google Scholar PubMed
13. Marcinowska-Suchowierska, E, Kupisz-Urbańska, M, Łukaszkiewicz, J, Płudowski, P, Jones, G. Vitamin D toxicity – a clinical perspective. Front Endocrinol 2018;9:357018. https://doi.org/10.3389/fendo.2018.00550.Suche in Google Scholar PubMed PubMed Central
14. Cusano, NE, Thys-Jacobs, S, Bilezikian, JP. Chapter 82 – hypercalcemia due to vitamin D toxicity. In: Feldman, D, editor. Vitamin D, 4th ed. Academic Press; 2018:507–26 pp.10.1016/B978-0-12-809963-6.00082-1Suche in Google Scholar
15. Kaufmann, M, Schlingmann, KP, Berezin, L, Molin, A, Sheftel, J, Vig, M, et al.. Differential diagnosis of vitamin D-related hypercalcemia using serum vitamin D metabolite profiling. J Bone Miner Res 2020;36:1340–50. https://doi.org/10.1002/jbmr.4306.Suche in Google Scholar PubMed
16. Herrmann, M. Assessing vitamin D metabolism – four decades of experience. Clin Chem Lab Med 2023;61:880–94. https://doi.org/10.1515/cclm-2022-1267.Suche in Google Scholar PubMed
17. Alonso, N, Zelzer, S, Eibinger, G, Herrmann, M. Vitamin D metabolites: analytical challenges and clinical relevance. Calcif Tissue Int 2023;112:158–77. https://doi.org/10.1007/s00223-022-00961-5.Suche in Google Scholar PubMed PubMed Central
18. Ginsberg, C, Hoofnagle, AN, Katz, R, Hughes-Austin, J, Miller, LM, Becker, JO, et al.. The vitamin D metabolite ratio is associated with changes in bone density and fracture risk in older adults. J Bone Miner Res 2021;36:2343–50. https://doi.org/10.1002/jbmr.4426.Suche in Google Scholar PubMed PubMed Central
19. Ginsberg, C, Katz, R, de Boer, IH, Kestenbaum, BR, Chonchol, M, Shlipak, MG, et al.. The 24,25 to 25-hydroxyvitamin D ratio and fracture risk in older adults: the cardiovascular health study. Bone 2018;107:124–30. https://doi.org/10.1016/j.bone.2017.11.011.Suche in Google Scholar PubMed PubMed Central
20. Fraser, WD, Tang, JCY, Dutton, JJ, Schoenmakers, I. Vitamin D measurement, the debates continue, new analytes have emerged, developments have variable outcomes. Calcif Tissue Int 2020;106:3–13. https://doi.org/10.1007/s00223-019-00620-2.Suche in Google Scholar PubMed
21. Altieri, B, Cavalier, E, Bhattoa, HP, Pérez-López, FR, López-Baena, MT, Pérez-Roncero, GR, et al.. Vitamin D testing: advantages and limits of the current assays. Eur J Clin Nutr 2020;74:231–47. https://doi.org/10.1038/s41430-019-0553-3.Suche in Google Scholar PubMed
22. Wise, SA, Camara, JE, Sempos, CT, Lukas, P, Le Goff, C, Peeters, S, et al.. Vitamin D Standardization Program (VDSP) intralaboratory study for the assessment of 25-hydroxyvitamin D assay variability and bias. J Steroid Biochem Mol Biol 2021;212:105917. https://doi.org/10.1016/j.jsbmb.2021.105917.Suche in Google Scholar PubMed PubMed Central
23. Panteghini, M. Traceability as a unique tool to improve standardization in laboratory medicine. Clin Biochem 2009;42:236–40. https://doi.org/10.1016/j.clinbiochem.2008.09.098.Suche in Google Scholar PubMed
24. Joint Committee on Traceability in Laboratory Medicine (JCTLM). 15 June 2024; Available from: https://www.jctlm.org/.Suche in Google Scholar
25. Mineva, EM, Schleicher, RL, Chaudhary-Webb, M, Maw, KL, Botelho, JC, Vesper, HW, et al.. A candidate reference measurement procedure for quantifying serum concentrations of 25-hydroxyvitamin D3 and 25-hydroxyvitamin D2 using isotope-dilution liquid chromatography-tandem mass spectrometry. Anal Bioanal Chem 2015;407:5615–24. https://doi.org/10.1007/s00216-015-8733-z.Suche in Google Scholar PubMed PubMed Central
26. Tai, SS, Bedner, M, Phinney, KW. Development of a candidate reference measurement procedure for the determination of 25-hydroxyvitamin D3 and 25-hydroxyvitamin D2 in human serum using isotope-dilution liquid chromatography-tandem mass spectrometry. Anal Chem 2010;82:1942–8. https://doi.org/10.1021/ac9026862.Suche in Google Scholar PubMed PubMed Central
27. Stepman, HCM, Vanderroost, A, Van Uytfanghe, K, Thienpont, LM. Candidate reference measurement procedures for serum 25-hydroxyvitamin D3 and 25-hydroxyvitamin D2 by using isotope-dilution liquid chromatography–tandem mass spectrometry. Clin Chem 2011;57:441–8. https://doi.org/10.1373/clinchem.2010.152553.Suche in Google Scholar PubMed
28. Tai, SSC, Nelson, MA. Candidate reference measurement procedure for the determination of (24R),25-dihydroxyvitamin D3 in human serum using isotope-dilution liquid chromatography–tandem mass spectrometry. Anal Chem 2015;87:7964–70. https://doi.org/10.1021/acs.analchem.5b01861.Suche in Google Scholar PubMed
29. Phinney, KW, Tai, SSC, Bedner, M, Camara, JE, Chia, RRC, Sander, LC, et al.. Development of an improved standard reference material for vitamin D metabolites in human serum. Anal Chem 2017;89:4907–13. https://doi.org/10.1021/acs.analchem.6b05168.Suche in Google Scholar PubMed PubMed Central
30. Tai, SSC, Nelson, MA, Bedner, M, Lang, BE, Phinney, KW, Sander, LC, et al.. Development of standard reference material (SRM) 2973 vitamin D metabolites in Frozen human serum (high level). J AOAC Int 2017;100:1294–303. https://doi.org/10.5740/jaoacint.17-0182.Suche in Google Scholar PubMed
31. In Vitro diagnostic medical devices – measurement of quantities in samples of biological origin – requirements for content and presentation of reference measurement procedures (2018). [cited 2024 15 June 2024]; Available from: https://www.iso.org/standard/42021.html.Suche in Google Scholar
32. Huang, T, Li, H, Zhang, W, Numata, M, Mackay, L, Warren, J, et al.. Advanced approaches and applications of qNMR. Metrologia 2020;57:014004. https://doi.org/10.1088/1681-7575/ab336b.Suche in Google Scholar
33. Singh, N, Taibon, J, Pongratz, S, Geletneky, C. Quantitative NMR (qNMR) spectroscopy based investigation of the absolute content, stability and isomerization of 25-hydroxyvitamin D2/D3 and 24(R),25-dihydroxyvitamin D2 in solution phase. Sci Rep 2022;12:3014. https://doi.org/10.1038/s41598-022-06948-4.Suche in Google Scholar PubMed PubMed Central
34. Singh, N, Taibon, J, Pongratz, S, Geletneky, C. Absolute content determination by quantitative NMR (qNMR) spectroscopy: a curious case of aldosterone. RSC Adv 2021;11:23627–30. https://doi.org/10.1039/d1ra03472c.Suche in Google Scholar PubMed PubMed Central
35. Cavalier, E, Fraser, CG, Bhattoa, HP, Heijboer, AC, Makris, K, Vasikaran, S, et al.. Analytical performance specifications for the measurement uncertainty of 24,25-dihydroxyvitamin D examinations. Clin Chem Lab Med 2023;61:1561–6. https://doi.org/10.1515/cclm-2023-0176.Suche in Google Scholar PubMed
36. Kyriacou, DN. The enduring evolution of the P value. JAMA 2016;315:1113–15. https://doi.org/10.1001/jama.2016.2152.Suche in Google Scholar PubMed
37. Miller, GW. The role of analytical performance specifications in international guidelines and standards dealing with metrological traceability in laboratory medicine. Clin Chem Lab Med 2024;62:1462–9.10.1515/cclm-2023-1201Suche in Google Scholar PubMed
38. Bulska, E. Measurement uncertainty. In: Metrology in chemistry. Berlin: Springer; 2018:115–53 pp.10.1007/978-3-319-99206-8_8Suche in Google Scholar
39. Clinical and Laboratory Standards Institute (CLSI). C62-A. Liquid chromatography-mass spectrometry methods; approved guideline. In: CLSI document C62-A. Wayne, PA: Clinical and Laboratory Standard Institute; 2014.Suche in Google Scholar
40. Lynch, KL. CLSI C62-A: a new standard for clinical mass spectrometry. Clin Chem 2016;62:24–9. https://doi.org/10.1373/clinchem.2015.238626.Suche in Google Scholar PubMed
41. Working Group 1 of the Joint Committee for Guides in Metrology (JCGM/WG1). Evaluation of measurement data – guide to the expression of uncertainty in measurement (GUM), (2008; GUM 1995 with minor corrections). [cited 2024 15 June 2024]; Available from: https://www.bipm.org/documents/20126/2071204/JCGM_100_2008_E.pdf/cb0ef43f-baa5-11cf-3f85-4dcd86f77bd6.Suche in Google Scholar
42. Taibon, J, Santner, T, Singh, N, Ibrahim, SC, Babitzki, G, Köppl, D, et al.. An isotope dilution-liquid chromatography-tandem mass spectrometry (ID-LC-MS/MS)-based candidate reference measurement procedure (RMP) for the quantification of aldosterone in human serum and plasma. Clin Chem Lab Med 2023;61:1902–16. https://doi.org/10.1515/cclm-2022-0996.Suche in Google Scholar PubMed
43. Sempos, CT, Vesper, HW, Phinney, KW, Thienpont, LM, Coates, PM, Vitamin D Standardization Program VDSP. Vitamin D status as an international issue: national surveys and the problem of standardization. Scand J Clin Lab Invest Suppl 2012;243:32–40. https://doi.org/10.3109/00365513.2012.681935.Suche in Google Scholar PubMed
Supplementary Material
This article contains supplementary material (https://doi.org/10.1515/cclm-2024-1139).
© 2025 the author(s), published by De Gruyter, Berlin/Boston
This work is licensed under the Creative Commons Attribution 4.0 International License.
Artikel in diesem Heft
- Frontmatter
- Editorial
- Keeping pace with patient safety by developing and qualifying higher-order reference measurement procedures for laboratory measurement standardization
- Review
- The role of AI in pre-analytical phase – use cases
- Opinion Paper
- Total laboratory automation: fit for its intended purposes?
- Guidelines and Recommendations
- EFLM checklist for the assessment of AI/ML studies in laboratory medicine: enhancing general medical AI frameworks for laboratory-specific applications
- Candidate Reference Measurement Procedures and Materials
- An isotope dilution-liquid chromatography-tandem mass spectrometry-based candidate reference measurement procedure for the quantification of cortisol in human serum and plasma
- Isotope dilution-liquid chromatography-tandem mass spectrometry-based candidate reference measurement procedures for the quantification of 24(R),25-dihydroxyvitamin D2 and 24(R),25-dihydroxyvitamin D3 in human serum and plasma
- An isotope dilution-liquid chromatography-tandem mass spectrometry-based candidate reference measurement procedure for the quantification of cortisone in human serum and plasma
- Candidate reference measurement procedure based on isotope dilution-two dimensional-liquid chromatography-tandem mass spectrometry for the quantification of androstenedione in human serum and plasma
- An isotope dilution-liquid chromatography-tandem mass spectrometry-based candidate reference measurement procedure for the quantification of 17β-estradiol in human serum and plasma
- Isotope dilution-liquid chromatography-tandem mass spectrometry-based candidate reference measurement procedures for the quantification of total and free phenytoin in human serum and plasma
- An isotope dilution-liquid chromatography-tandem mass spectrometry based candidate reference measurement procedure for the simultaneous quantification of 25-hydroxyvitamin D3 and 25-hydroxyvitamin D2 in human serum and plasma
- General Clinical Chemistry and Laboratory Medicine
- Quality assurance using patient split samples: recommendations for primary healthcare laboratories
- Age distorts the interpretation of FIB-4
- Not all anti-parietal cell antibody tests are equal for diagnosing pernicious anemia
- Impact of renal and hepatic function on dihydropyrimidine dehydrogenase phenotype assessed by enzyme activity in peripheral blood mononuclear cells and uracilemia
- Fecal leukocyte esterase levels predict endoscopic severity as an alternative biomarker in inflammatory bowel disease
- Cancer Diagnostics
- CA-125 glycovariant assays enhance diagnostic sensitivity in the detection of epithelial ovarian cancer
- Cardiovascular Diseases
- Defining the analytical characteristics of a novel high-sensitivity point-of-care troponin I assay in its intended clinical environment
- An automatic chemiluminescence immunoassay for a novel biomarker NT-IGFBP-4: analytical performance and clinical relevance in heart failure
- Analysis of total cholesterol results measured in the initial period of the Croatian screening program for familial hypercholesterolemia: a pilot study
- Diabetes
- Comparison of seven different enzymatic methods for serum glycated albumin in pregnant women: a multicenter study
- Infectious Diseases
- Comparative analysis of monocyte distribution width alterations in Escherichia coli sepsis: insights from in vivo and ex vivo models
- Proadrenomedullin for prediction of early and mid-term mortality in patients hospitalized for community-acquired pneumonia
- Annual Reviewer Acknowledgment
- Reviewer Acknowledgment
- Letters to the Editor
- Biological variation of serum Golgi protein 73 concentrations
- Are vitamins A and E results truly traceable and clinically useful? A practical and critical inquiry
- Tafasitamab interference in immunofixation electrophoresis
- Improvement in the turnaround time of PTH(1–84) as part of the intraoperative PTH monitoring for parathyroidectomy
- Rethinking the use of “one-way ANOVA” in CLSI EP15-A3 – a call for terminological precision and methodological clarity
- Toxic beauty: acute kidney injury triggered by hair-straightening treatment
- Congress Abstracts
- 57th National Congress of the Italian Society of Clinical Biochemistry and Clinical Molecular Biology (SIBioC – Laboratory Medicine)