An isotope dilution-liquid chromatography-tandem mass spectrometry-based candidate reference measurement procedure for the quantification of cortisol in human serum and plasma
-
 ,
,


Abstract
Objectives
Accurate measurement of serum cortisol is crucial for the diagnosis and management of adrenal disorders. Thus, we have developed a novel isotope dilution-liquid chromatography-tandem mass spectrometry (ID-LC MS/MS)-based candidate reference measurement procedure (RMP) to quantify cortisol in human serum/plasma, offering higher sensitivity and reliability compared to existing RMPs.
Methods
Quantitative Nuclear Magnetic Resonance spectroscopic (qNMR) methodology has been utilized to assign the absolute content (g/g) and SI-traceability to the reference materials. A novel two-dimensional heart-cut liquid chromatography (LC) approach was implemented for the LC-MS/MS, combined with a supported liquid extraction (SLE) sample preparation protocol. A multi-day validation experiment assessed precision and accuracy. Reproducibility was assessed by comparing procedure results between two independent laboratories, and measurement uncertainty (MU) was evaluated in compliance with current guidelines.
Results
The established RMP exhibited high sensitivity, with a quantification range of 0.800–600 ng/mL (2.21–1,655 nmol/L), exceeding the ranges of existing JCTLM-listed RMPs. Intermediate precision was ≤2.6 %, and repeatability ranged from 0.9 to 1.9 % across all concentration levels. The relative mean bias ranged from −1.3 to 1.4 % for all matrices and concentration levels. Measurement uncertainties (MU) for cortisol in single measurements were ≤2.8 % regardless of the concentration level and sample type. Using the certified International Federation of Clinical Chemistry and Laboratory Medicine (IFCC) reference panel, the equivalence between the candidate RMP and the Joint Committee on Traceability in Laboratory Medicine (JCTLM) listed RMPs (NRMeth 57 and NRMeth 8) was assessed, revealing excellent agreement.
Conclusions
This RMP allows for highly sensitive and reproducible determination of cortisol. The performance of the RMP facilitates the standardization of routine assays and ensures traceability in the measurement of individual patient samples.
Introduction
Measuring cortisol (C21H30O5, molecular weight =362.47 g/moL, conversion factor from ng/mL to molar unit [nmol/L] =2.76) in serum is important for the diagnosis and monitoring of conditions such as hypercortisolism (e.g., Cushing’s syndrome) and adrenal insufficiency (e.g., Addison’s disease) [1], [2], [3]. Thus, accurate and precise measurements of serum cortisol are fundamental to the correct diagnosis and effective management of such patients. Cortisol levels are commonly measured using immunoassays, which are simple to implement but often lower in specificity due to antibody cross-reactivity with binding proteins and other glucocorticoids, including those used in therapy and their metabolites [4], [5], [6]. The introduction of liquid chromatography-mass spectrometry (LC-MS) analysis in clinical laboratories has solved some problems by providing high analytical sensitivity and specificity, and rapid sample preparation [5], 7]. Nevertheless, technical heterogeneity can still be an issue with chromatographic methods [8]. A validated standard reference system is essential to ensure measurement accuracy and reduce variability between laboratories.
The Joint Committee on Traceability in Laboratory Medicine (JCTLM) [9] has listed various methods as higher-order reference measurement procedures (RMPs) for serum cortisol measurements using isotope dilution gas chromatography-mass spectrometry (ID GC-MS) [10], 11] and isotope dilution liquid chromatography-tandem mass spectrometry (ID LC-MS/MS) [12], including further sample pretreatment steps, to increase accuracy [13]. The listed approaches employ bracketing calibration method. This involves an initial measurement of the samples using a routine method to determine the appropriate IS concentration, with the goal of achieving an analyte-to-IS ratio close to one when implementing the RMP. The measurement ranges of these RMPs vary, with the most sensitive RMP enabling the quantification of cortisol down to approximately 11 ng/mL (30.3 nmol/L) [9], 13]. In addition cortisol in human serum reference samples (ERM®-DA451/IFCC; ERM®-DA192; ERM®-DA193) are listed in the JCTLM database as Certified Reference Materials (CRMs) [9] and are used to validate a candidate RMP. Neat chemical standards (standard reference material [SRM] 921 and 921a) [14], 15] used to calibrate instruments are provided by the National Institute of Standards and Technology (NIST). However, at the time of the validation experiments, the measurement uncertainty (MU) data for the primary reference material NIST SRM921 was not provided by NIST and the follow up material 921a including measurement uncertainty was not yet available.
Therefore, we employed quantitative nuclear magnetic resonance (qNMR) spectroscopy to characterize a commercially available cortisol reference (Hydrocortisone; European Pharmacopoeia; H1300000) since at the time the study was conducted no SI traceable reference material with an assigned uncertainty was available. qNMR spectroscopy is a recognized primary method for accurately determining the mass fraction (absolute content; g/g) of an analyte in a single, non-destructive experiment. This technique also offers the capability for complete structural elucidation when needed, utilizing a variety of one-dimensional and two-dimensional pulse sequences [16], 17]. The advantages of qNMR include its strong structure elucidation capabilities, linear response to analyte quantity, and direct traceability to the kilogram through qNMR internal standards (ISTDs). These attributes make qNMR an exceptional tool for quantification. The highest order qNMR ISTDs are traceable directly to NIST benzoic acid 350b (Coulometric) and/or NIST PS1 (Benzoic acid; the first primary qNMR standard) [18]. These standards are available from SigmaAldrich (TraceCert Standards) and Wako (TraceSure standards; traceable to NMIJ CRM 3001-b). Furthermore, the latest Technical Report from the International Union of Pure and Applied Chemistry (IUPAC) has recognized qNMR as a potential primary reference measurement procedure (RMP) for the characterization of primary reference materials [19].
Our objective was to develop a novel candidate RMP using a two-dimensional heart-cut liquid chromatography (LC) approach for LC-MS/MS, paired with an easily implementable supported liquid extraction (SLE) sample preparation protocol that requires a small sample volume. This new approach not only enhances selectivity and specificity, minimizing matrix effects and preventing the co-elution of interferences, but also emphasizes sustainability through the use of SLE, which is a greener alternative to traditional liquid-liquid extraction protocols. Additionally, the new RMP is more sensitive compared to JCTLM-listed RMPs, enabling quantification from 0.800 to 600 ng/mL (2.21–1,655 nmol/L).
This RMP is furthermore designed to meet the requirements of the International Organization for Standardization (ISO) guidelines [9], 20] for procedures (ISO 15193) [21] and reference materials (ISO 15194) [22]. Additionally, the RMP should meet the performance specifications based on the biological variability parameters established by the European Federation of Clinical Chemistry and Laboratory Medicine (EFLM) [23]. For cortisol, the desirable specification for imprecision (CV), bias (B), maximum expanded allowable measurement uncertainty (MAU), and total error (TE) of routine assays are ≤8.1 %, ≤8.9 %, ≤16.1 %, and ≤22.6 %, respectively [23], 24]. The corresponding specification for RMP – CVRMP, BRMP, MAURMP, and TERMP should be ≤4.0, ≤3.1 %, ≤5.4 % and ≤9.7 %, respectively.
Materials and methods
Methods, equipment, and a complete list of materials used are reported in the Supplementary Material 1.
Chemicals and reagents
LC-MS grade solvents used were methanol (Biosolve, Valkenswaard, The Netherlands), ammonium fluoride and ethyl acetate (Merck, Darmstadt, Germany), and water (purified using a Millipore Milli-Q® IQ 7000 system – Merck). The standard reference materials SRM® 921 and SRM® 921a were obtained from NIST, while the qNMR standard tecnazene (TraceCert qNMR Standard traceable to NIST PS1; Lot Nr. BCBW6288), cortisol (European Pharmacopoeia; H1300000), deuterated cortisol-9,11,12,12-d4 ISTD (100 μg/mL in methanol), and prednisolone were purchased from Merck (Darmstadt, Germany). The certified secondary reference materials utilized in the study included ERM®-DA192 lyophilized human serum, ERM®-DA193 lyophilized human serum, and the human serum reference panel ERM®-DA451/IFCC (European Commission, Joint Research Centre, Geel, Belgium). Steroid-free human serum and native human serum (anonymized samples) were obtained from Roche Diagnostics GmbH (Penzberg, Germany). Native human plasma (K3EDTA, K2EDTA and lithium [Li]-Heparin plasma pools) was obtained from Biotrend (Cologne, Germany). In compliance with the Declaration of Helsinki, all patient samples were residual anonymized samples.
General requirements for laboratory equipment
A complete list of laboratory equipment (calibrated and certified by the manufacturer) and relative requirements is provided in Supplementary Material 1.
qNMR for determining the purity of the standard materials
qNMR measurements were performed on a Jeol 500 MHz NMR with a N2-cooled Cryoprobe (2–3 times 1H sensitivity when compared to RT-probes). Single-Pulse-1H{13C}NMR was utilized for the quantitation (olefinic proton, 1H; Supplementary Material 2, Table s1 and Figure s2) with an inter-scan delay of 70 s. This olefinic proton at 5.66 ppm is clearly separated from any other resonance and is optimal for the quantitation of cortisol. Other known impurities of cortisol were not found in this European Pharmacopoeia standard (Supplementary Material 2, Figure s1). The other methylene protons (alpha to OH) are unsuitable as quantitation signals owing to their propensity towards abstraction by basic impurities, if present. Further details about NMR acquisition and processing parameters are available in the Supplementary Material 2 (Table s1, Figure s1 and s2).
Preparation of calibrators and quality control (QC) samples
The preparation of the calibrator and QC samples is described in detail in Supplementary Material 1.
To summarize, two independently weighed calibration stock solutions were prepared. For each stock solution, 5 mg of cortisol (in-house qNMR characterized cortisol H1300000) was weighed using an ultra-microbalance (XP6U/M, Mettler Toledo) and dissolved in 10 mL methanol in a volumetric flask, to obtain a concentration of 0.5 mg/mL (1.38 mmol/L). The exact concentration of the stock solutions was calculated based on the purity determined by qNMR (99.6 % ± 0.4 %; uncertainty given as 2 standard deviation (SD) and the exact amount weighed. Each primary stock solution was diluted further with methanol to achieve working solutions with a 50 μg/mL (0.138 mmol/L) concentration. The working solutions were used to prepare nine calibrator spike solutions of different concentrations in 40 % methanol. Each calibrator spike solution was diluted in steroid-free human serum matrix (1 + 49 v + v) and uniformly distributed in a range of 0.800–600 ng/mL (2.21–1,655 nmol/L).
The certified reference materials ERM®-DA192 (98.8 ng/mL ± 2.0 ng/mL; 273 ± 6 nmol/L) and ERM®-DA193 (277 ng/mL ± 5 ng/mL; 763 ± 14 nmol/L) were used as control material, as well as two self-spiked controls (QCs) and a native patient sample. The QCs were prepared using a third, independent primary stock solution (0.5 mg/mL, 1.38 mmol/L) and the resulting spike solutions. This stock solution was prepared using the NIST SRM® 921, and its final concentration was calculated based on the certificate. After further dilution with methanol, the resulting working solution (50 μg/mL, 0.138 mmol/L) was used to prepare the two control spike solutions and final QCs with concentrations of 2.40 and 550 ng/mL (6.62 and 1,517 nmol/L), respectively.
Internal standard (ISTD) solution
ISTD solution (600 ng/mL; 1,637 nmol/L) was prepared by transferring 60 µL of the commercially available stock solution (Cortisol-d4 in methanol 100 μg/mL [273 μmol/L]; C-113-1ML; Cerilliant) into a 10 mL volumetric flask and adding 40 % methanol (v/v) up to the calibration mark.
Sample preparation
A sample matrix native serum, plasma (Li-Heparin plasma, K2EDTA plasma and K3EDTA plasma) and steroid-free serum serving as surrogate matrix were used. High-concentrated samples (>600 ng/mL; >1,655 nmol/L) were diluted 1+1 (v + v) with steroid-free human serum before sample preparation and mixed for 30 min on an overhead shaker before further use. For sample preparation 100 µL of a native sample, calibrator or control sample were transferred into a 0.5 mL screw cap. 20 µL of the internal standard working solution was added, and the samples were incubated on an overhead shaker for 15 min at room temperature. Milli-Q® water (330 µL) was added to each sample before shaking them for 5 min on the thermomixer (Eppendorf 5,382 thermomixer C) at 1,400 rpm. Final purification was performed by loading 400 µL of the serum/water mixture onto a 3cc Novum Support Liquid Extraction (SLE) cartridge (Phenomenex) with an initial vacuum of 5 s and allowing it to settle for 20 min. The extraction was performed using 1 mL ethyl acetate (x2), evaporating the extract to dryness in a nitrogen evaporation system (Biotage, Uppsala, Sweden; 50 °C, 1.3 mL/min, 15 min) and reconstituting the residue in 300 µL 40 % methanol. The solution was filtered using centrifuge filter tubes (5 min, 15,000 rcf) and transferred into an HPLC vial with a 450 µL insert.
Liquid chromatography-tandem mass spectrometry (LC-MS/MS)
The chromatographic purification was performed using an Agilent 1290 Infinity II LC system equipped with two binary pumps, (Agilent, Santa Clara, CA, USA). Analyte detection was performed using an AB Sciex Q-Trap 6500 mass spectrometer (AB Sciex, Framingham, MA, USA). Chromatographic separation of cortisol was achieved using a two-dimensional heart-cut liquid chromatography (LC) approach with a combination of two orthogonal stationary phases (in the first dimension a Waters Acquity BEH C18 [1.7 µm, 50 × 2.1 mm] and in the second dimension a Raptor Biphenyl [2.7 µm, 150 × 2.1 mm]), to minimize matrix effects and the co-elution of isobaric interferences. In both dimensions, mobile phases consisted of 0.2 mM ammonium fluoride in Milli-Q-water (A) and methanol (B) and the separation at 50 °C was achieved using individual gradients over 10 min with flow rates of 0.3 mL/min and 0.5 mL/min, respectively. The injection volume was 5 µL.
Cortisol was detected in the multiple reaction monitoring (MRM) mode using an AB Sciex QTrap 6500 mass spectrometer operating in electrospray ionization mode. The quantifier ion transition (cortisol m/z 363.3 → 96.9) and the corresponding internal standard transition (cortisol-d4 m/z 367.1 → 96.9) served as the basis for the cortisol quantitation, while the additional qualifier transition (cortisol m/z 363.3 → 120.9) was monitored to screen for unknown interferences. The LC and MS methods are fully reported in Supplementary Material 1.
System suitability test (SST)
To assure the long-term stability of the method, an SST was established to examine sensitivity and chromatographic resolution before every sequence. Two sample levels (SST1 and SST2) were prepared in 40 % methanol, containing cortisol in concentrations of 0.800 ng/mL (2.21 nmol/L) and 600 ng/mL (1,655 nmol/L), respectively.
For passing the SST, the signal-to-noise ratio (S/N) of the quantifier transition of sample SST1 was required to be ≥10 S/N. It was calculated using the Analyst® software (AB Sciex, Framingham, MA, USA) as peak height divided by noise. The Analyst software uses the SD (with a mean of zero) of all chromatographic data points between the specified background to calculate noise. Background from 7.20 to 7.70 min was used to calculate the S/N ratio. In addition, a retention time of 8.3 min (±0.5 min) for cortisol was required for both samples (SST1 and SST2).
To examine potential carryover, sample SST2 was injected, followed by two solvent blanks. The analyte peak area observed in the first blank was required to be ≤20 % of the analyte peak area of SST1 to pass the SST.
Calibration data processing and structure of analytical series
Spiked calibrators were prepared as described in the section Preparation of calibrators and quality control (QC) samples. Calibrator levels were measured at increasing concentrations at the beginning and the end of every sequence. The calibration functions (using 9 levels) were obtained by quadratic regression (1/x weighting) of the area ratios of the analyte and the internal standard (y) against the analyte concentration (x), resulting in the function y=a2x2 + a1x + a0.
To process the raw data file, the Analyst software (v1.6.2 or higher) was used with Intelli Quant as Quantitation Integration Algorithm (ABSciex). Raw data were processed with a smoothing factor of three.
The individual sequence setup varied due to specific measurement requirements. For assignment of reference values, the number of sample preparations (n=x) was dependent on the desired MU, and samples were measured on at least two different days. In case of a method comparison study, or complaint sample measurement, samples were prepared with n=1.
Method validation
Assay validation and determination of MU were performed following the established guidelines of the Clinical and Laboratory Standard Institute: C62A Liquid Chromatography-Mass Spectrometry Methods [25], and the Guide to the Expression of Uncertainty in Measurement (GUM) [26].
Selectivity and specificity
Selectivity was assessed using a native serum pool containing a known concentration of endogenous cortisol and an unknown concentration of cortisone. This pool was fortified with prednisone and prednisolone at concentrations of 100 ng/mL (276 nmol/L) and 200 ng/mL (552 nmol/L), respectively. Samples were then prepared and analyzed by LC-MS/MS in the same manner as the calibrators. Baseline separation of the analytes was evaluated in both the first and second dimensions. Additionally, to account for potential interference of prednisolone with cortisol, the fortified sample was quantified (n=6), and the cortisol concentration was determined.
To examine possible interfering matrix signals for the analyte quantifier and qualifier transition, both a steroid-free serum pool and a native human serum pool were checked at the expected retention time (8.3 [±0.5] min).
In addition, an analyte-free matrix was spiked with the deuterated internal standard to evaluate a possible amount of residual unlabeled analyte within the stable isotope labeled internal standard. As matrices, a native human serum pool and a surrogate matrix (steroid-free human serum) were used.
Matrix effect
To determine possible matrix effects, a qualitative post-column infusion experiment and a quantitative experiment based on the comparison of standard line slopes were performed. In the post-column infusion setting, a neat solution with 100 ng/mL cortisol (276 nmol/L)and cortisol-d4 (273 nmol/L) in 40 % MeOH in Milli-Q Water was infused via a T-piece into the HPLC post-column eluent prior to entering the MS/MS system to generate a stable analyte background signal. The flow rate was set at 10 μL/min. Then, a processed matrix sample was injected, and the change of the background signal was acquired. Different matrices such as neat solution (40 % MeOH in Milli-Q Water), native serum matrix pool (made up from five individual donors), steroid-free serum, as well as three plasma matrices (Li-Heparin, K3EDTA, K2EDTA) were analyzed. Any decrease or increase of the SRM analyte signal would indicate a matrix component-mediated effect on the ionization yield of the analytes. In addition to the T-piece experiment, a comparison of standard line slopes was performed comparing the following matrices: neat solution (40 % MeOH in Milli-Q Water), native serum matrix pool (made up from five individual donors), steroid-free serum, and Li-Heparin plasma matrix. Calibrator levels were prepared as described in Section 4.3 of Supplementary Material 1. Neat samples were diluted to the final concentration of processed calibrator levels, whereas matrix calibrator levels were prepared by SLE (Section 5.1 of Supplementary Material 1). Slopes and coefficients of determination were compared. The confidence intervals of slopes need to overlap. In addition, the calibrator samples in a surrogate matrix and native serum were evaluated as controls by applying the neat calibration as standard. Recoveries were reported as the percentage of recovery of the measured concentration relative to the nominal concentration.
Linearity
For the determination of linearity, calibration curves from three individual weighings were prepared. Calibration range was extended by ±20 %, and two additional spike solutions were prepared to obtain spiked serum samples with a final concentration of 0.640 (1.77 nmol/L) ng/mL and 720 ng/mL (1986 nmol/L) cortisol. The peak area ratio of the analyte to the corresponding ISTD was plotted against the respective analyte concentration (ng/mL). Correlation coefficients and residuals for each curve were determined and had to be ≥0.99. The linearity of the method was established by serial recovery of diluted samples (pool 1 up to pool 11) using the preferred regression model for calculation. The ideal sample matrix was set as a patient’s specimen pool with an analyte concentration near the expected upper reportable limit that is diluted with another patient’s sample pool having an analyte concentration at the expected or tested lower concentration limit. If no native materials were available, spiked samples were used. Therefore, a native serum sample with a concentration of approximately 550 ng/mL (1,517 nmol/L) was used as pool 11, whereas the analyte-free surrogate matrix (steroid-free human serum) was used as pool 1. Using these two samples, pool 2 was prepared as a mixture of pool 1 and pool 11 (9 + 1 v + v) and serially diluted till pool 10 (1 + 9 v + v). Measurement results had to show a linear dependency (r≥0.99), and recoveries were reported as the percentage of recovery of the measured concentration relative to the nominal concentration of the sample pool.
Lower limit of measuring interval (LLMI) and limit of detection (LOD)
Precision, trueness and accuracy at the LLMI were determined by measuring spiked serum matrix samples in the expected concentration range of the LOQ. The LOQ matches with the lowest calibrator level (0.800 ng/mL; 2.21 nmol/L). Samples were prepared in five replicates; precision, bias and recovery were determined.
Precision
Precision was evaluated with a 5-day validation experiment, performed as reported by Taibon et al. [27]. Two spiked steroid-free serum samples (2.40 and 550 ng/mL, 6.62 and1517 nmol/L), two certified secondary reference materials (ERM®-DA192 [98.8 ng/mL ± 2.0 ng/mL; 273 ± 6 nmol/L] and ERM®-DA193 [277 ng/mL ± 5 ng/mL; 763 ± 14 nmol/L]), and two native patient samples (approximately 45 and 120 ng/mL, 124 and 331 nmol/L) were prepared in triplicate for each part and injected twice (n=12 measurements per day and n=60 measurements over 5 days). Data evaluation was done using Biowarp, an internal statistic program based on the Variance Component Analysis (VCA) Roche Open Source software package in R [28]. Repeatability included between-injection variability and between-preparation variability, whereas intermediate precision included additional between-calibration variability and between-day variability. Repeatability and intermediate precision are expressed as SD and coefficient of variation (CV).
Trueness and accuracy
Accuracy and trueness were assessed using two certified secondary reference materials (ERM®-DA192 [98.8 ng/mL ± 2.0 ng/mL; 273 ± 6 nmol/L] and ERM®-DA193 [277 ng/mL ± 5 ng/mL; 763 ± 14 nmol/L]) and two spiked steroid-free serum samples (2.40 and 550 ng/mL, 6.62 and 1,517 nmol/L) and. Validity of dilution was performed using two spiked native serum samples at concentration levels of 800 ng/mL (2,207 nmol/L) and 1,000 ng/mL (2,759 nmol/L). In addition, accuracy and trueness were determined in a Li-Heparin plasma pool at three concentration levels (100, 250 and 550 ng/mL; 276, 690 and 1,517 nmol/L). All samples were prepared in triplicates for each part (n=6 measurements) on one day. Accuracy was reported as the level of agreement between the measured value and the accepted reference value. Trueness, on the other hand, was evaluated by comparing the average value obtained from a series of measurements to the target value, assessing their agreement.
Sample stability
The stability of the processed samples (calibrators and QC levels) on the autosampler was investigated at 4–8 °C for 17 days. Therefore, samples from the accuracy and precision experiment were used and were re-measured against a freshly prepared calibration after 1, 3, 7, 8, 10, and 17 days. Recoveries were calculated by comparing the measured value with the nominal concentration (t=0 h). Stability of spike solutions (50.0, 200 and 500 ng/mL; 138, 552 and 1,379 nmol/L) and matrix-based spiked control material (samples from the precision and accuracy experiment) stored at −80 °C were evaluated for 43 and 17 weeks, respectively. Samples were required to be re-measured and evaluated against freshly prepared samples performing four measurements over the aforementioned time period.
Equivalence of results between independent laboratories
To assess the agreement of the RMP between two independent laboratories, a method comparison study was performed, including overall 164 anonymized residual patient samples (serum and plasma). The RMP was transferred to the second laboratory the Department of Pediatrics and Adolescent Medicine, University Hospital Erlangen (site 2). In addition, a three-day precision experiment based on the experimental design described above was performed at site 2. Spiked samples were provided by Roche Diagnostics Penzberg (site 1). Both laboratories prepared their own calibrator levels using cortisol characterized by qNMR, as primary reference material. The LC-MS system and laboratory equipment were different in both laboratories. In addition, adaptations to the sample preparation protocol were made in the second laboratory to use the 96-well plate format. All steps before the SLE sample preparation were done in one single 96-well deep well plate from polypropylene. In brief, 100 µL sample and 20 µL internal standard were incubated before adding 330 µL water. The sample was mixed, and 400 µL of the diluted sample was loaded on a 96-well plate (Phenomenex Novum SLE) and incubated. Samples were eluted twice using 1 mL ethyl acetate. The eluate of both parts was collected in one set of glass inserts supplied by Hirschmann (Eberstadt, Germany). After evaporation, the samples were reconstituted, mixed, sealed and measured.
To establish the comparability between the RMP, performed at site 1, and an in-house developed high-throughput LC-MS/MS assay, a second method comparison study including 165 anonymized residual patient samples (serum and plasma) was conducted. This assay utilized a commercially available calibration material and the online solid phase extraction LC-MS/MS method by Gaudl et al. [29], and was performed at site 3, specifically the Institute of Laboratory Medicine, Clinical Chemistry and Molecular Diagnostics at Leipzig University Hospital.
Equivalence to JCTLM listed RMPs
To assess the agreement between the newly established RMP and the JCTLM-listed ID-GC/MS-based RMPs [10], 11], the International Federation of Clinical Chemistry and Laboratory Medicine (IFCC) cortisol reference serum panel (ERM®-DA451/IFCC) was used. The serum panel comprises 34 samples that were measured in two replicates on two different days. The results were then calculated as the arithmetic mean, with a total of four measurements obtained.
Additionally, participation in the RELA – IFCC External Quality Assessment Scheme for Reference Laboratories in Laboratory Medicine has been ongoing since 2022. Provided samples were prepared threefold over two different days.
Estimation of measurement uncertainty (MU)
According to the GUM [26] and based on Taibon et al. [27], MU was estimated accounting for the uncertainty of qNMR target value assignment of reference material, preparation of calibrator materials, and LC-MS/MS method. qNMR measurements were performed in six replicates using an SI traceable internal standard for the quantification of the absolute content (Px, purity of the analyte given as mass fraction) of the analyte. A bottom-up approach was used to estimate the MU related to the serum-based calibration material, including the following uncertainty components: purity of the reference material, weighing, preparation of stock solution and dilutions, preparation of spike solution and preparation of matrix-based calibrator level. Uncertainties of the laboratory equipment used, such as ultra-micro balance, pipettes and volumetric flasks, were provided by the manufacturer. Estimation of total variability of the LC-MS/MS method was performed using a precision experiment (type A uncertainty) and considered the following steps: sample preparation of calibrators, preparation of internal standard, preparation of samples, measurement of calibrators, generation of the calibration curve and measurement and evaluation of sample results. A detailed description of the evaluation of MU is given in Supplementary Material 3.
Results
Traceability to SI units
Traceability to the SI unit of mass (kilogram), the most important parameter for a reference measurement method, has been established by the utilization of tecnazene as the qNMR ISTD which is directly traceable to NIST PS1 (primary qNMR standard). Furthermore, traceability to the SI unit of amount of substance (mole) is also included owing to NIST PS1. Since Planck’s constant is now the main parameter for defining kilogram and Avogadro’s constant for mole, qNMR methodology is best suited to fulfill both the traceability chains and represents a primary RMP per IUPAC [19]. Six individual experiments (Supplementary Material 2, Table S1, Figure S2) involving six individual weightings, yield a final absolute content value of 99.6 % ± 0.4 % (k=2).
Selectivity and specificity
To minimize matrix effects and the co-elution of isobaric interferences (both known and unknown), a two-dimensional heart-cut LC approach for the accurate analysis of cortisol in human serum was selected. Using the Waters Acquity BEH C18 column in the first dimension in combination with mobile phases consisting of 0.2 mM ammonium fluoride (A) and methanol (B) allowed the separation of cortisol from cortisone and prednisone. Cortisol and prednisolone were transferred to the second dimension, where a Raptor Biphenyl column with the same mobile phases was used, showing almost a baseline separation of prednisolone from cortisol (Figure 1). The bias observed within the nominal cortisol concentration, and the calculated cortisol concentration was 4.1 %.
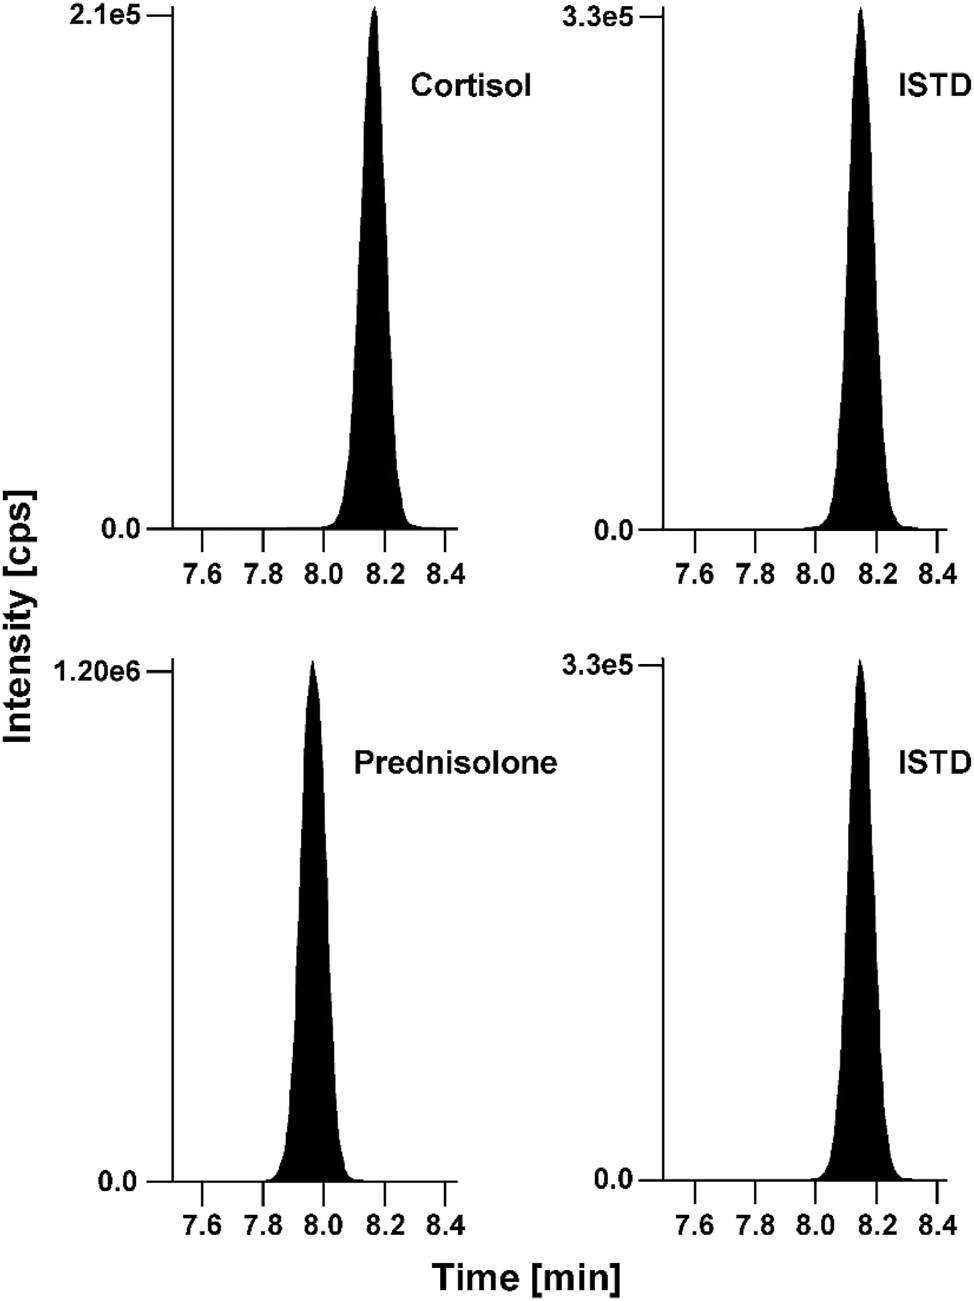
Chromatographic separation of cortisol and prednisolone in a native serum matrix with concentrations of 66.4 ng/mL (183 nmol/L) and 200 ng/mL (555 nmol/L), respectively. Analytes (left) and ISTD (right). ISTD, internal standard.
In addition, no interfering signals for the quantifier transition (m/z 363.3 → 96.9) and the corresponding internal standard quantifier transition (m/z 367.1 → 96.9) were observed at the expected retention time window (8.3 ± 0.5 min) neither in the steroid-free serum nor in the native serum pool (Figure 2).
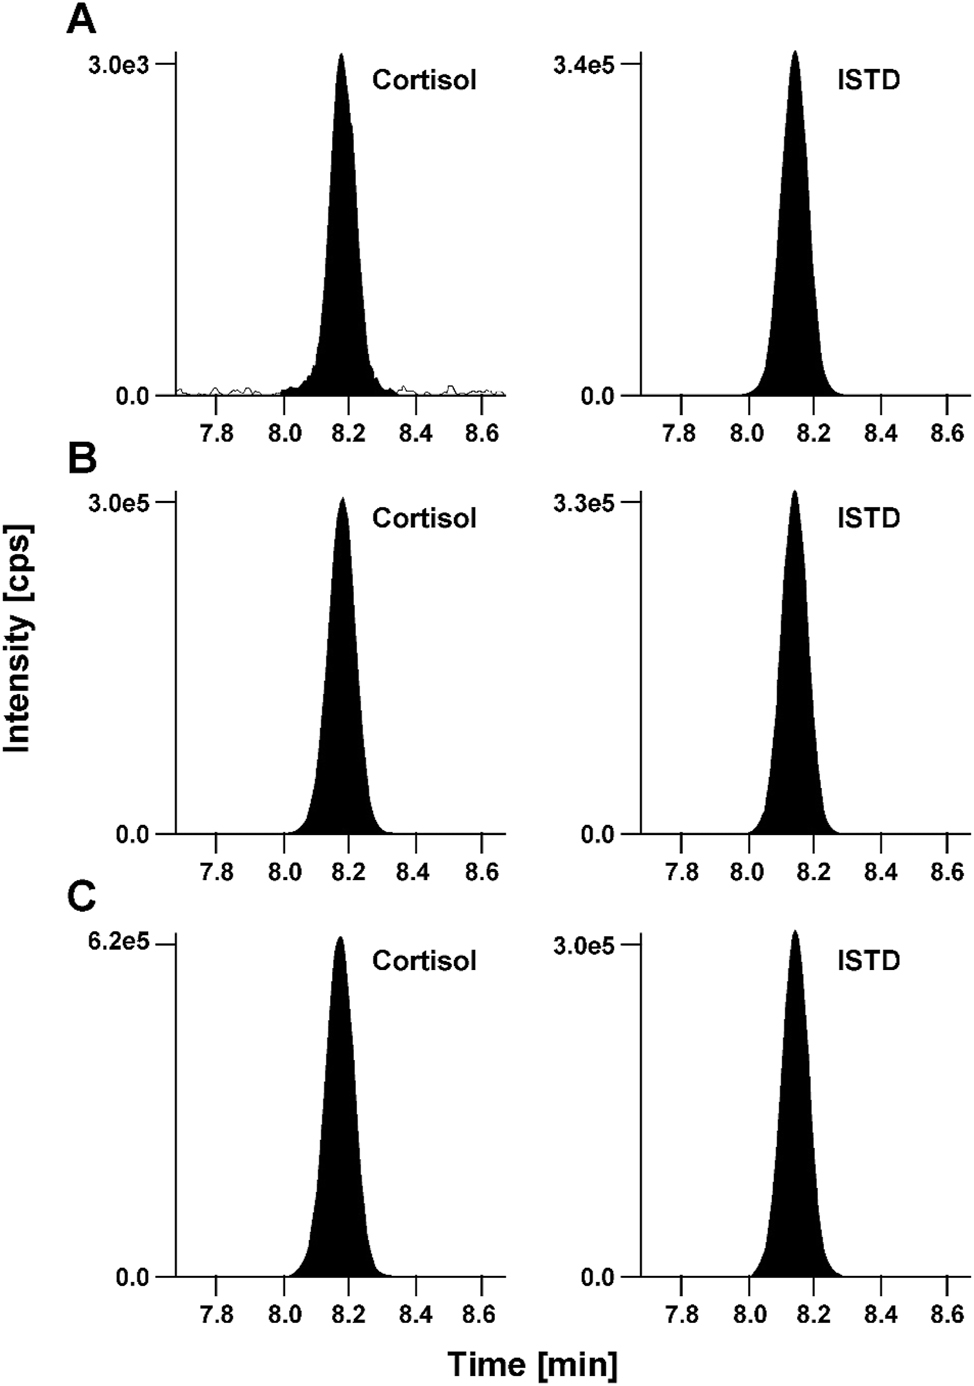
Cortisol LC-MS/MS derived analytical readouts. (A) Chromatogram of calibrator level 1 with a concentration of 0.800 ng/mL (2.21 nmol/L) spiked in steroid-free human serum matrix, analyte (left) and ISTD (right); (B) secondary reference material ERM-DA192 in native human serum with a concentration of 98.8 ng/mL (273 nmol/L), analyte (left) and ISTD (right); (C) fortified Li-Heparin patient sample with a concentration of 242 ng/mL (668 nmol/L), analyte (left) and ISTD (right). ISTD, internal standard.
The steroid-free serum sample spiked with internal standard did not show any significant analyte signal. Therefore, cortisol-d4 can be used as the internal standard.
Matrix effect
In the post-column infusion experiment none of the tested matrices (neat solution, serum or plasma) showed ion suppression or enhancement in the region of the retention time of cortisol and its internal standard. For the comparison of standard line slopes, calibrator levels were spiked in neat solution, native serum, steroid-free serum, and Li-Heparin plasma matrix. Slopes were 0.0092 (95 % CI 0.0090–0.0093) for the neat solution, 0.0089 (95 % CI 0.0087–0.0091) for steroid-free serum, 0.0088 (95 % CI 0.0086–0.0090) for the native matrix and 0.0085 (95 % CI 0.0080–0.0090) for the Li-Heparin plasma. The confidence intervals of the slopes overlapped, suggesting that they were not significantly different from each other. These data confirm the absence of a matrix effect. Correlation coefficients (r) were ≥0.999, irrespective of the matrix used for calibration. Furthermore, recoveries for calibrator samples in surrogate matrix, native serum and Li-Heparin plasma ranged from 93 to 104 %, meeting the acceptance criteria.
Linearity
Linearity was demonstrated by analyzing three individually generated matrix-based calibration curves using individual sample weights, expanded for ±20 % of the expected measuring range. The residuals were randomly and equally distributed and correlation coefficients were r≥0.999 for all individual calibration curves. The linearity of the method was confirmed using serially diluted samples, with measurement results demonstrating a linear dependence (r≥0.999). Recoveries ranged between 99 % and 106 %, also meeting the acceptance criteria.
Lower limit of measuring interval (LLMI) and limit of detection (LOD)
The LLMI was determined using a spiked matrix sample with a concentration of 0.820 ng/mL (2.26 nmol/L), corresponding to the lowest calibrator level. The relative deviation (n=6) was 1.7 %, CV was determined at 3.1 %, and recovery ranged from 98 to 106 %. These findings satisfy the defined analytical performance criteria based on biological variability. The LOD was estimated as 0.229 ng/mL (0.632 nmol/L).
Precision
A multi-day validation experiment was performed to estimate the total variability of the RMP. Variability components were estimated using an ANOVA-based variance component analysis. All samples were prepared in triplicate for each part and injected twice resulting in n=60 measurements over 5 days. However, for level 4, only 59 measurements were used for evaluation due to an acquisition error.
The intermediate precision, encompassing variances from between-day calibration, preparation, and injection, was ≤2.6 %, while the repeatability CV ranged from 0.9 to 1.9 % across all concentration levels (Table 1), confirming that the requirements for imprecision were met.
Detailed precision performance obtained by VCA analysis.
| Variance source | CV, % | |||||
|---|---|---|---|---|---|---|
| Level 1 2.40 ng/mL (6.62 nmol/L) |
Reference A 99.0 ng/mL (273 nmol/L) |
Reference B 277 ng/mL (763 nmol/L) |
Level 4 500 ng/mL (1,379 nmol/L) |
Patient sample 1 45.1 ng/mL (124 nmol/L) |
Patient sample 2 120 ng/mL (331 nmol/L) |
|
| Intermediate | 2.6 | 2.6 | 1.6 | 2.0 | 2.2 | 1.5 |
| Between-day | 1.0 | 1.8 | 1.0 | 0.0 | 1.7 | 1.1 |
| Between-calibration | 1.7 | 0.0 | 0.6 | 1.2 | 0.7 | 0.6 |
| Repeatability | 1.7 | 1.9 | 1.0 | 1.6 | 1.2 | 0.9 |
| Between-preparation | 0.6 | 1.8 | 0.8 | 1.5 | 1.0 | 0.6 |
| Between-injection | 1.6 | 0.7 | 0.7 | 0.6 | 0.7 | 0.6 |
-
Reference A, ERM-DA192; reference B, ERM-DA193; CV, coefficient of variation; VCA, variance component analysis. Conversion factor ng/mL to nmol/L: 2.76. The coefficients of variation for repeatability and intermediate precision, which were determined from the individual variances, are printed in bold.
Trueness and accuracy
Relative mean bias ranged from −1.3 to 1.4 %, independent of the matrix and concentration level. Dilution integrity was determined by using two spiked samples. The mean deviation was −1.8 % for the 800 ng/mL (2,207 nmol/L) spiked sample and −0.3 % for the 1,000 ng/mL (2,759 nmol/L), highlighting that the method is suitable for the analysis of samples up to a target concentration of 1,000 ng/mL (2,759 nmol/L) (Table 2). Overall, these findings meet the requirements and show that the method does not exhibit statistically significant bias and is matrix-independent.
Bias and 95 % CI of certified reference materials, native serum, native Li-Heparin plasma samples and dilutions. The mean bias and corresponding confidence intervals were calculated using the individual sample biases of n=6 preparations.
| Concentration, ng/mL, (nmol/L) | Bias evaluation results | |||
|---|---|---|---|---|
| Mean bias, % | SD, % | 95 % CI, % | ||
| Serum matrix | ||||
|
|
||||
| Level 1 | 2.40 (6.62) | 1.4 | 1.5 | 0.2 to 2.6 |
| Reference A | 99.0 (273) | 0.9 | 1.1 | 0.1 to 1.8 |
| Reference B | 277 (763) | 1.2 | 0.5 | 0.8 to 1.6 |
| Level 4 | 500 (1,379) | 0.7 | 1.9 | −0.8 to 2.2 |
| Dilution 1 | 800 (2,207) | −1.8 | 1.4 | −2.9 to −0.7 |
| Dilution 2 | 1,000 (2,759) | −0.3 | 0.8 | −1.0 to 0.3 |
|
|
||||
| Plasma matrix | ||||
|
|
||||
| Level 1 | 100 (276) | 0.0 | 1.9 | −1.5 to 1.5 |
| Level 2 | 250 (690) | −0.6 | 0.5 | −1.0 to −0.2 |
| Level 3 | 550 (1,517) | −1.3 | 1.3 | −2.3 to −0.2 |
-
Reference A, ERM-DA192; reference B, ERM-DA193; SD, standard deviation; CI, confidence interval. Conversion factor ng/mL to nmol/L: 2.76.
Sample stability
Autosampler stability of processed samples (4–8 °C) was shown for 16 days. Recoveries ranged between 97 % and 108 %. The stability of neat spike solutions and spiked control samples were determined for 39 and 16 weeks, respectively; recoveries ranged between 95 % and 108 %.
Equivalence of results between independent laboratories
To demonstrate the transferability of the RMP to a second laboratory, a method comparison study was performed with the Department of Pediatrics and Adolescent Medicine, University Hospital Erlangen. A total of 164 samples were analyzed in both laboratories, of which two samples showed concentrations below the lower limit of measuring interval. Figure depicts the very good agreement observed between the two laboratories, resulting in a regression equation with a slope of 1.01 (95 % CI 1.00 to 1.02) and an intercept of −0.54 (95 % CI −1.74–0.15) and r=0.998 (Figure 3A). Bland-Altman analysis showed very good agreement with a mean bias of −0.1 % which does not differ statistically significant from zero. The 2S interval of the relative difference was 8.3 % (lower limit CI interval from −9.5 to −7.2 %, upper limit CI interval from 7.1 to 9.3 %) (Figure 3B). The three-day precision experiment resulted in CVs that were comparable to those of the first laboratory. Intermediate precision was 0.8–2.4 %, and repeatability was <1.7 % for all levels except for the lowest level (reported at 4.9 % and 3.5 %, respectively). These data indicate that the proposed RMP for cortisol is transferable between laboratories, emphasizing the robustness of the protocol design.
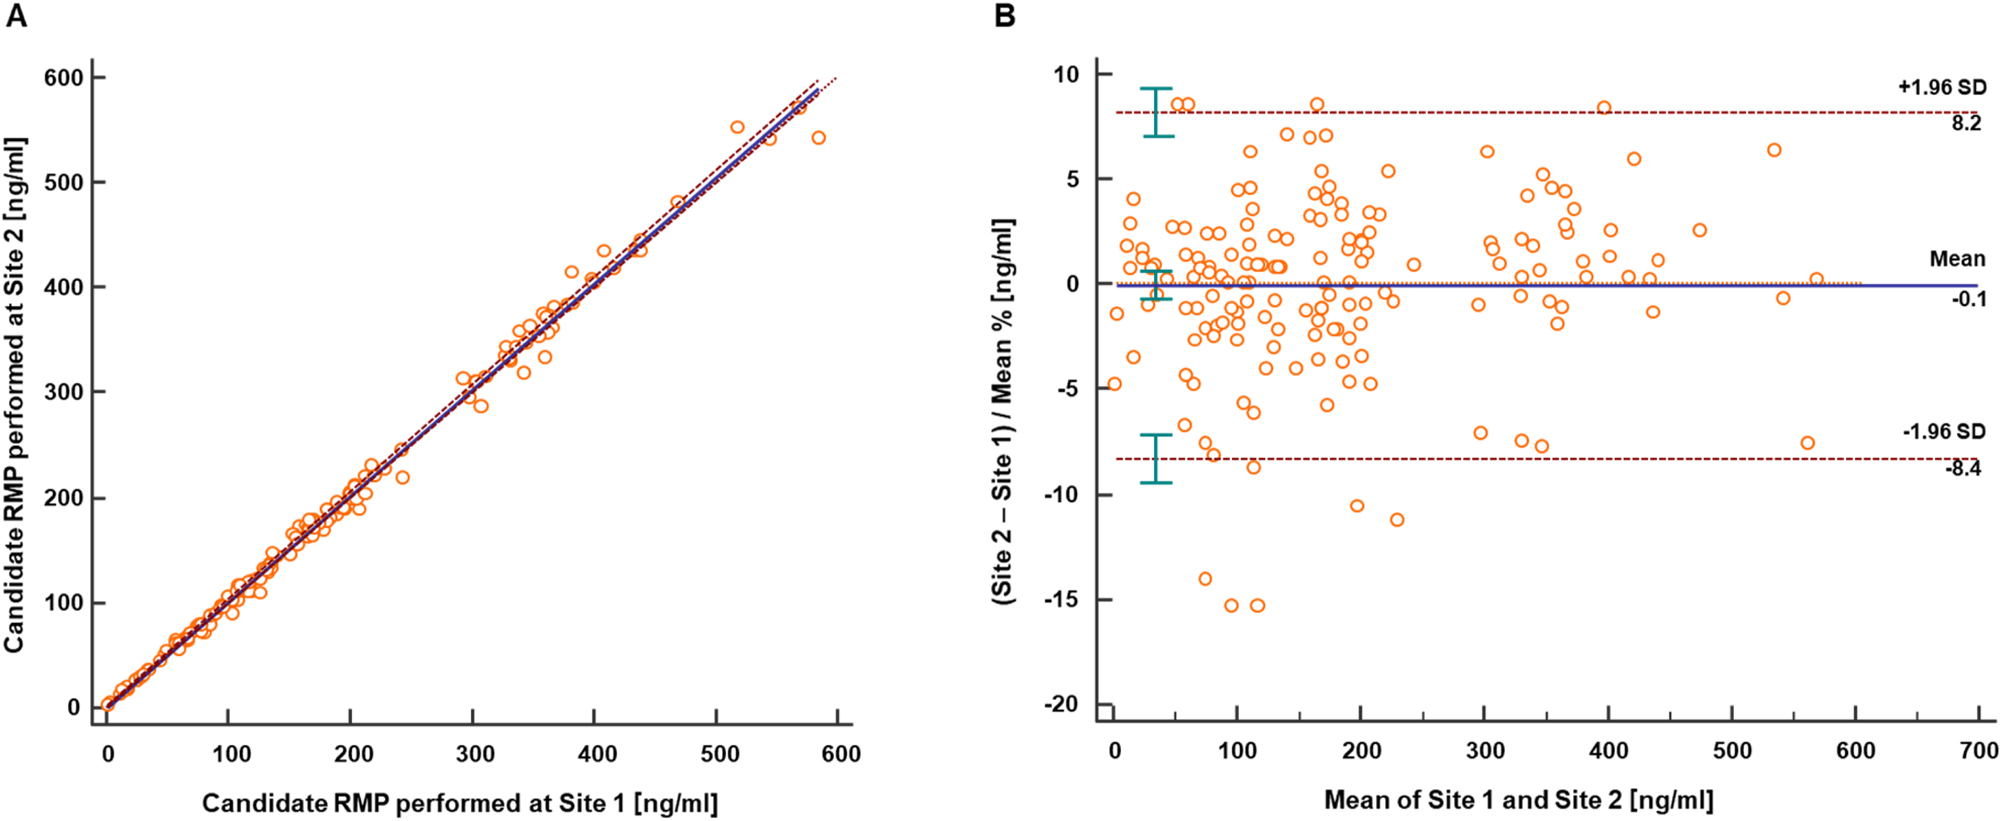
Results from the cortisol method comparison study performed between two independent laboratories. (A) Passing-Bablok regression plot for the method comparison study of the RMP (n=162) performed between the Roche Diagnostics GmbH Penzberg (site 1) and the Department of Pediatrics and Adolescent Medicine and Adolescents, University Hospital Erlangen (site 2). The analysis resulted in a regression equation with a slope of 1.01 (95 % CI 1.00–1.02) and intercept of −0.54 (95 % CI −1.74–0.15). The correlation coefficient was 0.998. (B) Bland-Altman analysis showed a mean bias of −0.1 % (95 % CI −0.7–0.6) and an associated 2S interval of 8.3 % (lower limit CI interval from −9.5 to −7.2 %, upper limit CI interval from 7.1 to 9.3 %). CI, confidence interval; RMP, reference measurement procedure; SD, standard deviation.
In order to establish comparability with an in-house developed high-throughput LC-MS/MS based assay [29], an additional method comparison study was conducted. This assay used a commercially available kit for calibration. A total of n=165 native patient samples were analysed, with 4 samples falling below the lower limit of the measuring interval and 38 samples exceeding the upper limit of the measuring interval in the in-house developed assay. The Passing-Bablok regression analysis resulted in a regression equation with a slope of 1.09 (95 % CI 1.07 to 1.11) and an intercept of 1.02 (95 % CI −0.42 to 3.17) with r=0.990 (Figure 4A). Furthermore, the Bland-Altman analysis revealed a mean bias of 10 % and a corresponding 2S interval of approximately 12 % (with a lower limit CI interval ranging from −4.3 to −0.4 % and an upper limit CI interval ranging from 20.5 to 24.4 %) (Figure 4B).

Results from the cortisol method comparison study performed between the RMP and a well-established routine LC-MS/MS based assay. (A) Passing-Bablok regression plot for the method comparison study of the RMP (n=123) performed between the Roche Diagnostics GmbH Penzberg (site 1) and the Institute of Laboratory Medicine, University Hospital Leipzig (site 3). The analysis resulted in a regression equation with a slope of 1.09 (95 % CI 1.07–1.12) and intercept of 1.02 (95 % CI −0.42 to 3.17). The correlation coefficient was 0.990. (B) Bland-Altman analysis showed a mean bias of 10 % (95 % CI 8.9–11.2) and an corresponding 2 SD of approximately 12 % (with a lower limit CI interval ranging from −4.3 to −0.4 % and an upper limit CI interval ranging from 20.5 to 24.4 %). CI, confidence interval; RMP, reference measurement procedure; SD, standard deviation.
Equivalence to JCTLM listed RMPs
Equivalence between the candidate RMP and the JCTLM-listed RMPs, NRMeth 57 and NRMeth 8, was assessed by measuring the certified IFCC reference panel. Passing-Bablok analysis showed a very good agreement resulting in a regression equation with a slope of 1.00 (95 % CI 0.99 to 1.01) an intercept of 2.33 (95 % CI −1.02–4.70) and r=1.000 (Figure 5A). The Bland-Altman analysis showed a mean bias of 1.0 % (95 % CI 0.6–1.5) and a corresponding 2S interval of approximately 4.5 % (with a lower limit CI interval ranging from −2.3 to −0.7 % and an upper limit CI interval ranging from 2.8 to 4.4 %) (Figure 5B).
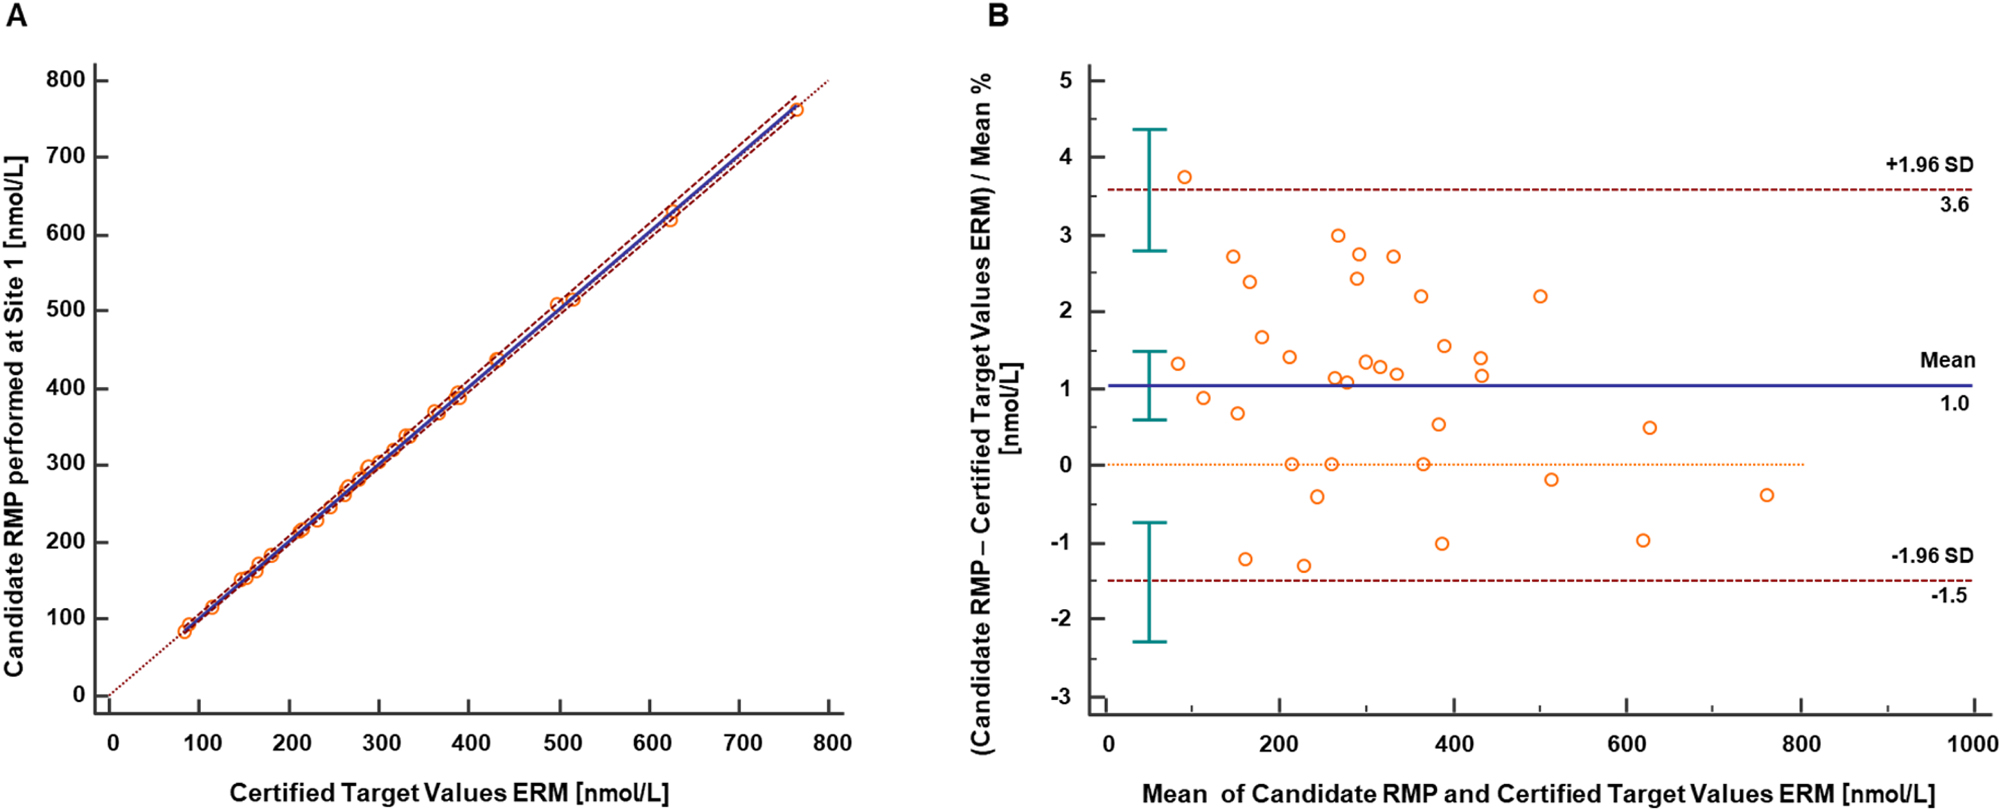
Results from equivalence study between the candidate RMP and the IFCC Cortisol Reference Serum Panel ERM-DA451. The results provided in the ERM Panel’s certificate are given in nmol/L. (A) Passing-Bablok regression between the candidate RMP and the certified concentration for the IFCC reference panel ERM-DA451 (n=34). The analysis resulted in a regression equation with a slope of 1.00 (95 % CI 0.99–1.02) and an intercept of 2.33 (95 % CI −1.02–4.70). The correlation coefficient was 1.000. (B) Bland-Altman analysis showed a mean bias of 1.0 % (95 % CI 0.6–1.5) and corresponding 2SD of approximately 4.5 % (with a lower limit CI interval ranging from −2.3 to −0.7 % and an upper limit CI interval ranging from 2.8 to 4.4 %). Conversion factor ng/mL to nmol/L: 2.76; CI, confidence interval; RMP, reference measurement procedure; SD, standard deviation.
The relative difference between the candidate RMP results (average of n=4) and the certified concentration for the IFCC reference panel ERM®-DA451 ranged between −1.3 and 3.8 %. Total measurement uncertainty was calculated as combined uncertainty of the calibrator preparation (unc cal ) and uncertainty (SD) of the mean of measurement results (unc mean ), resulting in uncertainties between 0.7 and 2.3 % (k=1).
Results from the RELA Scheme for 2022 and 2023 align with those from listed laboratories, including the JCTLM-listed services, one of which is the Reference Institute for Bioanalytics (see Table 3). Data from the 2024 participation have not yet been published.
External quality control for reference laboratories – RELA scheme.
| Laboratory | Sample A, | Expanded uncertainty, | Sample B, | Expanded uncertainty, | Method | |
|---|---|---|---|---|---|---|
| nmol/L | nmol/L | nmol/L | nmol/L | |||
| Year 2022 | A | 925.9 | 9.5 | 355.5 | 4.2 | ID/GC/MS |
| B | 921.9 | 9.2 | 358.2 | 3.6 | ID/GC/MS | |
| C | 889.6 | 18.54 | 346.2 | 6.88 | ID/LC/MS/MS | |
| D | 908.3 | 44.69 | 353.6 | 17.1 | ID/LC/MS/MS | |
| Roche | 944 | 22.85 | 358.8 | 8.17 | ID/LC/MS/MS | |
| Year 2023 | A | 406.3 | 4.1 | 1,004 | 12 | ID/GC/MS |
| B | 401.6 | 9.4 | 985.6 | 22.7 | ID/LC/MS/MS | |
| C | 401.9 | 8.1 | 995.1 | 21.8 | ID/LC/MS/MS | |
| Roche | 400.2 | 6.431 | 982.6 | 13.8 | ID/LC/MS/MS |
-
Results from laboratories recognized as JCTLM-listed services are presented. The results are presented in nmol/L, as shown on the RELA homepage. Conversion factor ng/mL to nmol/L: 2.76.
Estimation of MU
The measurement uncertainties (k=1) for cortisol in single measurements were ≤2.8 % regardless of the concentration level and sample type as shown in Table 4. These uncertainties were estimated by combining the uncertainty of calibrator preparation (unc cal ) and the precision experiment (unc prec ). To ensure the error is not underestimated the calibrator level with the higher uncertainty was chosen for each individual sample concentration level. The derived expanded uncertainty was then multiplied by a coverage factor of k=2, which corresponds to an approximate confidence level of 95 %, assuming a normal distribution. The resulting expanded uncertainty and was ≤5.7 %.
Overview of measurement uncertainty for cortisol quantification with the candidate RMP for single measurements.
| Level | |||||||
|---|---|---|---|---|---|---|---|
| Level 1 2.40 ng/mL (6.62 nmol/L) |
Reference A 99.0 ng/mL (273 nmol/L) |
Reference B 277 ng/mL (763 nmol/L) |
Level 4 500 ng/mL (1,379 nmol/L) |
Patient sample 1 45.1 ng/mL (124 nmol/L) |
Patient sample 2 120 ng/mL (331 nmol/L) |
||
|
Type B uncertainty
Calibrator preparation, CV (%) |
1.1 | 0.6 | 0.7 | 0.7 | 0.8 | 0.6 | |
| Characterization of reference material | 0.20 | 0.20 | 0.20 | 0.20 | 0.20 | 0.20 | |
| Preparation of | |||||||
| Stock solution | 0.21 | 0.21 | 0.21 | 0.21 | 0.21 | 0.21 | |
| Working solution | 0.29 | 0.29 | 0.29 | 0.29 | 0.29 | 0.29 | |
| Spike solution | 0.98 | 0.37 | 0.40 | 0.40 | 0.59 | 0.37 | |
| Matrix based calibrator | 1.1 | 0.63 | 0.65 | 0.65 | 0.78 | 0.63 | |
|
Type A uncertainty
intermediate precision, CV (%) |
2.6 | 2.6 | 1.6 | 2.0 | 2.2 | 1.5 | |
| M easurement uncertainty (k=1), CV (%) | 2.8 | 2.7 | 1.7 | 2.1 | 2.3 | 1.6 | |
| Expanded measurement uncertainty (k=2), CV (%) | 5.7 | 5.4 | 3.4 | 4.3 | 4.7 | 3.3 | |
-
Reference A, ERM-DA192; reference B, ERM-DA193 uncertainties are expressed as CV for better interpretability. CV, coefficient of variation. Conversion factor ng/mL to nmol/L: 2.76. The measurement uncertainty of the whole approach for a single measurement estimated as a combination of the uncertainty of calibrator preparation (type B uncertainty) and uncertainty of the precision experiment (type A uncertainty) are given in bold.
For target value assignment, the uncertainty was reduced due to a higher number of measurements (n=6, 3 measurements on 2 days). As a result, the uncertainty (k=1) ranged from 0.7–1.9 %, leading to an expanded measurement uncertainty (k=2) of 1.4–3.8 %, meeting the defined analytical performance specification for the maximum allowable expanded measurement uncertainty (Table 5).
Overview of measurement uncertainty for target value assignment (n=6).
| Level | |||||||
|---|---|---|---|---|---|---|---|
| Level 1 2.40 ng/mL (6.62 nmol/L) |
Reference A 99.0 ng/mL (273 nmol/L) |
Reference B 277 ng/mL (763 nmol/L) |
Level 4 500 ng/mL (1,379 nmol/L) |
Patient sample 1 45.1 ng/mL (124 nmol/L) |
Patient sample 2 120 ng/mL (331 nmol/L) |
||
|
Type B uncertainty
Calibrator preparation, CV (%) |
1.1 | 0.6 | 0.7 | 0.7 | 0.8 | 0.6 | |
| Characterization of reference material | 0.20 | 0.20 | 0.20 | 0.20 | 0.20 | 0.20 | |
| Preparation of | |||||||
| Stock solution | 0.21 | 0.21 | 0.21 | 0.21 | 0.21 | 0.21 | |
| Working solution | 0.29 | 0.29 | 0.29 | 0.29 | 0.29 | 0.29 | |
| Spike solution | 0.98 | 0.37 | 0.40 | 0.40 | 0.59 | 0.37 | |
| Matrix based calibrator | 1.1 | 0.63 | 0.65 | 0.65 | 0.78 | 0.63 | |
|
Type A uncertainty
intermediate precision, CV (%) |
1.5 | 0.8 | 0.3 | 0.7 | 0.2 | 0.7 | |
|
Measurement uncertainty
target value assignment, CV (%) |
1.9 | 1.0 | 0.7 | 1.0 | 0.8 | 0.9 | |
| Expanded measurement uncertainty (k=2), CV (%) | 3.8 | 2.0 | 1.5 | 1.9 | 1.6 | 1.8 | |
-
Reference A, ERM-DA192; reference B, ERM-DA193 uncertainties are expressed as CV for better interpretability. CV, coefficient of variation. Conversion factor ng/mL to nmol/L: 2.76. The measurement uncertainty of the whole approach for a target value assignmet estimated as a combination of the uncertainty of calibrator preparation (type B uncertainty) and uncertainty of the precision experiment (type A uncertainty) are given in bold.
Discussion
A candidate RMP has been developed and validated to quantify cortisol in human serum and plasma using ID-LC-MS/MS analysis. The new method met the accuracy, selectivity, and reproducibility required for a higher-order RMP and fulfilled the performance specifications for RPMs based on the biological variability parameters established by EFLM [23]. The traceability relies on the use of the qNMR, which provides highly accurate quantification (mass fraction) of the analyte along with precise evaluation of MU. In addition, a high level of agreement was observed between the new candidate RMP and the certified reference serum panel ERM®-DA451/IFCC, which demonstrated that the established procedure is equivalent to the JCTLM-listed RMPs [10], 11].
In general, ID-LC-MS/MS methods provide a more accurate alternative to routine cortisol analysis based on immunoassays that are subject to interference from cross-reactivity of reagent antibodies with structurally-related steroids, as well as binding proteins, in serum [30]. The use of LC also leads to advantages over existing RMPs based on gas chromatography (GC) as the separation technique [10], 11]. The GC technique requires the derivatization of cortisol to make it volatile, so suitable for analysis. This step increases the sample preparation time and may cause sample degradation. Additionally, the technique involves the use of compressed gases like nitrogen, argon, helium, and flammable and toxic chemicals, depending on the derivatization reaction, which poses health and safety risks.
Noteworthy strengths include high selectivity, traceability, precision, and reproducibility. The high selectivity, demonstrated as the ability to analyze cortisol without the interference of the matrix or similar glucocorticoids (e.g., prednisolone), is due to the use of a two-dimensional heart-cut chromatography combined with two orthogonal stationary and mobile phases. This technique is able to increase peak capacity and avoid co-elution of interferences.
Another advantage of the new procedure over previously described RMPs [10], 11], 13], primarily based on the bracketing calibration method which requires a high sample volume, is its calibration concept that requires a smaller sample volume while maintaining comparable accuracy, precision, and measurement uncertainty. In addition to the primary aim of target value assignment, this method allows large method comparison studies to be measured in a reasonable time frame as well as the ability to analyze critical samples with limited sample volume.
Transferability was clearly demonstrated during the method comparison performed at the Department of Pediatrics and Adolescent Medicine, University Hospital Erlangen, where the obtained data showed a very good agreement between the two laboratories. The SLE sample preparation protocol used in the first laboratory was easily adapted to the automated 96-well plate format in the second laboratory, as demonstrated by the precision experiment, which resulted in comparable inter-lab CV values.
The method comparison study between the RMP and the in-house LC-MS/MS-based assay showed a good correlation and an expected scattering, although a positive deviation was observed. The results are consistent with the larger framework of cortisol measurements. The proficiency test for hormone assays organized by the Reference Institute for Bioanalytics (RfB) allows for a maximum deviation of 30 % from the target value established in accordance with the guidelines of the German Medical Association (RiliBÄK).
This year’s overall between laboratory variability of the LC-MS/MS cortisol measurements ranges from 7.3 to 19.7 % CV, as evident from the RfB database [31], which shows that variability between laboratories is higher than the observed positive deviation in our method comparison study.
Conclusions
This highly selective 2D-LC-MS/MS candidate RMP produces accurate and reproducible results for determining cortisol in a working range of 0.800–600 ng/mL (2.21–1,655 nmol/L). The performance of the method enables its use for the evaluation and standardization of routine assays and the measurement of cortisol in individual patient samples with ensured traceability.
Acknowledgments
We would like to thank Aline Hoffmeister, Monika Kriner, and Michael Dedio for their support in selecting and providing samples. Editorial support, under the direction of the authors, was provided by Graziella Greco and Jade Drummond of inScience Communications, Springer Healthcare Ltd, UK, and was funded by Roche Diagnostics GmbH. (Penzberg, Germany).
-
Research ethics: All procedures were in accordance with the Helsinki Declaration. All samples used were exclusively anonymized samples.
-
Informed consent: Not applicable.
-
Author contributions: All authors have contributed to the manuscript conception and design; acquisition, or analysis and interpretation of data; drafting or revision; and final approval of the published article.
-
Use of Large Language Models, AI and Machine Learning Tools: Roche Chat, Roche's artificial intelligence (AI) Technology, was used to improve the language of the manuscript.
-
Conflict of interest: Judith Taibon, Christian Geletneky, Neeraj Singh, Myriam Ott, Kerstin Kandler and Andrea Geistanger are all employees of Roche Diagnostics GmbH. Friederike Bauland is an employee of Chrestos Concept GmbH & Co. KG, Essen, Germany. Manfred Rauh and Daniel Köppl are employees of the Department of Pediatrics and Adolescent Medicine, University Hospital Erlangen. Uta Ceglarek and Alexander Gaudl are employees of the Institute of Laboratory Medicine, Clinical Chemistry and Molecular Diagnostics, University of Leipzig Medical Center. Roche employees holding Roche non-voting equity securities (Genussscheine): Judith Taibon, Christian Geletneky, Andrea Geistanger, Myriam Ott, Kerstin Kandler.
-
Research funding: This research was funded by Roche Diagnostics GmbH. Manfred Rauh and Uta Ceglarek with team are funded cooperation partners of Roche Diagnostics GmbH.
-
Data availability: The raw data can be obtained on request from the corresponding author.
References
1. James, KA, Stromin, JI, Steenkamp, N, Combrinck, MI. Understanding the relationships between physiological and psychosocial stress, cortisol and cognition. Front Endocrinol 2023;14:1085950. https://doi.org/10.3389/fendo.2023.1085950.Search in Google Scholar PubMed PubMed Central
2. Raff, H, Sharma, ST, Nieman, LK. Physiological basis for the etiology, diagnosis, and treatment of adrenal disorders: Cushing’s syndrome, adrenal insufficiency, and congenital adrenal hyperplasia. Compr Physiol 2014;4:739–69. https://doi.org/10.1002/cphy.c130035.Search in Google Scholar PubMed PubMed Central
3. Turpeinen, U, Hamalainen, E. Determination of cortisol in serum, saliva and urine. Best Pract Res Clin Endocrinol Metabol 2013;27:795–801. https://doi.org/10.1016/j.beem.2013.10.008.Search in Google Scholar PubMed
4. Wood, L, Ducroq, DH, Fraser, HL, Gillingwater, S, Evans, C, Pickett, AJ, et al.. Measurement of urinary free cortisol by tandem mass spectrometry and comparison with results obtained by gas chromatography-mass spectrometry and two commercial immunoassays. Ann Clin Biochem 2008;45:380–8. https://doi.org/10.1258/acb.2007.007119.Search in Google Scholar PubMed
5. Jia, M, Chew, WM, Feinstein, Y, Skeath, P, Sternberg, EM. Quantification of cortisol in human eccrine sweat by liquid chromatography - tandem mass spectrometry. Analyst 2016;141:2053–60. https://doi.org/10.1039/c5an02387d.Search in Google Scholar PubMed PubMed Central
6. Gant, KA, Araque, KA, Nguyen, H, Wei, B, Hosseini, S, Soldin, SJ. The effect of specific binding proteins on immunoassay measurements of total and free thyroid hormones and cortisol. Ther Adv Endocrinol Metab 2021;12:2042018821989240. https://doi.org/10.1177/2042018821989240.Search in Google Scholar PubMed PubMed Central
7. Kushnir, MM, Rockwood, AL, Bergquist, J. Liquid chromatography-tandem mass spectrometry applications in endocrinology. Mass Spectrom Rev 2010;29:480–502. https://doi.org/10.1002/mas.20264.Search in Google Scholar PubMed
8. Fanelli, F, Cantu, M, Temchenko, A, Mezzullo, M, Lindner, JM, Peitzsch, M, et al.. Report from the HarmoSter study: impact of calibration on comparability of LC-MS/MS measurement of circulating cortisol, 17OH-progesterone and aldosterone. Clin Chem Lab Med 2022;60:726–39. https://doi.org/10.1515/cclm-2021-1028.Search in Google Scholar PubMed
9. Joint committee on traceability in laboratory medicine (JCTLM). https://www.jctlm.org/ [Accessed 12 Apr 2024].Search in Google Scholar
10. Siekmann, L, Breuer, H. Determination of cortisol in human plasma by isotope dilution-mass spectrometry. Definitive Methods Clin Chem, I. J Clin Chem Clin Biochem 1982;20:883–92. https://doi.org/10.1515/cclm.1982.20.12.883.Search in Google Scholar PubMed
11. Thienpont, LM, De Brabandere, VI, Stockl, D, De Leenheer, AP. Candidate reference method for determining serum cortisol based on isotope dilution-gas chromatography/mass spectrometry using heptafluorobutyrilation as derivatization method. Anal Biochem 1996;234:204–9. https://doi.org/10.1006/abio.1996.0073.Search in Google Scholar PubMed
12. Tai, SS, Welch, MJ. Development and evaluation of a candidate reference method for the determination of total cortisol in human serum using isotope dilution liquid chromatography/mass spectrometry and liquid chromatography/tandem mass spectrometry. Anal Chem 2004;76:1008–14. https://doi.org/10.1021/ac034966f.Search in Google Scholar PubMed
13. Zhang, T, Zhao, H, Li, M, Zeng, J, Wang, J, Long, Q, et al.. Development and validation of a candidate reference method for serum cortisol by isotope dilution liquid chromatography-tandem mass spectrometry combined with dextran sulfate-Mg(2+) precipitation. Anal Bioanal Chem 2020;412:1325–33. https://doi.org/10.1007/s00216-019-02356-2.Search in Google Scholar PubMed
14. Certificate of Analysis_Standard reference material 921. https://tsapps.nist.gov/srmext/certificates/archives/921.pdf [Accessed 22 May 2024].Search in Google Scholar
15. Certificate of Analysis_Standard reference material 921a. https://tsapps.nist.gov/srmext/certificates/921a.pdf [Accessed 22 May 2024].Search in Google Scholar
16. Singh, N, Taibon, J, Pongratz, S, Geletneky, C. Absolute content determination by quantitative NMR (qNMR) spectroscopy: a curious case of aldosterone. RSC Adv 2021;11:23627–30. https://doi.org/10.1039/d1ra03472c.Search in Google Scholar PubMed PubMed Central
17. Singh, N, Taibon, J, Pongratz, S, Geletneky, C. Quantitative NMR (qNMR) spectroscopy based investigation of the absolute content, stability and isomerization of 25-hydroxyvitamin D2/D3 and 24(R),25-dihydroxyvitamin D2 in solution phase. Sci Rep 2022;12:3014. https://doi.org/10.1038/s41598-022-06948-4.Search in Google Scholar PubMed PubMed Central
18. Nelson, MA, Waters, JF, Toman, B, Lang, BE, Rück, A, Breitruck, K, et al.. A new realization of SI for organic chemical measurement: NIST PS1 primary standard for quantitative NMR (benzoic acid). Anal Chem 2018;90:10510–17. https://doi.org/10.1021/acs.analchem.8b02575.Search in Google Scholar PubMed PubMed Central
19. Westwood, S, Lippa, K, Shimuzu, Y, Lalerle, B, Saito, T, Duewer, D, et al.. Methods for the SI-traceable value assignment of the purity of organic compounds (IUPAC Technical Report). Pure Appl Chem 2023;95:1–77. https://doi.org/10.1515/pac-2020-0804.Search in Google Scholar
20. Panteghini, M. Traceability as a unique tool to improve standardization in laboratory medicine. Clin Biochem 2009;42:236–40. https://doi.org/10.1016/j.clinbiochem.2008.09.098.Search in Google Scholar PubMed
21. In vitro diagnostic medical devices - measurement of quantities in samples of biological origin - requirements for content and presentation of reference measurement procedures; 2018. https://www.iso.org/standard/42021.html [Accessed 26 Apr 2024].Search in Google Scholar
22. In vitro diagnostic medical devices - measurement of quantities in samples of biological origin - requirements for certified reference materials and the content of supporting documentation. https://www.iso.org/standard/42022.html [Accessed 26 Apr 2024].Search in Google Scholar
23. European Federation of Clinical Chemistry and Laboratory Medicine (EFLM). EFLM biological variation database – cortisol. https://biologicalvariation.eu/search?query=Cortisol [Accessed 21 Oct 2024].Search in Google Scholar
24. Miller, WG. The role of analytical performance specifications in international guidelines and standards dealing with metrological traceability in laboratory medicine. Clin Chem Lab Med 2024;62:1462–9. https://doi.org/10.1515/cclm-2023-1201.Search in Google Scholar PubMed
25. Clinical and Laboratory Standards Institute (CLSI). C62-A. Liquid chromatography-mass spectrometry methods; approved guideline. In: CLSI document C62-A. Wayne, PA: Clinical and Laboratory Standard Institute; 2014.Search in Google Scholar
26. Working Group 1 of the Joint Committee for Guides in Metrology (JCGM/WG1). Evaluation of measurement data – guide to the expression of uncertainty in measurement (GUM), (2008; GUM 1995 with minor corrections). https://www.bipm.org/documents/20126/2071204/JCGM_100_2008_E.pdf/cb0ef43f-baa5-11cf-3f85-4dcd86f77bd6 [Accessed 18 Apr 2024].Search in Google Scholar
27. Taibon, J, Santner, T, Singh, N, Ibrahim, SC, Babitzki, G, Köppl, D, et al.. An isotope dilution-liquid chromatography-tandem mass spectrometry (ID-LC-MS/MS)-based candidate reference measurement procedure (RMP) for the quantification of aldosterone in human serum and plasma. Clin Chem Lab Med 2023;61:1902–16. https://doi.org/10.1515/cclm-2022-0996.Search in Google Scholar PubMed
28. VCA: variance component analysis. https://cran.r-project.org/web/packages/VCA/VCA.pdf [Accessed 18 April 2024].Search in Google Scholar
29. Gaudl, A, Kratzsch, J, Bae, YJ, Kiess, W, Thiery, J, Ceglarek, U. Liquid chromatography quadrupole linear ion trap mass spectrometry for quantitative steroid hormone analysis in plasma, urine, saliva and hair. J Chromatogr A 2016;1464:64–71. https://doi.org/10.1016/j.chroma.2016.07.087.Search in Google Scholar PubMed
30. Tate, J, Ward, G. Interferences in immunoassay. Clin Biochem Rev 2004;25:105–20.Search in Google Scholar
31. Reference Institute for Bioanalytics, surveys cortisol; 2024. https://www.rfb.bio/cgi/surveys?searchType=analyte&rv_type=all&analyte=Cortisol&year=2024 [Accessed 17. Jul 2024].Search in Google Scholar
Supplementary Material
This article contains supplementary material (https://doi.org/10.1515/cclm-2024-0879).
© 2025 the author(s), published by De Gruyter, Berlin/Boston
This work is licensed under the Creative Commons Attribution 4.0 International License.
Articles in the same Issue
- Frontmatter
- Editorial
- Keeping pace with patient safety by developing and qualifying higher-order reference measurement procedures for laboratory measurement standardization
- Review
- The role of AI in pre-analytical phase – use cases
- Opinion Paper
- Total laboratory automation: fit for its intended purposes?
- Guidelines and Recommendations
- EFLM checklist for the assessment of AI/ML studies in laboratory medicine: enhancing general medical AI frameworks for laboratory-specific applications
- Candidate Reference Measurement Procedures and Materials
- An isotope dilution-liquid chromatography-tandem mass spectrometry-based candidate reference measurement procedure for the quantification of cortisol in human serum and plasma
- Isotope dilution-liquid chromatography-tandem mass spectrometry-based candidate reference measurement procedures for the quantification of 24(R),25-dihydroxyvitamin D2 and 24(R),25-dihydroxyvitamin D3 in human serum and plasma
- An isotope dilution-liquid chromatography-tandem mass spectrometry-based candidate reference measurement procedure for the quantification of cortisone in human serum and plasma
- Candidate reference measurement procedure based on isotope dilution-two dimensional-liquid chromatography-tandem mass spectrometry for the quantification of androstenedione in human serum and plasma
- An isotope dilution-liquid chromatography-tandem mass spectrometry-based candidate reference measurement procedure for the quantification of 17β-estradiol in human serum and plasma
- Isotope dilution-liquid chromatography-tandem mass spectrometry-based candidate reference measurement procedures for the quantification of total and free phenytoin in human serum and plasma
- An isotope dilution-liquid chromatography-tandem mass spectrometry based candidate reference measurement procedure for the simultaneous quantification of 25-hydroxyvitamin D3 and 25-hydroxyvitamin D2 in human serum and plasma
- General Clinical Chemistry and Laboratory Medicine
- Quality assurance using patient split samples: recommendations for primary healthcare laboratories
- Age distorts the interpretation of FIB-4
- Not all anti-parietal cell antibody tests are equal for diagnosing pernicious anemia
- Impact of renal and hepatic function on dihydropyrimidine dehydrogenase phenotype assessed by enzyme activity in peripheral blood mononuclear cells and uracilemia
- Fecal leukocyte esterase levels predict endoscopic severity as an alternative biomarker in inflammatory bowel disease
- Cancer Diagnostics
- CA-125 glycovariant assays enhance diagnostic sensitivity in the detection of epithelial ovarian cancer
- Cardiovascular Diseases
- Defining the analytical characteristics of a novel high-sensitivity point-of-care troponin I assay in its intended clinical environment
- An automatic chemiluminescence immunoassay for a novel biomarker NT-IGFBP-4: analytical performance and clinical relevance in heart failure
- Analysis of total cholesterol results measured in the initial period of the Croatian screening program for familial hypercholesterolemia: a pilot study
- Diabetes
- Comparison of seven different enzymatic methods for serum glycated albumin in pregnant women: a multicenter study
- Infectious Diseases
- Comparative analysis of monocyte distribution width alterations in Escherichia coli sepsis: insights from in vivo and ex vivo models
- Proadrenomedullin for prediction of early and mid-term mortality in patients hospitalized for community-acquired pneumonia
- Annual Reviewer Acknowledgment
- Reviewer Acknowledgment
- Letters to the Editor
- Biological variation of serum Golgi protein 73 concentrations
- Are vitamins A and E results truly traceable and clinically useful? A practical and critical inquiry
- Tafasitamab interference in immunofixation electrophoresis
- Improvement in the turnaround time of PTH(1–84) as part of the intraoperative PTH monitoring for parathyroidectomy
- Rethinking the use of “one-way ANOVA” in CLSI EP15-A3 – a call for terminological precision and methodological clarity
- Toxic beauty: acute kidney injury triggered by hair-straightening treatment
- Congress Abstracts
- 57th National Congress of the Italian Society of Clinical Biochemistry and Clinical Molecular Biology (SIBioC – Laboratory Medicine)