Isotope dilution-liquid chromatography-tandem mass spectrometry-based candidate reference measurement procedures for the quantification of total and free phenytoin in human serum and plasma
-
Tobias Schierscher
 ,
Janik Wild
,
Janik Wild


Abstract
Objectives
An isotope dilution-liquid chromatography-tandem mass spectrometry (ID-LC-MS/MS)-based candidate reference measurement procedure (RMP) was developed and validated to accurately measure serum and plasma concentrations of total and free phenytoin.
Methods
Quantitative nuclear magnetic resonance (qNMR) spectroscopy was used to determine the absolute content of the reference material, ensuring its traceability to SI units. The separation of phenytoin from potential unknown interferences was achieved with reversed-phase chromatography, utilizing a C8 column. A protein precipitation protocol was established for preparation of total phenytoin samples, while free phenytoin samples were prepared by membrane separation utilizing a commercially available ultrafiltration device. Assay validation and determination of measurement uncertainties was performed according to the guidelines of the Clinical and Laboratory Standards Institute, the International Conference on Harmonization, and the Guide to the Expression of Uncertainty in Measurement.
Results
These RMPs demonstrated high selectivity and specificity, with no evidence of matrix effects, allowing quantification of total and free phenytoin in ranges of 0.640–48.0 μg/mL and 0.0800–4.80 μg/mL, respectively. Intermediate precision was <3.8 %, and repeatability was 1.4–3.8 %, over all concentration levels, for both forms of phenytoin. For total phenytoin, relative mean bias ranged from −2.7–0.3 % in native serum and from 0.0–1.1 % in lithium heparin plasma. Relative mean biases for free phenytoin were 3.5–4.1 % for both native serum and ultrafiltrates. Measurement uncertainties for single measurements and target value assignment were 1.8–2.5 % and 0.9–1.7 %, respectively, for total phenytoin. For free phenytoin, these measurement uncertainties were 2.0–3.9 % and 0.9–1.4 % for single measurements and target value assignment, respectively.
Conclusions
We present a novel LC-MS/MS-based RMP for phenytoin in human serum and plasma that provides a traceable and reliable platform for the standardization of routine assays and evaluation of clinically relevant samples.
Introduction
Phenytoin (C15H12N2O2, molecular weight 252.27 g/mol, conversion factor molar unit [µmol/L]=4.0) is an approved drug for the control of tonic-clonic and partial seizures, and for the prevention of seizures occurring during or after neurosurgery and/or severe head injury [1], [2], [3]. A lipophilic hydantoin derivative, phenytoin is highly protein bound, with approximately 90 % of the total drug in the serum bound to albumin [4]. Only the free fraction (“free phenytoin”) can cross the blood-brain barrier and exert pharmacological effects [5], including adverse effects such as central system reactions, i.e., nystagmus, ataxia, slurred speech, impaired coordination, somnolence, and mental confusion [6], 7]. The accepted therapeutic ranges for total and free phenytoin are 10.0–20.0 μg/mL and 1.00–2.00 g/mL, respectively [8], 9]. Significant variations in the protein binding of phenytoin can occur due to low plasma albumin levels, as well as changes in drug–drug interactions [4], [9], [10], [11], [12], [13]. In these situations, assays that measure total phenytoin alone may not reflect the true pharmacological effect of the drug [14], [15], [16], [17]. Hence, measurement of free phenytoin is also necessary [15], 17].
Although immunoassays are the method of choice for therapeutic drug monitoring (TDM), as they are fast, convenient, and inexpensive [18], these are often affected by non-specific interactions with metabolites, pro-drugs, and/or matrix compounds, leading to confusing results [19], [20], [21]. By contrast, spectrometric techniques (e.g., liquid chromatography [LC]-tandem mass spectrometry [MS/MS], gas chromatography-MS, or high-performance LC [HPLC]), which are often available in research and routine settings, are highly specific and sensitive [22], [23], [24], [25], [26], [27].
Equilibrium dialysis is the generally accepted gold standard for addressing free phenytoin [28], [29], [30]. In clinical settings, however, membrane filtration based on ultrafiltration at room temperature (“ultrafiltration”) is commonly used because of its simplicity and high speed compared to the gold standard [28], [31], [32], [33], [34], [35], [36], [37]. Since a candidate reference measurement procedure (RMP) must be capable of measuring routine patient samples (in accordance with International Organization for Standardization (ISO) standard 17511), the approach presented herein utilized a commercially available, commonly applied ultrafiltration device for membrane separation.
An RMP for phenytoin is listed in the Joint Committee for Traceability in Laboratory Medicine (JCTLM) database (JCTLM database identifier C10RMP5) [38]; this was used to assign target values for the National Institute of Standards and Technology (NIST)-published reference material, Antiepilepsy Drugs in Frozen Human Serum, SRM 900a [39]. Unfortunately, this reference material is no longer commercially available and, since the status of the NIST RMP was unclear and we were not aware of any reference laboratories that had implemented it, we decided to establish and validate a new candidate RMP according to the requirements of ISO 15193 [40].
Given that SRM 900a was out of stock, it was necessary to use commercially available phenytoin as a reference material and determine purity ‘in-house’. Quantitative nuclear magnetic resonance (qNMR) spectroscopy is a well-established, non-destructive, primary method of measurement (primary ratio method) for the determination of analyte mass fraction (absolute content; g/g) [41], 42]. qNMR provides an unparalleled ability to determine the amount of a particular analyte, due to the absolutely linear relationship between nuclear magnetic resonance (NMR) signals and analyte amounts, and the availability of higher-order qNMR internal standards (ISTDs) directly traceable to the International System of Units (SI) unit of mass (kilogram) via NIST benzoic acid 350b (coulometric) and/or NIST PS1 (benzoic acid; first primary qNMR standard) [43]. Additionally, as per the latest International Union of Pure and Applied Chemistry (IUPAC) technical report, qNMR is considered a potential primary RMP and ideally suited for the characterization of primary reference materials [44].
Here, we present a novel LC-MS/MS-based candidate RMP for the quantification of total and free phenytoin in human serum and plasma. Based on the requirements of clinical routine, the target RMP uncertainty was set to <3.2 % (k=2) for phenytoin and to <9.1 % (k=2) for free phenytoin. To facilitate reproduction of this candidate RMP by other laboratories, further details of technical implementation and the calculation of measurement uncertainty (MU) are provided in Supplementary Materials 1 and 2.
Materials and methods
A detailed method description, including a full list of materials and equipment used, as well as in-depth instructions for the application of the method, is given within Supplementary Materials 1 and 2.
Chemicals and reagents
LC-MS-grade methanol (CAS No. 67-56-1) was purchased from Biosolve (Valkenswaard, The Netherlands). Dimethyl sulfoxide (DMSO) (CAS No. 67-68-5®, American Chemical Society (ACS) reagent, ≥99.99 %) and acetic acid (CAS No. 64-19-7) were purchased from Sigma Aldrich (Taufkirchen, Germany). Phenytoin (CAS No. 57-41-0, Cat. No. PHR1139, Lot No. LRAB7779) was purchased from Supelco (Bellefonte, PA, USA). The deuterated ISTD [2H10]-phenytoin (CAS No. 65854-97-9, Cat. No. C2090, Lot No. LSG-ALS-13-030-B1) was purchased from Alsachim (Illkirch Graffenstaden, France). HPLC-grade isopropanol (CAS No. 67-63-0) was purchased from Riedel de Haën (Seelze, Germany). Analyte-free human serum (Cat. No. 637816) was obtained from Merck (Darmstadt, Germany); TDM-free serum used as surrogate matrix (ID. No. 12095432001) was obtained from Roche Diagnostics GmbH (Mannheim, Germany); native plasma matrix (lithium heparin [Li-heparin]), dipotassium (K2) ethylene diamine tetraacetic acid (EDTA), and tripotassium (K3) EDTA were obtained from anonymized leftover patient samples (n≥5), and water was purified in-house using a Millipore Milli-Q® 3 UV system from Merck (Darmstadt, Germany).
NMR solvent, pyridine-d5, and the qNMR ISTD methyl-3,5-dinitrobenzoate (Cat. No. 94681, Lot No. BCBW3152) were obtained from Sigma Aldrich (Taufkirchen, Germany). Five-millimeter, 10-inch NMR tubes were purchased from Sigma Aldrich and/or Euroisotop GmbH (Hadfield, United Kingdom).
General requirements for laboratory equipment
Certified and calibrated equipment was used. The minimum sample weight for the microbalance used (XPR2, Mettler Toledo, Columbus, OH, USA) was determined according to United States Pharmacopeial Convention (USP) guidelines (USP Chapters 41 and 1251). Positive displacement pipettes were used to measure organic solvents and serum. Volumetric glassware (Class A volumetric flasks) that fulfilled the criteria of ISO 1042 and USP were used to prepare stock and spike solutions.
qNMR for determination of the purity of the standard materials
qNMR experiments were performed on a Jeol 600 MHz NMR (Jeol Ltd, Tokyo, Japan) equipped with a helium-cryoprobe head. A single-pulse 1H{13C}NMR was utilized for quantitation (aromatic ortho protons δ=7.85 ppm; 4H; methyl-3,5-dinitrobenzoate as SI traceable qNMR ISTD; pyridine-d5 as solvent) with an inter-scan delay of 70 s. Pyridine-d5 was utilized as solvent owing to its aromatic solvent-induced separation effects, which lead to optimal dispersion of the aromatic proton resonance. Any other solvent would prove incapable of this kind of resolution of aromatic protons. We also used two-dimensional total correlation spectroscopy to allocate the undoubtedly assignment of the quantitative resonance. Further details about NMR acquisition and processing parameters are available in the Supplementary Material 3 (Table S1, Figures S1–S3).
Preparation of calibrators and quality control samples
Two calibrator stock solutions were prepared by weighing phenytoin in tin boats on a microbalance. To obtain two 10 mg/mL stock solutions for total phenytoin, 50.0 mg of phenytoin was weighed twice and dissolved in 5 mL DMSO. For free phenytoin, 10 mg of phenytoin was weighed and dissolved in 10 mL DMSO in volumetric flasks to produce a 1.00 mg/mL stock solution. The final concentration of the stock solutions was calculated based on the purity of the material (99.7±0.4 %, determined by qNMR [k=2]) and the amount weighed. Each stock solution was then used to prepare four working solutions. Afterwards, the stock and working solutions were further diluted with DMSO in 5 mL volumetric flasks to produce eight levels of spike solutions for each total and free phenytoin. Finally, calibrator solutions (‘calibrators’) for total phenytoin were prepared by a 1 + 99 dilution (v + v) of the spike solution with analyte-free human serum, and calibrators for free phenytoin were prepared using a 1 + 99 dilution (v + v) of the spike solution with 20 % DMSO (v + v). The resulting calibration ranges for total and free phenytoin were 0.640–48.0 μg/mL and 0.0800–4.80 μg/mL, respectively.
Furthermore, four levels of matrix-based quality control (QC) samples were prepared using additional independent stock solutions for total and free phenytoin. The concentrations of QC sample levels were set at four critical control points: above the limit of quantification; below the therapeutic range; within the therapeutic reference range; and at the laboratory alert level. The resulting QC levels for total and free phenytoin had concentrations of 1.50, 6.00, 15.0, and 25.0 μg/mL, and 0.120, 0.400, 1.60, and 3.60 μg/mL, respectively. To prepare the QC levels, phenytoin was added to analyte-free human serum; to prepare the free phenytoin QC levels, phenytoin was spiked in analyte-free human serum ultrafiltrate. The ultrafiltrate was obtained by ultrafiltration of analyte-free human serum using an Amicon® filter (Cat. No. UFC903024; Merck, Darmstadt, Germany). The filtration process involved centrifugation at 1,000 rcf and 25 °C for 180 min.
Internal standard solution
[2H10]-phenytoin was dissolved in an appropriate amount of DMSO to obtain a 1 mg/mL stock solution, which was stored at −20 °C until further use. ISTD working solutions were freshly prepared on each day of sample preparation by 2-fold dilution of the ISTD stock solution, first with DMSO, then with Milli-Q®-water to produce concentrations of 2.00 and 0.06 μg/mL for total and free phenytoin, respectively.
Sample preparation: total phenytoin assay
In a 2 mL tube (Eppendorf, Hamburg, Germany), 100 μL of ISTD working solution was pipetted, followed by the addition of 50 μL of the sample specimen (native sample/calibrator/QC). To precipitate proteins, 1,000 μL of 75 % methanol in Milli-Q® water (v + v) was added. After centrifugation, 10 μL of the supernatant was diluted in two steps. In step 1, it was diluted at a ratio of 1 + 99 (v + v) using mobile phase A. In step 2, it was further diluted at a ratio of 1 + 7 (v + v) using mobile phase A.
Sample preparation: free phenytoin assay
Five hundred μL of native serum sample was pipetted into an ultrafiltration device (Merck Millipore Centrifree® Ultracel® PL Regenerated Cellulose, Art. No. 21986643122), which was then subjected to centrifugation at 1,000 rcf and 25 °C for a period of 30 min. In a separate 2 mL tube, 100 μL of ISTD working solution was mixed with 50 μL of the filtered sample (calibrator/QC/sample ultrafiltrate) and 1000 μL of 10 % methanol in Milli-Q®-water (v + v) with 0.1 % acetic acid (mobile phase A). Finally, the solution was further diluted with mobile phase A at a ratio of 1 + 99 (v + v).
Liquid chromatography–mass spectrometry
Measurements for total and free phenytoin were performed on an Agilent 1290 Infinity II LC system (Santa Clara, CA, USA) equipped with a binary pump, a vacuum degasser, an autosampler at 7 °C, and a column compartment. Phenytoin was separated using an Agilent Zorbax Eclipse XDB-C8 column (100 × 3 mm, 3.5 µm, Santa Clara, CA, USA), which was kept at 40 °C in the column oven compartment. The eluents consisted of 10 % methanol in Milli-Q®-water (v+) + 0.1 % acetic acid (mobile phase A) and 95 % methanol in Milli-Q®-water (v + v) (mobile phase B). Measurements were performed with a flow rate of 0.6 mL/min, using a gradient over 10 min. A portion of the sample solution (5 μL) was injected, and a diverter valve used to reduce contamination of the MS, switching the eluent flow into waste from 0.0 to 0.5 min and from 6.0 to 10.0 min.
Phenytoin was detected in multiple-reaction monitoring mode using an AB Sciex Triple Quad 6500+ or Q-Trap 6500+ mass spectrometer operating in negative electrospray ionization mode. An ion spray voltage of −3,500 V and a temperature of 600 °C resulted in the most abundant signals. Nitrogen gas was used as curtain gas, collision gas, ion gas source 1, and ion gas source 2, set at 35 psi, 10 psi, 60 psi, and 50 psi, respectively. A collision cell entrance potential of −10 V, a collision exit potential of −7 V, a declustering potential of −60 V, and a dwell time of 50 ms was applied for all mass transitions.
The quantifier transition (phenytoin m/z 251.0 to 102.0) served as the basis of the quantitative method and was associated with a correspondent transition of the ISTD [2H10]-phenytoin (m/z 261.0 to 106.0). The additional qualifier transition (phenytoin m/z 251.0 to 208.1 and [2H10]-phenytoin m/z 261.0 to 218.1) allowed to check for possible interferences in the clinical samples. The quantifier/qualifier ratios of neat system suitability test (SST) samples were compared to the quantifier/qualifier ratio of a clinical sample. If they did not deviate by more than ±20 %, interferences were excluded.
System suitability test
An SST was performed prior to each analysis to check the sensitivity of the system, chromatographic performance, and possible carry-over effects. Therefore, a phenytoin stock solution (1 mg/mL in DMSO) was freshly diluted with mobile phase A to produce two samples (1 and 2), with phenytoin concentrations corresponding to the processed calibrator levels 1 and 8. The analytical data from experiments were only used if the SST was passed. Pass criteria for the SST were signal intensity, retention time and carry over. The SST signal-to-noise ratio for the quantifier transition of Sample 1 had to be ≥30. The retention times of SST samples 1 and 2 had to be within 4.0 min±0.5 min. Carry-over effects were examined by injecting SST sample 2 followed by two blank injections. The analyte peak area in the following blank injection had to be ≤20 % of the analyte peak area of SST Sample 1. This carry-over criterion also applied to all further blanks in the measurement campaign.
Calibration and structure of analytical series and data processing
Data processing was performed using AB Sciex Analyst software (version 1.6.3 or higher) with the IntelliQuant algorithm. Phenytoin and [2H10]-phenytoin peaks were integrated within a retention time window of 4.0 min±0.5 min using a smoothing factor of 3, a noise percent of 90 %, and a base sub-window of 0.50 min. Eight-point calibration was used to measure the calibrator levels in increasing concentration at the beginning and end of the analytical series. Both calibrator injections were used to generate the final calibration function. The calibration function was obtained by linear regression of the area ratios of the analyte and ISTD (y) against the analyte concentration (x), resulting in the function: y=x × A + b.
Method validation
Assay validation and determination of MU were performed based on existing validation guidelines, such as the Clinical & Laboratory Standards Institute’s C62A Liquid Chromatography-Mass Spectrometry Methods [45], the International Council of Harmonization’s guidance document, Harmonised Tripartite Guideline Validation of Analytical Procedures: Text and Methodology Q2 (R1) [46], and the Guide to the expression of uncertainty in measurement (GUM) [47].
Selectivity/specificity
Selectivity was determined by spiking phenytoin and [2H10]-phenytoin into analyte-free human serum, TDM-free serum, and native Li-heparin plasma at a concentration of 4.00 μg/mL (total phenytoin) and 0.600 μg/mL (free phenytoin). To examine possible interfering matrix signals for the analyte quantifier and qualifier transitions, analyte-free matrices were checked at the expected retention time. In addition, analyte-free matrices were spiked with ISTD to evaluate whether any residual unlabeled analyte remained in the ISTD. The amount of unlabeled analyte in the ISTD was not supposed to exceed 20 % of the lower limit of the measuring interval (LLMI), which corresponded to the lowest calibrator level.
Matrix effects
To assess matrix effects (ME), a qualitative post-column infusion experiment was performed by infusing a solution of 25 ng/mL phenytoin in mobile phase A/mobile phase B 1 + 1 (v + v), at a flow rate of 7 μL/min, via a T-piece into the HPLC column effluent. Thereafter, processed matrix samples (analyte-free human serum, TDM-free serum, and native plasma matrices [Li-heparin, K2-EDTA. and K3-EDTA]) were injected. Any decrease or increase of the MS output at the expected retention time would indicate a matrix component-mediated effect on the ionization.
Furthermore, calibration curves were compared in terms of slopes and coefficients of determination R² to exclude MEs. For total phenytoin, calibration curves were freshly prepared in mobile phase A as phenytoin is not well soluble in water, analyte-free human serum, TDM-free serum, or native Li-heparin plasma. For free phenytoin, calibration curves were compared in 20 % DMSO in Milli-Q® water (v + v), analyte-free human serum ultrafiltrate, TDM-free serum ultrafiltrate, and native Li-heparin plasma ultrafiltrate [48].
To exclude MEs, mean slopes of calibrator sample sets (n=2 preparations of each set) in different matrices were required to be comparable and 95 % confidence intervals (CIs) should overlap. Furthermore, the coefficient of determination for the individual tested slopes needed to exceed 0.999. In addition to these slope experiments, matrix-based calibrator samples were measured against calibrator sets prepared in mobile phase A and in 20 % DMSO solution. Recoveries were reported as the percentage of recovery of the measured concentration relative to the nominal concentration.
A comparison of absolute peak areas for analyte and ISTD was performed by spiking analyte and ISTD solution in the four above-mentioned matrices after protein precipitation/ultrafiltration for three levels spread over the working range (6.00, 20.0, 40.0 μg/mL, and 0.400, 1.60, and 3.60 μg/mL for total and free phenytoin, respectively) [49]. Ion enhancement and suppression were evaluated by comparing peak areas of analyte, ISTD, and area ratios of matrix samples against neat samples. Samples were prepared in five replicates. Percentage deviation was required to be within the range of 100±10 % and balanced by the ISTD.
Linearity
In addition to the calibrator samples, four spiked samples were prepared to expand the calibration ranges by ±20 %, with final concentration ranges from 0.500–60.0 μg/mL and 0.0640–6.00 μg/mL for total and free phenytoin, respectively. Coefficients of determination and residuals were determined and required to be R²≥0.999 and randomly distributed.
Furthermore, the linearity of the method was proven based on the recovery of nine serially diluted samples. To produce these samples, calibrator level 1 was mixed with level 8 with the following shares: 9 + 1 (v + v), 8 + 2 (v + v), 7 + 3 (v + v), 6 + 4 (v + v), 5 + 5 (v + v), 4 + 6 (v + v), 3 + 7 (v + v), 2 + 8 (v + v), and 1 + 9 (v + v). These sample pools were required to show linear dependency, with a coefficient of determination of ≥0.999. Recoveries were reported as the percentage of recovery for each measured concentration relative to the nominal concentration of the sample pools.
Lower limit of measuring interval and limit of detection
To demonstrate accuracy, trueness, and precision at the LLMI, spiked, analyte-free human serum samples and samples spiked in 20 % DMSO were prepared with a concentration corresponding to the lowest calibrator levels for total phenytoin (0.640 μg/mL) and free phenytoin (0.0800 μg/mL), respectively. These samples were prepared 5-fold to ensure reliable results.
In addition, the limit of detection (LOD) was estimated using the approach described by Armbruster et al. [50]. To do this the limit of blank (LOB) was calculated using 10 independent matrix blank samples as follows: LOB=meanblank + 1.645(SDblank). The LOD was then estimated using 10 replicates of calibrator level 1, used as the low concentration sample: LOD=LOB + 1.645(SDlow concentration sample).
Accuracy, trueness, and precision
A 5-day validation experiment, previously described in Taibon et al. [51], was performed to evaluate the precision and accuracy of the developed methods. Total method variability was estimated using an analysis of variance (ANOVA)-based variance component analysis, including variability components, such as between-injection variability, between-preparation variability, between-calibration variability, and between-day variability.
On each day, four spiked analyte-free human serum samples, covering the measuring range (1.50, 10.0, 20.0, and 40.0 μg/mL for total phenytoin and 1.20, 4.00, 16.0, and 24.0 μg/mL for free phenytoin), assuming a free analyte fraction of approximately 10 % in the matrix, were prepared, as well as two native patient serum samples, at concentrations close to the medical decision point. Additionally, Li-heparin plasma samples were spiked with the same concentration ranges for total phenytoin.
For both individual measurement parts (A and B), all samples were prepared in triplicate and injected twice, resulting in a total of 12 measurements per day and 60 measurements over the course of 5 days. This validation scheme was carried out in parallel by two operators, with one person responsible for part A and another responsible for part B. For each part, independent calibration curves were generated and used for quantitative analysis. Data were evaluated using Biowarp, an internal statistic program based on the VCA Roche Open-Source software package in R [52].
Trueness and accuracy for total phenytoin were assessed using four spiked analyte-free human serum and native Li-heparin plasma samples with concentrations of 1.50, 10.0, 20.0, and 40.0 μg/mL. Dilution integrity was assessed using two spiked analyte-free human serum samples at concentration levels of 60.0 μg/mL and 100 μg/mL.
For free phenytoin, four concentration levels in analyte-free human serum, analyte-free human serum ultrafiltrate, and Li-heparin plasma ultrafiltrate were prepared. To create these, spiked, analyte-free human serum samples were prepared at four concentration levels (1.20, 4.00, 16.0, and 24.0 μg/mL), assuming a free analyte fraction of approximately 10 % in the matrix. The nominal concentration was determined (n=3 preparations and two injections) by independent measurement of the free and bound fractions of phenytoin. In addition, analyte-free human serum and Li-heparin ultrafiltrate samples were prepared at the following concentrations: 0.168, 0.560, 2.24, and 3.36 μg/mL. To show dilution integrity, a concentrated, spiked, analyte-free human serum sample (56.0 μg/mL) was filtered and then diluted with analyte-free human serum ultrafiltrate. The dilution was required to show a linear dependency (coefficient of determination of 0.998).
All samples were prepared in triplicate for each of part A and part B (n=6 measurements) on one day. Accuracy was determined as the percentage recovery of the measured concentration relative to the spiked concentration, while trueness was reported as the percentage recovery of the mean measured concentration relative to the spiked concentration.
Sample stability
The stability of the processed samples in the autosampler was evaluated at 7 °C after 7 days. Recoveries were calculated by comparing the measured value with freshly prepared samples.
Stability of calibrator and control material stored at −20 °C was evaluated for a period of four weeks for the total phenytoin assay (analyte-free, human serum calibrators ranged from 0.640–48.0 μg/mL, and analyte-free, human serum QC levels from 1.50–25.0 μg/mL). Stability at −20 °C for calibrator and QC material for the free phenytoin assay was tested over a period of 65 days (calibrators in 20 % DMSO ranged from 0.0800–4.80 μg/mL, and QC levels prepared in analyte-free, human serum ultrafiltrate ranged from 0.120–3.60 μg/mL).
Recoveries were calculated by comparing the measured values for stored samples with those from with freshly prepared samples. The total error (TE) was used as the acceptance criterion, set to ±5 %. Stability was guaranteed for x–1 day for a measurement interval of 2–28 days (x) and for y–1 week for a measurement interval of >4 weeks (y).
Equivalence of results between independent laboratories
A method comparison study was undertaken to assess agreement of the candidate RMP between two independent laboratories (laboratory 1 Dr. Risch, Buchs SG, and laboratory 2 Roche Diagnostic GmbH, Penzberg). For total phenytoin this study included 146 samples (65 native serum patient samples, 41 native plasma samples, 10 patient pool samples, and 30 spiked samples) for total phenytoin. For free phenytoin, a total of 85 samples were measured, of which 55 (28 native serum patient samples, 17 native plasma samples, and 10 patient pool samples) were the same as for total phenytoin, and 30 were additional spiked serum samples. All patient samples were collected in accordance with the Declaration of Helsinki.
Additionally, a 3-day precision experiment was performed at laboratory 2 using the same spiked, analyte-free, human serum samples as in laboratory 1. The LC-MS system and laboratory equipment used were similar in both laboratories. For gravimetrical procedures, Site 2 utilized an ultra-microbalance XP6U/M (Mettler Toledo) and aluminum weighing boats. Calibrators were prepared independently in both laboratories as described in Supplementary Materials 1 and 2.
Uncertainty of measurements
MU was determined according to the GUM [47] and the approach adopted by Taibon et al. [51] where the following parameters were considered: purity of the reference material (based on the certificate); weighing of the analyte; preparation of stock, working, spike and calibrator solutions; preparation of the ISTD solution; sample preparation of the calibrators; measurement of the calibrators; generation of the calibration curve; preparation and measurement of unknown samples; and evaluation of the sample results. To assess MU in calibrator preparation, a type B evaluation was performed, while all other aspects were evaluated as type A. Total MU was then estimated by combining type A and B uncertainties. Further information on the estimation of type B uncertainty is provided in Supplementary Material 4.
To meet RMP requirements, the target uncertainty for phenytoin was set at <3.2 % (k=2). For free phenytoin, an RMP target uncertainty of <9.1 % (k=2) was determined.
Results
Traceability to SI units
Traceability to the SI unit of mass (kilogram), the most important parameter for a reference measurement method, was established by the utilization of methyl-3,5-dinitrobenzoate as the qNMR ISTD, which is directly traceable to NIST PS1 (primary qNMR standard). Furthermore, traceability to the SI unit of amount of substance (mole) was also established via NIST PS1. Since Planck’s constant is currently considered the main parameter for defining a kilogram, as is Avogadro’s constant for a mole, qNMR methodology is well suited to fulfill both traceability chains. Additionally, as per the latest IUPAC Technical Report, qNMR represents a potential primary RMP, ideally suited to the characterization of primary reference materials [46]. Six individual experiments (detailed in Figure S2 and Table S1 in Supplementary Material 3), involving six individual weighings, yielded a final absolute content value of 99.7±0.4 % (k=2).
Selectivity/specificity
The developed gradient, combined with a reversed phase column (Agilent Zorbax Eclipse XDB-C8), allowed the selective and specific measurement of phenytoin (see Figures 1A–C and 2A–C). Specificity was determined by analyzing analyte-free human serum, TDM-free serum, and native Li-heparin plasma. No signals were observed at the expected retention time (4.0 min). Moreover, no residual analyte was found in the ISTD-spiked matrix samples. Furthermore, samples measured within the method comparison study showed no interferences in the retention time window for phenytoin.
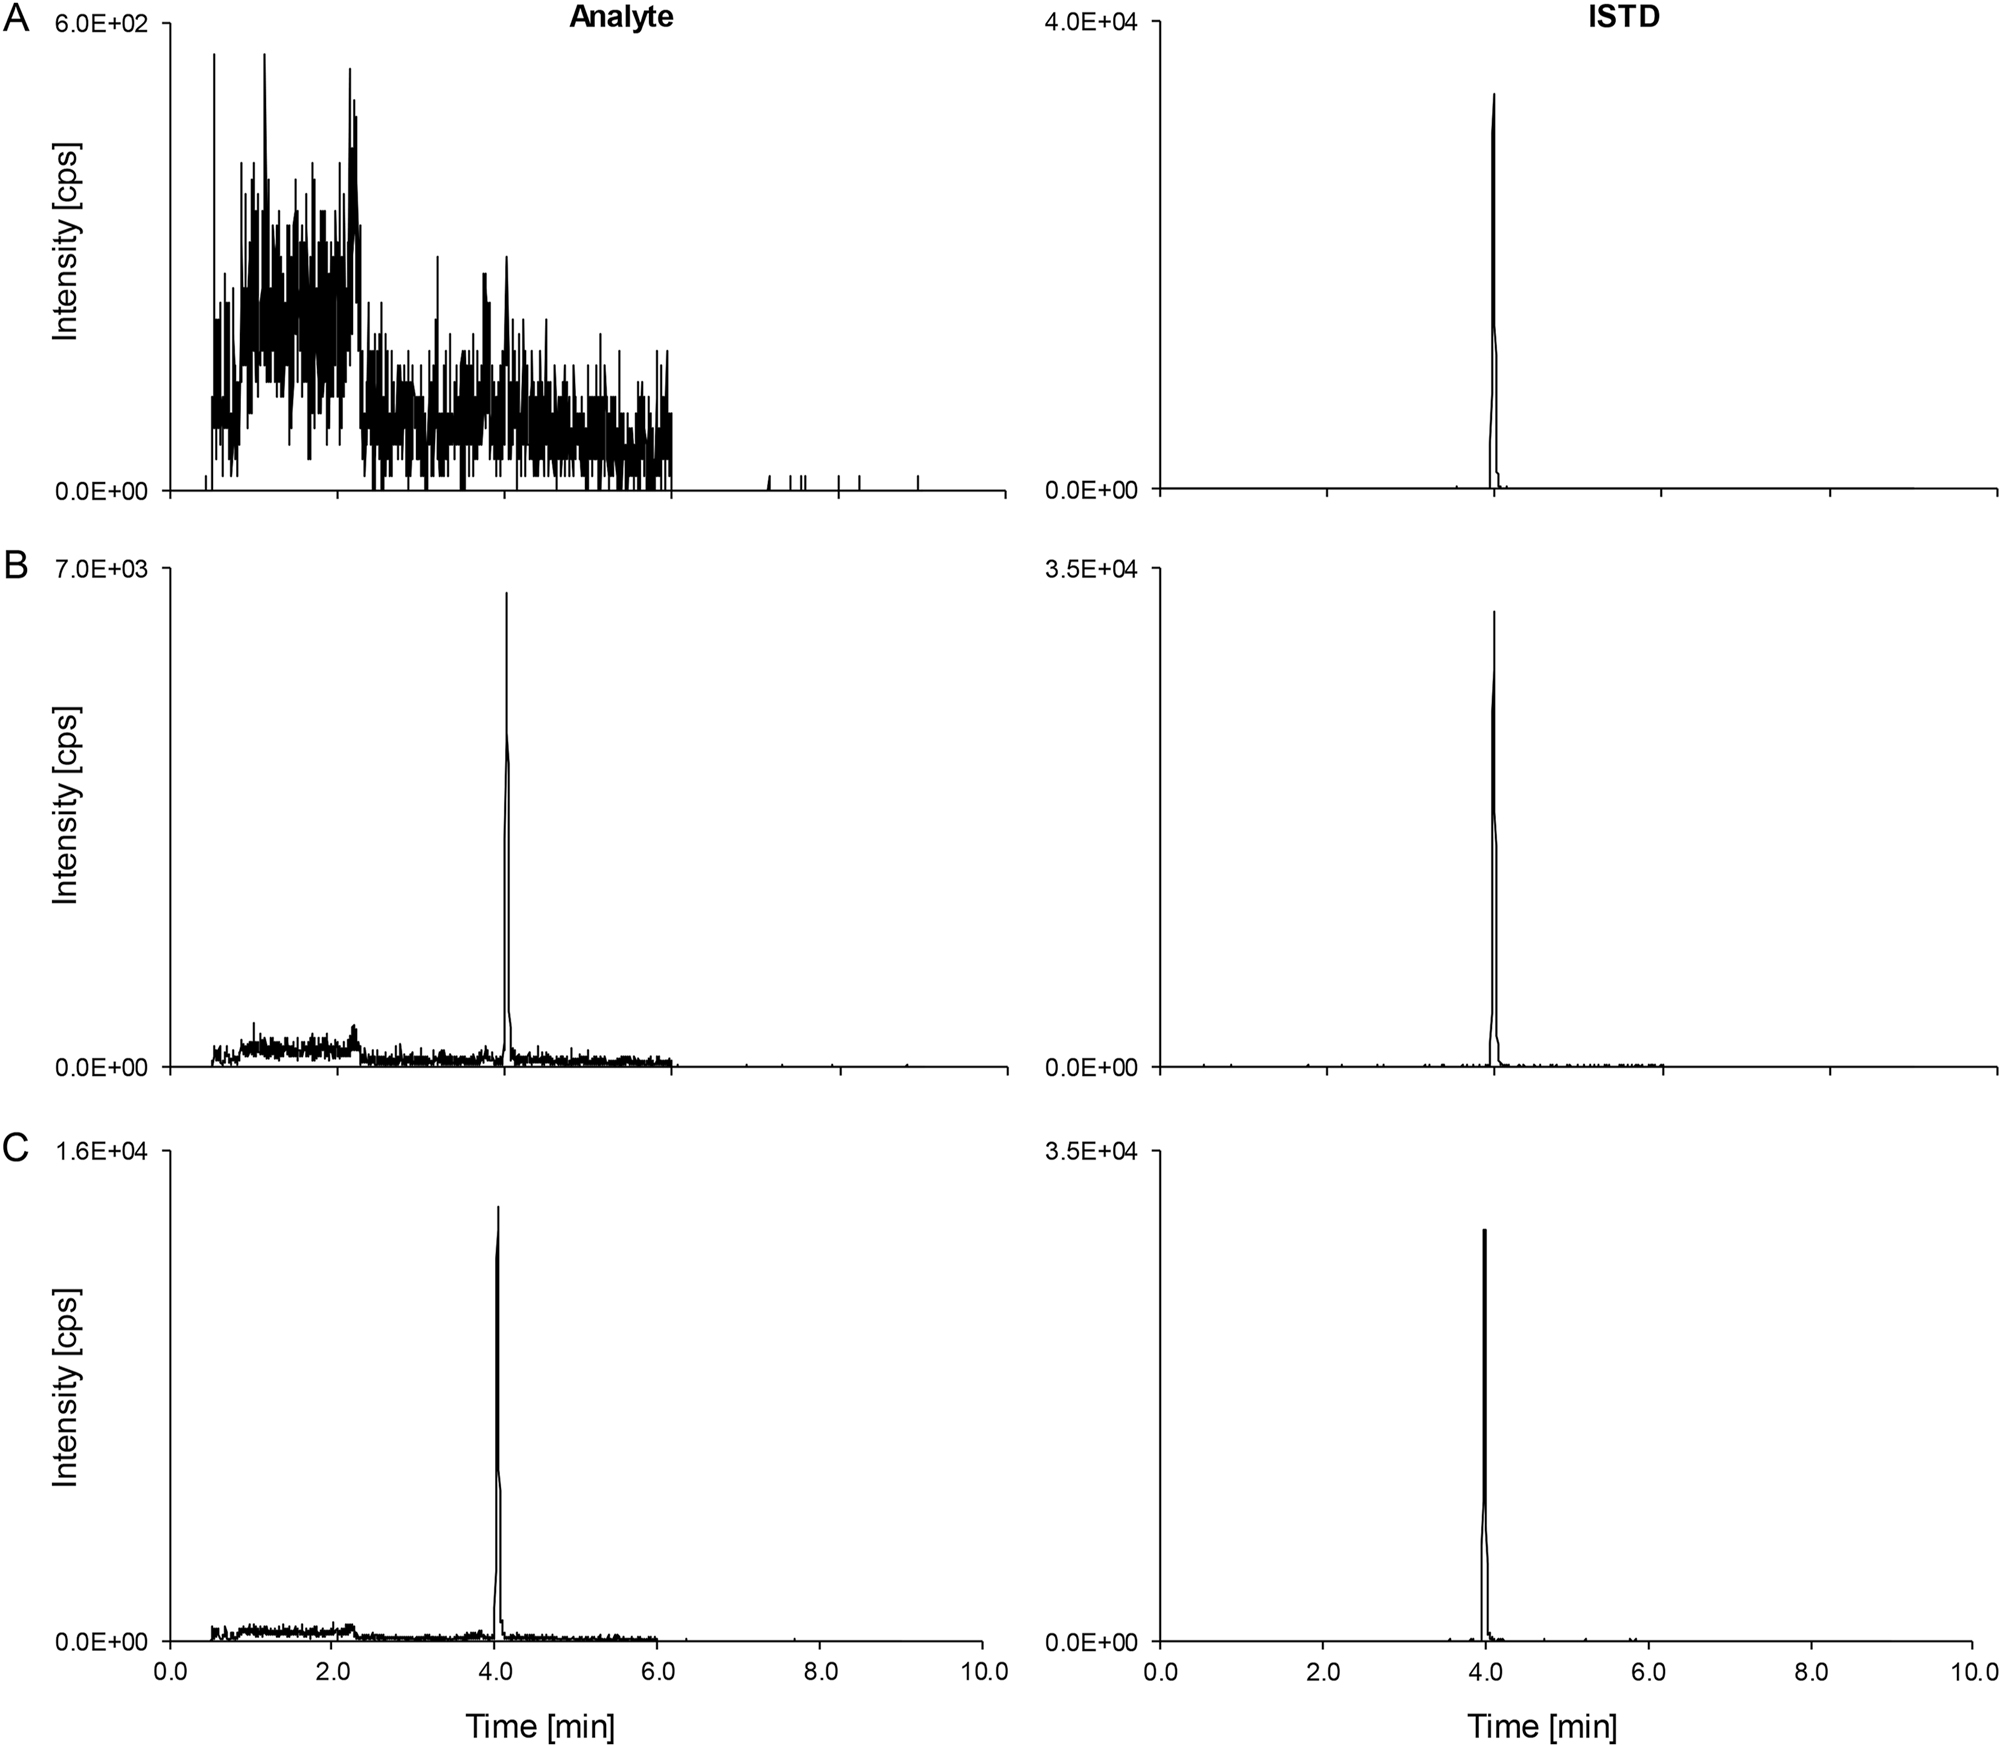
Total phenytoin LC-MS/MS derived analytical readouts. Analyte on the left-hand side, ISTD on the right-hand side. (A) Chromatogram of a matrix blank. (B) The lowest calibrator level peak (0.640 μg/mL) spiked in analyte-free human serum. (C) Patient pool (n≥5, 1.44 μg/mL). ISTD, internal standard; LC-MS/MS, liquid chromatography-tandem mass spectrometry.
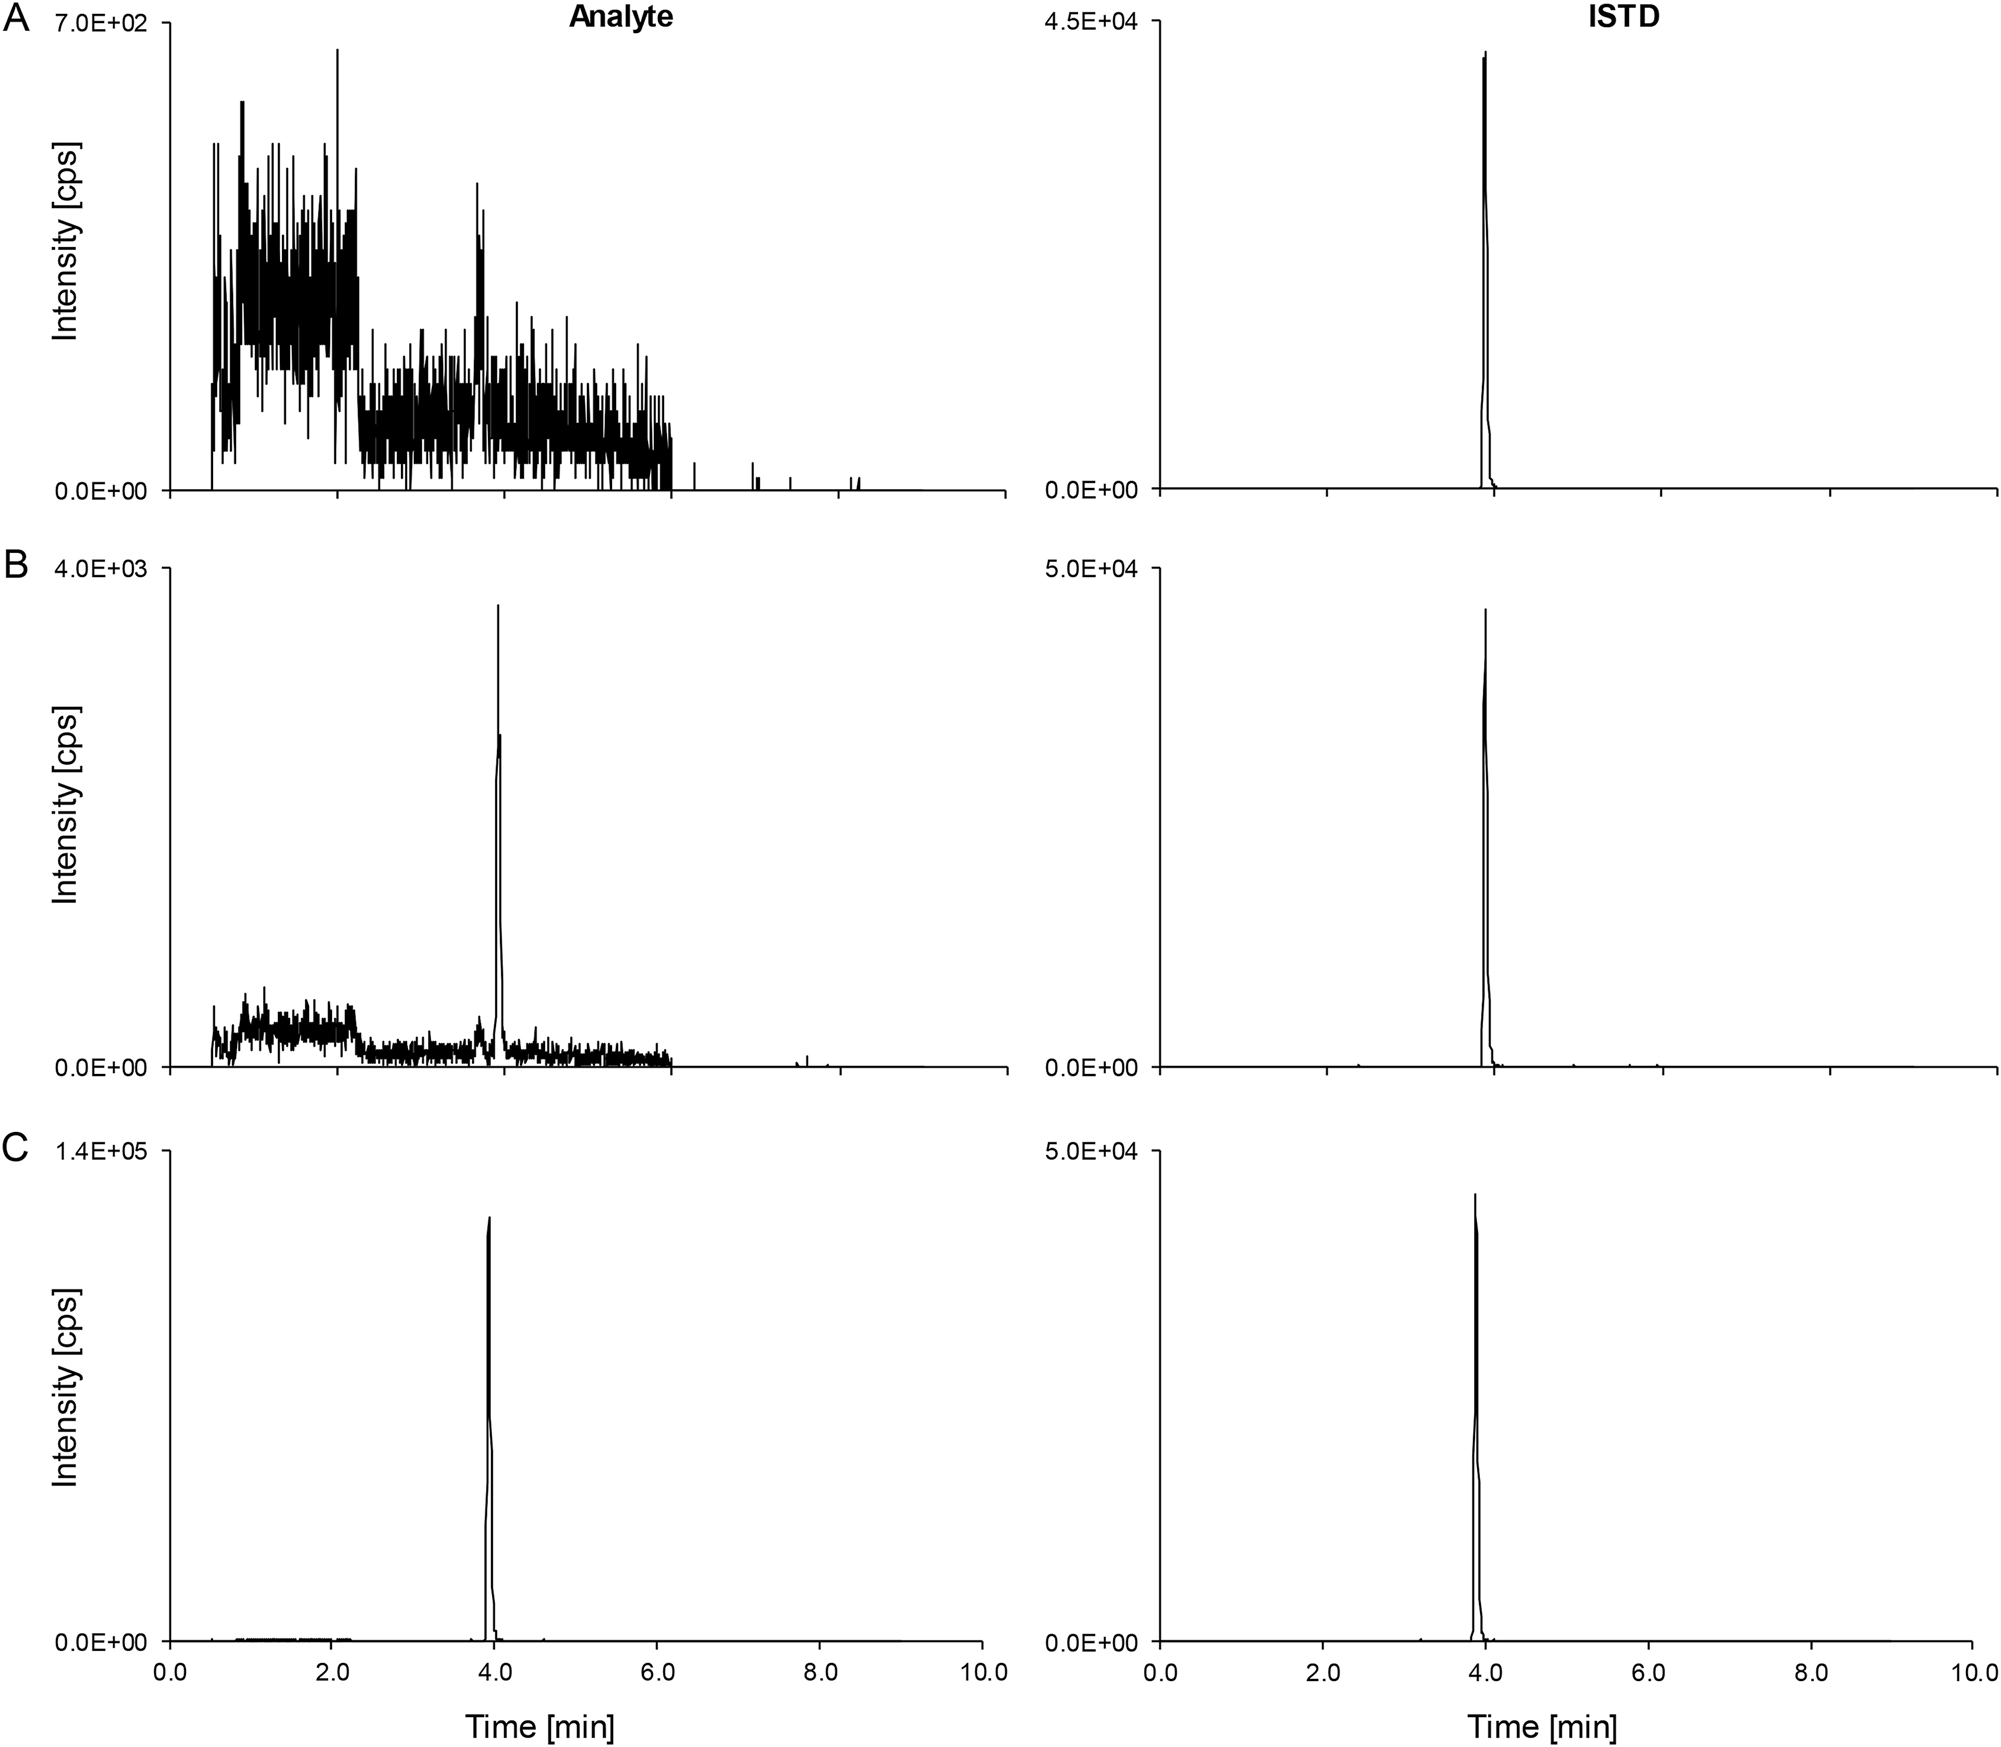
Free phenytoin LC-MS/MS derived analytical readouts. Analyte on the left-hand side, ISTD on the right-hand side. (A) Chromatogram of a matrix blank. (B) The lowest calibrator level peak (0.0800 μg/mL) spiked in 20 % DMSO (v+v). (C) Patient pool (n≥5, 2.82 μg/mL). ISTD, internal standard; LC-MS/MS, liquid chromatography-tandem mass spectrometry.
Matrix effects
Matrix-dependent effects were eliminated by the use of a sample preparation protocol involving a substantial dilution after protein precipitation. This was shown by the post-column infusion experiment, where no change in the ionization field was observed at the expected retention times in analyte-free human serum, TDM-free serum and plasma matrices (K2-EDTA plasma, K3-EDTA plasma, and Li-heparin plasma).
Experiments were performed to compare slopes in different concentration ranges for total and free phenytoin. Mobile phase A was selected as a matrix-free comparator matrix for the concentration range of total phenytoin. For the concentration range of free phenytoin, a solution of 20 % DMSO in water was used, which was also the matrix used to produce calibrators for the assay.
The mean slopes for total phenytoin were found to be 0.31 (95 % CI: 0.30–0.31) in analyte-free human serum, 0.30 (95 % CI: 0.30–0.31) in TDM-free serum, 0.30 (95 % CI: 0.30–0.31) in native plasma, and 0.30 (95 % CI: 0.29–0.30) in mobile phase A. All experiments showed least square regression coefficients of determination of ≥0.999. Using the mobile phase calibrator set as a standard and all other samples as independent controls (n=48), the mean recovery was found to be 102 % with a standard deviation of 2.7 % and 95 % CI: 101–103 %.
The mean slopes for free phenytoin were found to be 0.93 (95 % CI: 0.91–0.95) in analyte-free human serum ultrafiltrate, 0.92 (95 % CI: 0.92–0.93) in TDM-free serum ultrafiltrate, 0.93 (95 % CI: 0.93–0.93) in native Li-heparin plasma, and 0.94 (95 % CI: 0.93–0.96) in 20 % DMSO. All experiments showed least square regression coefficients of determination of ≥0.999. Using the 20 % DMSO phase calibrator set as a standard and all other samples as independent controls (n=48), the mean recovery was found to be 99 % with a standard deviation of 2.7 % and a 95 % CI: 98–100 %.
Furthermore, analyte and ISTD peak areas and area ratios from spiked matrix samples were compared to spiked neat samples. Analyte peak areas for total phenytoin ranged from 98–103 %, ISTD peak areas from 96–104 %, and area ratios from 99–102 % (Table 1). Analyte peak areas for free phenytoin ranged from 99–105 %, ISTD peak areas from 98–105 %, and area ratios from 99–102 % (Table 2).
Matrix effect data for three different matrices, compared to neat analyte solutions, for total phenytoin.
| Total phenytoin level, concentration | Analyte | ISTD | Area ratio | ||||
|---|---|---|---|---|---|---|---|
| Mean, % | 95 % CI, % | Mean, % | 95 % CI, % | Mean, % | 95 % CI, % | ||
| Level 1 | Analyte-free human serum | 98 | 96–100 | 96 | 94–98 | 102 | 101–103 |
| 6.00 μg/mL | TDM-free serum | 100 | 99–102 | 100 | 96–103 | 101 | 99–103 |
| Li-heparin plasma | 102 | 100–104 | 101 | 99–102 | 101 | 98–104 | |
| Level 2 | Analyte-free human serum | 101 | 99–103 | 99 | 96–101 | 102 | 99–106 |
| 20.0 μg/mL | TDM-free serum | 102 | 100–104 | 102 | 100–104 | 100 | 99–101 |
| Li-heparin plasma | 102 | 101–104 | 101 | 99–103 | 101 | 98–104 | |
| Level 3 | Analyte-free human serum | 99 | 97–102 | 98 | 97–99 | 101 | 99–103 |
| 40.0 μg/mL | TDM-free serum | 101 | 99–103 | 102 | 101–103 | 99 | 97–100 |
| Li-heparin plasma | 103 | 102–105 | 104 | 102–106 | 99 | 97–102 | |
-
Analyte peak areas, ISTD peak areas, and analyte/ISDT area ratios, used for analyte quantification, were investigated. Means (from 5-fold analysis) were utilized as data input. The relative ME (%) was calculated as ME (%)=set 2/set 1×100, whereby set 2 corresponded to the respective matrix samples and set 1 to the neat samples. No ME was present, if ME (%)=100. CI, confidence interval; ISTD, internal standard; ME, matrix effect; TDM, therapeutic drug monitoring.
Matrix effect data of three different matrices compared to neat analyte solutions for free phenytoin.
| Free phenytoin level, concentration | Analyte | ISTD | Area ratio | ||||
|---|---|---|---|---|---|---|---|
| Mean, % | 95 % CI, % | Mean, % | 95 % CI, % | Mean, % | 95 % CI, % | ||
| Level 1 | Analyte-free human serum | 105 | 102–108 | 105 | 102–107 | 100 | 99–101 |
| 0.400 μg/mL | TDM-free serum | 104 | 100–107 | 104 | 103–105 | 100 | 97–103 |
| Li-heparin plasma | 105 | 102–109 | 104 | 101–106 | 101 | 100–103 | |
| Level 2 | Analyte-free human serum | 103 | 99–108 | 102 | 100–104 | 101 | 97–106 |
| 1.60 μg/mL | TDM-free serum | 99 | 93–106 | 98 | 93–104 | 101 | 98–104 |
| Li-heparin plasma | 105 | 100–109 | 102 | 100–105 | 102 | 99–106 | |
| Level 3 | Analyte-free human serum | 99 | 97–100 | 100 | 98–102 | 99 | 98–100 |
| 4.00 μg/mL | TDM-free serum | 99 | 97–100 | 99 | 97–101 | 99 | 97–101 |
| Li-heparin plasma | 100 | 99–101 | 101 | 99–103 | 99 | 97–100 | |
-
Analyte peak areas, ISTD peak areas, and analyte/ISDT area ratios used for analyte quantification were investigated. Means (from 5-fold analysis) were used as data input. The relative ME (%) was calculated as ME (%)=set 2/set 1×100, whereby set 2 corresponded to the respective matrix samples and set 1 to the neat samples. No ME was present, if ME (%)=100. CI, confidence interval; ISTD, internal standard; ME, matrix effect; TDM, therapeutic drug monitoring.
Linearity
Linearity of the method was proven by analyzing calibration curves covering ±20 % of the measuring range (n=6, sample preparations). Residuals were randomly distributed in a linear regression model for total and free phenytoin. Coefficients of determination were ≥0.999 for all individual calibrations for total and free phenytoin. Applying the preferred linear regression model, samples 1–11 were evaluated and showed a linear dependence with a coefficient of determination of 0.999 for total and free phenytoin. The relative deviation ranged from −1.0 to 3.3 % and −1.6 to 2.5 %, and the coefficient of variation (CV) was determined to be ≤3.9 and ≤2.4 % for total and free phenytoin, respectively.
Lower limit of measuring interval and limit of detection
The LLMI was determined using spiked samples at the lowest calibrator levels (0.640 and 0.0800 μg/mL) for total and free phenytoin. Relative bias showed deviations of −1.3 and 2.7 %, and CVs of 2.7 and 0.3 %, for total and free phenytoin, respectively. LODs were estimated to be 0.217 and 0.0237 μg/mL for total and free phenytoin, respectively.
Accuracy, trueness, and precision
The total method variability was estimated using an ANOVA-based variance component analysis (VCA). Repeatability CVs, including variability components, such as between-injection variability and between-preparation variability, ranged from 1.7–3.8 % for total phenytoin over all concentration levels, and were independent of the matrix (Table 3). Comparable repeatability was shown for free phenytoin with values ranging from 1.4–3.7 % (Table 4). Intermediate-precision CVs, including additional variability components, such as between-calibration variability and between-day variability, were found to be <3.8 and <3.7 % for total and free phenytoin, respectively (Tables 3 and 4).
Precision performance parameters for total phenytoin quantification using the candidate RMP (n=60 measurements).
| Variance source | Serum samples CV, % | |||||
|---|---|---|---|---|---|---|
| 1.50 μg/mL | 10.0 μg/mL | 20.0 μg/mL | 40.0 μg/mL | Patient Sample 1 1.44 μg/mL |
Patient Sample 2 15.3 μg/mL |
|
| Intermediate precision | 2.4 | 1.7 | 2.0 | 2.0 | 2.1 | 1.6 |
| Between-day | 0.0 | 0.0 | 0.9 | 1.0 | 0.5 | 0.6 |
| Between-calibration | 1.3 | 0.7 | 0.0 | 0.0 | 0.0 | 0.3 |
| Repeatability | 2.0 | 1.5 | 1.8 | 1.7 | 2.1 | 1.4 |
| Between-preparation | 0.5 | 0.0 | 0.8 | 0.4 | 0.1 | 0.0 |
| Between-injection | 2.0 | 1.5 | 1.7 | 1.7 | 2.1 | 1.4 |
|
|
||||||
| Variance source | Plasma samples CV, % | |||||
|
|
||||||
| 1.50 μg/mL | 10.0 μg/mL | 20.0 μg/mL | 40.0 μg/mL | |||
|
|
||||||
| Intermediate precision | 3.8 | 1.8 | 1.9 | 2.1 | ||
| Between-day | 0.0 | 0.5 | 0.0 | 1.6 | ||
| Between-calibration | 0.0 | 0.5 | 1.3 | 0.0 | ||
| Repeatability | 3.8 | 1.7 | 1.4 | 1.4 | ||
| Between-preparation | 3.3 | 0.0 | 0.0 | 0.5 | ||
| Between-injection | 1.8 | 1.7 | 1.4 | 1.3 | ||
-
Conversion factor µg/mL to µmol/L: 4.0. The coefficients of variation for repeatability and intermediate precision, which were determined from the individual variances, are printed in bold. CV, coefficient of variation; RMP, reference measurement procedure.
Precision performance parameters for free phenytoin quantification using the candidate RMP (n=60 measurements).
| Variance source | Serum samples CV, % | |||||
|---|---|---|---|---|---|---|
| 0.162 μg/mL | 0.542 μg/mL | 2.31 μg/mL | 3.59 μg/mL | Patient Sample 1 0.493 μg/mL |
Patient Sample 2 2.82 μg/mL |
|
| Intermediate precision | 2.4 | 2.1 | 1.9 | 1.9 | 3.8 | 2.2 |
| Between-day | 0.0 | 0.0 | 0.0 | 0.0 | 0.9 | 0.0 |
| Between-calibration | 0.7 | 1.3 | 0.8 | 1.3 | 0.0 | 1.3 |
| Repeatability | 2.3 | 1.7 | 1.7 | 1.4 | 3.7 | 1.8 |
| Between-preparation | 1.1 | 0.0 | 1.1 | 0.0 | 3.2 | 1.0 |
| Between-injection | 2.0 | 1.7 | 1.4 | 1.4 | 1.9 | 1.5 |
-
Conversion factor µg/mL to µmol/L: 4.0. The coefficients of variation for repeatability and intermediate precision, which were determined from the individual variances, are printed in bold. CV, coefficient of variation; RMP, reference measurement procedure.
Accuracy for total phenytoin was assessed using four spiked analyte-free human serum and Li-heparin plasma samples, including three preparations of each operator (in total, n=6 preparations). The relative mean bias for total phenytoin ranged from −2.7–0.3 % for analyte-free human serum samples and 0.0–1.1 % for Li-heparin plasma samples (Table 5); high concentration samples showed a mean bias of −0.6 and 0.3 % for total phenytoin (Table 5).
Bias and 95 % CI for total phenytoin spiked into analyte-free human serum and Li-heparin plasma samples (n=6).
| Phenytoin level (concentration) | Serum | Plasma | ||
|---|---|---|---|---|
| Mean bias, % | 95 % CI, % | Mean bias, % | 95 % CI, % | |
| Level 1 (1.50 μg/mL) | −2.7 | −5.0 to −0.4 | 0.3 | −2.0 to 2.6 |
| Level 2 (10.0 μg/mL) | −0.5 | −1.5 to 0.6 | 0.3 | −0.6 to 1.2 |
| Level 3 (20.0 μg/mL) | −1.3 | −2.3 to −0.4 | 1.1 | −0.7 to 2.9 |
| Level 4 (40.0 μg/mL) | −0.7 | −2.0 to 0.7 | 0.0 | −1.2 to 1.2 |
| Dilution 1 (60.0 μg/mL) | −0.6 | −2.1 to 0.9 | – | – |
| Dilution 2 (100 μg/mL) | 0.3 | −1.1 to 1.7 | – | – |
-
The mean bias and corresponding CIs were calculated using the individual sample biases of n=6 preparations. Conversion factor µg/mL to µmol/L: 4.0. CI, confidence interval.
To determine the amount of free phenytoin in serum samples, free and bound fractions were determined. The following concentrations of serum sample were used to determine the trueness of the free phenytoin assay: 0.162±0.005, 0.542±0.002, 2.31±0.02, and 3.59±0.05 μg/mL. Biases for free phenytoin ranged from −3.5 to −2.7 % for spiked analyte-free human serum samples, from 2.5–4.1 % for spiked analyte-free human serum ultrafiltrate samples, and from 2.8–4.0 % for spiked Li-heparin plasma ultrafiltrate samples (Tables 6 and 7). For free phenytoin, the highest concentration sample showed a linear dependence (r2=0.998) after serial dilution, and a CV of less than 2.3 %.
Bias and 95 % CI for the free fraction of phenytoin spiked into analyte-free human serum samples (n=6).
| Phenytoin level (concentration) | Serum | |
|---|---|---|
| Mean bias, % | 95 % CI, % | |
| Level 1 (0.162 μg/mL) | −2.9 | −5.3 to −0.5 |
| Level 2 (0.542 μg/mL) | −2.7 | −4.0 to −1.4 |
| Level 3 (2 0.31 μg/mL) | −3.5 | −4.1 to −2.8 |
| Level 4 (3.59 μg/mL) | −3.4 | −4.5 to −2.4 |
-
The mean bias and corresponding CIs were calculated using the individual sample biases of n=6 preparations. Conversion factor µg/mL to µmol/L: 4.0. CI, confidence interval.
Bias and 95 % CI for the free fraction of phenytoin spiked into the ultrafiltrate of analyte-free human serum and Li-heparin samples (n=6).
| Phenytoin level (concentration) | Serum ultrafiltrate | Plasma ultrafiltrate | ||
|---|---|---|---|---|
| Mean bias, % | 95 % CI, % | Mean bias, % | 95 % CI, % | |
| Level 1 (0.168 μg/mL) | 4.1 | 3.2–4.9 | 2.8 | 0.9–4.7 |
| Level 2 (0.560 μg/mL) | 2.5 | 1.4–3.5 | 3.7 | 2.6–4.8 |
| Level 3 (2.24 μg/mL) | 3.1 | 1.4–4.9 | 4.0 | 3.0–5.0 |
| Level 4 (3.36 μg/mL) | 2.5 | 1.2–3.8 | 3.2 | 1.8–4.6 |
-
The mean bias and corresponding CIs were calculated using the individual sample biases of n=6 preparations. Conversion factor µg/mL to µmol/L: 4.0. CI, confidence interval.
Stability
Processed samples were found to be stable at 7 °C for 6 days, with mean recoveries of 103 and 98 % for total and free phenytoin, respectively. The stability of spiked, frozen analyte-free human serum samples stored at −20 °C was verified for 28 days for total phenytoin, with a mean recovery of 100 %. The stability of phenytoin at −20 °C in 20 % DMSO and in analyte-free human serum ultrafiltrate was verified for 64 days, with a mean recovery of 101 %.
Equivalence of results between independent laboratories
A method comparison study for total phenytoin was conducted using 146 anonymized patient samples, comprising 65 serum, 41 plasma, 30 spiked, and 10 pooled samples. Seven samples fell below the LLMI and were excluded from the analysis. In the study of free phenytoin, a total of 85 samples were evaluated, including 28 serum, 17 plasma, 30 spiked, and 10 pooled samples. Twenty-one samples exceeded the ULMI, three were below the LLMI, and two samples were missing from Site 1. Consequently, these samples were excluded from the evaluation.
Passing-Bablok regression analysis for total phenytoin yielded a slope of 1.00 (95 % CI: 1.00–1.01) and an intercept of −0.01 (95 % CI: −0.09 to 0.03), with an strong Pearson correlation coefficient of 0.998. For free phenytoin, the analysis resulted in a slope of 1.06 (95 % CI: 1.04–1.07) and an intercept of 0.00 (95 % CI: −0.02 to 0.02), alongside an equally confirming Pearson correlation coefficient of 0.999 (Figures 3 and 4).
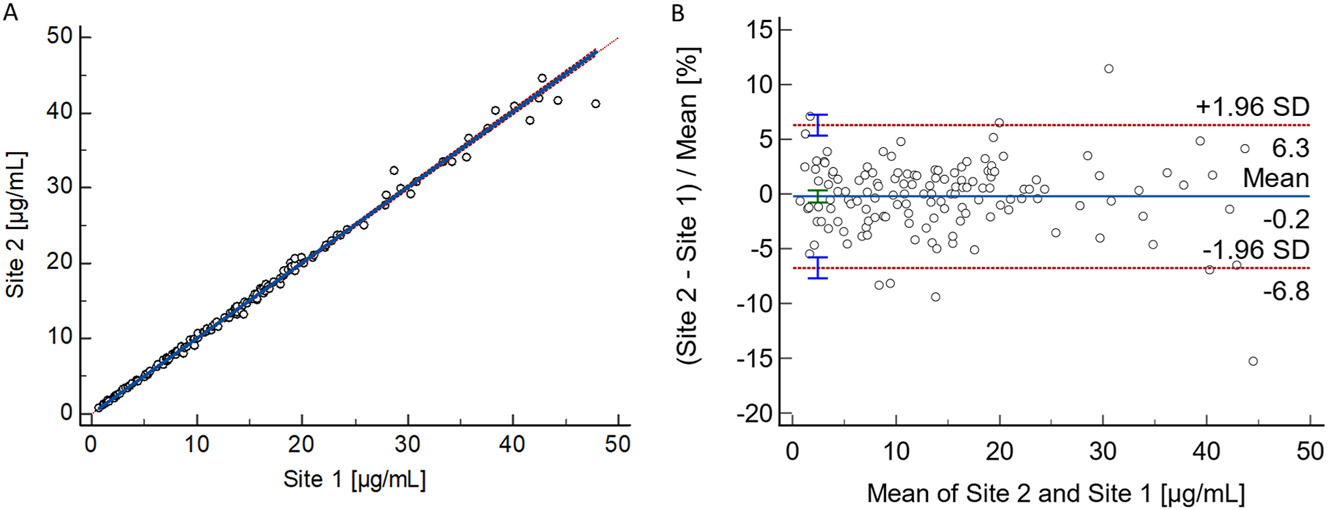
Results from the patient sample-based total phenytoin method comparison study performed between two independent laboratories. (A) Passing–Bablok regression plot, including the Pearson regression analysis, for the method comparison study of the RMP (n=139 samples) between the independent laboratories (Site 1: Risch; Site 2: Roche). Passing–Bablok regression analysis resulted in a regression equation with a slope of 1.00 (95 % CI: 1.00–1.01) and an intercept of −0.01 (95 % CI: −0.09 to 0.03). The Pearson correlation value was ≥0.998. (B) Bland–Altman plot for the method comparison study of the RMP (n=139 samples) between two independent laboratories (Laboratory 1: Risch site, Laboratory 2: Roche site). The interlaboratory measurement bias was −0.2 % (95 % CI: −0.8 to 0.3), and the 2S interval of the relative difference was 6.5 % (lower limit 95 % CI: −7.7 to −5.8 %, upper limit 95 % CI: 5.3–7.2 %). CI, confidence interval; RMP, reference measurement procedure; SD, standard deviation.
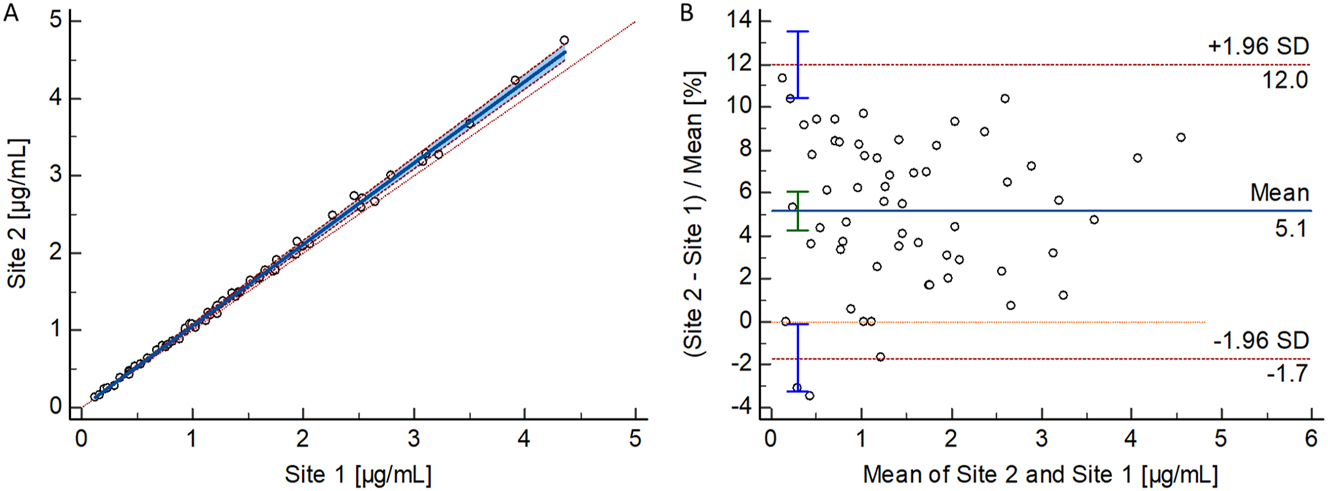
Results from the patient sample-based free phenytoin method comparison study performed between two independent laboratories. (A) Passing–Bablok regression plot, including the Pearson regression analysis for the method comparison study of the RMP (n=59 samples) between the independent laboratories (Site 1: Risch; Site 2: Roche). Passing–Bablok regression analysis resulted in a regression equation with a slope of 1.06 (95 % CI: 1.04–1.07) and an intercept of 0.00 (95 % CI: −0.02 to 0.02). The Pearson correlation value was ≥0.998. (B) Bland–Altman plot for the method comparison study of the RMP (n=59 samples) between two independent laboratories (Laboratory 1: Risch site, Laboratory 2: Roche site). The interlaboratory measurement bias was 5.1 % (95 % CI: 4.2–6.1 %) and the 2S interval of the relative difference was 6.8 % (lower limit 95 % CI: −3.3 to −0.1 %, upper limit 95 % CI: 10.4–13.5 %). CI, confidence interval; RMP, reference measurement procedure; SD, standard deviation.
Bland-Altman analysis revealed a mean bias of −0.2 % (95 % CI: −0.8 to 0.3 %) and 2S agreement of 6.5 % (lower limit 95 % CI: −7.7 to −5.8 %, upper limit 95 % CI: 5.3–7.2) for total phenytoin. For free phenytoin, the analysis demonstrated a mean bias of 5.1 % (95 % CI: 4.2–6.1 %) and 2S agreement of 6.8 % (lower limit 95 % CI: −3.3 to −0.1 %, upper limit 95 % CI: 10.4–13.5 %).
Furthermore, performance evaluation at Site 2 (n=36) confirmed intermediate precision performance with values of ≤2.4 % for total phenytoin and ≤3.2 % for free phenytoin.
Uncertainty of results
Calibration level uncertainties were evaluated as type B, while precision experiments for sample preparation and measurement were assessed as type A uncertainties. MU (k=2) for single serum sample measurements were 3.5–5.1 %, and 1.8–3.3 % for target value assignment (n=6) (Tables 8 and 9). For free phenytoin, uncertainties ranged from 4.1–7.9 % for single measurements and 2.0–2.7 % for target value assignment, meeting uncertainty requirements (Tables 10 and 11).
Overview of measurement uncertainty for total phenytoin quantification with the candidate RMP in serum samples for single measurements.
| Level | ||||||
|---|---|---|---|---|---|---|
| Level 1 1.50 μg/mL |
Level 2 10.0 μg/mL |
Level 3 20.0 μg/mL |
Level 4 40.0 μg/mL |
Patient Sample 1 1.44 μg/mL |
Patient Sample 2 15.3 μg/mL |
|
|
Type B uncertainty Calibrator preparation, CV (%) |
0.87 | 0.83 | 0.80 | 0.79 | 0.87 | 0.80 |
| Characterization of reference material | 0.2 | 0.2 | 0.2 | 0.2 | 0.2 | 0.2 |
| Preparation of | ||||||
| Stock solution | 0.31 | 0.31 | 0.31 | 0.31 | 0.31 | 0.31 |
| Working solution | 0.49 | – | – | – | 0.49 | – |
| Spike solution | 0.62 | 0.55 | 0.51 | 0.49 | 0.62 | 0.51 |
| Matrix-based calibrator | 0.87 | 0.83 | 0.80 | 0.79 | 0.87 | 0.80 |
| Type A uncertainty intermediate precision, CV (%) | 2.4 | 1.7 | 2.0 | 2.0 | 2.1 | 1.6 |
| Measurement uncertainty (k=1), CV (%) | 2.5 | 1.9 | 2.2 | 2.1 | 2.3 | 1.8 |
| Expanded measurement uncertainty (k=2), CV (%) | 5.1 | 3.8 | 4.4 | 4.2 | 4.6 | 3.5 |
-
Conversion factor µg/mL to µmol/L: 4.0. The total measurement uncertainty of the whole approach for a single measurement, estimated as a combination of the uncertainty of calibrator preparation (type B uncertainty) and uncertainty of the precision experiment (type A uncertainty), is given in bold. CV, coefficient of variation; RMP, reference measurement procedure.
Overview of measurement uncertainty for total phenytoin target value assignment (n=6) with the candidate RMP in serum samples.
| Level | ||||||
|---|---|---|---|---|---|---|
| Level 1 1.50 μg/mL |
Level 2 10.0 μg/mL |
Level 3 20.0 μg/mL |
Level 4 40.0 μg/mL |
Patient Sample 1 1.44 μg/mL |
Patient Sample 2 15.3 μg/mL |
|
|
Type B uncertainty Calibrator preparation, CV (%) |
0.87 | 0.83 | 0.80 | 0.79 | 0.87 | 0.80 |
| Characterization of reference material | 0.2 | 0.2 | 0.2 | 0.2 | 0.2 | 0.2 |
| Preparation of | ||||||
| Stock solution | 0.31 | 0.31 | 0.31 | 0.31 | 0.31 | 0.31 |
| Working solution | 0.49 | – | – | – | 0.49 | – |
| Spike solution | 0.62 | 0.55 | 0.51 | 0.49 | 0.62 | 0.51 |
| Matrix-based calibrator | 0.87 | 0.83 | 0.80 | 0.79 | 0.87 | 0.80 |
| Type A uncertainty intermediate precision, CV (%) | 1.4 | 0.7 | 1.1 | 0.4 | 1.1 | 0.5 |
| Measurement uncertainty (k=1), CV (%) | 1.7 | 1.1 | 1.4 | 0.9 | 1.4 | 0.9 |
| Expanded measurement uncertainty (k=2), CV (%) | 3.3 | 2.1 | 2.8 | 1.8 | 2.7 | 1.9 |
-
Conversion factor µg/mL to µmol/L: 4.0. The total measurement uncertainty of the whole approach for a single measurement, estimated as a combination of the uncertainty of calibrator preparation (type B uncertainty) and uncertainty of the precision experiment (type A uncertainty), is given in bold. CV, coefficient of variation; RMP, reference measurement procedure.
Overview of measurement uncertainty for free phenytoin quantification with the candidate RMP in serum samples for single measurements.
| Level | ||||||
|---|---|---|---|---|---|---|
| Level 1 0.157 μg/mL |
Level 2 0.523 μg/mL |
Level 3 2.24 μg/mL |
Level 4 3.47 μg/mL |
Patient Sample 1 0.493 μg/mL |
Patient Sample 2 2.82 μg/mL |
|
|
Type B uncertainty Calibrator preparation, CV (%) |
0.88 | 0.86 | 0.74 | 0.74 | 0.86 | 0.74 |
| Characterization of reference material | 0.2 | 0.2 | 0.2 | 0.2 | 0.2 | 0.2 |
| Preparation of | ||||||
| Stock solution | 0.23 | 0.23 | 0.23 | 0.23 | 0.23 | 0.23 |
| Working solution | 0.44 | – | – | – | – | – |
| Spike solution | 0.63 | 0.60 | 0.41 | 0.41 | 0.60 | 0.41 |
| Matrix-based calibrator | 0.88 | 0.86 | 0.74 | 0.74 | 0.86 | 0.74 |
| Type A uncertainty intermediate precision, CV (%) | 2.4 | 2.1 | 1.9 | 1.9 | 3.8 | 2.2 |
| Measurement uncertainty (k=1), CV (%) | 2.6 | 2.3 | 2.0 | 2.0 | 3.9 | 2.3 |
| Expanded measurement uncertainty (k=2), CV (%) | 5.1 | 4.6 | 4.1 | 4.1 | 7.9 | 4.7 |
-
Conversion factor µg/mL to µmol/L: 4.0. The total measurement uncertainty of the whole approach for a single measurement, estimated as a combination of the uncertainty of calibrator preparation (type B uncertainty) and uncertainty of the precision experiment (type A uncertainty), is given in bold. CV, coefficient of variation; RMP, reference measurement procedure.
Overview of measurement uncertainty for free phenytoin target value assignment (n=6) with the candidate RMP in serum samples.
| Level | ||||||
|---|---|---|---|---|---|---|
| Level 1 0.157 μg/mL |
Level 2 0.523 μg/mL |
Level 3 2.24 μg/mL |
Level 4 3.47 μg/mL |
Patient Sample 1 0.493 μg/mL |
Patient Sample 2 2.82 μg/mL |
|
|
Type B uncertainty Calibrator preparation, CV (%) |
0.88 | 0.86 | 0.74 | 0.74 | 0.86 | 0.74 |
| Characterization of reference material | 0.2 | 0.2 | 0.2 | 0.2 | 0.2 | 0.2 |
| Preparation of | ||||||
| Stock solution | 0.23 | 0.23 | 0.23 | 0.23 | 0.23 | 0.23 |
| Working solution | 0.44 | – | – | – | – | – |
| Spike solution | 0.63 | 0.60 | 0.41 | 0.41 | 0.60 | 0.41 |
| Matrix-based calibrator | 0.88 | 0.86 | 0.74 | 0.74 | 0.86 | 0.74 |
| Type A uncertainty intermediate precision, CV (%) | 0.9 | 1.1 | 0.5 | 0.7 | 0.9 | 0.7 |
| Measurement uncertainty (k=1), CV (%) | 1.3 | 1.4 | 0.9 | 1.0 | 1.2 | 1.0 |
| Expanded measurement uncertainty (k=2), CV (%) | 2.5 | 2.7 | 1.8 | 2.0 | 2.5 | 2.1 |
-
Conversion factor µg/mL to µmol/L: 4.0. The total measurement uncertainty of the whole approach for a single measurement, estimated as a combination of the uncertainty of calibrator preparation (type B uncertainty) and uncertainty of the precision experiment (type A uncertainty), is given in bold. CV, coefficient of variation; RMP, reference measurement procedure.
Discussion
The proposed candidate reference measurement procedure (RMP), utilizing ID-LC-MS/MS, enables the quantification of both total and free phenytoin in human serum and plasma. These methods were developed based on routine clinical measurement procedures and targeted therapeutic analyte concentrations within serum and plasma specimens. The development of this method involved selecting a stationary phase and optimizing the mobile phase composition gradient, ion source, and sample preparation procedure. The most effective extraction method for determining total phenytoin concentration was identified as protein precipitation followed by dilution. Ultrafiltration was employed to isolate free phenytoin, a common technique in clinical practice. We opted to use the Centrifree® device for this project due to its ease of use and widespread clinical application [28], [31], [32], [33].
Traceability to SI units was achieved using qNMR, which provides highly accurate quantification of the analytes mass fraction and precise evaluation of MU. The qNMR-characterized material served as the reference standard and was subsequently used to prepare calibrator material. Calibrator concentrations were optimized to adequately cover the required measurement range by establishing an optimal calibration and control scheme and carefully preparing calibrator and control materials through precise pipetting. Given that phenytoin exhibits high protein binding (90 %), the measurement range for free phenytoin was roughly one-tenth of the range for total phenytoin.
The RMP has undergone thorough validation, demonstrating their accuracy, precision, selectivity, and specificity for measuring total and free phenytoin in human serum and plasma. Model calculations based on the therapeutic range [53], 54] or the drug’s half-life [55], 56] suggested an uncertainty range of 3.4–16.6 %. Proficiency data revealed inter-laboratory coefficients of variation (CV) of 17.1 % for total phenytoin and 35.4 % for free phenytoin, leading to MUs (k=2) of 27.4 and 56.6 %, respectively, after applying an inter-/intra-laboratory variance factor of 0.8 [57]. These values exceeded model predictions, particularly for free phenytoin.
Rigo-Bonnin et al. reported that complex sample preparation contributed to MU for free phenytoin, ranging from 13.0 to 30.9 % (k=2) [58]. They also identified issues in equilibrium dialysis, such as non-specific binding and volume shifts, affecting free phenytoin levels. Due to methodological similarities, ultrafiltration and equilibrium dialysis likely share similar uncertainties [59], 60]. Pauwels et al. estimated the MU for total phenytoin to be below 9.6 % (k=2) based on patient-derived data and biological variability [61]. To meet RMP requirements described by Braga et al. [62], the target uncertainty for total phenytoin was set below 3.2 % (k=2), and the target for free phenytoin was determined to be <9.1 % (k=2), based on proficiency testing. Our results align well with the estimated acceptable performance specifications with an expanded MU for target value assignment ranging from 1.8 to 3.3 % for total phenytoin and from 2.0 to 2.7 % for free phenytoin.
Moreover, method comparisons for total and free phenytoin were conducted to demonstrate the transferability of the RMPs. For both total and free phenytoin, the interlaboratory measurement bias was found to be negligible, confirming the method’s transferability. Further reproducibility could be demonstrated by participating in RELA ring trials, a globally recognized platform for RMP comparison. However, no comparison study for phenytoin was available, and therefore, no relevant ring trial results were produced in this study.
Conclusions
We used an LC-MS/MS-based candidate RMP to detect total and free phenytoin in human serum and plasma. This was demonstrated to be a traceable and reliable platform for the standardization of routine assays and evaluation of clinically relevant samples.
Acknowledgments
We would like to thank Aline Hoffmeister, Monika Kriner, and Michael Dedio for their support in selecting and providing samples.
-
Research ethics: All procedures were in accordance with the Helsinki Declaration. All samples used were exclusively anonymized leftover samples.
-
Informed consent: Not applicable.
-
Author contributions: All authors have accepted responsibility for the entire content of this manuscript and approved its submission.
-
Use of Large Language Models, AI and Machine Learning Tools: Roche Chat, Roche’s artificial intelligence (AI) Technology, was used to improve the language of the manuscript.
-
Conflict of interest: Tobias Schierscher and Lorenz Risch are employees of Dr. Risch Ostschweiz AG. Linda Salzmann, Janik Wild, Carina Schäfer, Christoph Seger were all employees of Dr. Risch Ostschweiz AG at the time the study was conducted. Judith Taibon, Neeraj Singh, Manuel Seitz, Andrea Geistanger, and Christian Geletneky are all employees of Roche Diagnostics GmbH. Friederike Bauland is an employee of Chrestos Concept GmbH & Co. KG, (Girardetstraße 1–5, 45131 Essen, Germany) and did the work on behalf of Roche Diagnostics GmbH. Roche employees holding Roche non-voting equity securities (Genussscheine): Judith Taibon, Christian Geletneky, Andrea Geistanger Roche employee holding Roche bearer shares: Manuel Seitz.
-
Research funding: This research was funded by Roche Diagnostics GmbH. Lorenz Risch and their team are funded cooperation partners of Roche Diagnostics GmbH. Christoph Seger receives a consultant honorarium from Roche Diagnostics GmbH.
-
Data availability: The raw data can be obtained on request from the corresponding author.
References
1. The Electronic Medicines Compendium. Phenytoin SmPC [Online]. https://www.medicines.org.uk/emc/medicine/26838 [Accessed 19 May 2025].Suche in Google Scholar
2. Yaari, Y, Selzer, ME, Pincus, JH. Phenytoin: mechanisms of its anticonvulsant action. Ann Neurol 1986;20:171–84. https://doi.org/10.1002/ana.410200202.Suche in Google Scholar PubMed
3. Patocka, J, Wu, Q, Nepovimova, E, Kuca, K. Phenytoin – an anti-seizure drug: overview of its chemistry, pharmacology and toxicology. Food Chem Toxicol 2020;142:111393. https://doi.org/10.1016/j.fct.2020.111393.Suche in Google Scholar PubMed
4. Levine, M, Chang, T. Therapeutic drug monitoring of phenytoin. Rationale and current status. Clin Pharmacokinet 1990;19:341–58. https://doi.org/10.2165/00003088-199019050-00001.Suche in Google Scholar PubMed
5. Soldin, SJ. Free drug measurements. When and why? An overview. Arch Pathol Lab Med 1999;123:822–3. https://doi.org/10.5858/1999-123-0822-fdm.Suche in Google Scholar
6. Patsalos, PN, Berry, DJ, Bourgeois, BF, Cloyd, JC, Glauser, TA, Johannessen, SI, et al.. Antiepileptic drugs – best practice guidelines for therapeutic drug monitoring: a position paper by the subcommission on therapeutic drug monitoring, ILAE Commission on Therapeutic Strategies. Epilepsia (Cph) 2008;49:1239–76. https://doi.org/10.1111/j.1528-1167.2008.01561.x.Suche in Google Scholar PubMed
7. Eadie, MJ. Therapeutic drug monitoring – antiepileptic drugs. Br J Clin Pharmacol 2001;52(1 Suppl):S11–20. https://doi.org/10.1046/j.1365-2125.2001.00394.x.Suche in Google Scholar
8. Hiemke, C, Bergemann, N, Clement, HW, Conca, A, Deckert, J, Domschke, K, et al.. Consensus guidelines for therapeutic drug monitoring in neuropsychopharmacology. Pharmacopsychiatry 2018;51:9–62. https://doi.org/10.1055/s-0043-116492.Suche in Google Scholar PubMed
9. Banh, HL, Burton, ME, Sperling, MR. Interpatient and intrapatient variability in phenytoin protein binding. Ther Drug Monit 2002;24:379–85. https://doi.org/10.1097/00007691-200206000-00009.Suche in Google Scholar PubMed
10. Fedler, C, Stewart, MJ. Plasma total phenytoin: a possibly misleading test in developing countries. Ther Drug Monit 1999;21:155–60. https://doi.org/10.1097/00007691-199904000-00003.Suche in Google Scholar PubMed
11. Imam, SH, Landry, K, Kaul, V, Gambhir, H, John, D, Kloss, B. Free phenytoin toxicity. Am J Emerg Med 2014;32:1301.e3–4. https://doi.org/10.1016/j.ajem.2014.03.036.Suche in Google Scholar PubMed
12. Robertson, K, von Stempel, CB, Arnold, I. When less is more: a case of phenytoin toxicity. BMJ Case Rep 2013;2013:bcr2012008023. https://doi.org/10.1136/bcr-2012-008023.Suche in Google Scholar PubMed PubMed Central
13. Lindow, J, Wijdicks, EF. Phenytoin toxicity associated with hypoalbuminemia in critically ill patients. Chest (Am Coll Chest Physicians) 1994;105:602–4. https://doi.org/10.1378/chest.105.2.602.Suche in Google Scholar PubMed
14. Krasowski, MD, Penrod, LE. Clinical decision support of therapeutic drug monitoring of phenytoin: measured versus adjusted phenytoin plasma concentrations. BMC Med Inf Decis Making 2012;12:7. https://doi.org/10.1186/1472-6947-12-7.Suche in Google Scholar PubMed PubMed Central
15. Hong, JM, Choi, YC, Kim, WJ. Differences between the measured and calculated free serum phenytoin concentrations in epileptic patients. Yonsei Med J 2009;50:517–20. https://doi.org/10.3349/ymj.2009.50.4.517.Suche in Google Scholar PubMed PubMed Central
16. Kiang, TK, Ensom, MH. A comprehensive review on the predictive performance of the Sheiner-Tozer and derivative equations for the correction of phenytoin concentrations. Ann Pharmacother 2016;50:311–25. https://doi.org/10.1177/1060028016628166.Suche in Google Scholar PubMed
17. Javadi, SS, Mahjub, R, Taher, A, Mohammadi, Y, Mehrpooya, M. Correlation between measured and calculated free phenytoin serum concentration in neurointensive care patients with hypoalbuminemia. Clin Pharmacol 2018;10:183–90. https://doi.org/10.2147/cpaa.s186322.Suche in Google Scholar
18. Darwish, IA. Immunoassay methods and their applications in pharmaceutical analysis: basic methodology and recent advances. Int J Biomed Sci 2006;2:217–35. https://doi.org/10.59566/ijbs.2006.2217.Suche in Google Scholar
19. Datta, P, Dasgupta, A. Cross-reactivity of fosphenytoin in four phenytoin immunoassays. Clin Chem 1998;44:696–7. https://doi.org/10.1093/clinchem/44.3.696.Suche in Google Scholar
20. Kugler, AR, Annesley, TM, Nordblom, GD, Koup, JR, Olson, SC. Cross-reactivity of fosphenytoin in two human plasma phenytoin immunoassays. Clin Chem 1998;44:1474–80. https://doi.org/10.1093/clinchem/44.7.1474.Suche in Google Scholar
21. Rainey, PM, Rogers, KE, Roberts, WL. Metabolite and matrix interference in phenytoin immunoassays. Clin Chem 1996;42:1645–53. https://doi.org/10.1093/clinchem/42.10.1645.Suche in Google Scholar
22. Hassib, ST, Hashem, HMA, Mahrouse, MA, Mostafa, EA. Determination of four antiepileptic drugs in plasma using ultra-performance liquid chromatography with mass detection technique. Biomed Chromatogr 2018;32:e4253. https://doi.org/10.1002/bmc.4253.Suche in Google Scholar PubMed
23. Yin, L, Wang, T, Shi, M, Zhang, Y, Zhao, X, Yang, Y, et al.. Simultaneous determination of ten antiepileptic drugs in human plasma by liquid chromatography and tandem mass spectrometry with positive/negative ion-switching electrospray ionization and its application in therapeutic drug monitoring. J Separ Sci 2016;39:964–72. https://doi.org/10.1002/jssc.201501067.Suche in Google Scholar PubMed
24. Deeb, S, McKeown, DA, Torrance, HJ, Wylie, FM, Logan, BK, Scott, KS. Simultaneous analysis of 22 antiepileptic drugs in postmortem blood, serum and plasma using LC-MS-MS with a focus on their role in forensic cases. J Anal Toxicol 2014;38:485–94. https://doi.org/10.1093/jat/bku070.Suche in Google Scholar PubMed
25. Kim, KB, Seo, KA, Kim, SE, Bae, SK, Kim, DH, Shin, JG. Simple and accurate quantitative analysis of ten antiepileptic drugs in human plasma by liquid chromatography/tandem mass spectrometry. J Pharm Biomed Anal 2011;56:771–7. https://doi.org/10.1016/j.jpba.2011.07.019.Suche in Google Scholar PubMed
26. Zhang, Y, Mehrotra, N, Budha, NR, Christensen, ML, Meibohm, B. A tandem mass spectrometry assay for the simultaneous determination of acetaminophen, caffeine, phenytoin, ranitidine, and theophylline in small volume pediatric plasma specimens. Clin Chim Acta 2008;398:105–12. https://doi.org/10.1016/j.cca.2008.08.023.Suche in Google Scholar PubMed
27. Suzuki, T, Ogawa, T, Ueyama, J, Iwai, M, Kondo, F, Seno, H. A new method for simultaneous quantification of fosphenytoin, phenytoin and its primary metabolite 5-(4-hydroxyphenyl)-5-phenylhydantoin in whole blood by ultra-performance liquid chromatography-tandem mass spectrometry. Leg Med 2018;34:64–9. https://doi.org/10.1016/j.legalmed.2018.08.006.Suche in Google Scholar PubMed
28. Musteata, FM. Monitoring free drug concentrations: challenges. Bioanalysis 2011;3:1753–68. https://doi.org/10.4155/bio.11.187.Suche in Google Scholar PubMed
29. Cibotaru, D, Celestin, MN, Kane, MP, Musteata, FM. Method for simultaneous determination of free concentration, total concentration, and plasma binding capacity in clinical samples. J Pharmaceut Sci 2021;110:1401–11. https://doi.org/10.1016/j.xphs.2020.12.001.Suche in Google Scholar PubMed PubMed Central
30. Gonzalez, D, Schmidt, S, Derendorf, H. Importance of relating efficacy measures to unbound drug concentrations for anti-infective agents. Clin Microbiol Rev 2013;26:274–88. https://doi.org/10.1128/cmr.00092-12.Suche in Google Scholar
31. Illamola, SM, Hirt, D, Tréluyer, JM, Urien, S, Benaboud, S. Challenges regarding analysis of unbound fraction of highly bound protein antiretroviral drugs in several biological matrices: lack of harmonisation and guidelines. Drug Discov Today 2015;20:466–74. https://doi.org/10.1016/j.drudis.2014.11.010.Suche in Google Scholar PubMed
32. Nilsson, LB. The bioanalytical challenge of determining unbound concentration and protein binding for drugs. Bioanalysis 2013;5:3033–50. https://doi.org/10.4155/bio.13.274.Suche in Google Scholar PubMed
33. Metsu, D, Lanot, T, Fraissinet, F, Concordet, D, Gayrard, V, Averseng, M, et al.. Comparing ultrafiltration and equilibrium dialysis to measure unbound plasma dolutegravir concentrations based on a design of experiment approach. Sci Rep 2020;10:12265. https://doi.org/10.1038/s41598-020-69102-y.Suche in Google Scholar PubMed PubMed Central
34. Peat, J, Frazee, C, Garg, U. Quantification of free phenytoin by liquid chromatography tandem mass spectrometry (LC/MS/MS). Methods Mol Biol 2016;1383:241–6. https://doi.org/10.1007/978-1-4939-3252-8_25.Suche in Google Scholar PubMed
35. Garg, U, Peat, J, Frazee, C 3rd, Nguyen, T, Ferguson, AM. A simple isotope dilution electrospray ionization tandem mass spectrometry method for the determination of free phenytoin. Ther Drug Monit 2013;35:831–5. https://doi.org/10.1097/ftd.0b013e31828f5337.Suche in Google Scholar PubMed
36. Bardin, S, Ottinger, JC, Breau, AP, O’Shea, TJ. Determination of free levels of phenytoin in human plasma by liquid chromatography/tandem mass spectrometry. J Pharm Biomed Anal 2000;23:573–9. https://doi.org/10.1016/s0731-7085(00)00338-1.Suche in Google Scholar PubMed
37. Jung, D, Mayersohn, M, Perrier, D. The “ultra-free” ultrafiltration technique compared with equilibrium dialysis for determination of unbound thiopental concentrations in serum. Clin Chem 1981;27:166–8. https://doi.org/10.1093/clinchem/27.1.166.Suche in Google Scholar
38. Bureau International des Poids et Mesures. JCTLM database: laboratory medicine and in vitro diagnostics [Online]. Available from: https://www.bipm.org/en/committees/jc/jctlm [Accessed 27 Jun 2024].Suche in Google Scholar
39. Tai, SS, Yeh, CY, Phinney, KW. Development and validation of a reference measurement procedure for certification of phenytoin, phenobarbital, lamotrigine, and topiramate in human serum using isotope-dilution liquid chromatography/tandem mass spectrometry. Anal Bioanal Chem 2011;401:1915–22. https://doi.org/10.1007/s00216-011-5251-5.Suche in Google Scholar PubMed
40. ISO 15193:2009. In vitro diagnostic medical devices – measurement of quantities in samples of biological origin – requirements for content and presentation of reference measurement procedure. International Organization for Standardization (ISO), May 2009 [Online]. https://www.iso.org/standard/42021.html [Accessed 19 May 2025].Suche in Google Scholar
41. Singh, N, Taibon, J, Pongratz, S, Geletneky, C. Absolute content determination by quantitative NMR (qNMR) spectroscopy: a curious case of aldosterone. RSC Adv 2021;11:23627–30. https://doi.org/10.1039/d1ra03472c.Suche in Google Scholar PubMed PubMed Central
42. Singh, N, Taibon, J, Pongratz, S, Geletneky, C. Quantitative NMR (qNMR) spectroscopy based investigation of the absolute content, stability and isomerization of 25-hydroxyvitamin D2/D3 and 24(R),25-dihydroxyvitamin D2 in solution phase. Sci Rep 2022;12:3014. https://doi.org/10.1038/s41598-022-06948-4.Suche in Google Scholar PubMed PubMed Central
43. Nelson, MA, Waters, JF, Toman, B, Lang, BE, Rück, A, Breitruck, K, et al.. A new realization of SI for organic chemical measurement: NIST PS1 primary standard for quantitative NMR (benzoic acid). Anal Chem 2018;90:10510–7. https://doi.org/10.1021/acs.analchem.8b02575.Suche in Google Scholar PubMed PubMed Central
44. Westwood, S, Lippa, K, Shimuzu, Y, Lalerle, B, Saito, T, Duewer, D, et al.. Methods for the SI-traceable value assignment of the purity of organic compounds (IUPAC Technical Report). Pure Appl Chem 2023;95:1–77. https://doi.org/10.1515/pac-2020-0804.Suche in Google Scholar
45. Clinical and Laboratory Standards Institute (CLSI). C62-A. Liquid chromatography-mass spectrometry methods; approved guideline. In: CLSI document C62-A. Wayne, PA: Clinical and Laboratory Standard Institute; 2014.Suche in Google Scholar
46. ICH Topic Q2(R1) Harmonised Tripartite Guideline. Validation of analytical procedures: text and methodology. European Medicines Agency (EMA); June 1995. [Online]. Available from: https://www.ema.europa.eu/en/documents/scientific-guideline/ich-guideline-q2r1-validation-analytical-procedures-text-methodology-step-5-first-version_en.pdf.Suche in Google Scholar
47. Working Group 1 of the Joint Committee for Guides in Metrology (JCGM/WG1). Evaluation of measurement data – guide to the expression of uncertainty in measurement (GUM) [Online]. https://www.bipm.org/documents/20126/2071204/JCGM_100_2008_E.pdf/cb0ef43f-baa5-11cf-3f85-4dcd86f77bd6 [Accessed 19 May 2025].Suche in Google Scholar
48. Matuszewski, BK. Standard line slopes as a measure of a relative matrix effect in quantitative HPLC-MS bioanalysis. J Chromatogr, B: Anal Technol Biomed Life Sci 2006;830:293–300. https://doi.org/10.1016/j.jchromb.2005.11.009.Suche in Google Scholar PubMed
49. Matuszewski, BK, Constanzer, ML, Chavez-Eng, CM. Strategies for the assessment of matrix effect in quantitative bioanalytical methods based on HPLC-MS/MS. Anal Chem 2003;75:3019–30. https://doi.org/10.1021/ac020361s.Suche in Google Scholar PubMed
50. Armbruster, DA, Pry, T. Limit of blank, limit of detection and limit of quantitation. Clin Biochem Rev 2008;29(1 Suppl):S49–52.Suche in Google Scholar
51. Taibon, J, Santner, T, Singh, N, Ibrahim, SC, Babitzki, G, Köppl, D, et al.. An isotope dilution-liquid chromatography-tandem mass spectrometry (ID-LC-MS/MS)-based candidate reference measurement procedure (RMP) for the quantification of aldosterone in human serum and plasma. Clin Chem Lab Med 2023;61:1902–16. https://doi.org/10.1515/cclm-2022-0996.Suche in Google Scholar PubMed
52. Schuetzenmeister, A, Dufey, F.: variance component analysis [Online]. https://cran.r-project.org/web/packages/VCA/index.html [Accessed 19 May 2025].Suche in Google Scholar
53. Glick, JHJr. Expression of random analytical error as a percentage of the range of clinical interest. Clin Chem 1976;22:475–83. https://doi.org/10.1093/clinchem/22.4.475.Suche in Google Scholar
54. Ayers, G, Burnett, D, Griffiths, A, Richens, A. Quality control of drug assays. Clin Pharmacokinet 1981;6:106–17. https://doi.org/10.2165/00003088-198106020-00002.Suche in Google Scholar PubMed
55. Fraser, CG. Desirable standards of performance for therapeutic drug monitoring. Clin Chem 1987;33:387–9. Erratum in: Clin Chem 1987;33:1298. https://doi.org/10.1093/clinchem/33.3.387.Suche in Google Scholar
56. Steele, BW, Wang, E, Palomaki, GE, Klee, GG, Elin, RJ, Soldin, SJ, et al.. An evaluation of analytic goals for assays of drugs: a College of American Pathologists Therapeutic Drug Monitoring Survey Study. Arch Pathol Lab Med 2001;125:729–35. https://doi.org/10.5858/2001-125-0729-aeoagf.Suche in Google Scholar PubMed
57. Steele, BW, Wang, E, Palomaki, G, Klee, GG, Elin, RJ, Witte, DL. Sources of variability: a College of American Pathologists Therapeutic Drug Monitoring Survey Study. Arch Pathol Lab Med 2001;125:183–90. https://doi.org/10.5858/2001-125-0183-sov.Suche in Google Scholar
58. Rigo-Bonnin, R, Mas-Bosch, V, Canalias, F. Measurement uncertainty estimation of free drug concentrations in clinical laboratories using equilibrium dialysis. Clin Chem Lab Med 2024;62:870–80. https://doi.org/10.1515/cclm-2023-1023.Suche in Google Scholar PubMed
59. Bowers, WF, Fulton, S, Thompson, J. Ultrafiltration vs equilibrium dialysis for determination of free fraction. Clin Pharmacokinet 1984;9(1 Suppl):49–60. https://doi.org/10.2165/00003088-198400091-00007.Suche in Google Scholar PubMed
60. Yu, Z, Moomaw, JF, Thyagarajapuram, NR, Geng, SB, Bent, CJ, Tang, Y. A mechanistic model to account for the Donnan and volume exclusion effects in ultrafiltration/diafiltration process of protein formulations. Biotechnol Prog 2021;37:e3106. https://doi.org/10.1002/btpr.3106.Suche in Google Scholar PubMed
61. Pauwels, S, Vermeersch, P, Desmet, K, Vanstapel, F. Practice-oriented quality specifications for therapeutic drug monitoring. Clin Chem 2014;60:559–60. https://doi.org/10.1373/clinchem.2013.217125.Suche in Google Scholar PubMed
62. Braga, F, Panteghini, M. The utility of measurement uncertainty in medical laboratories. Clin Chem Lab Med 2020;58:1407–13. https://doi.org/10.1515/cclm-2019-1336.Suche in Google Scholar PubMed
Supplementary Material
This article contains supplementary material (https://doi.org/10.1515/cclm-2024-0858).
© 2025 the author(s), published by De Gruyter, Berlin/Boston
This work is licensed under the Creative Commons Attribution 4.0 International License.
Artikel in diesem Heft
- Frontmatter
- Editorial
- Keeping pace with patient safety by developing and qualifying higher-order reference measurement procedures for laboratory measurement standardization
- Review
- The role of AI in pre-analytical phase – use cases
- Opinion Paper
- Total laboratory automation: fit for its intended purposes?
- Guidelines and Recommendations
- EFLM checklist for the assessment of AI/ML studies in laboratory medicine: enhancing general medical AI frameworks for laboratory-specific applications
- Candidate Reference Measurement Procedures and Materials
- An isotope dilution-liquid chromatography-tandem mass spectrometry-based candidate reference measurement procedure for the quantification of cortisol in human serum and plasma
- Isotope dilution-liquid chromatography-tandem mass spectrometry-based candidate reference measurement procedures for the quantification of 24(R),25-dihydroxyvitamin D2 and 24(R),25-dihydroxyvitamin D3 in human serum and plasma
- An isotope dilution-liquid chromatography-tandem mass spectrometry-based candidate reference measurement procedure for the quantification of cortisone in human serum and plasma
- Candidate reference measurement procedure based on isotope dilution-two dimensional-liquid chromatography-tandem mass spectrometry for the quantification of androstenedione in human serum and plasma
- An isotope dilution-liquid chromatography-tandem mass spectrometry-based candidate reference measurement procedure for the quantification of 17β-estradiol in human serum and plasma
- Isotope dilution-liquid chromatography-tandem mass spectrometry-based candidate reference measurement procedures for the quantification of total and free phenytoin in human serum and plasma
- An isotope dilution-liquid chromatography-tandem mass spectrometry based candidate reference measurement procedure for the simultaneous quantification of 25-hydroxyvitamin D3 and 25-hydroxyvitamin D2 in human serum and plasma
- General Clinical Chemistry and Laboratory Medicine
- Quality assurance using patient split samples: recommendations for primary healthcare laboratories
- Age distorts the interpretation of FIB-4
- Not all anti-parietal cell antibody tests are equal for diagnosing pernicious anemia
- Impact of renal and hepatic function on dihydropyrimidine dehydrogenase phenotype assessed by enzyme activity in peripheral blood mononuclear cells and uracilemia
- Fecal leukocyte esterase levels predict endoscopic severity as an alternative biomarker in inflammatory bowel disease
- Cancer Diagnostics
- CA-125 glycovariant assays enhance diagnostic sensitivity in the detection of epithelial ovarian cancer
- Cardiovascular Diseases
- Defining the analytical characteristics of a novel high-sensitivity point-of-care troponin I assay in its intended clinical environment
- An automatic chemiluminescence immunoassay for a novel biomarker NT-IGFBP-4: analytical performance and clinical relevance in heart failure
- Analysis of total cholesterol results measured in the initial period of the Croatian screening program for familial hypercholesterolemia: a pilot study
- Diabetes
- Comparison of seven different enzymatic methods for serum glycated albumin in pregnant women: a multicenter study
- Infectious Diseases
- Comparative analysis of monocyte distribution width alterations in Escherichia coli sepsis: insights from in vivo and ex vivo models
- Proadrenomedullin for prediction of early and mid-term mortality in patients hospitalized for community-acquired pneumonia
- Annual Reviewer Acknowledgment
- Reviewer Acknowledgment
- Letters to the Editor
- Biological variation of serum Golgi protein 73 concentrations
- Are vitamins A and E results truly traceable and clinically useful? A practical and critical inquiry
- Tafasitamab interference in immunofixation electrophoresis
- Improvement in the turnaround time of PTH(1–84) as part of the intraoperative PTH monitoring for parathyroidectomy
- Rethinking the use of “one-way ANOVA” in CLSI EP15-A3 – a call for terminological precision and methodological clarity
- Toxic beauty: acute kidney injury triggered by hair-straightening treatment
- Congress Abstracts
- 57th National Congress of the Italian Society of Clinical Biochemistry and Clinical Molecular Biology (SIBioC – Laboratory Medicine)