An extensive review of state-of-the-art transfer learning techniques used in medical imaging: Open issues and challenges
-
Abdulrahman Abbas Mukhlif


Abstract
Deep learning techniques, which use a massive technology known as convolutional neural networks, have shown excellent results in a variety of areas, including image processing and interpretation. However, as the depth of these networks grows, so does the demand for a large amount of labeled data required to train these networks. In particular, the medical field suffers from a lack of images because the procedure for obtaining labeled medical images in the healthcare field is difficult, expensive, and requires specialized expertise to add labels to images. Moreover, the process may be prone to errors and time-consuming. Current research has revealed transfer learning as a viable solution to this problem. Transfer learning allows us to transfer knowledge gained from a previous process to improve and tackle a new problem. This study aims to conduct a comprehensive survey of recent studies that dealt with solving this problem and the most important metrics used to evaluate these methods. In addition, this study identifies problems in transfer learning techniques and highlights the problems of the medical dataset and potential problems that can be addressed in future research. According to our review, many researchers use pre-trained models on the Imagenet dataset (VGG16, ResNet, Inception v3) in many applications such as skin cancer, breast cancer, and diabetic retinopathy classification tasks. These techniques require further investigation of these models, due to training them on natural, non-medical images. In addition, many researchers use data augmentation techniques to expand their dataset and avoid overfitting. However, not enough studies have shown the effect of performance with or without data augmentation. Accuracy, recall, precision, F1 score, receiver operator characteristic curve, and area under the curve (AUC) were the most widely used measures in these studies. Furthermore, we identified problems in the datasets for melanoma and breast cancer and suggested corresponding solutions.
1 Introduction
The use of powerful computers and diverse intelligent algorithms has opened a new world full of possibilities and challenges [1]. In medicine and healthcare, the automation of tasks and processes that were previously performed manually has made technology indispensable. Not only does technology save time, but it also improves the understanding of complex diseases and has the potential to reduce the overall cost of medical care. Over the past few decades, medical image interpretation has been chiefly performed by human experts such as radiologists and physicians. However, due to the wide differences in the pathology and potential fatigue of human experts, researchers, and clinicians are beginning to benefit from computer-assisted interventions [2].
The process of computer-assisted diagnostics and medical imaging analysis mainly relies on machine learning. The classification task in traditional machine learning methods is carried out in a series of steps, the most important of which are feature extraction, learning, preprocessing, accurate feature selection, and classification. When the features chosen are the main objects that are relied upon for decision-making, these features may be error-prone and unreliable in the process of distinguishing classes. Deep learning allows feature extraction and classification in one shot in contrast to classical machine learning techniques [3]. After the development of machine learning techniques and the emergence of the field of deep learning, deep learning has become one of the adopted methods in the diagnostic process. Despite many machine learning techniques that can be used to analyze medical images in various fields, deep learning has become the state-of-the-art method to analyze and diagnose medical problems due to its accuracy. Deep learning is a part of machine learning. It is based on artificial neural networks called “deep neural networks,” because the structure of a neural network consists of multiple inputs, output, and hidden layers. Deep learning is widely known for its application in many areas, most importantly in the analysis and interpretation of medical images [4] such as breast and skin cancer classification tasks. However, these applications produce low-level accuracy of classification with deep learning due to issues including a lack of training data and model architecture [5]. Considering that deep learning models require a large amount of data to perform well, which are costly and time-consuming to obtain, researchers in the field of medical image analysis suffer because of the difficulty of collecting enough annotated images to train deep learning models [6]. Moreover, given that the majority of medical datasets have few samples, transfer learning is a viable strategy for solving new tasks and making use of well-trained public domain models (e.g., LeNet, Alex-Net, Vgg-16, and ResNet) [7,8], where the obtained knowledge is transferred from the source domain to the target domain. To prevent data insufficiency, fine-tuning a pre-trained neural network on a targeted dataset can substantially improve performance compared to training from scratch [9]. However, this approach has limitations, because the features between the Imagenet source dataset and the target dataset do not match [10]. Numerous obstacles can be encountered in the growth and enhancement of deep learning methods, the most significant of which is imbalanced data, as well as varied types and sources of images. Hence, we summarized studies that employed transfer learning approaches to analyze medical images and discussed the advantages and disadvantages of the approaches used in these studies.
This study aims to review transfer learning approaches, their applications, and problems related to their use. In addition to presenting the issues and challenges related to medical images, this study focuses on future research objectives. This review will benefit new researchers in identifying better approaches to their research. Below is a summary of the most important contributions of this study:
This study focused on the impact of transfer learning methodologies in medical image classification.
This study concentrated on transfer learning approaches using pre-trained models, and we showed the performance of different models.
This review discussed classic and recent convolutional neural network (CNN) models.
This research identified the problems that have been identified in other studies that have been conducted on medical image analysis and suggested remedies for such problems.
The remainder of this work is organized as follows. In Section 2, we conduct a literature evaluation of transfer learning approaches. Pre-trained CNN models are then presented, and their performance is evaluated for transfer learning. In subsection one, we discuss methods for dataset augmentation and data size techniques. In subsection two, we discuss classifier performance and visualization. In Section 3, we discuss the different imaging methods and the problems and limitations of some of them. In Section 4, we show some datasets for several diseases and their details. In Section 5, we identify challenges and issues involved in medical images. In Section 6, we offer suggestions for a possible future direction of research for the challenges that researchers encountered during their study. Finally, in Section 7, we present the conclusions.
2 Transfer learning approaches
In training deep learning models, a shortage of significant volumes of annotated medical images is a major obstacle [7]. Several research studies have used a transfer-learning approach that transfers knowledge from CNN models trained on a large number of images, such as ImageNet, to overcome this challenge. The first layers of the model are locked or adjusted, whereas the last layers are trained on the target dataset. Although the source and target datasets differ, the model extracts low-level features that are often the same when evaluating any image, thus eliminating the requirement for a large dataset to train the model and extract additional features. This technique decreases training time and cost. Transfer learning can be approached in two ways: feature extraction and fine-tuning [11].
2.1 Feature-extracting
This strategy leverages a pre-trained CNN model on a large dataset such as ImageNet as a feature extract for the target task by freezing all layers of the model and replacing the fully connected layers to fit the new task. The feature is extracted using convolutional layers. The data are then passed to the classifier, which consists of fully connected layers replaced by a new task or one of the machine learning classifiers (SVM, K-NN, etc.). Only the new classifier is trained, rather than retraining the entire model [12] (Figure 1). The main advantage of this approach is running the pre-trained model only once on the new data instead of running it once in each training period, so it is much faster. However, this approach does not allow dynamically adjusting the new input data during the training.
![Figure 1
Strategies of transfer learning [112].](/document/doi/10.1515/jisys-2022-0198/asset/graphic/j_jisys-2022-0198_fig_001.jpg)
Strategies of transfer learning [112].
2.2 Fine-tuning
This method works by taking a pre-trained CNN model to unfreeze all or a part of the layers and retraining them on new data [13]. This method can bring improvements to the model by gradually adapting predefined features to new data (Figure 1). This approach allows dynamically adjusting new input data during training, which is required when increasing data through the data augmentation technique (to be discussed in Section 2.1) that we need to solve the problem of lack of training data.
We define several pre-trained CNN models and analyze their structure and performance to determine the best strategy. This component of investigation is critical in the field of medical image interpretation. Models with several layers can be an obstacle in mobile applications, as they require many computational resources and take a long time to train [14]. Such models include AlexNet, VGG Net, GoogLeNet, Dense CNN, and all convolutional models.
All convolutional models are the most widely used DCNN architectures owing to their good performance in many image interpretation and stuff recognition applications. Some designs (such as GoogLeNet and ResNet) were created with large-scale data processing in mind [15]. The following subsections provide an overview of these models:
1. LeNet (1998): LeCun proposed back-propagation-trained CNNs in 1989, with the goal of recognizing handwritten numerals. The structure is known as LeNet5. The LeNet-5 architecture consists of three convolutional layers, two sub-sampling layers, and two fully connected layers. It has 431 K weights and 2.3 M MACs [16].
2. AlexNet (2012): Krizhevsky et al. [17] created AlexNet, a CNN model that was more thorough than its predecessor, LeNet, in 2012. On the ImageNet LSVRC-2010 dataset, this model classified 1,000 picture classes and produced promising results at that time. This model has eight layers: five convolutional layers and three fully connected layers. They have 60 m parameters and 650 k neurons.
3. ZFNet (2013): Zeiler and Fergus created a CNN architecture named ZFNet, which received the 2013 ILSVRC Prize [18]. The ZFNet architecture is a modification of AlexNet because it changes several of its features. To lower the number of weights, ZFNet uses a 7 × 7 size filter instead of an 11 × 11 filter, thereby decreasing the number of network parameters and increasing accuracy.
4. VGGNET (2014): This model was one of the most popular models submitted to ILSVRC-2014 [19]. The models are VGG11, VGG-16, and VGG-19, which have 11, 16, and 19 layers, respectively. The major purpose of varying the number of conv2d layers is to understand better how the depth of convolutional networks affects picture categorization accuracy. VGG-19 is the most computationally intensive, with 138 m weights.
5. GoogLeNet (2014): This network won the ILSVRC 2014 challenge [20]. GoogLeNet featured a total of 22 layers, which is far more than what any other predecessor has. In comparison to its predecessors AlexNet and VGG, GoogLeNet used considerably fewer network parameters. GoogLeNet has 7 m parameters, whereas AlexNet has 60 m and VGG-19 has 138 m. According to GoogLeNet’s estimations, 1.53 G MACs exist.
6. Residual Network (ResNet in 2015): ResNet achieved first place in the 2015 ILSVRC challenge [21]. Kaiming designed ResNet with the goal of establishing a deep network that could solve the vanishing scale problem that plagued prior networks. ResNet is made up of a variety of layers (ResNet34, 50, 101, 152, and 1202). At the end of the ResNet50 network are 49 conv2d layers and one fully connected layer. The total network weights are 25.5 M, with a MAC weight of 3.9 M.
7. DenseNet: In 2017, Gao Huang et al. [15] created the DenseNet, which contains densely connected layers, all of which are associated with one another. As a result, it is known as DenseNet. Given that each layer obtains input from all prior levels and produces its feature mappings as input to all subsequent layers, this method is helpful for feature reuse. DenseNet is made up of two dense blocks and two transition blocks between them.
We report in Table 1 the findings of some researchers who used transfer learning. The VGGNet model was used by many researchers [22,23,24,25,26,27,28], ResNet was used by [24,26,29,30,31], and Inception v3 model was used by ref. [32,33,34,35]. Transfer learning reduces the need for interpretation procedures by transferring deep learning methods with data from a previous process and then fine-tunes them to small data groups for the current task. Most images classification curricula transfer learning from previously trained models (such as LeNet, AlexNet, VGG-16, and ResNet) on Imagenet, which consists of natural images with large numbers of more than 14 million images distributed to 1,000 classes [36], such as objects, animals, and humans to solve Many of the tasks to identify patterns and vision of the computer. For example, applying transfer learning on the Imagenet can improve the performance of these tasks (discover the face, distinguish between animal types, or distinction between the types of flowers), because its features are similar to those in the Imagenet dataset. However, the Imagenet dataset does not contain medical images. Despite the good results in applications for detection and classification of melanoma, breast cancer, and diabetic retinopathy, unverified issues such as the difference in features between the Imagenet source domain and the target domain require further investigation.
Authors’ findings when using transfer learning techniques with pre-trained CNN models
| Ref. | Method | Dataset | Results |
|---|---|---|---|
| Chang et al. [32] | They applied transfer learning to the pre-trained model Inception v3 | BreaKHis | 83% Accuracy for benign and 89% accuracy for malignant |
| Prajapati et al. [25] | They applied transfer learning to the pre-trained model VGG16 | (RVG) X-ray images | 88.4% Accuracy |
| Krishnan et al. [37] | They applied transfer learning to the pre-trained model Inception-ResNet-v2 | Kaggle dataset | The proposed model achieves a kappa score of 76% |
| Liu et al. [35] | They applied transfer learning to the pre-trained model InceptionV3 | M-NBI | Accuracy, sensitivity, and specificity are 98.5, 98.1, and 98.9%, respectively |
| Alsabahi et al. [34] | They applied transfer learning to the pre-trained model Inception V3. | They have 80 DR chest images categorized as normal and 57 DR chest images categorized as abnormal. | 83.3% Accuracy |
| Vesal et al. [33] | They applied transfer learning to the pre-trained model Inception V3 | BACH 2018 | 97.08% Accuracy for four classes |
| Khan et al. [29] | They applied transfer learning to the pre-trained models (GoogLeNet, VGGNet, and ResNet) | Breast microscopic image | 97.52% Accuracy |
| Younis et al. [38] | They applied transfer learning to the pre-trained model MobileNet | HAM10000 | 97% Accuracy, 90% precision, and 91% recall |
| Khalifa et al. [39] | They applied transfer learning to the pre-trained model AlexNet | APTOS 2019 | 97.9% Accuracy |
| Hosny et al. [40] | They applied transfer learning to the pre-trained model Alex-net | MED-NODE | 96.86% Accuracy |
| Hosny et al. [40] | They applied transfer learning to the pre-trained model Alex-net | Derm (IS & Quest) | 97.70% Accuracy |
| Hosny et al. [40] | They applied transfer learning to the pre-trained model Alex-net | ISIC | 95.91% Accuracy |
| Janoria et al. [27] | They applied transfer learning to the pre-trained model VGG- 16 with the K-NN algorithm | ISIC | 99% Accuracy |
| Le et al. [30] | They applied transfer learning to the pre-trained model ResNet50 | HAM10000 | The model achieved 93% average accuracy and precision in the range [0.7, 0.94], which outperformed dermatologists’ accuracy of 84% |
| Rocheteau and Kim [41] | They applied transfer learning to the pre-trained model EfficientNet | ISIC 2020 | AUROC 0.931 and AUPRC 0.84 |
| Sasikala [26] | CNN algorithm with four different transfer learning techniques: AlexNet, VGG16, ResNet50, and ResNet34 | Clinical images collected from Kaggle | Accuracy of 90.12% is achieved when the Lr is decreased to 1 × 10⁻⁶ after 10 epochs |
| Kassem et al. [42] | They applied transfer learning to the pre-trained model GoogleNet | ISIC 2019 | Accuracy 94.92%, sensitivity 79.8%, specificity 97%, and precision 80.36% |
| Kondaveeti and Edupuganti [31] | They applied transfer learning to the pre-trained model ResNet50 | HAM10000 | Accuracy 90%, precision 89%, and recall 90% |
| Jasil and Ulagamuthalvi [22] | They applied transfer learning to the pre-trained models (InceptionV3, VGG16, and VGG19) | ISIC | Accuracy 74% for Inception V3, 77% for VGG16, and 76% for VGG19 |
| El Houby [28] | They applied transfer learning to the pre-trained model VGG16 | Kaggle dataset | Accuracy 86.5% for 2-class, 80.5% for 3-class, 63.5% for 4-class, and 73.7% for 5-class |
| Saber et al. [23] | They applied transfer learning to the pre-trained model VGG16 | MIAS | Specificity 98%, accuracy 96.8%, sensitivity 96%, and area under the curve (AUC) 0.99 |
| Munien and Viriri [43] | They applied transfer learning to the pre-trained model EfficientNet-B2 | ICIAR2018 | Accuracy and sensitivity 98.33% with Reinhard stain normalization and 96.67% with Macenko stain normalization |
| Sellabaskaran et al. [24] | They applied transfer learning to the pre-trained models (VGG19 and ResNet50) | MRI | Accuracy 98% with VGG19 and ResNet50 and 96% with Xception |
2.3 Data augmentation and data size techniques
Deep learning models require an enormous amount of data for the purpose of training the network and producing good results in the classification process, detecting objects, or any task of deep learning applications. This challenge is magnified in the health care field, where the process of collecting images and labeling takes a long time and effort and is sometimes prone to errors. Thus, data augmentation is a great approach to increasing the number of samples in the dataset while preventing overfitting, which is common when training on a model that has a small set of samples [23]. Overfitting is one of the difficulties that affect classification accuracy. By increasing the data, the impact of overfitting can be decreased. Rotating, flipping, cropping, adding noise, and modifying colors are some of the data augmentation techniques [12]. Given the possibility of evaluating the microscopic images of breast cancer from different angles of view without affecting the diagnosis, the data augmentation technique is useful in this case. Data augmentation has been employed in several research studies. As shown in Table 2, several techniques (e.g., rotate, flip, scale, add noise, and modify color) were used to increase the number of their samples in the dataset and overcome overfitting. Moreover, researchers like [38] used data augmentation to balance the dataset. They employed data augmentation for classes with smaller samples than other classes. Furthermore, to generate fresh data, only image alteration (such as flipping, scaling, and rotation) was used, that is, the model trains on the same images, but at a different angle. New images that are different from the original images must be generated to ensure that the model learns new features. This can be done by using generative adversarial network technology [44], which generates fake images that are more like the real ones that are difficult for humans and machines to distinguish between them.
Summary of data augmentation techniques
| Ref. | Dataset | Dataset size before data augmentation | Data augmentation techniques applied | Dataset size after data augmentation |
|---|---|---|---|---|
| Chang et al. [32] | BreaKHis | 1,398 images | 1. 90, 180, and 270° Rotations | 11,184 Images |
| 2. Images mirrored | ||||
| 3. Images distorted at random | ||||
| Hosny et al. [40] | MED-NODE | 170 Images | 1. Random rotation | 12,240 Images |
| 2. A rotation with a fixed step angle of 50° | ||||
| Hosny et al. [40] | Derm (IS & Quest) | 206 Images | 1. Random rotation | 14,832 Images |
| 2. A rotation with a fixed step angle of 50° | ||||
| Hosny et al. [40] | ISIC | 2,000 Images | 1. Random rotation | 144,000 Images |
| 2. A rotation with a fixed step angle of 50° | ||||
| Jasil and Ulagamuthalvi [22] | ISIC | 2,418 Training images | The following techniques are used: shift, zoom, compression, flipping, and changing the lighting style | 2,487 Images |
| Saber et al. [23] | MIAS | 322 Images | 1: 90°, 180°, 270°, and 360° rotations | 2,576 Images |
| 2: Every rotated image is vertically flipped | ||||
| Vesal et al. [33] | BACH 2018 | 11,200 Patches | Horizontal and vertical edges of the extracted patches are flipped | 33,600 Patches |
| Khalifa et al. [39] | APTOS 2019 | 3,662 Images | 1. x-axis reflected | 14,648 Images |
| 2. y-axis reflected | ||||
| 3. x–y axis reflected |
Few published studies have compared performance results while employing different data sizes with and without data augmentation technology such as ref. [45]. As a result, no research has been done to see how the size of the dataset used in several studies affects the outcomes such as ref. [46].
2.4 Classifier performance evaluation and visualization
In this section, we will discuss the measures most commonly used in the current studies to evaluate trained models such as accuracy, recall, precision, F1 score, receiver operator characteristic (ROC) curve, and AUC.
Confusion Matrices: Also known as the error matrix [47], a confusion matrix is a special table-shaped structure that allows the assessment of algorithm performance. Actual cases are represented in each row of the matrix, whereas expected cases are represented in each column. Sometimes, the representation is reversed. Figure 2 shows an example of the basic binary classification confusion matrix. For example, our cases here are positive or negative, where class1 represents positive cases and class2 represents negative cases. Each element of the matrix represents the following:
True Positives (TP): Actual cases were positive, and the predicted cases were positive.
True Negatives (TN): Actual cases were negative, and the predicted cases were negative.
False Positives (FP): Actual cases were negative, and the predicted cases were positive.
False Negatives (FN): Actual cases were positive, and the predicted cases were negative.
![Figure 2
Confusion matrix for two classes [49].](/document/doi/10.1515/jisys-2022-0198/asset/graphic/j_jisys-2022-0198_fig_002.jpg)
Confusion matrix for two classes [49].
The diagonal elements represent the number of actual cases that were correctly forecast, whereas off-diagonal elements are those that have been erroneously predicted by the classifier. The higher the values in the diagonal elements of the confusion matrix, the better, because they indicate many correct predictions [48]. Through the elements of this matrix, the performance measures in deep learning, namely, accuracy, precision, recall (sensitivity), specificity, and F1 score can be determined to evaluate model performance.
Accuracy is calculated by dividing the number of correctly predicted cases by the total number of samples.
Precision is calculated by dividing the number of the cases positive that were correctly predicted by the total of the cases positive that were correctly predicted and the number of the cases positive that were incorrectly predicted. Precision is a useful statistic when a false positive is more of a concern than a false negative.
Recall (Sensitivity) is calculated by dividing the number of the cases positive that were correctly predicted by the total of the cases positive that were correctly predicted and the number of the cases negative that were incorrectly predicted. Recall is a useful statistic when a false negative is more of a concern than a false positive.
Specificity is the ability of the model to identify the negative cases correctly. When all actual negative cases are identified, a model is ideal because it produces no sudden results.
F1 score: When we try to increase the model’s precision, the recall decreases, and vice versa. This measure can be interpreted as an accordant mean of precision and recall, giving an extensive depiction of these two measurements, where an F1 score reaches its best value at 1 and worst at 0.
ROC curve is an evaluation metric for binary classification tasks. It plots the True-Positive Rate against the False-Positive Rate at various threshold settings [50]. The ROC curve measures how accurately the model can distinguish between two things (e.g., whether a type of cancer is benign or malignant). AUC measures the entire two-dimensional region under the ROC curve. This result gives a good idea of how well the model is performing. The higher the AUC, the better the performance of the model (Figure 3).
![Figure 3
Described ROC curve and AUC [51].](/document/doi/10.1515/jisys-2022-0198/asset/graphic/j_jisys-2022-0198_fig_003.jpg)
Described ROC curve and AUC [51].
The confusion matrix is the most extensively used technique in evaluating the effectiveness of classifiers, per our survey of previous research in the field of medical image classification. In melanoma cancer classification, Kassem et al. [42] proposed a deep pre-trained model of unclassified skin cancer images and retrained the last layers of the proposed model on a small number of foot skin images. They obtained 99.03% accuracy, 99.81% recall, 98.7% precision, and a 99.25% F-score. Kondaveeti and Edupuganti [31] used ResNet50, InceptionV3, Xception, and MobileNet models and then trained each neural network for 30 epochs. With ResNet50, they were able to obtain 90% accuracy, 90% recall, and 89% precision. Kassem et al. [42] used transfer learning with the GoogleNet model and used dual learning transfer technology for multi-class classification of skin cancer. They obtained 94.92% accuracy, 79.8% recall, 80.36% precision, and an F1 value of 80.07%. Table 3 reports the results of the classification task for skin cancer. In breast cancer classification, Saber et al. [23] categorized MIAS images into benign, malignant, and normal cases. They applied the freeze and fine-tune strategies to improve the model for the classification of mass lesions. The accuracy of the VGG16 model was 98.96%, the recall was 97.83%, the precision was 97.35%, and the F1 was 97.66%. Sellabaskaran et al. [24] employed three pre-trained models for the classification procedure: VGG19, ResNet50, and Xception. Their results were assessed separately. VGG19 and ResNet50 obtained a higher accuracy of 98%, recall of 98%, precision of 98%, and F1 value of 98%. Munien and Viriri [45] tested seven EfficientNets to see how well they could identify breast cancer photos into four categories. EfficientNet-B2 and Reinhard obtained a higher accuracy of 98.33%, recall of 98.33%, precision of 98.44%, and an F1 value of 98.33%. Table 4 lists all of the outcomes from the breast cancer classification task.
Results of the skin cancer classification task
| Author(s) | Method | Dataset | Accuracy (%) | Recall (%) | Precision (%) | F1 (%) |
|---|---|---|---|---|---|---|
| Alzubaidi et al. [10] | They applied transfer learning to the pre-trained model DCNN | DFU classification task | 99.03 | 99.81 | 98.7 | 99.25 |
| Kondaveeti and Edupuganti [31] | They applied transfer learning to the pre-trained model ResNet50 | HAM10000 | 90 | 90 | 89 | — |
| Kassem et al. [42] | They applied transfer learning to the pre-trained model GoogleNet | ISIC 2019 | 94.92 | 79.8 | 80.36 | 80.07 |
| Hosny et al. [40] | They applied transfer learning to the pre-trained model Alex-net with data augmentation | DermIS DermQuest | 96.86 | 96.90 | 96.92 | — |
| Hosny et al. [40] | They applied transfer learning to the pre-trained model Alex-net with data augmentation | MED-NODE | 97.70 | 97.34 | 97.93 | — |
| Hosny et al. [40] | They applied transfer learning to the pre-trained model Alex-net with data augmentation | ISIC | 95.91 | 88.47 | 92.34 | — |
| Le et al. [30] | They applied transfer learning to the pre-trained model ResNet50 | HAM10000 | 93.00 | 86 | 88 | 84 |
| Janoria et al. [27] | They applied transfer learning to the pre-trained model VGG16 + KNN | ISIC | 99.9 | — | — | — |
Results of the breast cancer classification task
| Author(s) | Method | Dataset | Accuracy (%) | Recall (%) | Precision (%) | F1 (%) |
|---|---|---|---|---|---|---|
| Saber et al. [23] | They applied transfer learning to the pre-trained model VGG-16 | MIAS | 98.96 | 97.83 | 97.35 | 97.66 |
| Sellabaskaran et al. [24] | They applied transfer learning to the pre-trained models VGG19 and ResNet50 | MRI images of breast | 98 | 98 | 98 | 98 |
| Munien and Viriri [43] | They applied transfer learning to the pre-trained model EfficientNet-B2 + Reinhard | ICIAR2018 | 98.33 | 98.33 | 98.44 | 98.33 |
| Shallu and Mehra [54] | They applied transfer learning to the pre-trained model VGG 16 + LR | BreakHis | 92.6 | 93 | 93 | 93 |
| Boumaraf et al. [55] | They applied transfer learning to the pre-trained model ResNet-18 | BreaKHis | 98.42 | 99.01 | 98.75 | 98.88 |
| Hassan et al. [56] | They applied transfer learning to the pre-trained model AlexNet | CBIS-DDSM, INbreast and MIAS | 98.29 | 97.82 | 98.76 | 98.27 |
DeVries et al. [52] conducted a recent study that proved using the AUC when evaluating the performance of a model trained on an imbalanced dataset was useless due to bias. Instead, they concluded that the use of the F1 score for imbalanced datasets with a higher percentage of true negative cases compared to positive cases, as it is likely to provide a reliable performance assessment given their reliance on the positive forecast ratio. Future work can examine previously published models that use the AUC and assess their efficiency by comparing the model’s performance with an F1 score.
The studies we surveyed contained only a few attempts to investigate the visualization of the CNN model and to understand how CNN operates and makes predictions and decisions; this is an important research gap that deserves attention. Borjali et al. [53] used two different methods of visualization to represent the two basic levels of the network (CNN classification and CNN feature extraction). Convolution layer filters using the maximum activation approach show the workings of the CNN architecture to gain a better visualization and understanding of the CNN. By visualizing these filters, we can explain whether CNN is looking for good features. Unrecognizable filters indicate problems with CNN’s structure or that training was poorly done.
3 Medical images
A series of scales are used to obtain an image. Radiation absorption in X-ray imaging, sound pressure in ultrasound, and radio frequency signal capacity in magnetic resonance imaging are examples of these scales. Each image point is measured in a digital image by one measurement, and multiple measurements are collected in multi-channel images [57]. Many imaging techniques are used to produce medical images, such as X-rays, computed tomography, magnetic resonance imaging, ultrasound, flexible imaging, and optical imaging [58].
The type of technique used in imaging a specific disease is determined by the location of the disease in relation to the patient’s body that the doctor or radiologist needs to show on the image, the accuracy of the type of imaging used to produce accurate results for disease detection and classification, and the type of imaging that is comfortable for the patient (e.g., non-surgical intervention and an inexpensive type of imaging). Medical imaging techniques are of great importance in early diagnosis, as medical imaging is sometimes the main step in preventing the spread of disease through advanced imaging techniques. Moreover, early diagnosis helps treat or eliminate many disease conditions.
We noted in our study that digital dermoscopy is the dominant type and the most commonly used technique for imaging skin disease. It is among the most successful methods for classifying malignant skin tumors, according to our review of previous studies (Figure 4) [10,22,26,27,30,31,38,40,41,42,59,60]. Researchers have faced many issues and challenges in the imaging of skin debridement, such as light reflections on the disease area, lighting contrast, different skin tone of the skin, as well as hair coverage of the disease area [59]. These challenges require the selection of good methods for pre-processing the image. For imaging breast cancer, microscopy has been the common type of imaging in many studies [10,29,32,33,43,61,62]. Challenges have been encountered with histological images, such as the large variability between histological images of the same cancer subtype. Such variability can lead to inaccurate results when using traditional algorithms like machine learning algorithms for multi-classification, which require advanced methods and significant computing power [63]. Some studies have used chest X-rays [23], although experts have recommended limiting the use of chest X-rays, according to the National Comprehensive Cancer Network guidelines [64]. Some studies have used MRI as a non-invasive and low-contrast tool [24], although it is not generally recommended for pregnant women [65]. Iranmakani et al. [66] summarized the imaging techniques used for the detection task of breast cancer. However, they did not highlight microscopic imaging despite its popularity in several recent studies. Phankokkruad utilized microscopy images to classify lung cancer [67], whereas computed tomography (CT) imaging technology was employed in several studies [68,69,70]. To classify gastric cancer, endoscopy was the most common imaging technique according to our survey [71,72]. To classify diabetic retinopathy, fundus imaging was used [28,39,37,73]. For the classification of brain tumors, MRI was the most frequently used technique [74,75,76].
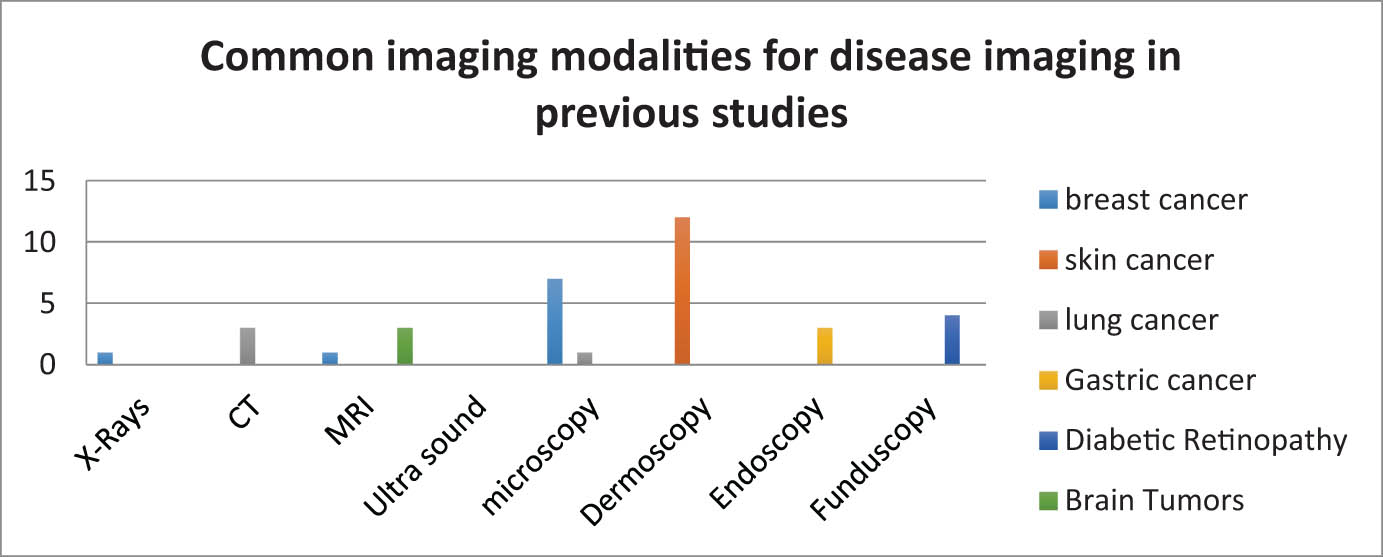
Common imaging modalities for disease imaging in previous studies.
4 Datasets
Oxford Dictionary [77] defines dataset as a collection of data that a computer treats as a single entity. Thus, a dataset can include many different types of data and still be utilized to train a method to identify predictable patterns throughout the entire dataset. Data comprise a major element of any artificial intelligence system. In many ways, data are the real reason for machine learning’s popularity. We can examine patterns and discover trends and make judgments on the basis of a dataset if the amount of data is enough.
A pre-processed dataset is separated into several parts of data for training, testing, and validation (Figure 5). These steps are necessary to assess the quality of the model. Hence, the test dataset is kept separate from the rest of the data. Although validation data are not mandatory, validation data help prevent the model from being trained on the same type of data, which causes biased predictions. To train the model effectively, a massive amount of data are necessary. However, the model may become over-trained (overfitting) [78].
This section includes details of some of the different pathological datasets used in the classification studies of skin cancer, breast cancer, and diabetic retinopathy. The “HAM10000,” “ISIC,” “Derm Quest,” “DermIS,” and “MED-NODE” datasets were among the available datasets used to classify melanoma, as shown in Table 5. Several datasets have been used for breast cancer classification, including “ICIAR 2018,” “BreakHis,” “MIAS,” “IDC,” and “BreCaHAD” (Table 7). The “APTOS 2019” and “EyePACS” datasets were utilized to classify diabetic retinopathy (Table 8).
Skin cancer datasets
| Dataset | No. of samples | No. of classes | Used by | Reference |
|---|---|---|---|---|
| HAM10000 | 10,015 | Seven | [30,31,38,59,60] | [86] |
| ISIC2016 | 1,279 | Two | — | [87] |
| ISIC2017 | 2,750 | Three | [27] | [87] |
| ISIC2018 | 12,594 | Seven | [22] | [87] |
| ISIC2019 | 25,331 | Eight | [42] | [87] |
| ISIC2020 | 33,126 | Two | [41] | [87] |
| DermQuest | 137 | Two | [40] | [88] |
| DermIS | 206 | Two | [40] | [89] |
| MED-NODE | 170 | Two | [40] | [90] |
![Figure 5
Splitting the entire dataset into training, validation, and test sets [78].](/document/doi/10.1515/jisys-2022-0198/asset/graphic/j_jisys-2022-0198_fig_005.jpg)
Splitting the entire dataset into training, validation, and test sets [78].
4.1 HAM10000 dataset
This dataset [79] contained 10,015 dermatoscopic images collected from two different locations over 20 years: the Department of Dermatology at the Medical University of Vienna, Austria, and Cliff Rosendahl’s skin cancer practice in Queensland, Australia. This dataset included 6,705 images for melanocytic nevi, 1,113 images for melanoma, 1,099 images for benign keratosis-like lesions, 514 images for basal cell carcinoma, 327 images for actinic keratoses, 142 images for vascular lesions, and 115 images for dermatofibroma. This dataset suffers from imbalanced classes, as some classes contain very few images compared with the rest of the classes [80] (Figure 6). Hence, the researchers solved this problem by using data augmentation, and a few of them balanced datasets according to the minimum number of classes. However, this technique is not ideal, because many images are discarded in the training process.
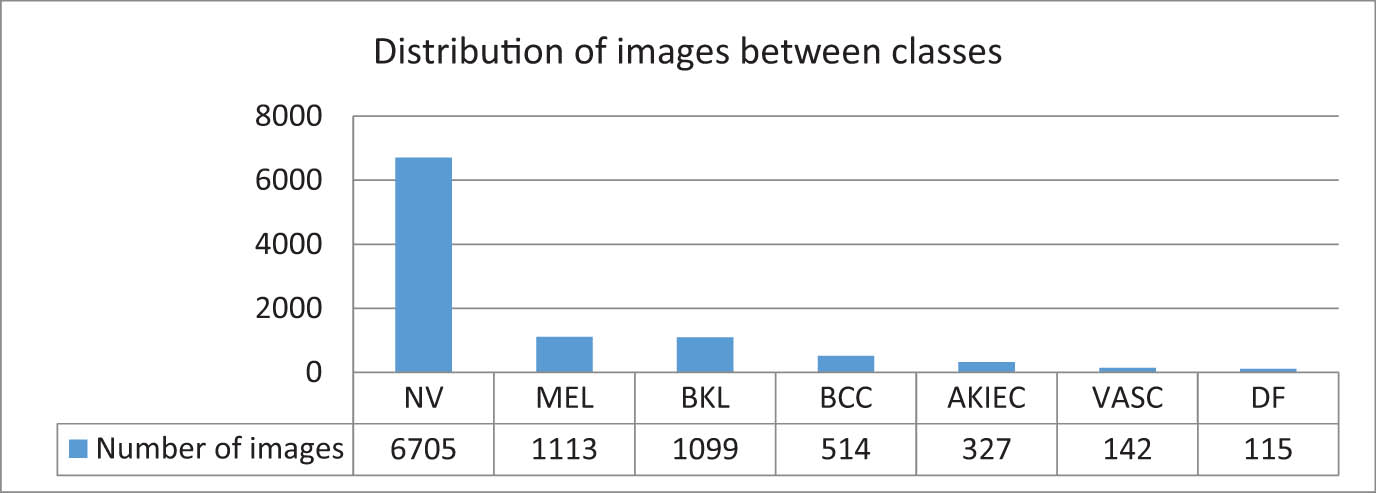
Distribution images of HAM10000 between classes.
4.2 ISIC archive datasets
The ISIC archive [81] is a dataset of skin cancer images from over the world. The International Skin Imaging Collaboration first posted the ISIC dataset (called ISIC2016) during the International Symposium on Biomedical Imaging venture 2016 [82]. Training and testing are the two components in the ISIC2016 dataset. This dataset contains 900 images for training and 379 images for testing, including two classes: malignant and benign nevi. Malignant lesions make up about 30% of all the images in the collection, and the rest fall under the benign nevi class. ISIC2017 dataset includes three classes of images: melanomas, seborrheic keratoses (SK), and benign nevi. This dataset contained 2,000 training images split into 374 melanomas, 254 SK images, and 1,372 benign nevi images; 150 validation images split into 30 melanoma images, 42 SK images, and 78 benign nevi images; and 600 testing images split into 117 melanoma images, 90 SK images, and 393 benign nevi images. ISIC2018 database is a large-scale dataset of dermoscopy images that contain 2,594 training images for task1 and 10,015 training images for task3. ISIC2019 dataset contains 25,331 training images of dermoscopy images divided into eight classes such as melanoma, melanocytic nevus, BCC, AK, benign keratosis, dermatofibroma, vascular lesion, and SCC. ISIC2020 dataset consists of 33,126 samples of dermatoscopy benign and malignant skin lesions gathered from over 2,000 patients. The ISIC archive dataset has limitations such as noise, color labels on the skin, blurred images, and the presence of moles or hair adjacent to the area of disease. Moreover, most cases in datasets belong to light-skinned individuals rather than dark-skinned people (Figure 7).
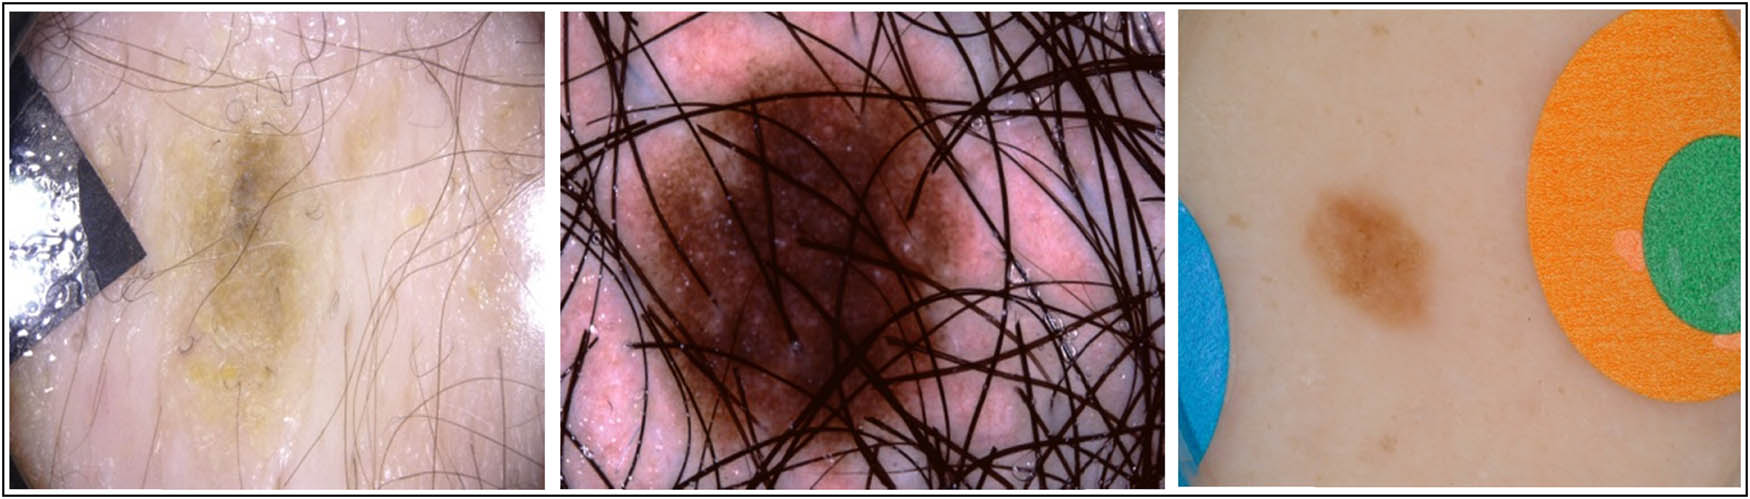
Examples of limitations in the ISIC archive dataset.
4.3 DermQuest dataset
This dataset [82] contains 137 dermoscopy images divided into two classes: melanoma class contains 76 images and nevus class contains 61 images. The limitation of this dataset is the presence of low-quality images in the two classes [83]. In 2018, this dataset was redirected to Derm101. However, on December 31, 2019, this dataset was disabled.
4.4 DermIS dataset
This dataset [84] consists of 206 dermoscopic images split into two classes: melanoma class which includes 119 images and non-melanoma class which includes 87 images. The images are in the RGB color system. The limitation of this dataset is that the dataset size is very small and contains multiple image sizes.
4.5 MED-NODE dataset
This dataset [85] contains 170 dermoscopic images from the digital image archive of the Department of Dermatology of the University Medical Center Groningen. It is split into two classes: melanoma class which includes 70 images and nevus class which includes 100 images. The limitation in this dataset is the small number of images as well as their imbalance.
4.6 BACH2018 dataset
The BACH2018 Challenge has made two labeled training datasets accessible to registered participants. The first dataset includes microscope images that have been annotated by two expert pathologists from IPATTIMUP and IPATTIMUP (I3S). The second set of images includes both annotated and unannotated WSI images. Annotations were completed by a pathologist for the WSI and then corrected by a second expert. The microscope dataset includes 400 training and 100 test images, which are equally divided into four types: 100 images for normal, 100 images for benign, 100 images for in situ carcinoma, and 100 images for invasive carcinoma (Figure 8) [91]. The images are uncompressed and in high-resolution mode (2,040 × 1,536 pixels) in addition to the variety of colors in the images.
![Figure 8
Samples from the BACH2018 dataset [91]. (a) Normal, (b) benign, (c) in situ, and (d) invasive.](/document/doi/10.1515/jisys-2022-0198/asset/graphic/j_jisys-2022-0198_fig_008.jpg)
Samples from the BACH2018 dataset [91]. (a) Normal, (b) benign, (c) in situ, and (d) invasive.
4.7 BreakHis dataset
This dataset contains 7,909 images split into two classes: benign class which includes 2,440 images and malignant class which includes 5,429 images. The images were collected from 82 patients and magnified 40×, 100×, 200×, and 400×. Table 6 shows images with a magnification factor of 400×. Each class has four subclasses: benign class includes Adenosis (A), Fibroadenoma (F), Tubular Adenoma (TA), and Phyllodes Tumor (PT); and the malignant class includes Ductal Carcinoma (DC), Lobular Carcinoma (LC), Mucinous Carcinoma (MC), and Papillary Carcinoma [92]. This dataset suffers from imbalanced classes.
Distribution of the BreaKHis dataset by class and magnification factor [92]
| Classes | Subclasses | Number of patients | Magnification factors | Total | |||
|---|---|---|---|---|---|---|---|
| 40× | 100× | 200× | 400× | ||||
| Benign | A | 4 | 114 | 113 | 111 | 106 | 444 |
| F | 10 | 253 | 260 | 264 | 237 | 1,014 | |
| TA | 3 | 109 | 121 | 108 | 115 | 453 | |
| PT | 7 | 149 | 150 | 140 | 130 | 569 | |
| Malignant | DC | 38 | 864 | 903 | 896 | 788 | 3,451 |
| LC | 5 | 156 | 170 | 163 | 137 | 626 | |
| MC | 9 | 205 | 222 | 196 | 169 | 792 | |
| PC | 6 | 145 | 142 | 135 | 138 | 560 | |
| Total | 82 | 1,995 | 2,081 | 2,013 | 1,820 | 7,909 | |
4.8 MIAS dataset
This is a digitized mammography dataset that was created in 1994 by the Mammographic Image Analysis society. The dataset contains 322 mammogram images. The size of all images is 1,024 × 1,024 (Figure 9) [93]. The dataset is small and features noise and low-resolution images.
![Figure 9
Mammography images from the MIAS dataset [113].](/document/doi/10.1515/jisys-2022-0198/asset/graphic/j_jisys-2022-0198_fig_009.jpg)
Mammography images from the MIAS dataset [113].
4.9 IDC dataset
This dataset contains of 277,524 patches of size 50 × 50 derived from 162 H&E-stained breast histopathology samples split into two classes: negative class includes 198,738 samples and positive class includes 78,786 samples. This dataset is highly imbalanced.
4.10 BreCaHAD dataset
This dataset contains 162 images of breast cancer histopathology images that each measures 1,360 × 1,024 pixels. The task of this dataset is to classify histological structures in this (H&E)-stained images into six classes, namely, mitosis, apoptosis, tumor nuclei, non-tumor nuclei, tubule, and non-tubule [94]. This dataset contains a very small amount of images.
4.11 APTOS 2019 dataset
The Asia Pacific Tele-Ophthalmology Society (APTOS) 2019 dataset for detecting Diabetic Retinopathy in retinal images is now publically available on Kaggle. This picture collection contains 3,662 samples that have been classified into five categories by specialist physicians at Aravind Eye Hospital in India: Negative DR, Mild DR, Moderate DR, Proliferative DR, and Severe DR (Figure 10) [102]. This dataset has limitations such as size difference, information redundancy, and data imbalance.
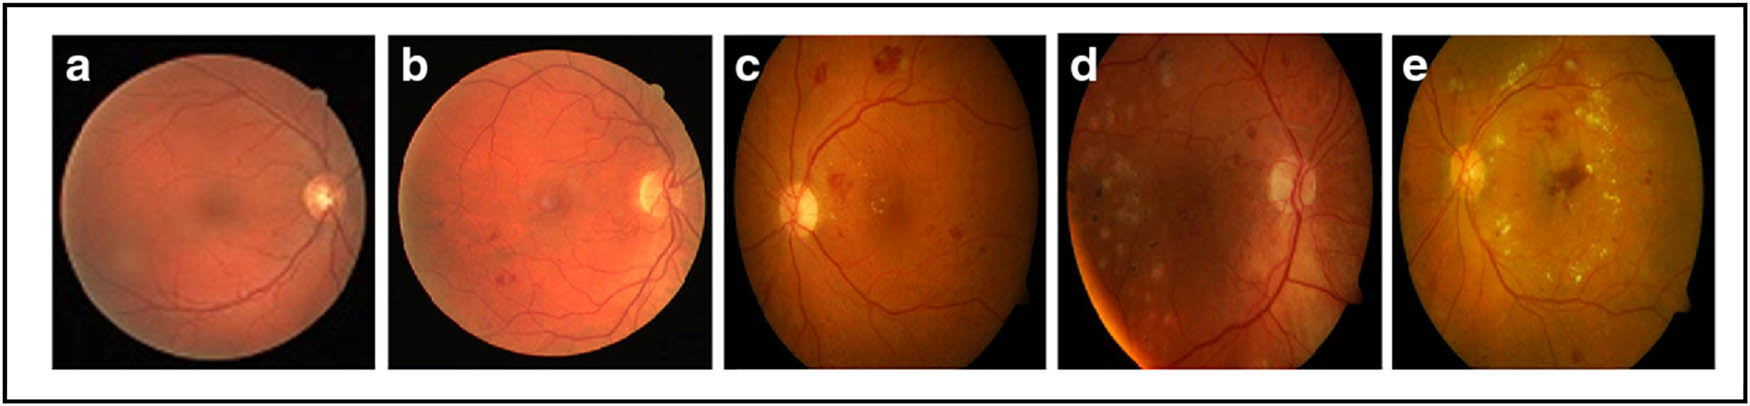
Images from the APTOS 2019 dataset. (a) Normal image, (b) mild DR, (c) moderate DR, (d) severe DR, and (e) proliferative DR.
4.12 EyePACS dataset
EyePACS is the publicly available dataset for detecting diabetic retinopathy. This dataset contains 88,702 retinal fundus images and is approved by the California Healthcare Foundation. According to the severity of DR, fundus images are graded as normal, mild non-proliferative DR, moderate non-proliferative DR, severe non-proliferative DR, severe non-proliferative DR, and proliferative DR [103]. The images are from various camera models and sizes, which can affect how the left and right sides appear. The dataset is imbalanced because normal images with the label “0” represent a huge class, whereas PDR images only comprise a small percentage of the images in the dataset.
In this review, the most commonly utilized dataset for skin cancer classification was HAM10000, followed by SICI, DermQuest, DermIS, and MED-NODE (Figure 11). BACH2018 was the most widely used dataset for breast cancer classification, with BreakHis coming in second followed by MIAS, IDC, and BreCaHAD (Figure 12). The APTOS 2019 dataset was the most commonly utilized dataset in prior studies to classify diabetic retinopathy (Figure 13). The URL links for each set in the tables provide access to all of the datasets indicated (Tables 5, 7 and 8).
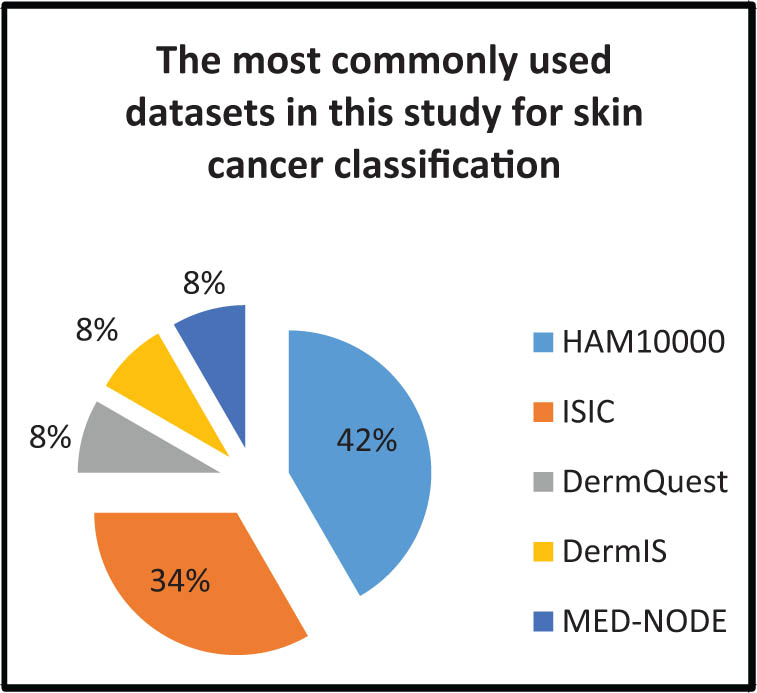
Most commonly used datasets in this study for skin cancer classification.
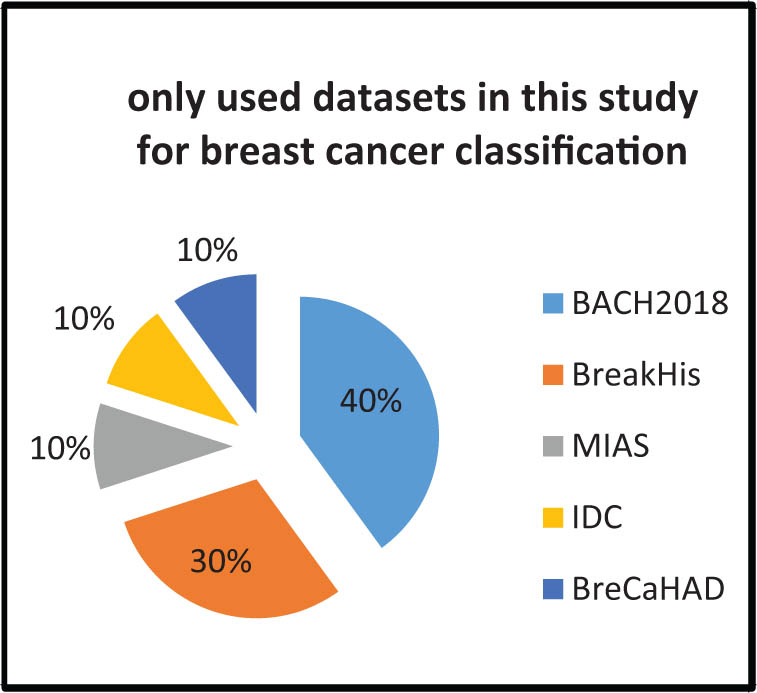
Most commonly used datasets in this study for breast cancer classification.
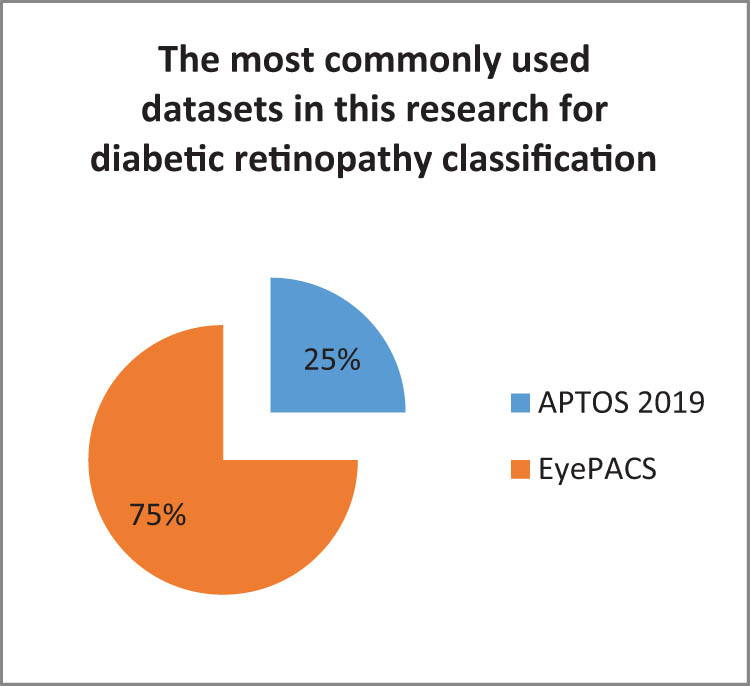
Most commonly used datasets in this research for diabetic retinopathy classification.
5 Issues and challenges of medical images
Despite the positive findings of previous studies, deep learning approaches to the diagnosis and classification of cancers continue to have difficulties, especially in medical imaging. This section identified a review of some of the main issues and challenges of medical images:
Large training datasets are required to train deep learning models [106], which is a huge difficulty, especially in medical imaging. The strength of deep learning classifier performance depends on the amount of training data, so lack of data is one of the major problems preventing deep learning models from performing well in medical imaging.
Labeling medical data takes a significant amount of time and work, especially if the amount of data is large, making it prone to human mistakes [10]. As a result, collecting labeled medical images in large numbers is a difficult task.
The great diversity of data is one of the key challenges facing researchers in processing medical images [107]. The greater the diversity of data, the greater the need for more such data to ensure that the model learns well and avoids model bias.
Unlike personally evaluating a place with a biopsy or another procedure, medical imaging is non-invasive. Compared with manual verification procedures, imaging will always be less accurate in detection. Something appearing benign may actually be malignant; something normal may appear abnormal, and vice versa.
Another difficulty in developing deep learning models is the imbalance between classes within a dataset; thus, images in one class may not contain as many samples as images in other classes, resulting in a bias toward one class over the other [108].
Datasets containing dermoscopy images have disadvantages, and these defects can be attributed to the diversity of images because of their collection from several sources and because of the poor use of imaging. Other problems are the difference in the color of human skin, as well as the presence of colorful labels on the body near the area of interest, the presence of dense hair, the variety of lighting, and the reflection of light on the body [80]. These obstacles pose a challenge in determining the location and type of disease.
Several attempts have been made to solve these challenges, and Table 9 summarizes them.
Challenges and the research’s recommendations for future studies
| Authors | Problem | Method used | Challenge |
|---|---|---|---|
| Ahmad et al. [109] | Despite the remarkable results of deep learning models, it has limitations because it needs huge amounts of training data to provide significant computational power | With the advent of contemporary GPUs, the issue of high computing requirements has been largely overcome. However, gathering vast amounts of training data is still time-consuming. This problem was solved by using the data augmentation party by making duplicates of the image through reflection and rotation | They cut images into patches at small volumes as a way to increase data. This process may lose some important information needed to diagnose the disease, so we suggest changing the size of images only and using data augmentation technology for the purpose of increasing the amount of data and overcoming data shortage |
| Kassani and Kassani [110] | The first challenge was to contradict the color variation of the images in the dataset they used | They normalized all images in the dataset that they used to improve color variation. To solve the problem of not having enough training data, they used data augmentation techniques | The accuracy of their model classification can be increased by using new ways to normalize spots better |
| Second, the dataset used did not contain sufficient images | |||
| Khan et al. [29] | The complex structure of the shape and appearance of cancer cells made them difficult to interpret and manually understand microscopic images. Hence, the interpretation takes a significant amount of time and requires advanced experience | They used three different CNN structures such as GoogLeNet, VGGNet, and ResNet to extract features from tissue images of breast cancer, which were then combined using learning transfer technology to increase classification accuracy. They used data augmentation techniques to increase the number of training data | They did not try to use the handcrafted features as well as the CNN features to further improve the classifier |
| Singh et al. [111] | The data were extremely imbalanced | They used TL with VGG-19, and the model was supplemented with different classification methods in the output layer by extracting the features from each block and inserting them through the classifier | They did not try to use data augmentation or different weights for each class to solve the problem of imbalance between classes |
| Munien and Viriri [43] | The amount of labeled data to train CNNs is not enough to categorize medical images because of the high expense of labeling images and the difficulties of doing so. Deep CNNs that performed well in applications like ImageNet struggle to prevent overfitting on these datasets | They employed “EfficientNet” lightweight structures, which take up much less space and training time and prevent overfitting | To reduce the presence of large numbers of classified images, transport learning can be used by conducting two-stage transport learning. Many unlabeled medical images can be utilized by collecting large quantities of them then training on these images as a source domain, and re-training the model on a few images classified as a target domain |
| Hosny et al. [40] | Researchers lacked annotated medical images for training purposes. Small amounts of classified images can be found in some databases, such as ISIC 2017, MED-NODE, and DermQuest | To increase the number of training images required to train their model, they used only data augmentation strategies | A simpler, less complex model can be tried and trained from scratch on unlabeled medical images available in large quantities in many datasets, after which transport learning is used to adjust the model to the specific dataset (target) |
| Le et al. [30] | They ran into the imbalance challenge of the HAM10000 dataset | To address the imbalance between classes, they give different weights to each class by giving high weights to the minority group and less weight to the majority group | This work is still limited in certain ways. The model can be improved by trying to remove artifacts that cause data biases and experimenting with expanding the dataset to include both dermoscopy and clinical imagery |
| Ali et al. [59] | The HAM10000 dataset has limitations such as noise, color labels on the skin, blurred images, poor image variation, and the presence of moles or hair adjacent to the area of disease | These images were manually extracted from the dataset | Many images have such issues in the dataset, so obtaining better evaluation performance is a big challenge. Pre-processing methods for images that include such problems can be used instead of manually excluding them from the dataset |
| Younis et al. [38] | They experienced difficulty in effectively training the model due to the imbalanced distribution among classes, as well as the increased rate of loss | To balance the classes in the dataset, they increased data for minority groups | Their model requires further improvement by adding a pre-processing step for images before training the model on them |
6 Research proposals for potential future directions
Many researchers have tried a variety of approaches to address these issues, but despite their promising results, their works have limitations. Also, transfer learning techniques can be used for other medical images such as CT and X-ray images in COVID cases [114,115,116,117,118,119,120]. Hence, we have proposed solutions for future research directions, which we summarize in Table 9. These suggestions will be useful for new researchers in determining the direction of their future works.
Several studies in the task of classifying breast cancer have sliced the images into patches of small sizes as a way to augment the data, where some cells are split between adjacent patches, and these cut cells cause misclassifications in the detection results. Also, there is no guarantee that the small patches contain enough information for the correct class; therefore, we suggest just resizing the images and using data augmentation technology for the purpose of increasing the amount of data and overcoming the problem of data shortage.
Some studies did not address the problem of data imbalance, and others used under sampling, which may cause the exclusion of some images that contain important information. This, we suggest using the technique of data augmentation to apply it to the classes with a limited number for balancing the classes.
During our review of previous studies, we found that all researchers using the transfer learning approach used pre-trained models on the imagenet dataset as the source and performed micro-adjustment of the classifier on the images of the target task. There are limitations in this approach due to the field mismatch between the natural images from the imagenet and the medical images. So we suggest retraining the last custom layers by extracting features specific to the target task and keeping the base layers as generic feature extractors, to solve the domain mismatch problem.
During related works, we noted the use of pre-trained deep models such as (Inceptionv3, InceptionResNetV2, and VGGnet) in many studies. It is not necessary for deep models to perform better; light models can perform well if they are well-tuned (such as MobileNet, MobileNetV2, EfficientNetB0, and Xception).
The data augmentation techniques were the common solution to the overfinding problem in many previous studies. We suggest adding a dropout layer after the hidden layer and adjusting the learning rate which can help avoid this problem.
Most studies use accuracy to evaluate their models, the accuracy scale alone is not sufficient to evaluate the model, so other measures such as precision, recall, and F1 score, in addition to the specificity score, can be used to evaluate models; because it is not feasible to use a low specificity for diagnosis, many people without the disease will show positive results and potentially receive unnecessary diagnostic procedures.
7 Conclusion
Medical image analysis is a wide and important field that requires substantial verification. The main problem was the lack of labeled medical images where deep learning models require large numbers of labeled images to train the model well. Therefore, in this study, we prepared a general review presenting the methodologies used to analyze medical images. The concept of transfer learning from pre-trained models such as VGGNet, ResNet, and Inception v3 has been used markedly in studies to overcome the problem of lack of medical images where transfer learning requires limited amounts of medical data for training. Despite the good results of previous studies, we have noted the selection of pre-trained CNN models on ImageNet in many studies to solve the problem of lack of medical images. Nonetheless, many labeled medical images can be used to train a lightweight model, and this model can be fine-tuned on the labeled images available in limited quantities instead of using models trained on non-medical images. For data augmentation methods, only the image modification methods (such as rotation, flipping, zooming, and coloring) were used to generate images from the original image. This method was not very useful, because the augmentation is done on the same original images; thus, the model will train on the same data. We also identified imaging methods used for some diseases and explained some of the benefits and problems that result from them. All datasets used in the research that we conducted the study were included, and we showed the number of samples for each of them and the download location to download the dataset directly. Finally, we have reviewed the current challenges in the field of analysis of medical images, the ways used to solve them, and our own suggestions to solve such problems. We seek to make this study a reference for new researchers in this field.
-
Conflict of interest: The authors declare that there is no conflict of interest.
References
[1] Marsch LA, Gustafson DH. The role of technology in health care innovation: A commentary. J Dual Diagn. 2013;9(1):101–3. 10.1080/15504263.2012.750105.Suche in Google Scholar PubMed PubMed Central
[2] Zhang Y, Gorriz JM, Dong Z. Deep learning in medical image analysis. J Imaging. 2021;7(4):230–2. 10.3390/jimaging7040074.Suche in Google Scholar PubMed PubMed Central
[3] Lecun Y, Bengio Y, Hinton G. Deep learning. Nature. 2015;521(7553):436–44. 10.1038/nature14539.Suche in Google Scholar PubMed
[4] Lee JG, Jun S, Cho YW, Lee H, Kim GB, Seo JB, et al. Deep learning in medical imaging: General overview. Korean J Radiol. 2017;18(4):570–84. 10.3348/kjr.2017.18.4.570.Suche in Google Scholar PubMed PubMed Central
[5] Nguyen CP, Hoang Vo A, Nguyen BT. Breast cancer histology image classification using deep learning. Proceedings – 2019 19th International Symposium on Communications and Information Technologies, ISC; 2019. p. 366–70. 10.1109/ISCIT.2019.8905196.Suche in Google Scholar
[6] Yamashita R, Nishio M, Do RK, Togashi K. Convolutional neural networks: An overview and application in radiology. Vol. 195. Vienna, Austria:Springer; 2018. p. 21–30. 10.1007/s13244-018-0639-9.Suche in Google Scholar PubMed PubMed Central
[7] Zhou S, Zhang X, Zhang R. Identifying cardiomegaly in ChestX-ray8 using transfer learning. Stud Health Technol Inf. 2019;264:482–6. 10.3233/SHTI190268.Suche in Google Scholar PubMed
[8] Sharma S, Mehra R. Conventional machine learning and deep learning approach for multi-classification of breast cancer histopathology images–a comparative insight. J Digit Imaging. 2020;33(3):632–54. 10.1007/s10278-019-00307-y.Suche in Google Scholar PubMed PubMed Central
[9] Wang J, Chen Y, Hao S, Feng W, Shen Z. Balanced distribution adaptation for transfer learning. Proceedings – IEEE International of Conference of Data Mining, ICDM. 2017, 2017. p. 1129–34. 10.1109/ICDM.2017.150.Suche in Google Scholar
[10] Alzubaidi L, Al-Amidie M, Al-Asadi A, Humaidi AJ, Al-Shamma O, Fadhel MA, et al. Novel transfer learning approach for medical imaging with limited labeled data. Cancers (Basel). 2021;13(7):1–22. 10.3390/cancers13071590.Suche in Google Scholar PubMed PubMed Central
[11] Amin Morid M, Borjali A, Del Fiol G. A scoping review of transfer learning research on medical image analysis using ImageNet. Amsterdam: Elsevier; 2020. doi:10.1016/j.compbiomed.2020.104115.10.1016/j.compbiomed.2020.104115Suche in Google Scholar PubMed
[12] Al Hadhrami E, Al Mufti M, Taha B, Werghi N. Transfer learning with convolutional neural networks for moving target classification with micro-Doppler radar spectrograms. 2018 International Conference on Artificial Intelligence Big Data, ICAIBD, 2019 no. July; 2018. p. 148–54. 10.1109/ICAIBD.2018.8396184.Suche in Google Scholar
[13] Kensert A, Harrison PJ, Spjuth O. Transfer learning with deep convolutional neural networks for classifying cellular morphological changes. SLAS Discov. 2019;24(4):466–75. 10.1177/2472555218818756.Suche in Google Scholar PubMed PubMed Central
[14] Raghu M, Zhang C, Kleinberg J, Bengio S. Transfusion: Understanding transfer learning for medical imaging. Adv Neural Inf Process Syst. 2019;32:3347–57.Suche in Google Scholar
[15] Huang G, Liu Z, Van Der Maaten L, Weinberger KQ. Densely connected convolutional networks. In Proceedings of the IEEE conference on computer vision and pattern recognition, 2017, pp. 4700–810.1109/CVPR.2017.243Suche in Google Scholar
[16] Lecun Y, Bottou L, Bengio Y, Ha P. Gradient-based learning applied to document recognition. Proc IEEE. 1998 Nov;86(11):2278–324.10.1109/5.726791Suche in Google Scholar
[17] Krizhevsky A, Sutskever I, Hinton GE. ImageNet classification with deep convolutional neural networks. In Proceedings of the Neural Information Processing Systems. Lake Tahoe, NV, USA, 3–6 December 2012; p. 1097–105.10.1145/3065386Suche in Google Scholar
[18] Zeiler MD, Fergus R. Visualizing and understanding convolutional networks. Lect Notes Comput Sci (including Subser Lect Notes Artif Intell Lect Notes Bioinforma). 2014;8689:818–33. 10.1007/978-3-319-10590-1_53.Suche in Google Scholar
[19] Simonyan K, Zisserman A. Very deep convolutional networks for large-scale image recognition. 3rd International Conference on Learning Representations, ICLR 2015 – Conference Track Proceedings; 2015. p. 1–14.Suche in Google Scholar
[20] Szegedy C, Liu W, Jia Y, Sermanet P, Reed S, Anguelov D, et al. Going deeper with convolutions. IEEE Computer Society Conference on Computer Vision and Pattern Recognition 07–12-June; 2015. p. 1–9. 10.1109/CVPR.2015.7298594.Suche in Google Scholar
[21] He K, Sun J. Deep residual learning for image recognition. Las Vegas, NV, USA: IEEE Computer Society; 2016. p. 1–9. 10.1109/CVPR.2016.90.Suche in Google Scholar
[22] Jasil SPG, Ulagamuthalvi V. Deep learning architecture using transfer learning for classification of skin lesions. J Ambient Intell Humaniz Comput. 2021;0123456789. 10.1007/s12652-021-03062-7.Suche in Google Scholar
[23] Saber A, Sakr M, Abo-Seida OM, Keshk A, Chen H. A novel deep-learning model for automatic detection and classification of breast cancer using the transfer-learning technique. IEEE Access. 2021;9:71194–209. 10.1109/ACCESS.2021.3079204.Suche in Google Scholar
[24] Sellabaskaran LN, Nirmala S, Rajini S, Sugirtha N, Selvaraj R. Breast cancer detection with transfer learning technique in convolutional neural networks. Washington, DC, USA: IEEE; September, 2021.Suche in Google Scholar
[25] Prajapati SA, Nagaraj R, Mitra S. Classification of dental diseases using CNN and transfer learning. 5th International Symposium on Computational and Business Intelligence ISCBI; 2017. p. 70–4. 10.1109/ISCBI.2017.8053547.Suche in Google Scholar
[26] Sasikala S. Towards improving skin cancer detection using transfer learning. Biosci Biotechnol Res Commun. 2020;13(11):55–60. 10.21786/bbrc/13.11/13.Suche in Google Scholar
[27] Janoria H, Minj J, Patre P. Classification of Skin Disease from Skin images using Transfer Learning Technique , in 2020 4th International Conference on Electronics, Communication and Aerospace Technology (ICECA); 2020, pp. 888–95.10.1109/ICECA49313.2020.9297567.Suche in Google Scholar
[28] El Houby EMF. Using transfer learning for diabetic retinopathy stage classification. Appl Comput Inform. 2021. p. 1–16.10.1108/ACI-07-2021-0191.Suche in Google Scholar
[29] Khan SU, Islam N, Jan Z, Ud Din I, Rodrigues JJPC. A novel deep learning based framework for the detection and classification of breast cancer using transfer learning. Pattern Recognit Lett. 2019;125:1–6. 10.1016/j.patrec.2019.03.022.Suche in Google Scholar
[30] Le DNT, Le HX, Ngo LT, Ngo HT. Transfer learning with class-weighted and focal loss function for automatic skin cancer classification. Ithaca, New York: Cornell university; p. 1–7.Suche in Google Scholar
[31] Kondaveeti HK, Edupuganti P. Skin cancer classification using transfer learning. Proceedings of IEEE International Conference on Advent Trends in Multidisciplinary Research and Innovation ICATMRI; 2020. p. 19–22. 10.1109/ICATMRI51801.2020.9398388.Suche in Google Scholar
[32] Chang J, Yu J, Han T, Chang HJ, Park E. A method for classifying medical images using transfer learning: A pilot study on histopathology of breast cancer. 2017 IEEE 19th International Conference on e-Health Networking, Applications and Services Healthcom. 2017; 2017. p. 1–4. 10.1109/HealthCom.2017.8210843.Suche in Google Scholar
[33] Vesal S, Ravikumar N, Davari A, Ellmann S, Maier A. Classification of breast cancer histology. Ithaca, New York: Cornell university; 2018. 10.1007/978-3-319-93000-8.Suche in Google Scholar
[34] Alsabahi YAL, Fan L, Feng X. Image classification method in DR image based on transfer learning. 2018 Eighth International Conference on Image Processing Theory, Tools and Applications IPTA; 2019. p. 1–4. 10.1109/IPTA.2018.8608157.Suche in Google Scholar
[35] Liu X, Wang C, Hu Y, Zeng Z, Bai J, Liao G. Transfer learning with convolutional neural network for early gastric cancer classification on magnifiying narrow-band imaging images. Proceedings– International Conference on Image Processing ICIP; 2018. p. 1388–92. 10.1109/ICIP.2018.8451067.Suche in Google Scholar
[36] Chrabaszcz P, Loshchilov I, Hutter F. A downsampled variant of imagenet as an alternative to the CIFAR datasets; 2017. p. 1–9. http://arxiv.org/abs/1707.08819.Suche in Google Scholar
[37] Krishnan AS, Clive DR, Bhat V, Ramteke PB, Koolagudi SG. A transfer learning approach for diabetic retinopathy classification using deep convolutional neural networks. INDICON 2018 15th IEEE India Council International Conference; 2018. p. 1–6. 10.1109/INDICON45594.2018.8987131.Suche in Google Scholar
[38] Younis H, Bhatti MH, Azeem M. Classification of skin cancer dermoscopy images using transfer learning. 15th International Conference on Emerging Technologies ICET. 2019, 2019. 10.1109/ICET48972.2019.8994508.Suche in Google Scholar
[39] Khalifa NEM, Loey M, Taha MHN, Mohamed HNET. Deep transfer learning models for medical diabetic retinopathy detection. Acta Inf Medica. 2019;27(5):327–32. 10.5455/aim.2019.27.327-332.Suche in Google Scholar PubMed PubMed Central
[40] Hosny KM, Kassem MA, Fouad MM. Classification of skin lesions into seven classes using transfer learning with AlexNet. J Digit Imaging. 2020;33(5):1325–34. 10.1007/s10278-020-00371-9.Suche in Google Scholar PubMed PubMed Central
[41] Rocheteau E, Kim D, Deep transfer learning for automated diagnosis of skin lesions from photographs, December, 2020. http://arxiv.org/abs/2011.04475.Suche in Google Scholar
[42] Kassem MA, Hosny KM, Fouad MM. Skin lesions classification into eight classes for ISIC 2019 using deep convolutional neural network and transfer learning. IEEE Access. 2020;8:114822–32. 10.1109/ACCESS.2020.3003890.Suche in Google Scholar
[43] Munien C, Viriri S. Classification of hematoxylin and eosin-stained breast cancer histology microscopy images using transfer learning with EfficientNets. Comput Intell Neurosci. 2021;2021:17. 10.1155/2021/5580914.Suche in Google Scholar PubMed PubMed Central
[44] Goodfellow I, Pouget-Abadie J, Mirza M, Xu B, Warde-Farley D, Ozair S, et al. Generative adversarial networks. Commun ACM. 2020;63(11):139–44. 10.1145/3422622.Suche in Google Scholar
[45] Wang S, Xie S, Chen X, Guttery DS. Alcoholism identification based on an AlexNet transfer learning model fundamentals of transfer learning. Bethesda, Maryland: National Library of Medicine; Vol. 10. 2019. p. 1–13. 10.3389/fpsyt.2019.00205.Suche in Google Scholar PubMed PubMed Central
[46] Althnian A, AlSaeed D, Al-Baity H, Samha A, Dris AB, Alzakari N, et al. Impact of dataset size on classification performance: An empirical evaluation in the medical domain. Appl Sci. 2021;11(2):1–18. 10.3390/app11020796.Suche in Google Scholar
[47] Stehman SV. Selecting and interpreting measures of thematic classification accuracy. Remote Sens Environ. 1997 Oct 1;62(1):77–89.10.1016/S0034-4257(97)00083-7Suche in Google Scholar
[48] Kotu V, Deshpande B. Model evaluation. Data Sci. 2019;263–79. 10.1016/b978-0-12-814761-0.00008-3.Suche in Google Scholar
[49] Confusion Matrix and Object Detection. 2020. https://morioh.com/p/96f68f832573 (accessed Jan. 06 2022).Suche in Google Scholar
[50] Wu S, Yau WC, Ong TS, Chong SC. Integrated churn prediction and customer segmentation framework for telco business. IEEE Access. 2021;9:62118–36. 10.1109/ACCESS.2021.3073776.Suche in Google Scholar
[51] ROC Curve Explained in One Picture - Data Science Central. 2019. https://www.datasciencecentral.com/profiles/blogs/roc-curve-explained-in-one-picture (accessed Jan. 06 2022).Suche in Google Scholar
[52] DeVries Z, Locke E, Hoda M, Moravek D, Phan K, Stratton A, et al. Using a national surgical database to predict complications following posterior lumbar surgery and comparing the area under the curve and F1-score for the assessment of prognostic capability. Spine J. 2021;21(7):1135–42. 10.1016/j.spinee.2021.02.007.Suche in Google Scholar PubMed
[53] Borjali A, Chen AF, Muratoglu OK, Morid MA, Varadarajan KM. Deep learning in orthopedics: How do we build trust in the machine? Healthc Transform. 2020;1–6. 10.1089/heat.2019.0006.Suche in Google Scholar
[54] Shallu, Mehra R. Breast cancer histology images classification: Training from scratch or transfer learning? ICT Express. 2018;4(4):247–54. 10.1016/j.icte.2018.10.007.Suche in Google Scholar
[55] Boumaraf S, Liu X, Zheng Z, Ma X, Ferkous C. A new transfer learning based approach to magnification dependent and independent classification of breast cancer in histopathological images. Biomed Signal Process Control. 2021;63:102192. 10.1016/j.bspc.2020.102192.Suche in Google Scholar
[56] Hassan SA, Sayed MS, Abdalla MI, Rashwan MA. Breast cancer masses classification using deep convolutional neural networks and transfer learning. Multimed Tools Appl. 2020;79(41–42):30735–68. 10.1007/s11042-020-09518-w.Suche in Google Scholar
[57] Egmentation S, Pham DL, Xu C, Prince JL. C m m i s; 2000.Suche in Google Scholar
[58] Kasban H, El-Bendary MAM, Salama DH. A comparative study of medical imaging techniques. Int J Inf Sci Intell Syst. 2015;4(2):37–58. https://www.researchgate.net/publication/274641835.Suche in Google Scholar
[59] Ali MS, Miah MS, Haque J, Rahman MM, Islam MK. An enhanced technique of skin cancer classification using deep convolutional neural network with transfer learning models. Mach Learn Appl. 2021;5:100036. 10.1016/j.mlwa.2021.100036.Suche in Google Scholar
[60] Moldovan D. Transfer learning based method for two-step skin cancer images classification. 7th E-Health and Bioengineering Conference EHB; 2019. p. 31–4. 10.1109/EHB47216.2019.8970067.Suche in Google Scholar
[61] Alzubaidi L, Fadhel MA, Al‐shamma O, Zhang J, Duan Y. Deep learning models for classification of red blood cells in microscopy images to aid in sickle cell anemia diagnosis. Electron. 2020;9(3):18. 10.3390/electronics9030427.Suche in Google Scholar
[62] Reza MS, Ma J. Imbalanced histopathological breast cancer image classification with convolutional neural network. International Conference on Signal Processing Proceedings, ICSP. Vol. 2018. 2019. p. 619–24. 10.1109/ICSP.2018.8652304.Suche in Google Scholar
[63] McCann MT, Ozolek JA, Castro CA, Parvin B, Kovacevic J. Automated histology analysis. IEEE Signal Process Mag. 2015;32:78–87. 10.1109/MSP.2014.2346443 Suche in Google Scholar
[64] Treatment by cancer type. 2022. https://www.nccn.org/guidelines/category_1 (accessed Jan. 21, 2022).Suche in Google Scholar
[65] Breast MRI - Mayo Clinic. https://www.mayoclinic.org/tests-procedures/breast-mri/about/pac-20384809 (accessed Mar. 04, 2022).Suche in Google Scholar
[66] Iranmakani S, Mortezazadeh T, Sajadian F, Ghaziani MF, Ghafari A, Khezerloo D, et al. A review of various modalities in breast imaging: technical aspects and clinical outcomes. Egypt J Radiol Nucl Med. 2020;51(1):1–22. 10.1186/s43055-020-00175-5.Suche in Google Scholar
[67] Phankokkruad M. Ensemble transfer learning for lung cancer detection. ACM International Conference Proceeding Series; 2021. p. 438–42. 10.1145/3478905.3478995.Suche in Google Scholar
[68] Fang T. A novel computer-aided lung cancer detection method based on transfer learning from googlenet and median intensity projections. 2018 IEEE International Conference on Computer and Communication Engineering Technology CCET; 2018. p. 286–90. 10.1109/CCET.2018.8542189.Suche in Google Scholar
[69] Lakshmi D, Thanaraj KP, Arunmozhi M. Convolutional neural network in the detection of lung carcinoma using transfer learning approach. Int J Imaging Syst Technol. 2020;30(2):445–54. 10.1002/ima.22394.Suche in Google Scholar
[70] Sajja TK, Devarapalli RM, Kalluri HK. Lung cancer detection based on CT scan images by using deep transfer learning. Trait du Signal. 2019;36(4):339–44. 10.18280/ts.360406.Suche in Google Scholar
[71] Sakai Y, Takemoto S, Hori K, Nishimura M, Ikematsu H, Yano T, et al. Automatic detection of early gastric cancer in endoscopic images using a transferring convolutional neural network. Proceedings of Annual International Conference of the IEEE Engineering in Medicine and Biology Society EMBS; 2018. p. 4138–41. 10.1109/EMBC.2018.8513274.Suche in Google Scholar PubMed
[72] Zhu Y, Wang QC, Xu MD, Zhang Z, Cheng J, Zhong YS, et al. Application of convolutional neural network in the diagnosis of the invasion depth of gastric cancer based on conventional endoscopy. Gastrointest Endosc. 2019;89(4):806–815.e1. 10.1016/j.gie.2018.11.011.Suche in Google Scholar PubMed
[73] Raghuwanshi M, Sanghavi J. Comparative analysis for diabetic retinopathy detection using CNN and transfer learning. Int. J. Grid Distrib. Comput. 2021;14(1):968–975.Suche in Google Scholar
[74] Rehman A, Naz S, Razzak MI, Akram F, Imran M. A deep learning-based framework for automatic brain tumors classification using transfer learning. Circuits Syst Signal Process. 2020;39(2):757–75. 10.1007/s00034-019-01246-3.Suche in Google Scholar
[75] Pimenidis E. Ilias maglogiannis Lazaros Iliadis applications; 2020. 10.1007/978-3-030-49161-1.Suche in Google Scholar
[76] Mehrotra R, Ansari MA, Agrawal R, Anand RS. A transfer learning approach for AI-based classification of brain tumors. Mach Learn Appl. 2020;2:100003. 10.1016/j.mlwa.2020.100003.Suche in Google Scholar
[77] Data-Set Noun – Definition, pictures, pronunciation and usage notes | Oxford Advanced Learner’s Dictionary at OxfordLearnersDictionaries.com. https://www.oxfordlearnersdictionaries.com/definition/english/data-set?q = data+set (accessed Jan. 25, 2022).Suche in Google Scholar
[78] What is a Dataset in Machine Learning: The Complete Guide. 2021. https://labelyourdata.com/articles/what-is-dataset-in-machine-learning (accessed Jan. 25, 2022).Suche in Google Scholar
[79] Tschandl P, Rosendahl C, Kittler H. Data descriptor: The HAM10000 dataset, a large collection of multi-source dermatoscopic images of common pigmented skin lesions. Sci Data. 2018;5:1–9. 10.1038/sdata.2018.161.Suche in Google Scholar PubMed PubMed Central
[80] Khan MA, Akram T, Sharif M, Kadry S, Nam Y. Computer decision support system for skin cancer localization and classification; 2021. 10.32604/cmc.2021.016307.Suche in Google Scholar
[81] ISIC Archive. https://www.isic-archive.com/ (accessed Jan. 26, 2022).Suche in Google Scholar
[82] Codella NC, Gutman D, Celebi ME, Helba B, Marchetti MA, Dusza SW, et al. Skin lesion analysis toward melanoma detection: A challenge at the 2017 International symposium on biomedical imaging (ISBI), hosted by the international skin imaging collaboration (ISIC). Proceedings – International Symposium on Biomedical. Imaging. Vol. 2018; 2018. p. 168–72. 10.1109/ISBI.2018.8363547.Suche in Google Scholar
[83] Hosny KM, Kassem MA, Foaud MM. Classification of skin lesions using transfer learning and augmentation with Alex-net. PLoS One. 2019;14(5):1–17. 10.1371/journal.pone.0217293.Suche in Google Scholar PubMed PubMed Central
[84] DermIS. https://www.dermis.net/dermisroot/en/home/index.htm (accessed Jan. 26, 2022).Suche in Google Scholar
[85] Giotis I, Molders N, Land S, Biehl M, Jonkman MF, Petkov N. MED-NODE: A computer-assisted melanoma diagnosis system using non-dermoscopic images. Expert Syst Appl. 2015;42(19):6578–85. 10.1016/j.eswa.2015.04.034.Suche in Google Scholar
[86] Skin Cancer MNIST: HAM10000 | Kaggle. https://www.kaggle.com/kmader/skin-cancer-mnist-ham10000 (accessed Mar. 18, 2022).Suche in Google Scholar
[87] ISIC Challenge. https://challenge.isic-archive.com/data/(accessed Mar. 18, 2022).Suche in Google Scholar
[88] EmailMe Form - Derm101 was deactivated on December 31, 2019. https://www.emailmeform.com/builder/form/Ne0j8da9bb7U4h6t1f (accessed Mar. 18, 2022).Suche in Google Scholar
[89] DermIS. https://www.dermis.net/dermisroot/en/home/index.htm (accessed Mar. 18, 2022).Suche in Google Scholar
[90] Dermatology database used in MED-NODE. 2015. http://www.cs.rug.nl/∼imaging/databases/melanoma_naevi/(accessed Mar. 18, 2022).Suche in Google Scholar
[91] Aresta G, Araújo T, Kwok S, Chennamsetty SS, Safwan M, Alex V, et al. BACH: Grand challenge on breast cancer histology images. Med Image Anal. 2019;56:122–39. 10.1016/j.media.2019.05.010.Suche in Google Scholar PubMed
[92] Alom MZ, Yakopcic C, Nasrin MS, Taha TM, Asari VK. Breast cancer classification from histopathological images with inception recurrent residual convolutional neural network. J Digit Imaging. 2019;32(4):605–17. 10.1007/s10278-019-00182-7.Suche in Google Scholar PubMed PubMed Central
[93] Oliveira JEE, Gueld MO de A, Araújo A, Ott B, Deserno TM. Mammographic Image Analysis Homepage - Databases. Med Imaging Comput Diagnosis. Mar. 2008;6915:69151Y. 10.1117/12.770325.Suche in Google Scholar
[94] Aksac A, Demetrick DJ, Ozyer T, Alhajj R. BreCaHAD: A dataset for breast cancer histopathological annotation and diagnosis. BMC Res Notes. Feb. 2019;12(1):1–3. 10.1186/S13104-019-4121-7/TABLES/1.Suche in Google Scholar
[95] Dataset - Grand Challenge. https://iciar2018-challenge.grand-challenge.org/Dataset/(accessed Mar. 18, 2022).Suche in Google Scholar
[96] Deniz E, Şengür A, Kadiroğlu Z, Guo Y, Bajaj V, Budak Ü. Transfer learning based histopathologic image classification for breast cancer detection. Heal Inf Sci Syst. 2018;6(1):1–7. 10.1007/s13755-018-0057-x.Suche in Google Scholar PubMed PubMed Central
[97] De Matos J, Britto ADS, Oliveira LES, Koerich AL. Double transfer learning for breast cancer histopathologic image classification. Proceedings of International Joint Conference on Neural Networks. Vol. 2019; 2019. 10.1109/IJCNN.2019.8852092.Suche in Google Scholar
[98] Breast Cancer Histopathological Database (BreakHis) - Laboratório Visão Robótica e Imagem. https://web.inf.ufpr.br/vri/databases/breast-cancer-histopathological-database-breakhis/(accessed Mar. 18, 2022).Suche in Google Scholar
[99] MIAS Mammography | Kaggle. 2017. https://www.kaggle.com/kmader/mias-mammography?select=all_mias_scans.h5 (accessed Mar. 18, 2022).Suche in Google Scholar
[100] Breast Histopathology Images | Kaggle. 2017. https://www.kaggle.com/datasets/paultimothymooney/breast-histopathology-images (accessed Jun. 10, 2022).Suche in Google Scholar
[101] BreCaHAD: A dataset for breast cancer histopathological annotation and diagnosis. 2019. https://figshare.com/articles/dataset/BreCaHAD_A_Dataset_for_Breast_Cancer_Histopathological_Annotation_and_Diagnosis/7379186 (accessed Mar. 18, 2022).Suche in Google Scholar
[102] Sikder N, Masud M, Bairagi AK, Arif ASM, Al Nahid A, Alhumyani HA. Severity classification of diabetic retinopathy using an ensemble learning algorithm through analyzing retinal images. Symmetry (Basel). 2021;13(4):26. 10.3390/sym13040670.Suche in Google Scholar
[103] Chetoui M, Akhloufi MA. Explainable diabetic retinopathy using EfficientNET. Proceedings of Annual International Conference of the IEEE Engineering in Medicine & Biology Society EMBS. 2020, 2020. p. 1966–9. 10.1109/EMBC44109.2020.9175664.Suche in Google Scholar PubMed
[104] APTOS 2019 Blindness Detection | Kaggle. 2019. https://www.kaggle.com/c/aptos2019-blindness-detection/data (accessed Mar. 18, 2022).Suche in Google Scholar
[105] Diabetic Retinopathy Detection | Kaggle. 2015. https://www.kaggle.com/c/diabetic-retinopathy-detection/data (accessed Mar. 18, 2022).Suche in Google Scholar
[106] He H, Jin S, Wen CK, Gao F, Li GY, Xu Z. Model-driven deep learning for physical layer communications. IEEE Wirel Commun. 2019;26(5):77–83. 10.1109/MWC.2019.1800447.Suche in Google Scholar
[107] Goyal M, Knackstedt T, Yan S, Hassanpour S. Artificial intelligence-based image classification methods for diagnosis of skin cancer: Challenges and opportunities. Comput Biol Med. 2020;127:104065. 10.1016/j.compbiomed.2020.104065.Suche in Google Scholar PubMed PubMed Central
[108] Shakeel F, Sabhitha AS, Sharma S. Exploratory review on class imbalance problem: An overview. 8th International Conference on Computing, Communication and Networking Technologies ICCCNT; 2017. 10.1109/ICCCNT.2017.8204150.Suche in Google Scholar
[109] Ahmad HM, Ghuffar S, Khurshid K. Classification of breast cancer histology images using transfer learning. Proceedings of 2019 16th International Bhurban Conference on Applied Sciences & Technology IBCAST; 2019. p. 328–32. 10.1109/IBCAST.2019.8667221.Suche in Google Scholar
[110] Kassani SH, Kassani PH. A comparative study of deep learning architectures on melanoma detection. Tissue Cell. 2019;58:76–83. 10.1016/j.tice.2019.04.009.Suche in Google Scholar PubMed
[111] Singh R, Ahmed T, Kumar A, Singh AK, Pandey AK, Singh SK. Imbalanced breast cancer classification using transfer learning. IEEE/ACM Trans Comput Biol Bioinforma. 2021;18(1):83–93. 10.1109/TCBB.2020.2980831.Suche in Google Scholar PubMed
[112] Convolutional neural networks: an overview and application in radiology | Insights into Imaging | Full Text. https://insightsimaging.springeropen.com/articles/. 2018. 10.1007/s13244-018-0639-9/figures/10 (accessed Mar. 22, 2022).Suche in Google Scholar
[113] Mamun Ral. Application of deep convolution neural network in breast cancer prediction using digital mammograms, no. November, 2021.10.1109/IISEC54230.2021.9672368Suche in Google Scholar
[114] Varish N, Pal AK, Hassan R, Hasan MK, Khan A, Parveen N, et al. Image retrieval scheme using quantized bins of color image components and adaptive tetrolet transform. IEEE Access. 2020;8:117639–65.10.1109/ACCESS.2020.3003911Suche in Google Scholar
[115] Hasan MK, Akhtaruzzaman M, Kabir SR, Gadekallu TR, Islam S, Magalingam P, et al. Evolution of industry and blockchain era: monitoring price hike and corruption using BIoT for smart government and industry 4.0. IEEE Transactions on Industrial Informatics; 2022.10.1109/TII.2022.3164066Suche in Google Scholar
[116] Mahmoudi R, Benameur N, Mabrouk R, Mohammed MA, Garcia-Zapirain B, Bedoui MH. A deep learning-based diagnosis system for COVID-19 detection and pneumonia screening using CT imaging. Appl Sci. 2022;12(10):4825.10.3390/app12104825Suche in Google Scholar
[117] Abdulsahib AA, Mahmoud MA, Aris H, Gunasekaran SS, Mohammed MA. An automated image segmentation and useful feature extraction algorithm for retinal blood vessels in fundus images. Electronics. 2022;11(9):1295.10.3390/electronics11091295Suche in Google Scholar
[118] Shamim S, Awan MJ, Mohd Zain A, Naseem U, Mohammed MA, Garcia-Zapirain B. Automatic COVID-19 lung infection segmentation through modified unet model. J Healthc Eng. 2022;2022:13. 10.1155/2022/6566982.Suche in Google Scholar PubMed PubMed Central
[119] Abdulkareem KH, Mostafa SA, Al-Qudsy ZN, Mohammed MA, Al-Waisy AS, Kadry S, et al. Automated system for identifying COVID-19 infections in computed tomography images using deep learning models. J Healthc Eng. 2022;2022:13. 10.1155/2022/5329014.Suche in Google Scholar PubMed PubMed Central
[120] Allioui H, Mohammed MA, Benameur N, Al-Khateeb B, Abdulkareem KH, Garcia-Zapirain B, et al. A multi-agent deep reinforcement learning approach for enhancement of COVID-19 CT image segmentation. J Personalized Med. 2022;12(2):309.10.3390/jpm12020309Suche in Google Scholar PubMed PubMed Central
© 2022 Abdulrahman Abbas Mukhlif et al., published by De Gruyter
This work is licensed under the Creative Commons Attribution 4.0 International License.
Artikel in diesem Heft
- Research Articles
- Construction of 3D model of knee joint motion based on MRI image registration
- Evaluation of several initialization methods on arithmetic optimization algorithm performance
- Application of visual elements in product paper packaging design: An example of the “squirrel” pattern
- Deep learning approach to text analysis for human emotion detection from big data
- Cognitive prediction of obstacle's movement for reinforcement learning pedestrian interacting model
- The application of neural network algorithm and embedded system in computer distance teach system
- Machine translation of English speech: Comparison of multiple algorithms
- Automatic control of computer application data processing system based on artificial intelligence
- A secure framework for IoT-based smart climate agriculture system: Toward blockchain and edge computing
- Application of mining algorithm in personalized Internet marketing strategy in massive data environment
- On the correction of errors in English grammar by deep learning
- Research on intelligent interactive music information based on visualization technology
- Extractive summarization of Malayalam documents using latent Dirichlet allocation: An experience
- Conception and realization of an IoT-enabled deep CNN decision support system for automated arrhythmia classification
- Masking and noise reduction processing of music signals in reverberant music
- Cat swarm optimization algorithm based on the information interaction of subgroup and the top-N learning strategy
- State feedback based on grey wolf optimizer controller for two-wheeled self-balancing robot
- Research on an English translation method based on an improved transformer model
- Short-term prediction of parking availability in an open parking lot
- PUC: parallel mining of high-utility itemsets with load balancing on spark
- Image retrieval based on weighted nearest neighbor tag prediction
- A comparative study of different neural networks in predicting gross domestic product
- A study of an intelligent algorithm combining semantic environments for the translation of complex English sentences
- IoT-enabled edge computing model for smart irrigation system
- A study on automatic correction of English grammar errors based on deep learning
- A novel fingerprint recognition method based on a Siamese neural network
- A hidden Markov optimization model for processing and recognition of English speech feature signals
- Crime reporting and police controlling: Mobile and web-based approach for information-sharing in Iraq
- Convex optimization for additive noise reduction in quantitative complex object wave retrieval using compressive off-axis digital holographic imaging
- CRNet: Context feature and refined network for multi-person pose estimation
- Improving the efficiency of intrusion detection in information systems
- Research on reform and breakthrough of news, film, and television media based on artificial intelligence
- An optimized solution to the course scheduling problem in universities under an improved genetic algorithm
- An adaptive RNN algorithm to detect shilling attacks for online products in hybrid recommender system
- Computing the inverse of cardinal direction relations between regions
- Human-centered artificial intelligence-based ice hockey sports classification system with web 4.0
- Construction of an IoT customer operation analysis system based on big data analysis and human-centered artificial intelligence for web 4.0
- An improved Jaya optimization algorithm with ring topology and population size reduction
- Review Articles
- A review on voice pathology: Taxonomy, diagnosis, medical procedures and detection techniques, open challenges, limitations, and recommendations for future directions
- An extensive review of state-of-the-art transfer learning techniques used in medical imaging: Open issues and challenges
- Special Issue: Explainable Artificial Intelligence and Intelligent Systems in Analysis For Complex Problems and Systems
- Tree-based machine learning algorithms in the Internet of Things environment for multivariate flood status prediction
- Evaluating OADM network simulation and an overview based metropolitan application
- Radiography image analysis using cat swarm optimized deep belief networks
- Comparative analysis of blockchain technology to support digital transformation in ports and shipping
- IoT network security using autoencoder deep neural network and channel access algorithm
- Large-scale timetabling problems with adaptive tabu search
- Eurasian oystercatcher optimiser: New meta-heuristic algorithm
- Trip generation modeling for a selected sector in Baghdad city using the artificial neural network
- Trainable watershed-based model for cornea endothelial cell segmentation
- Hessenberg factorization and firework algorithms for optimized data hiding in digital images
- The application of an artificial neural network for 2D coordinate transformation
- A novel method to find the best path in SDN using firefly algorithm
- Systematic review for lung cancer detection and lung nodule classification: Taxonomy, challenges, and recommendation future works
- Special Issue on International Conference on Computing Communication & Informatics
- Edge detail enhancement algorithm for high-dynamic range images
- Suitability evaluation method of urban and rural spatial planning based on artificial intelligence
- Writing assistant scoring system for English second language learners based on machine learning
- Dynamic evaluation of college English writing ability based on AI technology
- Image denoising algorithm of social network based on multifeature fusion
- Automatic recognition method of installation errors of metallurgical machinery parts based on neural network
- An FCM clustering algorithm based on the identification of accounting statement whitewashing behavior in universities
- Emotional information transmission of color in image oil painting
- College music teaching and ideological and political education integration mode based on deep learning
- Behavior feature extraction method of college students’ social network in sports field based on clustering algorithm
- Evaluation model of multimedia-aided teaching effect of physical education course based on random forest algorithm
- Venture financing risk assessment and risk control algorithm for small and medium-sized enterprises in the era of big data
- Interactive 3D reconstruction method of fuzzy static images in social media
- The impact of public health emergency governance based on artificial intelligence
- Optimal loading method of multi type railway flatcars based on improved genetic algorithm
- Special Issue: Evolution of Smart Cities and Societies using Emerging Technologies
- Data mining applications in university information management system development
- Implementation of network information security monitoring system based on adaptive deep detection
- Face recognition algorithm based on stack denoising and self-encoding LBP
- Research on data mining method of network security situation awareness based on cloud computing
- Topology optimization of computer communication network based on improved genetic algorithm
- Implementation of the Spark technique in a matrix distributed computing algorithm
- Construction of a financial default risk prediction model based on the LightGBM algorithm
- Application of embedded Linux in the design of Internet of Things gateway
- Research on computer static software defect detection system based on big data technology
- Study on data mining method of network security situation perception based on cloud computing
- Modeling and PID control of quadrotor UAV based on machine learning
- Simulation design of automobile automatic clutch based on mechatronics
- Research on the application of search algorithm in computer communication network
- Special Issue: Artificial Intelligence based Techniques and Applications for Intelligent IoT Systems
- Personalized recommendation system based on social tags in the era of Internet of Things
- Supervision method of indoor construction engineering quality acceptance based on cloud computing
- Intelligent terminal security technology of power grid sensing layer based upon information entropy data mining
- Deep learning technology of Internet of Things Blockchain in distribution network faults
- Optimization of shared bike paths considering faulty vehicle recovery during dispatch
- The application of graphic language in animation visual guidance system under intelligent environment
- Iot-based power detection equipment management and control system
- Estimation and application of matrix eigenvalues based on deep neural network
- Brand image innovation design based on the era of 5G internet of things
- Special Issue: Cognitive Cyber-Physical System with Artificial Intelligence for Healthcare 4.0.
- Auxiliary diagnosis study of integrated electronic medical record text and CT images
- A hybrid particle swarm optimization with multi-objective clustering for dermatologic diseases diagnosis
- An efficient recurrent neural network with ensemble classifier-based weighted model for disease prediction
- Design of metaheuristic rough set-based feature selection and rule-based medical data classification model on MapReduce framework