A hybrid particle swarm optimization with multi-objective clustering for dermatologic diseases diagnosis
-
Ravinder Reddy Baireddy
 and
R. Nagaraja
and
R. Nagaraja

Abstract
Effective and personalized treatment relies heavily on skin disease categorization. In the stratification of skin disorders, it is crucial to identify the subtypes of illnesses to provide an efficient therapy. To attain this aim, researchers have focused their attention on cluster algorithms for the stratification of skin disorders in recent decades. But, cluster algorithms have real-world drawbacks, including experimental noises, a large number of dimensions, and a poor ability to comprehend. Cluster algorithms, in particular, determine the quality of clusters using a single internal evaluation operation in the majority of cases. A single internal assessment procedure is difficult to design and robust for all datasets, which is a problem. The multi-objective particle swarm obtained high sensitivity in the existing work, but it is not able to anticipate all kinds of classes. An optimized cluster distance parameter for K-means clustering is determined using a hybrid particle swarm and moth flame optimization. Multi-objective is guided by two cluster value indices, including the K-means clustering misclassification rate and neural network classification rate. Hybrid PSO will solve the multi-objective problem to identify the optimal cluster for clustering. On the dermatological dataset from the UCI repository, MATLAB R2020a will be used to evaluate the proposed method. This will be followed by an evaluation of the proposed method’s performance using the cluster evaluation indices.
1 Introduction
Most dermatological infections fall under the erythematous-squamous disease (ESD) category. Psoriasis, seborrheic dermatitis, lichen planus, pityriasis rosea, chronic dermatitis, and rubra pilaris are among the six types of ESD. Erythemato-squamous illnesses are crusty inflammatory skin conditions that usually affect the scalp and cheeks. There are six different types of erythema and scale, but they all have had very similar clinical symptoms. Genetic and environmental factors can contribute to dermatological disorders, which tend to manifest themselves at certain life stages, such as late childhood/early adolescence. Skincare differential data analysis is a tough subject since one illness may show early signs of another disease and then develop its own characteristics as the disease progresses through its life cycle.
A huge dataset is mined for hidden, previously unknown, and potentially useful information using a data mining technique. Data mining is an interdisciplinary approach for finding and interpreting important information. On this basis, the following two parts described the data mining techniques utilized for categorizing ESD illnesses. Large amounts of medical information are now available as a result of recent technological advances. These records are full of useful information. As a result, data mining techniques are employed to uncover important patterns. This paper will provide an overview of data analysis and its many methodologies, as well as a review of the medical data mining research. The importance of diverse data mining approaches is highlighted. In medical analytics, classification is a reliable method.
A technique presented in this paper [1] can be used to identify skin disorders. In a two-stage technique for accurate disease diagnosis, computer vision and machine learning are combined with clinically evaluated histological features. When the system was trained and tested on six diseases, it obtained a 95% accuracy rate.
When it comes to preparing effective and efficient data for data mining, data pre-processing is a key component. When it comes to developing complete predictive models, feature selection is crucial since it provides significant features [2]. The use of FSMs such as forward selection and backward elimination to pick the optimal subset of characteristics reduces training time and improves system performance employed in this prediction model.
In this work [3], a predictive framework for ESDs is constructed using a mix of classifiers. It is suggested that the model be broken down into two stages. A simple set-based feature selection approach is used to choose an initial feature subset. In the second phase, an aggregation of three classifiers consisting of MLP, KNN, and SVM is created. Finally, each classifier arrives at a diagnosis result using the majority voting approach. The recommended model achieves 97.78% accuracy in ensemble categorization.
Self-organization maps (SOM) of clinical and pathological findings will be used in the present investigation to explore clusters associated with different illnesses [4]. A SOM is an encompass of neurons that adapts to a dataset’s topology structure, enabling us to view massive datasets and find probable groupings. By constantly shifting its neurons directly to the data points, a SOM understands the form of a dataset. SOM is a size reduction method that uses multidimensional input to reduce the issue. As a consequence, the artificial intelligence program SOM was used to classify the six kinds of erythematous-squamous skin conditions. The classification and regression tree (CART) was used to predict the ESD diagnosis [5]. A CART is a computational intelligence forecasting technique. It illustrates how the quantities of a target attribute can be anticipated using other variables. It is a tree structure with each fork separated into a predictor variable and predictions for the target attribute at the end of each node [6]. The proposed model was 94.84% accurate.
Bayesian network, support vector machine (svm), logic boost, multilayer perceptron (MLP), Random Forest, and J48 data mining classifier were utilized in the current research to predict the illness [7]. They were able to diagnose illnesses with an accuracy of 83.6 and 84.5%, respectively, by using Bayesian Network and Logic Boost methods.
For skin disease detection, a hybrid model combining Case-Based Reasoning and Artificial Neural Networks methods is suggested in ref. [8]. There are nine input factors (attributes) that have a significant impact on the skin diagnosis process in the suggested model. To implement the concept, a user-friendly and interactive computer program has been built.
To identify erythemato-squamous illness, ChiGA (Chi-Square and Genetic Algorithm) is a unique feature selection approach [9]. ChiGA selects the optimum feature subset by combining the benefits of filter and wrapper techniques. Ninety-eight percent of the characteristics are optimal, with 18 of them being particularly accurate.
Dermatology disease processing technique is defined in this study. Each of the three stages of the suggested work paradigm is described in more detail [10]. Statistical parameters are used in the first step of data processing and analysis. To create the predictive cell structure, these factors are monitored with probabilistic measurements in the second step of the process. Bayesian networks are used for illness categorization in the final stage. As a result of its implementation, the method’s outcomes have been very accurate.
Filter technique and Partial Forward Search (F PFS algorithm) is a novel weighted probabilistic strategy for feature selection that determines the best models of support vector machines to detect various skin disorders [11]. Overfitting is reduced and accuracy is improved, especially when using a classifier like a support vector machine.
This paper is structured as follows: In Section 2, we will look at some of the most recent methods for classifying skin disorders. Section 3 explains the shortcomings of the current and the originality of the suggested technique. Section 4 describes the clustered and optimized classifier. Based on the suggested technique, results and discussion are presented in Section 5. Lastly, the paper concludes with a summary, which is expanded in Sections 6 and 7.
2 Literature survey
With the WEKA data mining tool, this article [12] seeks to forecast skin disorders by combining the following algorithms Neural Network, Decision Tree, and Ensemble Method based on Majority Voting. The prediction algorithm was evaluated using a dermatology dataset. Based on accuracy and precision as well as true positive and false positive, the performance evaluation was conducted to determine the effectiveness of the test. It creates a superior skin disease prediction model with significantly greater accuracy and generalization, which avoids both over-fitting and under-fitting.
A combination Dynamic ant colony model with 3 updating stages, wavelets transform, and singular value decomposition incorporating svm was suggested in this article [13]. The suggested method’s intended goal is to reduce a subset of characteristics to provide an acceptable illness diagnosis with the best accuracy, sensitivity, and specificity across a wide variety of disorders. Five benchmark medical datasets of diverse illnesses will be used to assess the proposed approach.
In the categorization of Erythematous-squamous Dataset, Naive Bayes has a 100% success rate [14]. As a consequence of the integration of correlation-based filter methods and different heuristic search methods, the number of characteristics has been decreased from 34 to 19. To locate important class characteristics, the original data are subjected to the correlation-based feature selection (CFS) process. Continuous and discrete problems are filtered using a fast correlation-based filtering technique. To reduce dimension, features are considered to use the relief method.
They [15] represent a new strategy in this paper that combines six distinct data mining categorization techniques. The most important 15 characteristics that will play a key influence in prediction are chosen using a correlation-based feature technique. Then, combining Bagging, AdaBoost, and Gradient Boosting classifier methods, they create an ensemble approach. Gradient boosting is a sort of boosting used in deep learning. It is based on the assumption that whenever the best potential future model is coupled with prior models, the prediction accuracy error is minimal. If a slight modification in a case’s forecast generates no modification in error, the case’s subsequent targeted result is nil [16]. When applied to dermatological datasets, the ensemble approach and feature selection produce better results than individual classifier methods. The ensemble technique seems to be more efficient and precise in predicting skin diseases.
When utilizing data mining algorithms for the prediction of skin disorders, this article [17] explores the effect of feature selection approaches. PCA, GA, and Chi-square were the feature selection methods used to minimize the number of features in a dataset of skin disorders. Feature selection methods did not increase the precision and sensitivities of these methods, according to empirical observations.
Psoriasis – Cronic Dermatitis and Seborreic Dermatitis Pitriasis Rosea were identified in the same cluster, and the diagnoses are confounded as a result of this procedure [4]. Clinical and histological results of the illnesses were grouped by the SOM technique to avoid this misunderstanding [18]. SVM was used to classify clinical and histological results that clustered together. This led to the categorization of psoriasis and chronic dermatitis at 0.89 and 0.93, respectively, and seborreic dermatitis with pitriasis rosea at 0.79 and 0.80.
When applied to dermatological datasets, the ensemble technique and feature selection produce better results than individual classifier approaches [19]. A more accurate and efficient way to predict skin disorders appears to be using the ensemble approach. As a novel method, they [20,21] integrate data mining classification techniques from six different sources.
NB, K-Nearest Neighbor (KNN), SVM, Random Forest (RF), and Multilayer Perception are some of the machine learning algorithms they utilized for skin diseases classification [22,23]. To improve the performance of the trained model, they employed three fundamental ensemble learning: Bagging, Boosting, and Stacking. A model’s utility is measured by its accuracy, precision, sensitivity, and f1-score.
Using Artificial Neural Networks, this research aims to categorize the six types of ESD with great accuracy. Using a backpropagation feed-forward approach, they classified ESDs using the JustNN program [6]. They used the pre-process dataset to train and validate the suggested model. The proposed model has a 98.36% accuracy rate.
Calinski–Harabasz and Davies–Bouldin cluster value indices are used to assist the development of multi-objectives [16]. The clustering is done with the assistance of a k-means cluster and particle optimization to identify the optimal clusters. The multi-objective problem will be solved by PSO to find the optimal cluster.
3 Existing method
In the categorization of Erythematous-squamous Dataset, Naive Bayes has a 100% success rate [14]. As a consequence of the integration of correlation-based filter methods and different heuristic search methods, the number of characteristics has been decreased from 34 to 19. When utilizing data mining algorithms for the prediction of skin disorders, this article explores the effect of feature selection approaches [18]. PCA, GA, and Chi-square were the feature selection methods used to minimize the number of features in a dataset of skin disorders [24]. Feature selection methods did not increase the precision and sensitivities of these methods, according to empirical observations.
The above two algorithms utilized the feature selection approach for skin diseases prediction using supervised classifiers. Due to that, it indicates that feature selection has a lesser role in classification.
Calinski–Harabasz and Davies–Bouldin cluster value indices are used to assist the development of multi-objectives [16]. The clustering is done with the assistance of a k-means cluster and particle optimization to identify the optimal clusters [25]. The multi-objective problem will be solved by PSO to find the optimal cluster. Yet, this paper also suffers from poor classification.
3.1 Research gap identifications
Hence, in this paper, the following objectives were framed to improve the prediction using unsupervised classification.
Minimal attribute for classification.
Achieve good prediction using unsupervised classification.
Utilize minimal attributes for both supervised and unsupervised approaches.
4 Proposed method
With the aid of machine learning methods, an optimized data mining strategy is provided in this work to forecast skin disorders. A hybrid particles swarm and moth flame optimization are used to get an optimal clustered distance value for K-means grouping. The K-means clustering misclassification rates and the neural network classification rate are two cluster value indexes that govern multi-objectives. The multi-objective problem would be solved using hybrid PSO to find the best clusters for cluster analysis [26]. The process in the proposed method is shown in Figure 1.

Proposed method process flowchart.
Figure 1 depicts the fundamental data mining method for predicting skin disorders, which includes the following steps:
The UCI machine learning repository website provided the input skin diseases dataset.
To balance the dataset and its values, pre-processing processes such as normalization and rows addition are performed.
Next, particle swarm optimization is used to identify the best attribute for predicting diseases.
A feed-forward neural network is used to verify the specified characteristics.
The best distance metric for clustering is then calculated using the optimal attribute and moth flame optimization.
After determining the best attribute and distance, the data are clustered using k-means.
Finally, accuracy is used to assess the suggested method’s performance.
The working of each block is explained as follows.
4.1 Input dataset
The UCI Machine Learning Repository is a library of datasets, domains ideas, and data sources that the machine learning group uses to test machine learning techniques empirically [27]. The UCI machine learning repository website provided the input skin diseases dataset [26]. There are 366 examples in the dataset, with 34 inputs and six distinct ESD classes. After removing eight samples with missing data, the total number of samples is decreased to 358. Patients are initially clinically evaluated with 12 distinct tests during clinical diagnosis. Dermatologists, on the other hand, seek a biopsy to extract 22 pathological characteristics from each sample.
With the exception of age and family history, all clinical and histological characteristics are graded on a scale of 0–3. When the greatest possible value happens, it takes 3 (maximum), but if the feature does not exist, it takes 0 (NON). It corresponds to Low or Medium, respectively, for relative intermediate values 1 and 2. If any of these illnesses are seen in a relative, value 1 is assigned to the family history characteristic. The record distribution for the six classes is shown in Table 1.
Record distribution in the dataset
| Classes | No of records |
|---|---|
| Psoriasis | 111 |
| Seborrheic dermatitis | 60 |
| Lichen planus | 71 |
| Pityriasis rosea | 48 |
| Chronic dermatitis | 48 |
| Rubra pilaris | 20 |
Table 1 reveals that, in comparison to the other classes, class six has the fewest records. As a result, the K-means cluster does not attain a high predictive value in the existing work. As a result, data balancing is done in this study.
4.2 Pre-processing
There are two pre-processing phases in this work. The first step is to balance the data for class six by summing the mean and median attribute values for 28 records. The balanced data is then normalized to avoid the overfitting problem in the classifier using Z-score normalization as in equation (1).
The notion and process of placing multiple parameters on the very same scale are known as Z-score normalization. The Z-score is an extremely important data statistic since it enables a data manager to determine the likelihood of a score happening inside the data normally distributed. It also allows the administrator to evaluate two distinct ratings derived from various information standard normal distribution.
4.3 Attribute selection using particle swarm optimization
In this stage, the pre-processed data is put through an optimization procedure to find the best characteristics out of a total of 34. It is determined by solving equation (2) objective function for optimization.
The particle swarm uses the following procedure to find the two optimum characteristics based on this equation and the accompanying Table 2 initialization values.
PSO Initialization parameters
| Variable name | Value |
|---|---|
| Swarm count | 50 |
| Iterations (it) | 100 |
| Lower bound | [1 1] |
| Upper bound | [34 34] |
| Learning coefficients for swarms S1 and S2 | 1.5 and 2.0 |
Individuals, known as a particle, were “capable of flying” through a hyper-dimensional solution space in PSO. Variations in the location of particles inside the search area are predicated on people’s social-psychological propensity to imitate other people’s opinions. A particle’s search behavior is thus influenced by the activity of many other particles in the swarm. The selection procedure seems to be that particles probabilistically returned to previously popular places in the searching space as a result of replicating these behavioral patterns.
The use of particle swarms to identify prey based on bird movements has been developed [28]. The particles are used to figure out which features are most useful in predicting skin diseases. Here, two lower and higher boundary conditions are used, encompassing the range [1 1 to 34 34]. A hundred times were performed on every one of the 50 particles or birds. Particle mobility is limited by the S1 and S2 learning factors, which have values of 1.5 and 2. Overall iteration best solution (OIBS) and current iteration best solution (CIBS) are the two speed-up options for particle movement. The speed is updated using both OIBS and CIBS. These components result in the next position (NP) and velocity (V) update equations.
The swarm updates its locations and finds the two best characteristics from the pre-processed dataset using the aforementioned equations.
4.4 Attribute evaluation using feed-forward neural network
As illustrated in Figure 2, the feed-forward neural network is trained with 70% of the best records from the specified characteristics in this stage. A feedforward network’s purpose is to estimate a mapping function and input to a classification. A feedforward system creates a mapping and trains the values of parameters which create great estimations of the functionality. The data flows from the inputs to the functional getting assessed, then to the intermediate calculations necessary to define it, and finally to the result. That there were no feedback links; therefore, the model’s outputs do not respond to the valuable feedback into it [29].

FFFN process flow.
The optimum characteristics from the previous phase are used as inputs. Each input has its own weights based on the Levenberg–Marquardt function, which are modified in the hidden layer by multiplying with the Gaussian function. Finally, a single hidden layer with 10 hidden neurons is used to connect the input and output classes. The network is trained with the best attribute using this method. The trained network is then tested using 30% of the dataset to assess the particle swarm optimization-selected characteristic. Calculating the accuracy of the testing dataset is used to do the attribute assessment.
After that, using multi-objective moth flame optimization, the best cluster distance is found.
4.5 Cluster distance selection using Moth flame optimization
In this stage, the optimal attribute data is put through an optimization procedure to find the best cluster distance for k-means clustering. It is determined by solving equation (7) objective function for optimization.
MFO is a metaheuristics paradigm that replicates the cognition of moth, known as transverse orientation, which is employed to travel in an environment, and the effectiveness of MFO has been proven to be rather good in existing works to tackle clustering-based difficulties. The MFO’s advantages, such as convergence speed to the global optimal solution as well as the ability to ignore local optima, are taken advantage of. Moths and their locations are assumed to be potential answers and issue variables, accordingly, by the algorithm. Moths may change their location vectors and fly in multiple dimensions search domains. As with other optimization techniques, MFO starts with a randomized set of feasible solutions within the boundary’s region [30].
The moth flames use the following procedure to find the optimal K-means clustering distance based on these equations and the accompanying Table 2 initialization values.
Here, the MFO process to select the optimal cluster distance from three distance metrics such as Euclidean, squared Euclidean, and city block. The actual straight-line difference between adjacent places in Euclidean space is measured by Euclidean distance that could be squared to given things being further apart increasingly more value; this isn’t a metric, but that’s a good way to compare distances. Moreover, the absolute discrepancies in the locations of the two particles are investigated using city block lengths. The traditional distance function or metrics of Euclidean geometry is substituted by a new measurement wherein the distance between two is equivalent to the total of their Cartesian variable’s absolute differences (Table 3).
MFO Initialization parameters
| Variable name | Value |
|---|---|
| Search agents | 50 |
| Iterations (it) | 100 |
| Lower bound | [1] |
| Upper bound | [3] |
However, it obtains two solutions in MFO for moth and light. Moth denotes the search agent, which roams the search area in quest of the best solution [31]. The light shows the solution’s best cluster distance. As a result, both of these strategies were utilized to update the moth position. The moth travels in a logarithmic spiral movement (MLSM) in this case, as shown in equation (8).
The letters M and L stand for moth and light, respectively. The letters I and j stand for the moth and light numbers, respectively. The constant values for b and t should be between −1 and 1. In equation (8), the quantity d denotes the spacing between the moth and the light. The spacing between moth and light is given in equation (9).
Because moths are drawn to artificial light, the following condition was utilized to update the position of the insect.
The terms
The moth updates its locations and its flames and finds the optimal cluster distance for the clustering process using the aforementioned equations.
4.6 K-means clustering
K-Means is a centroid-based technique that assigns a median to each cluster. The main goal of this technique is to reduce the number of ranges among data points and the clusters that they belong to. It is an iterative technique that splits unprocessed information into k groups, for each dataset belonging to only one group of similar qualities.
The ideal distance metric from MFO, as well as records holding the optimal attributes, was sent into the K-means clustering at this stage. The distance between the point and the centroid is then used to allocate the data points to each category. It will be paired with the data point with the shortest distance cluster centroid. It is based on equation (11) following function.
The term CP in equation (11) shows where the data point belongs in the clusters. If the data point is part of that cluster, it will be 1; otherwise, it will be 0. Number of classes (NC) = 6 and Number of records (NR) = 375 in this case. Mean k is used to signify the cluster’s centroid, which is provided in equation 12.
Using these equations, the optimized dataset is classified using K-means clustering and then subjected to the performance evaluation.
4.7 Performance evaluation
The accuracy of unsupervised categorization by K-means clustering is assessed using the Accuracy measure.
Three measures are used to evaluate attribute selection using FFNN: accuracy, sensitivity, and specificity.
4.7.1 Research gap identifications
The proportion of correct predictions (including true positives and true negatives) among the total number of instances studied is known as accuracy.
4.7.2 Sensitivity
The capacity of a test to accurately discover records that do have a particular illness is referred to as sensitivity.
4.7.3 Specificity
The capacity of a test to accurately reject a record without a particular disease is referred to as specificity.
5 Implementation and discussion
The proposed approach was implemented in this study using the MATLAB R2020b program in a Windows 10 environment. Any three-variable optimization issue with two inequity style restrictions can be solved using particle swarm optimization algorithms. In MATLAB scripts which can be added to the Linked data, the programs can simply be modified to include more variables and restrictions. MATLAB can examine larger amounts of data and scale it up to cluster quickly.
The input for the processing in MATLAB is taken in the form of Excel data as shown in Figure 3.

Input dataset format.
Pre-processing is applied to the input dataset, and the values are normalized using Z-score normalization, which transforms the values in the dataset from 0 to 3 to different values as seen in Figure 4.

Pre-process output.
The pre-processed data is then submitted to particle swarm optimization to pick the best attribute, with the associated convergence curve for attribute selection illustrated in Figure 5.

PSO convergence curve.
From Figure 5, it is observed that the optimal attribute is determined after the 20th iteration itself and the corresponding objective function value is 0.47 at the end of the process. From the PSO, it was observed that the scalp involvement and clubbing of the rete edges were important attributes of the classification process.
The records with the best attributes are then put through a neural network to see how well they choose their attributes. Figure 6 depicts the network’s training procedure.

FFNN training.
Then, the FFNN is tested with the testing dataset, then it is evaluated using evaluation metrics and is shown in Figure 7.

Attribute selection evaluation.
Then, the optimal cluster distance for the optimal records is determined using Moth flame optimization and the corresponding convergence curve is shown in Figure 8.
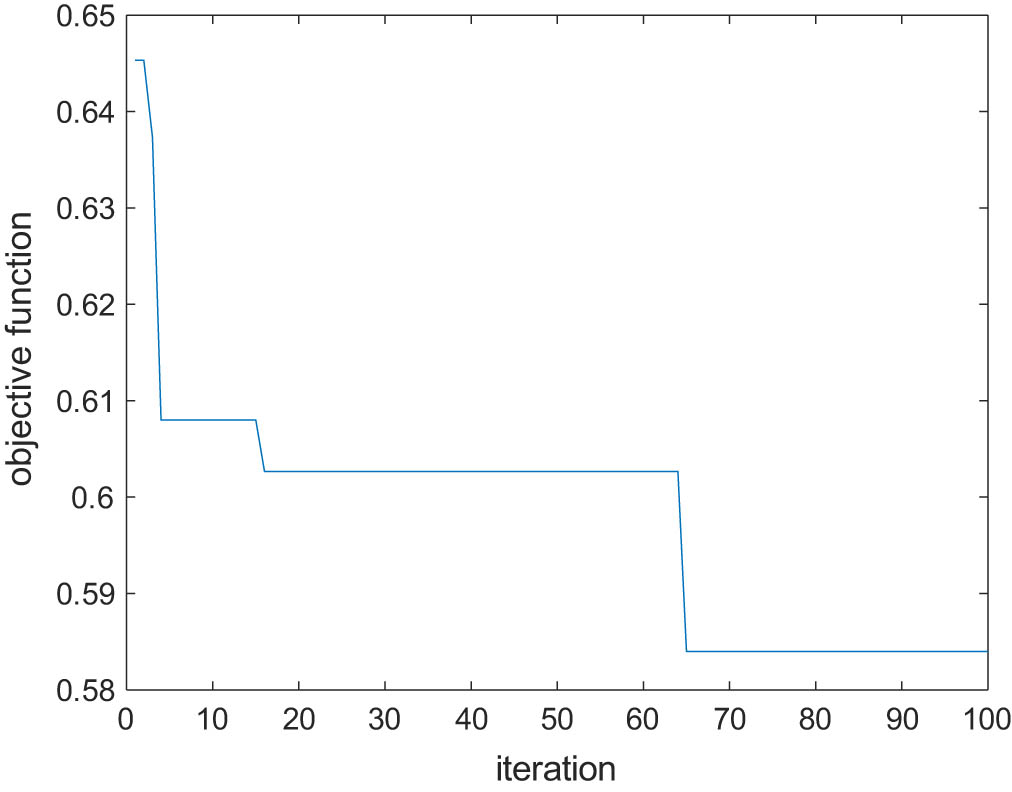
MFO convergence curve.
Finally, from MFO, the optimal distance for K-means clustering is selected as a city-block, and the optimal dataset is classified using an unsupervised algorithm called K-means clustering, and its performance is evaluated in terms of accuracy as shown in Figure 9.

Evaluated in terms of accuracy.
The comparison between the existing and proposed approaches in terms of performance evaluation is listed in Tables 4 and 5.
Attribute selection comparison
| Metric | PSO-original data | PSO-normalized data |
|---|---|---|
| Accuracy | 75 | 100 |
| Sensitivity | 100 | 94.29 |
| Specificity | 100 | 98.70 |
Overall performance comparison
| Metric | PSO | PSO-MFO |
|---|---|---|
| Accuracy | 75 | 85 |
Table 4 compares the performance of the testing dataset with original and adjusted data for attribute selection using an improved feed-forward neural network. The proposed normalized method increased the accuracy to 100%. It shows that it can categorize all six classes; however, identifying the specific classes is decreased by 6% when compared to prior studies.
The purpose of this article, on the other hand, is to undertake an unsupervised classification using only a few parameters to discover sickness subgroups and give effective treatment. As a result, Table 5 compares the performance of the current and proposed work.
Table 5 demonstrates that when compared to previous work, the suggested increased its unsupervised classification accuracy by 10%. It was accomplished utilizing MFO and a normalized dataset, as well as cluster distance selection. As a result, the suggested hybrid PSO-MFO is ideal for data mining in the categorization of skin disorders.
6 Conclusion
Multi-objective-based Hybrid optimal clustering was used in this work. The findings of their experiments were compared to the existing particle swarm-based clustering approach. Six types of ESDs are included in the dataset, all of which have redness (erythema) as a symptom that causes cell death (squamous). The UCI skin diseases undergo various process steps to determine the optimal attribute and optimal cluster distance for clustering. The research provided comprehensive results for all tests, as well as tables and illustrations for various comparisons. Three distinct performance measures generated from the multiclass confusion matrix were used to make the comparisons. They’re accuracy, sensitivity, and specificity. Based on the results, it was observed that the proposed method improved its performance over the existing work.
The normalization and data balance improved the prediction process.
The attribute selection reduces the computational time for processing the testing data.
The cluster distance selection improved the unsupervised prediction accuracy.
7 Future work
In the future, an ideal clustering technique will be chosen to enhance all of the assessment criteria for the prediction process.
-
Conflict of interest: Authors state no conflict of interest.
References
[1] Kumar VB, Kumar SS, Saboo V. Dermatological disease detection using image processing and machine learning. In 2016 Third International Conference on Artificial Intelligence and Pattern Recognition (AIPR). Xiamen, China: IEEE; 2016, September. p. 1–6.10.1109/ICAIPR.2016.7585217Search in Google Scholar
[2] Raghavendra S, Indiramma M. Hybrid data mining model for the classification and prediction of medical datasets. Int J Knowl Eng Soft Data Paradig. 2016;5(3–4):262–84.10.1504/IJKESDP.2016.084603Search in Google Scholar
[3] Lahijanian B, Farahani FV, Zarandi MF. A new multiple classifier system for diagnosis of erythemato-squamous diseases based on rough set feature selection. In 2016 IEEE International Conference on Fuzzy Systems (FUZZ-IEEE). Vancouver, BC, Canada: IEEE; 2016, July. p. 2309–16.10.1109/FUZZ-IEEE.2016.7737981Search in Google Scholar
[4] Fidan U, Ozkan N, Calikusu I. Clustering and classification of dermatologic data with Self Organization Map (SOM) method. In 2016 Medical Technologies National Congress (TIPTEKNO). Antalya, Turkey: IEEE; 2016, October. p. 1–4.10.1109/TIPTEKNO.2016.7863075Search in Google Scholar
[5] Maghooli K, Langarizadeh M, Shahmoradi L, Habibi-Koolaee M, Jebraeily M, Bouraghi H. Differential diagnosis of erythmato-squamous diseases using classification and regression tree. Acta Inform Med. 2016;24(5):338–42.10.5455/aim.2016.24.338-342Search in Google Scholar PubMed PubMed Central
[6] Shakeel P, Manogaran G. Prostate cancer classification from prostate biomedical data using ant rough set algorithm with radial trained extreme learning neural network. Health Technol. 2018;10(1):157–65. 10.1007/s12553-018-0279-6.Search in Google Scholar
[7] Geetha BK. Diagnosis of erythemato techniques. Aust J Basic Appl Sci. 2017;11(5):45–51.Search in Google Scholar
[8] Dabowsa NIA, Amaitik NM, Maatuk AM, Aljawarneh SA. A hybrid intelligent system for skin disease diagnosis. In 2017 International Conference on Engineering and Technology (ICET). Antalya, Turkey: IEEE; 2017, August. p. 1–6.10.1109/ICEngTechnol.2017.8308157Search in Google Scholar
[9] Maryam Setiawan NA, Wahyunggoro O. A hybrid feature selection method using multiclass SVM for diagnosis of erythemato-squamous disease. In AIP Conferemce Proceedings. vol. 1867, no. 1. AIP Publishing LLC; 2017, August. p. 020048.10.1063/1.4994451Search in Google Scholar
[10] Rani S. A dual phase probabilistic model for dermatology classification. In Computer communication, networking and internet security. Singapore, Austrailia: Springer; 2017. p. 443–50.10.1007/978-981-10-3226-4_45Search in Google Scholar
[11] Parikh KS, Shah TP. Feature selection paradigm using weighted probabilistic approach. Int J Adv Sci Technol. 2017;100(3):1–14.10.14257/ijast.2017.100.01Search in Google Scholar
[12] Oladele TO, Aro TO, Segun AS. Skin diseases predictive model using individual base and ensemble base approach. Comput Inf Syst. 2018;22(3):143–52.Search in Google Scholar
[13] Al-Tashi Q, Rais H, Abdulkadir SJ. Hybrid swarm intelligence algorithms with ensemble machine learning for medical diagnosis. In 2018 4th International Conference on Computer and Information Sciences (ICCOINS). Kuala Lumpur, Malaysia: IEEE; 2018, August: p. 1–6.10.1109/ICCOINS.2018.8510615Search in Google Scholar
[14] Çetin A, Gökhan T. Differential diagnosis of erythematous squamous diseases with feature selection and classification algorithms. In Nature-Inspired Intelligent Techniques for Solving Biomedical Engineering Problems. Newziland: IGI Global; 2018; p. 103–29.10.4018/978-1-5225-4769-3.ch005Search in Google Scholar
[15] Verma AK, Pal S, Kumar S. Comparison of skin disease prediction by feature selection using ensemble data mining techniques. Inform Med Unlocked. 2019;16:100202.10.1016/j.imu.2019.100202Search in Google Scholar
[16] Ahilan A, Babu GC, Murugan NS, Parthasarathy A, Manogaran G, Raja C, et al. Segmentation by fractional order darwinian particle swarm optimization based multilevel thresholding and improved lossless prediction based compression algorithm for medical images. IEEE Access. 2019;7:89570–80. 10.1109/access.2019.2891632.Search in Google Scholar
[17] Abikoye OC, Komolafe RG, Aro TO. Performance evaluation of feature selection algorithms on skin disease prediction.Search in Google Scholar
[18] Fidan U, Uzunhisarcikli E, Çalikuşu İ. Classification of dermatological data with self organizing maps and support vector machine. Afyon Kocatepe Üniver Fen Ve Mühendislik Bilimleri Derg. 2019;19(3):894–901.10.35414/akufemubid.591816Search in Google Scholar
[19] Marini F, Walczak B. Particle swarm optimization (PSO). A tutorial. Chemometrics Intell Lab Syst. 2015;149:153–65.10.1016/j.chemolab.2015.08.020Search in Google Scholar
[20] Verma AK, Pal S, Kumar S. Prediction of different classes of skin disease using machine learning techniques. In Smart innovations in communication and computational sciences. Singapore: Springer; 2021. p. 91–100.10.1007/978-981-15-5345-5_8Search in Google Scholar
[21] Verma AK, Pal S, Tiwari BB. Skin disease prediction using ensemble methods and a new hybrid feature selection technique. Iran J Computer Sci. 2020;3(4):207–16.10.1007/s42044-020-00058-ySearch in Google Scholar
[22] Pal M, Roy BR. Evaluating and enhancing the performance of skin disease classification based on ensemble methods. In 2020 2nd International Conference on Advanced Information and Communication Technology (ICAICT). UIU, Dhaka, Bangladesh: IEEE; 2020, November. p. 439–43.10.1109/ICAICT51780.2020.9333529Search in Google Scholar
[23] Verma AK, Pal S, Kumar S. Prediction of skin disease using ensemble data mining techniques and feature selection method – a comparative study. Appl Biochem Biotechnol. 2020;190(2):341–59.10.1007/s12010-019-03093-zSearch in Google Scholar PubMed
[24] Saravanan V, Pralhaddas KD, Kothari DP, Isaac Woungang. An optimizing pipeline stall reduction algorithm for power and performance on multi-core CPUs. Hum Cent Comput Inf Sci. 2015;5:2. 10.1186/s13673-014-0016-8.Search in Google Scholar
[25] https://archive.ics.uci.edu/ml/datasets/dermatology#:∼:text=The%20diseases%20in%20this%20group,many%20histopathological%20features%20as%20well.Search in Google Scholar
[26] Mathan K, Kumar PM, Panchatcharam P, Manogaran G, Varadharajan R. A novel Gini index decision tree data mining method with neural network classifiers for prediction of heart disease. Autom Embedded Syst. 2018;22(3):225–42. 10.1007/s10617-018-9205-4.Search in Google Scholar
[27] Sathishkumar VE, Park J, Cho Y. Using data mining techniques for bike sharing demand prediction in metropolitan city. Computer Commun. 2020;153:353–66. 10.1016/j.comcom.2020.02.007.Search in Google Scholar
[28] Al-Kahlout BI, Naeem MM, Shepherd MJ. ANN for the classification of eryhemato-squamous disease. Gaza, Palestine; 2021Search in Google Scholar
[29] Mirjalili S. Moth-flame optimization algorithm: A novel nature-inspired heuristic paradigm. Knowl Syst. 2015;89:228–49.10.1016/j.knosys.2015.07.006Search in Google Scholar
[30] Kumar PM, Hong CS, Afghah F, Manogaran G, Yu K, Hua Q, et al. Clouds proportionate medical data stream analytics for internet of things-based healthcare systems. IEEE J Biomed Health Inform. 2022 Mar;26:973–82. 10.1109/JBHI.2021.3106387.Search in Google Scholar PubMed
[31] Reddy BR. A novel approach for diagnosis of dermatologic diseases based on multi-objective clustering using particle swarm optimization. Turkish J Computer Math Educ (TURCOMAT). 2021;12(9):1161–72.Search in Google Scholar
© 2022 Ravinder Reddy Baireddy and R. Nagaraja, published by De Gruyter
This work is licensed under the Creative Commons Attribution 4.0 International License.
Articles in the same Issue
- Research Articles
- Construction of 3D model of knee joint motion based on MRI image registration
- Evaluation of several initialization methods on arithmetic optimization algorithm performance
- Application of visual elements in product paper packaging design: An example of the “squirrel” pattern
- Deep learning approach to text analysis for human emotion detection from big data
- Cognitive prediction of obstacle's movement for reinforcement learning pedestrian interacting model
- The application of neural network algorithm and embedded system in computer distance teach system
- Machine translation of English speech: Comparison of multiple algorithms
- Automatic control of computer application data processing system based on artificial intelligence
- A secure framework for IoT-based smart climate agriculture system: Toward blockchain and edge computing
- Application of mining algorithm in personalized Internet marketing strategy in massive data environment
- On the correction of errors in English grammar by deep learning
- Research on intelligent interactive music information based on visualization technology
- Extractive summarization of Malayalam documents using latent Dirichlet allocation: An experience
- Conception and realization of an IoT-enabled deep CNN decision support system for automated arrhythmia classification
- Masking and noise reduction processing of music signals in reverberant music
- Cat swarm optimization algorithm based on the information interaction of subgroup and the top-N learning strategy
- State feedback based on grey wolf optimizer controller for two-wheeled self-balancing robot
- Research on an English translation method based on an improved transformer model
- Short-term prediction of parking availability in an open parking lot
- PUC: parallel mining of high-utility itemsets with load balancing on spark
- Image retrieval based on weighted nearest neighbor tag prediction
- A comparative study of different neural networks in predicting gross domestic product
- A study of an intelligent algorithm combining semantic environments for the translation of complex English sentences
- IoT-enabled edge computing model for smart irrigation system
- A study on automatic correction of English grammar errors based on deep learning
- A novel fingerprint recognition method based on a Siamese neural network
- A hidden Markov optimization model for processing and recognition of English speech feature signals
- Crime reporting and police controlling: Mobile and web-based approach for information-sharing in Iraq
- Convex optimization for additive noise reduction in quantitative complex object wave retrieval using compressive off-axis digital holographic imaging
- CRNet: Context feature and refined network for multi-person pose estimation
- Improving the efficiency of intrusion detection in information systems
- Research on reform and breakthrough of news, film, and television media based on artificial intelligence
- An optimized solution to the course scheduling problem in universities under an improved genetic algorithm
- An adaptive RNN algorithm to detect shilling attacks for online products in hybrid recommender system
- Computing the inverse of cardinal direction relations between regions
- Human-centered artificial intelligence-based ice hockey sports classification system with web 4.0
- Construction of an IoT customer operation analysis system based on big data analysis and human-centered artificial intelligence for web 4.0
- An improved Jaya optimization algorithm with ring topology and population size reduction
- Review Articles
- A review on voice pathology: Taxonomy, diagnosis, medical procedures and detection techniques, open challenges, limitations, and recommendations for future directions
- An extensive review of state-of-the-art transfer learning techniques used in medical imaging: Open issues and challenges
- Special Issue: Explainable Artificial Intelligence and Intelligent Systems in Analysis For Complex Problems and Systems
- Tree-based machine learning algorithms in the Internet of Things environment for multivariate flood status prediction
- Evaluating OADM network simulation and an overview based metropolitan application
- Radiography image analysis using cat swarm optimized deep belief networks
- Comparative analysis of blockchain technology to support digital transformation in ports and shipping
- IoT network security using autoencoder deep neural network and channel access algorithm
- Large-scale timetabling problems with adaptive tabu search
- Eurasian oystercatcher optimiser: New meta-heuristic algorithm
- Trip generation modeling for a selected sector in Baghdad city using the artificial neural network
- Trainable watershed-based model for cornea endothelial cell segmentation
- Hessenberg factorization and firework algorithms for optimized data hiding in digital images
- The application of an artificial neural network for 2D coordinate transformation
- A novel method to find the best path in SDN using firefly algorithm
- Systematic review for lung cancer detection and lung nodule classification: Taxonomy, challenges, and recommendation future works
- Special Issue on International Conference on Computing Communication & Informatics
- Edge detail enhancement algorithm for high-dynamic range images
- Suitability evaluation method of urban and rural spatial planning based on artificial intelligence
- Writing assistant scoring system for English second language learners based on machine learning
- Dynamic evaluation of college English writing ability based on AI technology
- Image denoising algorithm of social network based on multifeature fusion
- Automatic recognition method of installation errors of metallurgical machinery parts based on neural network
- An FCM clustering algorithm based on the identification of accounting statement whitewashing behavior in universities
- Emotional information transmission of color in image oil painting
- College music teaching and ideological and political education integration mode based on deep learning
- Behavior feature extraction method of college students’ social network in sports field based on clustering algorithm
- Evaluation model of multimedia-aided teaching effect of physical education course based on random forest algorithm
- Venture financing risk assessment and risk control algorithm for small and medium-sized enterprises in the era of big data
- Interactive 3D reconstruction method of fuzzy static images in social media
- The impact of public health emergency governance based on artificial intelligence
- Optimal loading method of multi type railway flatcars based on improved genetic algorithm
- Special Issue: Evolution of Smart Cities and Societies using Emerging Technologies
- Data mining applications in university information management system development
- Implementation of network information security monitoring system based on adaptive deep detection
- Face recognition algorithm based on stack denoising and self-encoding LBP
- Research on data mining method of network security situation awareness based on cloud computing
- Topology optimization of computer communication network based on improved genetic algorithm
- Implementation of the Spark technique in a matrix distributed computing algorithm
- Construction of a financial default risk prediction model based on the LightGBM algorithm
- Application of embedded Linux in the design of Internet of Things gateway
- Research on computer static software defect detection system based on big data technology
- Study on data mining method of network security situation perception based on cloud computing
- Modeling and PID control of quadrotor UAV based on machine learning
- Simulation design of automobile automatic clutch based on mechatronics
- Research on the application of search algorithm in computer communication network
- Special Issue: Artificial Intelligence based Techniques and Applications for Intelligent IoT Systems
- Personalized recommendation system based on social tags in the era of Internet of Things
- Supervision method of indoor construction engineering quality acceptance based on cloud computing
- Intelligent terminal security technology of power grid sensing layer based upon information entropy data mining
- Deep learning technology of Internet of Things Blockchain in distribution network faults
- Optimization of shared bike paths considering faulty vehicle recovery during dispatch
- The application of graphic language in animation visual guidance system under intelligent environment
- Iot-based power detection equipment management and control system
- Estimation and application of matrix eigenvalues based on deep neural network
- Brand image innovation design based on the era of 5G internet of things
- Special Issue: Cognitive Cyber-Physical System with Artificial Intelligence for Healthcare 4.0.
- Auxiliary diagnosis study of integrated electronic medical record text and CT images
- A hybrid particle swarm optimization with multi-objective clustering for dermatologic diseases diagnosis
- An efficient recurrent neural network with ensemble classifier-based weighted model for disease prediction
- Design of metaheuristic rough set-based feature selection and rule-based medical data classification model on MapReduce framework