
Behavior feature extraction method of college students’ social network in sports field based on clustering algorithm
-
Yonggang Wang


Abstract
In order to improve the integrity of the social network behavior feature extraction results for sports college students, this study proposes to be based on the clustering algorithm. This study analyzes the social network information dissemination mechanism in the field of college students’ sports, obtains the real-time social behavior data in the network environment combined with the analysis results, and processes the obtained social network behavior data from two aspects of data cleaning and de-duplication. Using clustering algorithm to determine the type of social network user behavior, setting the characteristics of social network behavior attributes, and finally through quantitative and standardized processing, get the results of college students’ sports field social network behavior characteristics extraction. The experimental results showed that the completeness of the method feature extraction results improved to 9.93%, and the average extraction time cost was 0.344 s, with high result integrity and obvious advantages in the extraction speed.
1 Introduction
As a social phenomenon, sport is an integral part of human beings. Physical education is not only a part of education but also a part of life. It belongs to people’s social living conditions. Therefore, college physical education plays a leading role in the physical and mental development of college students. Sports can promote blood circulation, improve heart function, improve respiratory system function, and promote the growth and development of skeletal muscle, which has a positive effect on college students. However, in the actual process of physical exercise, college students need to rely on theoretical knowledge for related physical exercise and carry out technical exchanges with professionals to ensure the safety of physical exercise. For this reason, a social network was designed and developed for college students in the field of sports.
A social network is a system composed of multiple individuals or groups connected by certain relationships. The relationship mentioned here exists in every aspect of society, such as the teaching relationship between coaches and team members, the antagonistic relationship between opponents, the neighborhood relationship between families, and the mutual help relationship between friends [1]. The early research on social networks stayed in the field of sociology, and some breakthroughs in substantive research actively promoted the development and popularization of network science. A social network is the abstract extension of people’s real communication network. The development of information technology provides conditions for users to record their status, contact friends, and form social circles on social networks. Social network analysis has become a hot interdisciplinary, with many research results. The existing achievements of social network analysis generally focus on the research of information rules in the network, the analysis of user group characteristics, and the mining of community. Users in social networks generate a lot of data on the platform every day, which provides a lot of raw material for social network analysis and research. Similar to real life, social network users also have user behavior characteristics worth exploring through blogs, forums, and other social network platforms. With the continuous expansion of user scale and enrichment of user level in social networks, social networking sites such as microblogs, blogs, and forums are becoming important channels for Netizens to obtain real-time information and disseminate all kinds of information. When choosing a social networking platform, information acquisition, exchange of views, and other factors are becoming the key factors for users to choose a platform and determine their behavior. User behavior reflects the characteristics of self-personality in social networks and reflects its real personality to a certain extent. In order to fully understand the situation of college students’ sports and ensure a stable operation of social networks in the field of college students’ sports, this study puts forward the method of behavior feature extraction and analysis of social networks in the field of college students’ sports.
Feature extraction refers to the method and process of using a computer to extract the characteristic information in the image. It is a method of transforming the group measurement values of the first mock exam to highlight the typical characteristics of the pattern, through image analysis and transformation to extract the required features. Through analyzing of feature extraction methods, the research results of feature extraction methods for college students’ social network behavior in the sports field at home and abroad include: Li and Han [2] explored an effective customer behavior mining algorithm that can improve the mining acceleration ratio, reduce the error rate, and ensure the reliability and practicability of behavior mining. In order to solve the problem of high error and low acceleration of customer behavior mining processing, a customer behavior mining algorithm based on online shopping feature extraction was proposed. Using the regularization estimation method minimized the regression line estimates and variance characteristic parameter estimates and obtained the coordinate line and the variance characteristic parameters combined with the coordinate algorithm and Karush-Kuhn-Tucker conditions. The online shopping criteria were used to excavate the best mining results corresponding to the regression line and variance characteristics parameters and complete the customer behavior mining. Men et al. [3] conducted predictive studies of patients with depression using online tools to analyze the language and behavioral characteristics of social network users. Self-disclosed depression information was collected from Twitter to extract information on language and behavioral characteristics of depressed and normal users on social networks. Based on the analysis and verification of the feature information, machine learning algorithms were used to predict depressed users. It was found that users’ verbal and behavioral features on social networks can reflect their psychological state, and the various kinds of features extracted from them can be used for the detection of depressed users. Random forest classifiers performed best in the user prediction methods for depression. Empath-based word category features have the highest predictive scores among different types of categories, while the topic features rank lower. Li et al. [4] adopted many classical clustering algorithms to provide a new solution for big data clustering. A birch was fitted into MapReduce, which was called mr-birch. Compared with a large number of algorithms based on MapReduce, mr-birch only loaded the data set once, and the data set was processed in parallel on multiple machines. The complexity and scalability of mr-birch were analyzed to evaluate the quality of mr-birch, and the wide application of mr-birch and wireless sensor networks has attracted a lot of research work. Kumar et al. [5] proposed an improved load balancing clustering (modified GA-based load balanced clustering algorithm for wireless sensor networks based on a genetic algorithm. It was better than the genetic algorithm based load balancing clustering (galbc) algorithm because it balanced the load by considering the residual energy. The results showed that this method is superior to galbc in energy consumption, the number of active sensor nodes, and network lifetime.
However, the above feature extraction methods have the problems of low timeliness and poor application performance in the actual operation process, so the innovative point of this study is the introduction of a clustering algorithm to improve the behavioral feature extraction of social networks. The clustering algorithm is important in data mining. According to the similarity between objects, they are divided into several groups called “clusters,” and the objects in a cluster have high similarity. With the continuous development of clustering algorithms, it is no longer regarded as an abstract mathematical method; it began to solve interdisciplinary problems and more emerging ideas were introduced. In this study, a cologne filter was used to process the original data before using a clustering algorithm. Then, the clustering algorithm was applied to the social network behavior feature extraction of sports college students, and the behavior feature vector extracted by the clustering algorithm was normalized and interval aligned, which improved the accuracy of traditional feature extraction.
The research process of this study was as follows: Analyze the mechanism of the propagation of social network information, the design process collects the social network behavior data, use the Cologne filter to process the social network behavior data, determine the type of social network user behavior using the clustering algorithm, and complete the extraction of the social network behavior characteristics of college students. Comparative experiments show that the design method somewhat improves the accuracy of the behavioral feature extraction, and indirectly improves the application value of the feature extraction results.
2 A method of extracting behavior characteristics of college students’ social networks in the sports field
2.1 Social network information dissemination mechanism in college students’ sports field
The spread range of social information in the field of college students’ sports was affected by many factors such as the scale of the social network of information publishers, the number of strong contact chains, the frequency of contact, the communication power of contact objects and so on. In the social network of college students’ sports field, a message sent by the initial node
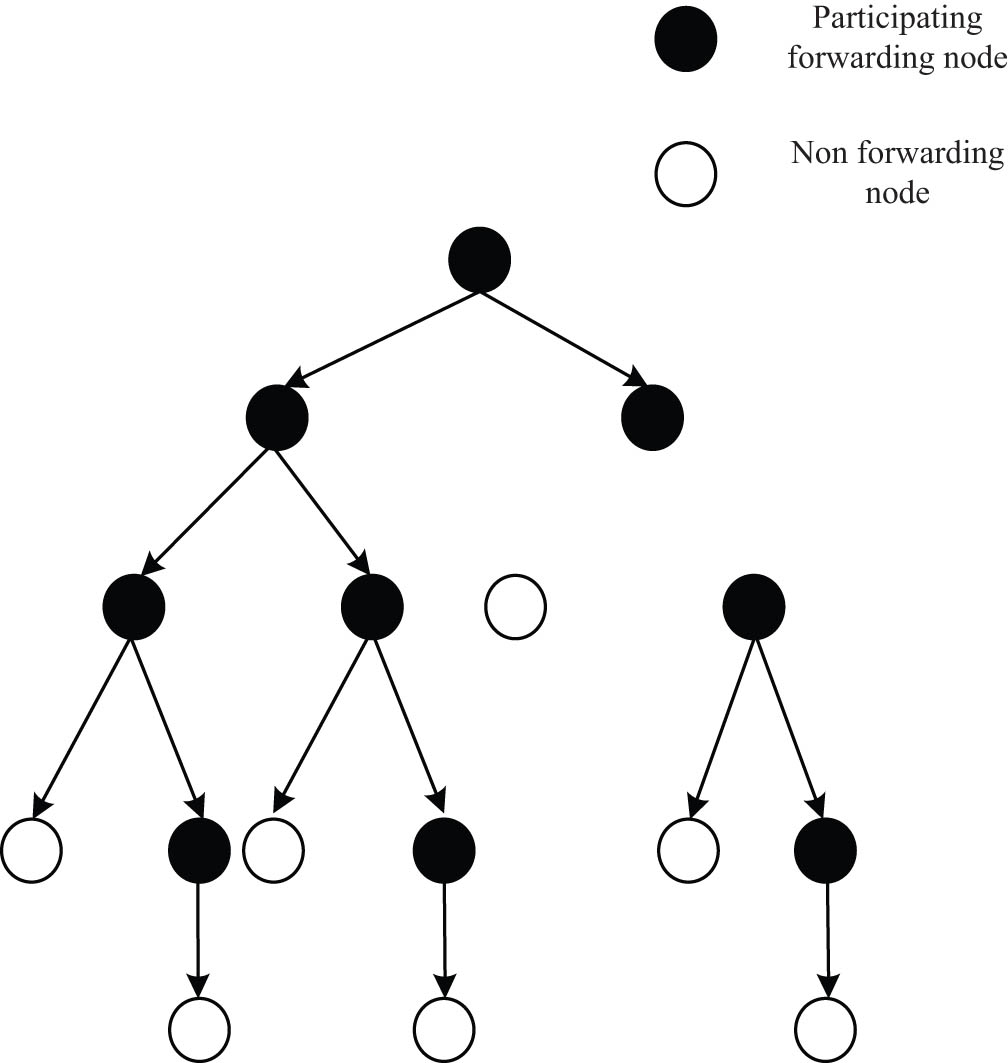
The information forwarding tree of social networks in college students’ sports field.
In addition, the range of nodes affected by the information dissemination in the social network of college students’ sports field refers to the collection of all nodes forwarding the information from the initial node
2.2 Getting social network behavior data
Under the social network of college students’ sports field, all users’ real-time data information was obtained and stored. Before obtaining the user information on Microblog, it was necessary to determine a Microblog user as the starting point of the crawling data, by entering the user name or nickname, and searching among the crawled users. If the user name existed, it was the starting point to start crawling data; if the user name did not exist, it was necessary to change the starting user name [6]. Taking this point as the starting point of data acquisition, the web crawler was used to achieve real-time data acquisition. The specific data acquisition process is shown in Figure 2.
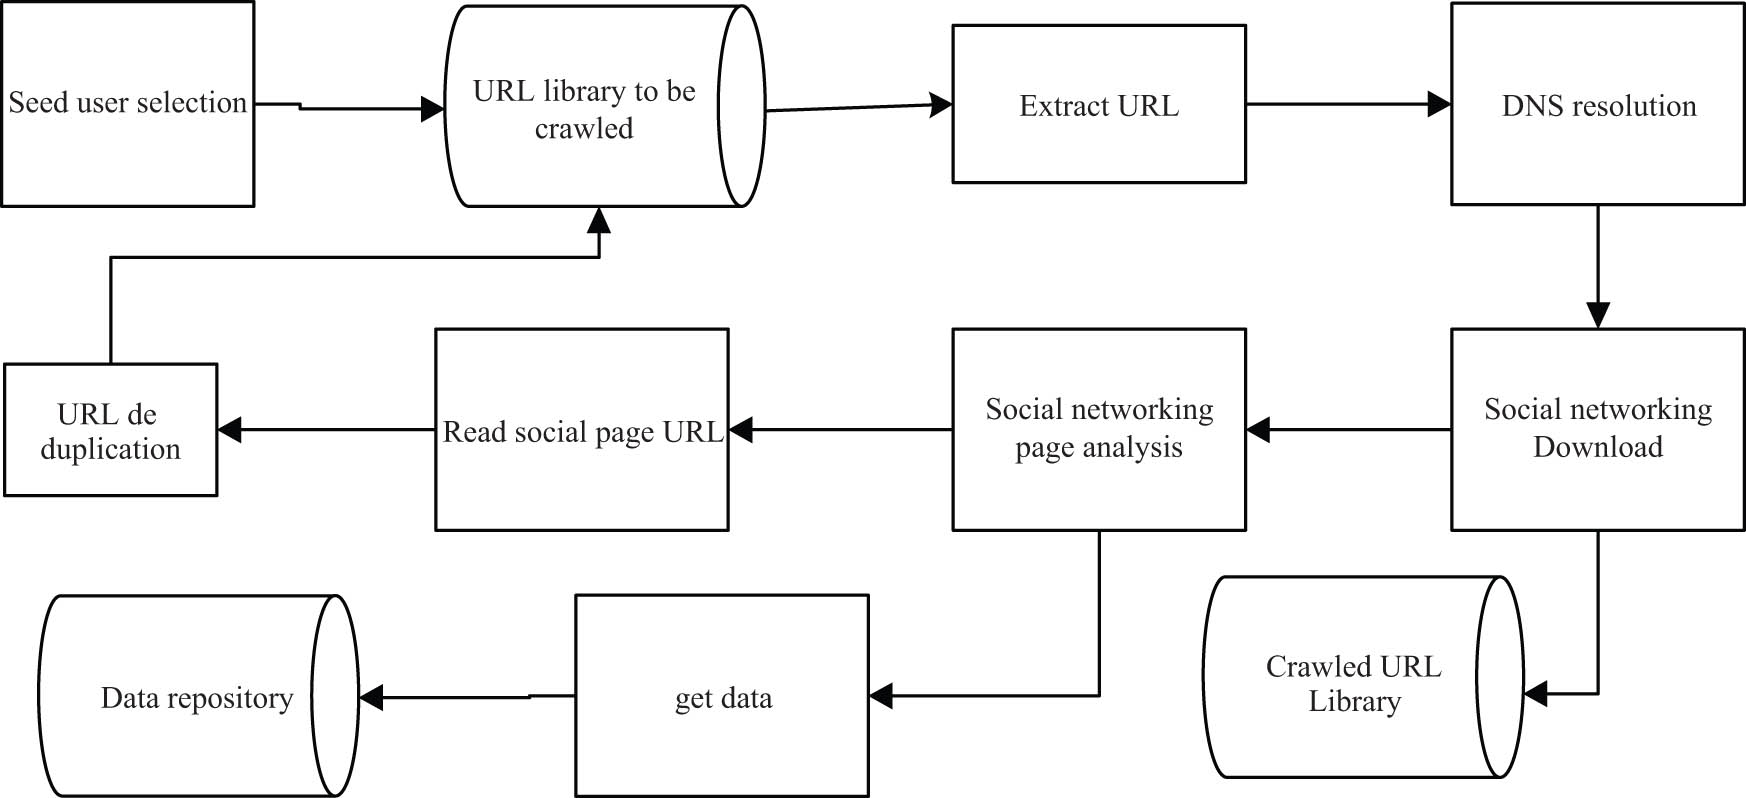
Real-time data acquisition flow chart of the social network.
Most popular social networks in the field of college students’ Sports contain videos and images. For Microblogs containing images, you can find “feed”_ list_ media_. Then we can use the regular expression to match the ID of the image and get the real address of the image http://ww1.sinaima.cn/bmiddle/pic_id [7]. At the same time, the crawler system can resolve the video link address accordingly. After obtaining the page address of the image or video, we can download its web page, and use regular expressions to obtain detailed information about the image or video, such as the title and upload time.
2.3 Social network behavior data processing
The obtained social network behavior data were processed from two aspects of data cleaning and de-duplication. Data cleaning mainly completes data format standardization, abnormal data removal, error correction, repeated data removal, and so on. The specific aspect was to remove the noise and irrelevant data in the original data set, fill in the missing data and fields, and identify and delete outliers. In data filtering, data can be cleaned and corrected according to some rules [8]. For example, if the user account field is missing, the record will lose the user identity information; if the URL field is empty, the record will lose the social network site information; if the number of timestamp fields was incomplete, the exception will appear after format conversion. This kind of problem can be solved by appropriate abandonment and repair.
In social network behavior data de-reprocessing, bloom filter, and 2 m bit vector were used to express the data set. The first m bits corresponded to k mutually independent hash functions
When the parameter k reached the optimal value, the social network behavior data was de-reprocessed.
2.4 Using a clustering algorithm to determine the type of social network user behavior
According to the processing results of the social network user behavior data in the field of college students’ sports, the network users, the records in the log data that were triggered by the same internet user were identified and were connected to the access records of the same user to get the user’s browsing sequence during this period [10]. In the weblog files stored by the operators, due to the summary of different users’ online records, there was no identification of independent users, so the first task after data cleaning was to identify independent users. On this basis, a clustering algorithm was used to classify user behavior. First, the cluster center was selected randomly and then the cluster center was transferred to a higher density region iteratively until convergence. The cluster center and node distribution of cluster selection are shown in Figure 3.
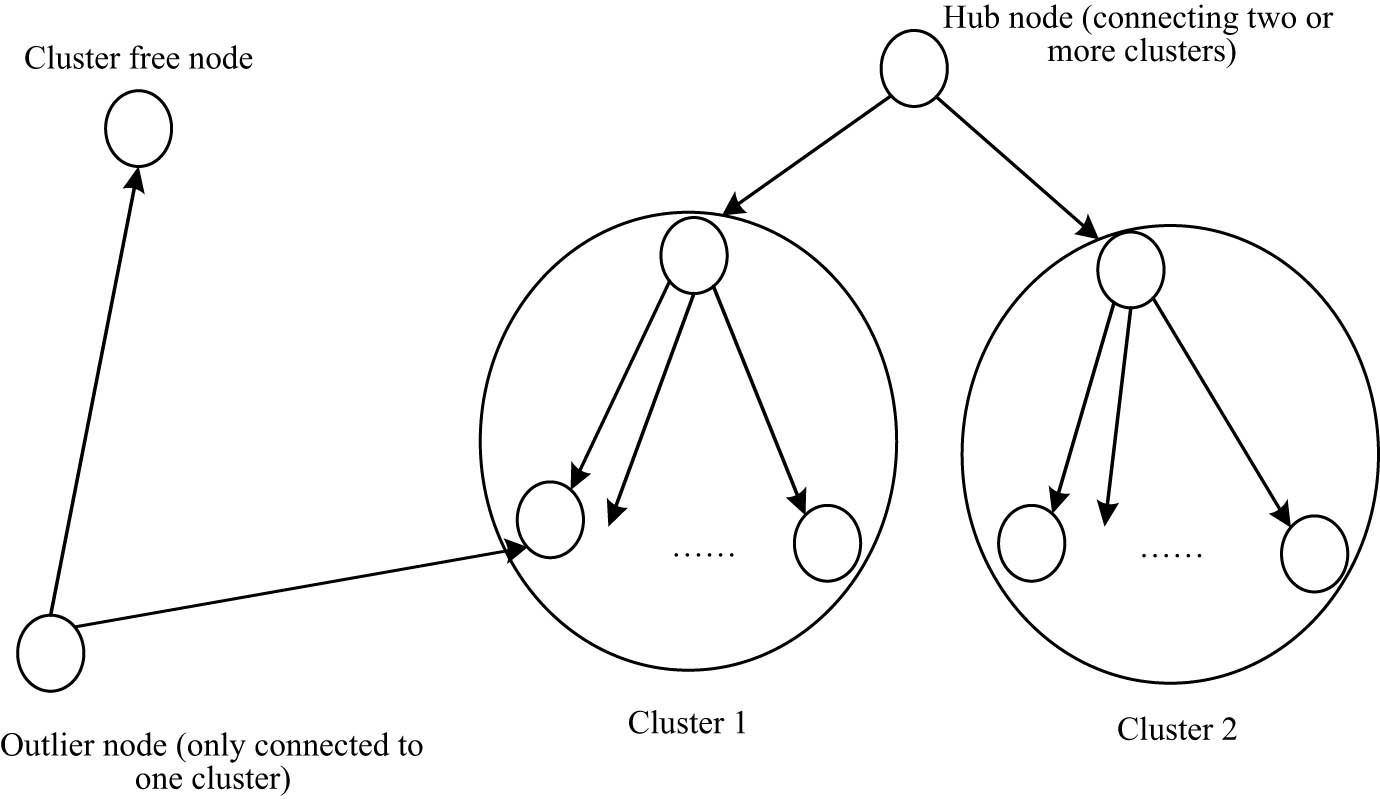
Distribution map of the cluster center and other cluster nodes.
By superimposing the offset vector on the current cluster center coordinate vector, the cluster center was updated, as follows:
The formula
That is, the distance from all sample points to the current cluster center was less than the key parameter, and the parameter
In the formula,
2.5 Set social network behavior characteristics
This study observed user characteristic attributes from the aspects of user access commodity category attributes, access frequency, website stay time, user status and location, and historical access commodity category attributes [12]. The characteristic quantity of network communication behavior selection is shown in Table 1.
Characteristic quantity of network communication behavior selection
| Serial number | Features | Feature description | Attribute |
|---|---|---|---|
| 1 | x1 | Source IP address | Choice |
| 2 | x2 | Destination IP address | Choice |
| 3 | x3 | IP packet header length | Choice |
| 4 | x4 | Source port | Choice |
| 5 | x5 | Destination port | Choice |
| 6 | x6 | Transaction ID | Choice |
| 7 | x7 | Protocol identifier | Choice |
| 8 | x8 | Length | Choice |
| 9 | x9 | Unit identifier | Choice |
| 10 | x10 | Function code | Choice |
| 11 | x11 | Data address | Choice |
| 12 | x12 | Data volume | Choice |
When users browse different pages, each category will visit multiple or multiple times to the same page. This paper studies the user propensity of College Students under different categories, and the ratio of the number of users visiting such pages to the number of users visiting various pages [13]. The access frequency characteristic parameters can be expressed as:
u is all categories, i is one of them,
In the formula,
2.6 Extraction of social network behavior characteristics of college students in the sports field
Based on the setting results of social network behavior characteristics, the quantitative extraction of social network behavior was realized. First, the weight of network behavior was calculated. Taking the weight of a user’s entry and single sentence as an example, the formula of word weight is as follows:
In the above formula,
In the formula,
In the formula, max is the maximum value of feature sample data, min is the minimum value of feature sample data. The horizontal detection was to compare the user’s behavior with other users’ behavior, while the vertical detection was to compare the user’s current behavior with historical behavior.
3 Comparative experimental analysis
In order to test the feature extraction effect of the designed clustering algorithm-based social network behavior feature extraction method in college students’ sports fields, a comparative experiment was designed to show the advantages of this method.
3.1 Experimental environment and parameter setting
There were four machines in the whole operation platform; each machine was equipped with a dual-core Intel (R) core (TM) i5-2400 CPU, the main frequency was 3.1 GHz, the network bandwidth was 100 Mbps, 4 G memory, and 500 GB hard disk [19]. The operating system of each machine was Ubuntu 12.04, the Hadoop version was 1.0.2, and the JDK version was java-1.6.0–495. The IP configuration and node configuration of the four machines are shown in Table 2.
IP configuration and node configuration of operation platform
| Main engine | Host IP address | Node configuration |
|---|---|---|
| Master | 192.168.1.100 | Master and slave |
| Slave1 | 192.168.1.101 | Slave |
| Slave2 | 192.168.1.102 | Slave |
| Slave3 | 192.168.1.103 | Slave |
The configuration process is as follows: Hadoop 1.0.2 tar.gz store in-home/Hadoop and unzip the file. The command was “$tar zvxfhadoop-1.0.2 tar.gz”. Set the environment variable; Hadoop in/home/Hadoop/Hadoop conf directory- env.sh Set the environment variables needed by the Hadoop platform running in Java_ Home was a necessary variable, and Hadoop was not the home variable is optional [20,21]. To configure the conf/Masters and slaves files, you need to configure them on existing machines. Change the configuration file, such as the core site, configure the IP and port number of the machine cluster where the namenode is located – site, and configure the IP and port number of the cluster computer where the job tracker is located.
3.2 The experimental data set
The data sets prepared in the experiment were all from the social network of college students in the field of sports, in which the user’s common friend relationship and user tag information was used to describe the degree of similarity between users. The significance was to reduce the number of users in the network and improve the calculation efficiency of the model. There were a large number of value corpse powder users in the social network of college students’ sports field, ignoring the one-way attention connection can minimize the impact of advertising users and corpse powder users on the accuracy of the model prediction. In social networks, a user tag is an important user attribute information. A user is allowed to enter an open user attribute tag. These user tags are used to express users’ interests and the topics they are concerned about. Through the social network user tag query, the input user can return all the tag information of the user and the corresponding weight of each tag. The specific settings of the user’s original data set in the experiment are shown in Table 3.
Experimental user data set table
| Experimental group | Number of level 1 users | Number of level 2 users | Number of connections | Number of tags |
|---|---|---|---|---|
| Group 1 | 397 | 51,163 | 98,866 | 3,156 |
| Group 2 | 521 | 107,169 | 215,890 | 3,895 |
| Group 3 | 729 | 173,536 | 345,607 | 6,554 |
| Group 4 | 291 | 43,826 | 91,309 | 2,180 |
| Group 5 | 438 | 67,764 | 12,350 | 3,782 |
3.3 Set test index
In this study, the performance of feature extraction was analyzed from the aspects of feature extraction efficiency and integrity. Generally speaking, the result of feature extraction should not be less than 10% of the social network behavior data. By calculating the ratio of the amount of feature extraction result data to the amount of social network behavior data, it can be concluded that the integrity of feature extraction can be reflected. The closer the ratio was to 10%, the more complete was the feature extraction. The efficiency of feature extraction was mainly the running time cost of the social network behavior feature extraction program, which can be directly obtained by retrieving the background data of the running program.
3.4 The process of the experiment
Since the clustering algorithm was applied in the designed behavior feature extraction method, the algorithm needed to transform into program code and imported into the experimental environment. The goal of K-means was to divide the data points into k clusters, s to find the center of each cluster and minimize the function:
Among them,
The calculated matrix D made its diagonal the sum of the value of the column (or row) corresponding to the A matrix and the rest of 0.
Makes the B = D − A;
Seeks the first k eigenvalues and eigenvectors of the B matrix to project the data points into a k-dimensional space. The j value of the i eigenvector represents the projection of the j data point in the i dimension in the k dimension space. That is, if the k feature vectors are combined into a matrix of N*k, then each row represents the coordinates of a data point in the k-dimensional space.
Clusters the data in the k dimension space of each data point, based on the k dimension space coordinates, using K-means or other clustering algorithms.
After the operation of the designed feature extraction method, the results of behavior feature extraction of college students’ social networks in the sports field were obtained, and the quantitative extraction results of the number of social topics are shown in Figure 4.
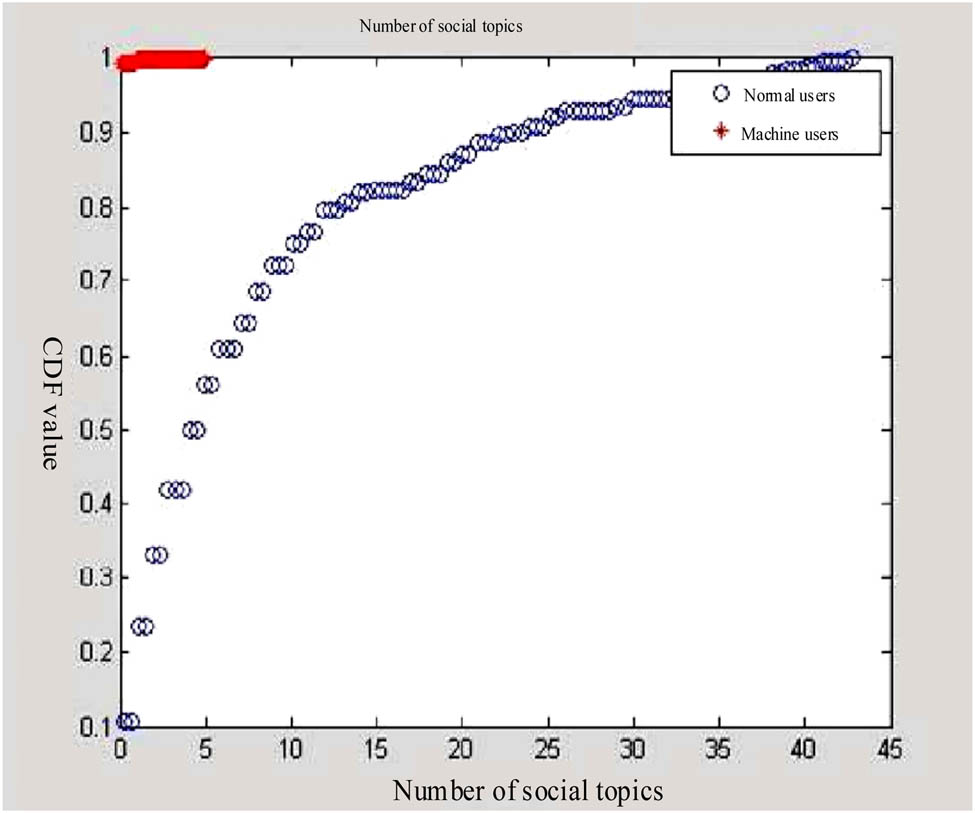
Quantitative extraction results of social network topic number behavior characteristics.
In Figure 4, CDF is a quantitative indicator of the number of social network topics.
In addition, in order to reflect the advantages of the design method, the traditional feature extraction method and the feature extraction method based on worm detection were set as the two contrast methods of the experiment. The contrast method was imported into the experimental environment in the same way, and the final feature extraction result was obtained by calling the prepared data set.
3.5 Comparative analysis of experimental results
After the operation of the three methods, the quantitative comparison results are obtained, as shown in Table 4.
Experimental comparison results
| Experimental group | Document [2] method | Document [3] method | Social network behavior feature extraction method based on design | |||
|---|---|---|---|---|---|---|
| Feature extraction amount/MB | Time cost/s | Feature extraction amount/MB | Time cost/s | Feature extraction amount/MB | Time cost/s | |
| Group 1 | 181.4 | 0.89 | 189.2 | 0.54 | 198.3 | 0.34 |
| Group 2 | 182.5 | 0.85 | 188.7 | 0.66 | 199.4 | 0.36 |
| Group 3 | 179.3 | 0.87 | 185.4 | 0.58 | 196.6 | 0.23 |
| Group 4 | 181.7 | 0.82 | 187.6 | 0.67 | 198.7 | 0.28 |
| Group 5 | 183.2 | 0.91 | 185.9 | 0.63 | 199.5 | 0.51 |
The amount of social network behavior data of college students in the field of sports set in the experiment was 2,000 MB, then through the calculation of the data in Table 4, it can be concluded that the integrity of feature extraction obtained by the three methods was 9.08, 9.37 and 9.93% respectively. In terms of timeliness, the average time cost of the three methods was 0.868, 0.616, and 0.344 s respectively. It was clear that the Social network behavior feature extraction method designed here had better completeness and the feature extraction time was the shortest. This is because this study collected social network behavior data according to the social network information transmission mechanism to ensure the integrity and correlation of data collection, then processes the raw data with Cologne filtering to ensure more clear and complete data. Using a clustering algorithm to extract the social network behavior characteristics of college students in the sports industry, normalized and transformed the extracted behavioral feature vectors, which improved the accuracy of traditional feature extraction.
4 Conclusion
In order to enhance the effect of extracting the sports social network behavior characteristics, this study proposes to be based on the clustering algorithm. The experimental results showed that this method effectively improved the effectiveness and speed of sports social networks. It had a high application value in the behavior recognition of college students’ sports social networks. According to the extraction results of this study, it is important to understand the sports situation of college students and ensure the stable operation of social networks in the field of sports activity.
-
Conflict of interest: Authors state no conflict of interest.
Reference
[1] Navia L, Defit S, Muhammad LJ. Determination of student subjects in higher education using hybrid data mining method with the K-Means algorithm and FP growth. Int J Artif Intell Res. 2021;5(1):91–101.10.29099/ijair.v5i1.223Suche in Google Scholar
[2] Li Y, Han JL. Simulation of customer behavior mining algorithm based on online shopping feature extraction. Computer Simul. 2020;37(5):150–3, 234.Suche in Google Scholar
[3] Men XP, Wei RB, Wu XL. Analysis and detection of language and behavior characteristics of depression in social network. J Mod Inf. 2020;40(6):76–87.Suche in Google Scholar
[4] Li YF, Jiang HT, Lu JY, Li XZ, Sun ZW, Li M. MR-BIRCH: A scalable MapReduce-based BIRCH clustering algorithm. J Intell Fuzzy Syst. 2021;40(3):5295–305.10.3233/JIFS-202079Suche in Google Scholar
[5] Kumar M, Kumar D, Akhtar MAK. A modified GA-based load balanced clustering algorithm for WSN: MGALBC. Int J Embedded Real-time Commun Syst. 2021;12(1):44–63.10.4018/IJERTCS.20210101.oa3Suche in Google Scholar
[6] Ding JY, Yu SS, Wang HN, Xu W, Li ZZ. Member structure and sharing behavior: Social network analysis of CALIS online cataloging data in China. J Acad Libr. 2020;46(2):102115.10.1016/j.acalib.2020.102115Suche in Google Scholar
[7] Martyshkin AI, Perekushikhina AN, Zotkina AA. Research groups of users in social networks based on their interests and behavior based on a variety of data sources. XXI Century: Resumes of the Past and Challenges of the Present Plus; 2020. Available from: https://repository.kvantor.org/public/92/2694?lang=en.10.46548/21vek-2020-0951-0005Suche in Google Scholar
[8] Mahmoudi A. Identifying biased users in online social networks to enhance the accuracy of sentiment analysis: A user behavior-based approach. Social and Information. Networks. 2021;20(12):25–52. 10.48550/arXiv.2105.05950.Suche in Google Scholar
[9] Wang J, Niu X, Wan L. Research on user behavior of online learning based on meta-analysis. J Mod Inf. 2020;40(1):58–68.Suche in Google Scholar
[10] Gareau BJ, Huang X, Gareau TP, DiDonato S. The strength of green ties: Massachusetts cranberry grower social networks and effects on climate change attitudes and action. Clim Change. 2020;162:1613–36.10.1007/s10584-020-02808-0Suche in Google Scholar PubMed PubMed Central
[11] Rosa RL, Silva M, Silva DH, Ayub MS, Carrillo D, Nardelli PHJ, et al. Event detection system based on user behavior changes in online social networks: Case of the COVID-19 pandemic. IEEE Access. 2020;8:158806–25.10.1109/ACCESS.2020.3020391Suche in Google Scholar PubMed PubMed Central
[12] Wu YK, Huang HY, Wu NY, Wang Y, Bhuiyan MZA, Wang T. An incentive-based protection and recovery strategy for secure big data in social networks. Inf Sci. 2020;508(15):79–91.10.1016/j.ins.2019.08.064Suche in Google Scholar
[13] Amoruso M, Anello D, Auletta V, Ferraioli D. Contrasting the spread of misinformation in online social networks. J Artif Intell Res. 2020;69(12):847–79.10.1613/jair.1.11509Suche in Google Scholar
[14] Ryu S, Choi H, Lee H, Kim H. Convolutional autoencoder based feature extraction and clustering for customer load analysis. IEEE Trans Power Syst. 2020;35(2):1048–60.10.1109/TPWRS.2019.2936293Suche in Google Scholar
[15] Ulyanin S, Vazquez-Canteli J, Park JY, Nagy Z. SCAFE: Automated simultaneous clustering and non-linear feature extraction of building energy profiles. J Phys Conf Series. 2020;1343(1):012037. (p. 6).10.1088/1742-6596/1343/1/012037Suche in Google Scholar
[16] Maddumala V, Arunkumar R. Big data-driven feature extraction and clustering based on statistical methods. Traitement du Signal. 2020;37(3):387–94.10.18280/ts.370305Suche in Google Scholar
[17] Zabielski M, Tarapata Z, Kasprzyk R. Adaptive method of similarity detection of user profiles on online social networks. Bull Mil Univ Technol. 2020;68(2):43–57.10.5604/01.3001.0013.3002Suche in Google Scholar
[18] Yu J, Li H, Liu D. Modified immune evolutionary algorithm for medical data clustering and feature extraction under cloud computing environment. J Healthc Eng. 2020;2020:1051394.10.1155/2020/1051394Suche in Google Scholar PubMed PubMed Central
[19] Nguyen VX, Xiao G, Zhou J, Li GQ, Li BB. Bias in social interactions and emergence of extremism in complex social networks. Chaos. 2020;30(10):103110.10.1063/5.0009943Suche in Google Scholar PubMed
[20] Qiao SB, Pang SC, Wang M, Zhai X, Dai F. Online video popularity regression prediction model with multichannel dynamic scheduling based on user behavior. Chin J Electron. 2021;30(5):876–84.10.1049/cje.2021.06.010Suche in Google Scholar
[21] Canteloup C, Puga-Gonzalez I, Sueur C, Waal EVD. The effects of data collection and observation methods on uncertainty of social networks in wild primates. Am J Primatol. 2020;82(7):12–6.10.1002/ajp.23137Suche in Google Scholar PubMed
© 2022 Yonggang Wang and Haiou Sun, published by De Gruyter
This work is licensed under the Creative Commons Attribution 4.0 International License.
Artikel in diesem Heft
- Research Articles
- Construction of 3D model of knee joint motion based on MRI image registration
- Evaluation of several initialization methods on arithmetic optimization algorithm performance
- Application of visual elements in product paper packaging design: An example of the “squirrel” pattern
- Deep learning approach to text analysis for human emotion detection from big data
- Cognitive prediction of obstacle's movement for reinforcement learning pedestrian interacting model
- The application of neural network algorithm and embedded system in computer distance teach system
- Machine translation of English speech: Comparison of multiple algorithms
- Automatic control of computer application data processing system based on artificial intelligence
- A secure framework for IoT-based smart climate agriculture system: Toward blockchain and edge computing
- Application of mining algorithm in personalized Internet marketing strategy in massive data environment
- On the correction of errors in English grammar by deep learning
- Research on intelligent interactive music information based on visualization technology
- Extractive summarization of Malayalam documents using latent Dirichlet allocation: An experience
- Conception and realization of an IoT-enabled deep CNN decision support system for automated arrhythmia classification
- Masking and noise reduction processing of music signals in reverberant music
- Cat swarm optimization algorithm based on the information interaction of subgroup and the top-N learning strategy
- State feedback based on grey wolf optimizer controller for two-wheeled self-balancing robot
- Research on an English translation method based on an improved transformer model
- Short-term prediction of parking availability in an open parking lot
- PUC: parallel mining of high-utility itemsets with load balancing on spark
- Image retrieval based on weighted nearest neighbor tag prediction
- A comparative study of different neural networks in predicting gross domestic product
- A study of an intelligent algorithm combining semantic environments for the translation of complex English sentences
- IoT-enabled edge computing model for smart irrigation system
- A study on automatic correction of English grammar errors based on deep learning
- A novel fingerprint recognition method based on a Siamese neural network
- A hidden Markov optimization model for processing and recognition of English speech feature signals
- Crime reporting and police controlling: Mobile and web-based approach for information-sharing in Iraq
- Convex optimization for additive noise reduction in quantitative complex object wave retrieval using compressive off-axis digital holographic imaging
- CRNet: Context feature and refined network for multi-person pose estimation
- Improving the efficiency of intrusion detection in information systems
- Research on reform and breakthrough of news, film, and television media based on artificial intelligence
- An optimized solution to the course scheduling problem in universities under an improved genetic algorithm
- An adaptive RNN algorithm to detect shilling attacks for online products in hybrid recommender system
- Computing the inverse of cardinal direction relations between regions
- Human-centered artificial intelligence-based ice hockey sports classification system with web 4.0
- Construction of an IoT customer operation analysis system based on big data analysis and human-centered artificial intelligence for web 4.0
- An improved Jaya optimization algorithm with ring topology and population size reduction
- Review Articles
- A review on voice pathology: Taxonomy, diagnosis, medical procedures and detection techniques, open challenges, limitations, and recommendations for future directions
- An extensive review of state-of-the-art transfer learning techniques used in medical imaging: Open issues and challenges
- Special Issue: Explainable Artificial Intelligence and Intelligent Systems in Analysis For Complex Problems and Systems
- Tree-based machine learning algorithms in the Internet of Things environment for multivariate flood status prediction
- Evaluating OADM network simulation and an overview based metropolitan application
- Radiography image analysis using cat swarm optimized deep belief networks
- Comparative analysis of blockchain technology to support digital transformation in ports and shipping
- IoT network security using autoencoder deep neural network and channel access algorithm
- Large-scale timetabling problems with adaptive tabu search
- Eurasian oystercatcher optimiser: New meta-heuristic algorithm
- Trip generation modeling for a selected sector in Baghdad city using the artificial neural network
- Trainable watershed-based model for cornea endothelial cell segmentation
- Hessenberg factorization and firework algorithms for optimized data hiding in digital images
- The application of an artificial neural network for 2D coordinate transformation
- A novel method to find the best path in SDN using firefly algorithm
- Systematic review for lung cancer detection and lung nodule classification: Taxonomy, challenges, and recommendation future works
- Special Issue on International Conference on Computing Communication & Informatics
- Edge detail enhancement algorithm for high-dynamic range images
- Suitability evaluation method of urban and rural spatial planning based on artificial intelligence
- Writing assistant scoring system for English second language learners based on machine learning
- Dynamic evaluation of college English writing ability based on AI technology
- Image denoising algorithm of social network based on multifeature fusion
- Automatic recognition method of installation errors of metallurgical machinery parts based on neural network
- An FCM clustering algorithm based on the identification of accounting statement whitewashing behavior in universities
- Emotional information transmission of color in image oil painting
- College music teaching and ideological and political education integration mode based on deep learning
- Behavior feature extraction method of college students’ social network in sports field based on clustering algorithm
- Evaluation model of multimedia-aided teaching effect of physical education course based on random forest algorithm
- Venture financing risk assessment and risk control algorithm for small and medium-sized enterprises in the era of big data
- Interactive 3D reconstruction method of fuzzy static images in social media
- The impact of public health emergency governance based on artificial intelligence
- Optimal loading method of multi type railway flatcars based on improved genetic algorithm
- Special Issue: Evolution of Smart Cities and Societies using Emerging Technologies
- Data mining applications in university information management system development
- Implementation of network information security monitoring system based on adaptive deep detection
- Face recognition algorithm based on stack denoising and self-encoding LBP
- Research on data mining method of network security situation awareness based on cloud computing
- Topology optimization of computer communication network based on improved genetic algorithm
- Implementation of the Spark technique in a matrix distributed computing algorithm
- Construction of a financial default risk prediction model based on the LightGBM algorithm
- Application of embedded Linux in the design of Internet of Things gateway
- Research on computer static software defect detection system based on big data technology
- Study on data mining method of network security situation perception based on cloud computing
- Modeling and PID control of quadrotor UAV based on machine learning
- Simulation design of automobile automatic clutch based on mechatronics
- Research on the application of search algorithm in computer communication network
- Special Issue: Artificial Intelligence based Techniques and Applications for Intelligent IoT Systems
- Personalized recommendation system based on social tags in the era of Internet of Things
- Supervision method of indoor construction engineering quality acceptance based on cloud computing
- Intelligent terminal security technology of power grid sensing layer based upon information entropy data mining
- Deep learning technology of Internet of Things Blockchain in distribution network faults
- Optimization of shared bike paths considering faulty vehicle recovery during dispatch
- The application of graphic language in animation visual guidance system under intelligent environment
- Iot-based power detection equipment management and control system
- Estimation and application of matrix eigenvalues based on deep neural network
- Brand image innovation design based on the era of 5G internet of things
- Special Issue: Cognitive Cyber-Physical System with Artificial Intelligence for Healthcare 4.0.
- Auxiliary diagnosis study of integrated electronic medical record text and CT images
- A hybrid particle swarm optimization with multi-objective clustering for dermatologic diseases diagnosis
- An efficient recurrent neural network with ensemble classifier-based weighted model for disease prediction
- Design of metaheuristic rough set-based feature selection and rule-based medical data classification model on MapReduce framework