Short and sweet: balancing energy savings and cleaning performance to identify efficient short-cycles for domestic dishwashers
-
Thomas J. Tewes
Thomas J. Tewes, M.Sc. studied Food Science in Kleve and currently works as a principal scientist at Rhine-Waal University of Applied Sciences in the field of hygiene and microbiology.
 ,
Laurence Harcq
,
Laurence Harcq
Laurence Harcq Engineer in Biochemistry, studied Biochemistry in Brussels and worked in Sugar Manufactory (Raffinerie Tirlemontoise) before joining Procter & Gamble in Brussels where worked in different R&D positions in the field ranging from Hand Dish Liquids to New Business Development, Air Care before becoming Europe Autodish R&D Senior Scientist.
,
Pauline Minot
Pauline Minot, Engineer in Chemistry, studied Chemistry in Paris (at Ecole Nationale Superieure de Chimie de Paris, ENSCP) and worked in different R&D positions at Procter & Gamble in Brussels, in the field ranging from Hard Surface Cleaners, to Liquid laundry detergent, Laundry pods before becoming Europe Autodish R&D Director
,
Martin ter Bekke
Martin ter Bekke studied Biology/Science and Business Management in Utrecht before joining Procter & Gamble. In his current position as Director Scientific Communications for the European Fabric and Home Care division his focus area is to bring together the internal technical expertise and product propositions and external experts, stakeholder believes and consumers needs to help shape business strategies and brand communication.
und
Dirk P. Bockmühl
Prof. Dr. Dirk P. Bockmühl, Microbiologist, studied Biology in Düsseldorf and worked in different positions in the field of laundry and home care in a consumer goods company, before joining Rhine-Waal University of Applied Sciences in 2010 as a professor for Hygiene and Microbiology.


Abstract
Optimizing the energy efficiency of household appliances is crucial to appliance manufacturers, energy suppliers, governments and, almost importantly, consumers. For the reliable cleaning of normally soiled dishes, consumers can save energy by using Eco-programs instead of Intensive- or Auto-programs, but this means that they have to accept cleaning times of up to 4 h. Consequently, the acceptance for these programs is not very high, despite consumers’ high willingness to save energy and water. Short-cycles that run for less than 55 min and use equal to less energy on average than Eco-programs have a high consumer potential. However, according to manufacturers, these are rather designed for lightly soiled or pre-treated dishes. Considering the Sinner’s circle, the cleaning result depends on the interaction of temperature, time, mechanics and chemistry, so we investigated the extent to which using a commercially available detergent, thus fully exploiting the “chemistry” component of the Sinner’s circle, can save time, temperature, water and, most importantly, energy in the end. Our results show that there are Short-program combinations using a commercially available detergent that reliably clean normally soiled dishes in less than 55 min and typically 30–40 min with significantly lower energy consumption than average Eco-cycles.
1 Introduction
Energy-efficient household appliances are becoming increasingly important. For example, dishwashers have improved significantly over the last 20 years to save more than 30 % of energy consumption and reduce average water consumption per wash cycle by more than 50 %. 1 The Eco-program was defined as a test program for declaration purposes and therefore has the lowest possible energy and water consumption when effectively cleaning normally soiled dishes and using a standard detergent. 2 The low consumption is mainly being achieved due to the very long run time, at relatively low temperatures of typically about 50 °C. According to Sinner, 3 the cleaning process requires the interaction of temperature, chemistry (detergents), mechanics, and the washing time. 4 A satisfactory cleaning performance can only be achieved if the individual parameters are appropriately pronounced. However, the Sinner’s circle also suggests that it is possible to compensate a decrease in one of the parameters by increasing another without negatively affecting the cleaning result. This option is frequently used today when creating optimized programs, i.e. in case of the above-mentioned Eco-programs by lowering the temperature while increasing the program duration. 4 According to a 2016 study, dishwashers with low energy and water consumption are desired by many consumers. 5 However, they are not consistently used by the majority of consumers and have limited acceptance. 2 , 6 As a possible reason for this, a 2007 consumer study involving approximately 2,500 households from 10 European countries found that a Short-program duration was important to 18.5 % of users. 7 A Greek study showed that convenience is one of the main reasons for owning dishwashers, 8 which may also account for the preference for Short-programs. A survey showed that the desire to save energy and water is the main reason for choosing Short-programs. 9 What the survey does not clarify is how many people stating to select Short-programs because of water and energy savings also had dishes that were only lightly soiled. 9 This is important because there are indeed very economical Short-programs, which can have lower or similar energy and water consumption than Eco-programs, but according to the manufacturers, these are designed for rather lightly soiled dishes. 10 Whether it is possible to achieve comparable cleaning results to the Eco-program by fully exploiting the Sinner’s circle, i.e., by compensating for the lack of time with an effective dishwashing detergent, is the subject of a study we have recently published, 11 which concludes that cleaning results similar to those of some Eco-programs can be achieved with certain Short-cycle/detergent combinations. Short-cycles, which consume little energy and water, can represent an economical and convenient alternative to the long-lasting Eco-programs, provided that the cleaning performance achieved satisfies the consumer. In our previous study 12 we show a listing of various program parameters of Short-cycles (and other cycle types) of different dishwasher models. To be able to compare the performance of detergents in Short-cycles, it would be helpful to define a “proxy” Short-cycle that can a) represent an average Short-cycle being present in most of the appliances on the market and b) allows to evaluate the cleaning performance of a detergent under standardized conditions.
In this work, we aim to propose some proxy Short-cycles that should provide optimum performance, convenience (short duration) and sustainability (mainly energy saving). For this purpose, based on previous studies, 11 , 12 we focused on the evaluation of the cleaning performance within a certain range of parameters. Different program variations were investigated based on seven different soiling types. A high-performance market product was used as well as the International Electrotechnical Commission (IEC) reference detergent D with standard reference rinse aid type C. 13
Thus, this work might be a useful resource for appliance and detergent manufacturers, and consumers alike, providing important insights for the Short-cycle design development of future dishwashers that meet both consumer-specific needs, convenience and environmental concerns like water and energy saving.
2 Materials and methods
A freely programmable dishwasher was used to study different low consumption time-temperature profiles for their cleaning effectiveness. One branded dishwasher detergent and IEC reference detergents 13 were tested for their cleaning performance under the different test conditions. Five different presoiled tiles (CFT; Center for Testmaterials B.V.) served as test soils, as well as plates with baked creme brûlée and soiled teacups that were prepared according to the IKW protocol: Recommendations for the Quality Assessment of the Cleaning Performance of Dishwasher Detergents (Part B, Update 2015). The machines were loaded with an additional 50 g of ballast during each run according to the IKW protocol. The cleaning performance was evaluated by image analysis and the cups and plates by a trained panelist who compared the cleaned items with the scales from the IKW protocol. 14
2.1 Dishwasher and cycle test parameters
A standard household (85 cm height, 60 cm depth, 60 cm width) dishwasher (Bosch E-Nr.: SMS2ITW33 E/34, Robert Bosch Hausgeräte GmbH, Munich, Germany) was technically modified, so that it was freely programmable.
The total duration of the test cycles was set to 20 min, 30 min and 40 min. Three different main wash temperatures were used (40 °C, 45 °C and 50 °C). The water volumes were 8 L, 9 L or 10 L in total. The rinse cycle was performed at 50 °C and, in addition, cycle combinations with 50 °C in the main wash cycle were tested at 40 °C in the rinse cycle. Table 1 shows a list of all program parameter combinations and a subsequently used coding of the individual test programs from 1 to 36.
Tested short-cycle parameter combinations.
| Code | T main (°C) | Time (min) | Water (L) | T rinse (°C) |
|---|---|---|---|---|
| 1 | 40 | 20 | 8 | 50 |
| 2 | 40 | 20 | 9 | 50 |
| 3 | 40 | 20 | 10 | 50 |
| 4 | 45 | 20 | 8 | 50 |
| 5 | 45 | 20 | 9 | 50 |
| 6 | 45 | 20 | 10 | 50 |
| 7 | 50 | 20 | 8 | 50 |
| 8 | 50 | 20 | 9 | 50 |
| 9 | 50 | 20 | 10 | 50 |
| 10 | 50 | 20 | 8 | 40 |
| 11 | 50 | 20 | 9 | 40 |
| 12 | 50 | 20 | 10 | 40 |
| 13 | 40 | 30 | 8 | 50 |
| 14 | 40 | 30 | 9 | 50 |
| 15 | 40 | 30 | 10 | 50 |
| 16 | 45 | 30 | 8 | 50 |
| 17 | 45 | 30 | 9 | 50 |
| 18 | 45 | 30 | 10 | 50 |
| 19 | 50 | 30 | 8 | 50 |
| 20 | 50 | 30 | 9 | 50 |
| 21 | 50 | 30 | 10 | 50 |
| 22 | 50 | 30 | 8 | 40 |
| 23 | 50 | 30 | 9 | 40 |
| 24 | 50 | 30 | 10 | 40 |
| 25 | 40 | 40 | 8 | 50 |
| 26 | 40 | 40 | 9 | 50 |
| 27 | 40 | 40 | 10 | 50 |
| 28 | 45 | 40 | 8 | 50 |
| 29 | 45 | 40 | 9 | 50 |
| 30 | 45 | 40 | 10 | 50 |
| 31 | 50 | 40 | 8 | 50 |
| 32 | 50 | 40 | 9 | 50 |
| 33 | 50 | 40 | 10 | 50 |
| 34 | 50 | 40 | 8 | 40 |
| 35 | 50 | 40 | 9 | 40 |
| 36 | 50 | 40 | 10 | 40 |
The selection of the proportionate amounts of water and time in individual phases is derived from an average of four known and studied Short-cycles (Supplementary Material S1).
In addition to the programmed Short-cycles, an average Eco-cycle according to Tewes et al. 12 was programmed. The water consumption was 10.95 L (4.07 L main wash, 3.34 L rinse one, 3.54 L final rinse), the cycle length was 197 min, main wash temperature 50 °C. The final rinse temperature was 50 °C. The temperature time curve of the programmed Eco-cycle can be found in Supplementary Material S2.
2.2 Dishwasher program sequence
All cycles were programmed to start after pressing the main button of the device. An initial drain phase starts first, even there should not be any water in the device. The drain phase stops automatically after a while when an internal sensor detects that no longer water is drained. After that, the machine gets filled with water for the main wash cycle. This all takes place in the phase “A” shown in Figure 1. Then the cleaner compartment (dispenser) of the dishwasher opens. The heating phase starts combined with the activity of the spray arms (main wash). The pump runs at 3,500 revolutions per minute (rpm). Alternately, the lower spray arm is used first in equal proportions of time, then the upper spray arm. This process is repeated. The heating element switches off after reaching the programmed temperature, and the program continues to the programmed cycle length. After the main wash is done the water is drained again. The whole process from heating, cleaning and draining is represented as “B” (Figure 1). A first rinse cycle is initiated with the inlet of fresh water, but without heating the water. First the lower spray arm operates, then the upper spray arm and then the water is drained again (phase “C”). For the last phase “D”, fresh water is admitted for the final rinse phase. After the inlet, if the reference detergent is used, the rinse aid is added manually for the IEC reference detergent. If the multifunctional market product is used, no action is taken at this point. Again, both spray arms run twice for equal amounts of time while simultaneously heating the water to the final rinse temperature. The heating element is turned off after this temperature is reached and a final drain phase occurs after the rinse phase is complete. The cycle is then completed.

Typical program sequence with its different phases, such as initial draining and water inlet phase (A); heating with working of the spray arms under the action of the detergent and draining of the water from the main wash cycle (B); inlet of fresh water and rinsing without heating, without detergent and draining of the water (C); inlet of new water, if necessary, dosing of rinse aid and heating with working of the spray arms and final draining of the water (D).
2.3 Dishwashing detergents
For the examinations, either a branded multifunctional product that weighed about 18 g, or the reference detergent D (Wfk Testgewebe GmbH, Brüggen, Germany) with reference rinse aid C (Wfk Testgewebe GmbH, Brüggen, Germany) according to IEC 60436 13 was used. The dosage for the reference detergent was 14 g and 2 mL rinse aid. The rinse aid was added manually via a pipette by briefly opening the machine after the inlet of new water (at the beginning of phase “D” as shown in Figure 1). The detergent has been chosen, because the IEC standard for testing the cleaning performance of domestic dishwashers uses the reference detergent D. 13 However, this detergent does not resemble a currently available market detergent. In contrast, the IKW test, on which our tests are largely based, was developed to differentiate the cleaning performance of advanced dishwashing detergents. The reference detergent tested is not assumed to not meet these criteria and is primarily used to differentiate the performance of the machines themselves. For this reason, the reference detergent is not expected to have a high cleaning performance; rather, it serves as a control in our work, while the branded, multifunctional product was considered to simulate a more realistic scenario in terms of chemistry. A direct comparison of the methods is comprised in Supplementary Material S3 and a list of ingredients of the used marked product in Supplementary Material S4.
2.4 Preparation of teacups, crème brûlée plates and ballast soil
Both the teacups and the crème brûlée plates were prepared according to the IKW protocol chapter 2 and chapter 9. 14 Fifty gram ballast soil units were produced according to Table 4 production instructions for ballast soil from the IKW “Recommendations for the Quality Assessment of the Cleaning Performance of Dishwasher Detergents”. 14 Therefore, the soiling does not contain particles such as spinach or minced meat, which could provide information about the filter performance, which is important for dishwashers with low water consumption.
2.5 Execution of the dishwasher test runs
Prior to testing the dishwasher was cleaned by running an intensive cycle profile (70 °C main wash temperature). Filters, spray arms and sump were checked before the experiments. Each experiment was performed in triplicates. The programmable dishwasher used hard water according to the IKW protocol, 14 but salt (Somat Salz, Henkel AG & Co KGaA, Düsseldorf, Germany) was added to the machine. The experiments were performed alternately using either reference detergent D/rinse aid C and the market product. Since all-in-one type automatic dishwasher detergents contain water softening agent i.e. effective builder/chelate systems, but the used reference detergent does not, salt was used to enable a comparison between the two detergent types. After every fourth run an intensive cycle with a commercial dishwashing powder (Somat Classic Pulver, Henkel AG & Co KGaA, Düsseldorf, Germany) was started to counteract possible cumulative soiling effects of the interior of the device. Immediately before starting a run of the machine, a cold rinse program was started to set the initial temperature to approximately (18–23) °C. The tests were carried out in an acclimatized laboratory at about 21 °C. After every 100 L water consumption a regeneration cycle was initiated. The water hardness was monitored 20 L after the regeneration cycles, after 60 L and after 100 L (Testbesteck VISOCOLOR® ECO Gesamthärte, Macherey-Nagel GmbH & Co. KG, Düren, Germany) and was constant at (2.3 ± 0.5) °dH.
The CFT-tiles were placed in the upper rack of the dishwashers in the order depicted in Table 2. Two of each CFT-tile types were used, so that after the sequence as shown in Table 2, this sequence was repeated. Thus 10 CFT-tiles were lined up in a row for each run.
Used test soils (CFT-tiles) and their subsequently used abbreviation as well as the manufacturer’s order code.
| Position | Designation | Abbreviation | Order code |
|---|---|---|---|
| 1 | Boiled egg yolk | BEY | DM-25 |
| 2 | Minced meat, double soil load | DM | DM-92 |
| 3 | Cheese, baked | BC | DM-06 |
| 4 | Mixed (corn/rice) starch, coloured with food colourant | MS | DM-71 |
| 5 | Highly discriminative tea | DT | DM-14 |
Five plates with baked crème brûlée were placed in the bottom dishwasher rack and two soiled teacups in the top rack; one in the right corner at the back and one in the left corner of the front. Fifty gram of frozen ballast soil was placed underneath a mug, which was also placed in the upper rack. The described placement of the individual items is shown in Figure 2. Areas marked with “clean” are CFT-tiles or plates without any soiling.
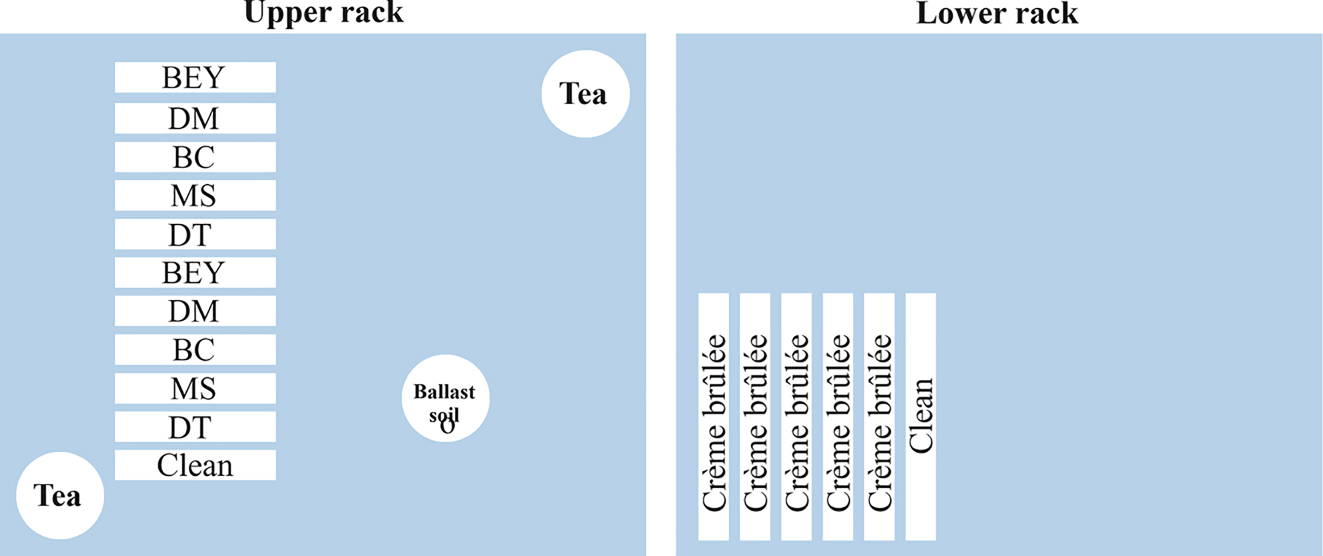
Dishwasher loading plan.
The detergent was placed in the dispenser. After the machine was fully loaded, the respective test program was started and run to completion. A temperature logger TELID311 RFID (Microsens GmbH & Co. KG, Erfurt, Germany) was placed on the empty cutlery basket in the bottom of the device and recorded the temperatures with a measurement interval of 10 s.
2.6 Measurement of energy consumption
The energy consumption was recorded with a power meter CLM 221 (Christ Electronic Systems GmbH, Memmingen, Germany) after the end of the main wash or after the end of the whole program, respectively.
It is important to note that the energy consumption is dependent on the number of place settings in the dishwasher. Compared to the reduced load used here (six plates, two cups, one mug with soiling and the 11 CFT tiles), the actual energy consumption would be higher with a full load. For this reason, the average Eco-cycle was programmed alongside the program codes to be tested and the energy consumption for the Eco-cycle was measured with the test setup and with 13 place settings. 13
2.7 Cleaning performance evaluation
The teacups were rated by a trained panelist based to the 0 to 10 scale according to Figures 3 and 8 of the IKW protocol. 14 All tiles were photographed after the experiments according to standardized conditions in a photo box with LED ring illumination (Shenzhen PULUZ Technology Limited, Guangdong, China). Via a sequence of different MATLAB (MathWorks, Natick, MA, USA) scripts (Supplementary Material S5), the tiles were first automatically optically detected and cut out. The edges of the tiles were cropped by another MATLAB code to only evaluate the surface and not any shadows or edge effects. Then, the average Lab* value of each pre-processed tile photo was determined via MATLAB. To determine the soil removal index (SRI) on the CFT tiles based on the Lab* value, linear three-point regression models were computed in advance for each soiling (MATLAB Regression Learner App). These models included as predictors the information of the average L* and b* values of each of four independent standard series per CFT tile soiling type with 0 % SRI 50 % SRI and 100 % SRI. The SRI values of the tiles were determined after the tests using the standardized and processed photos and their L* and b* values with the corresponding models.
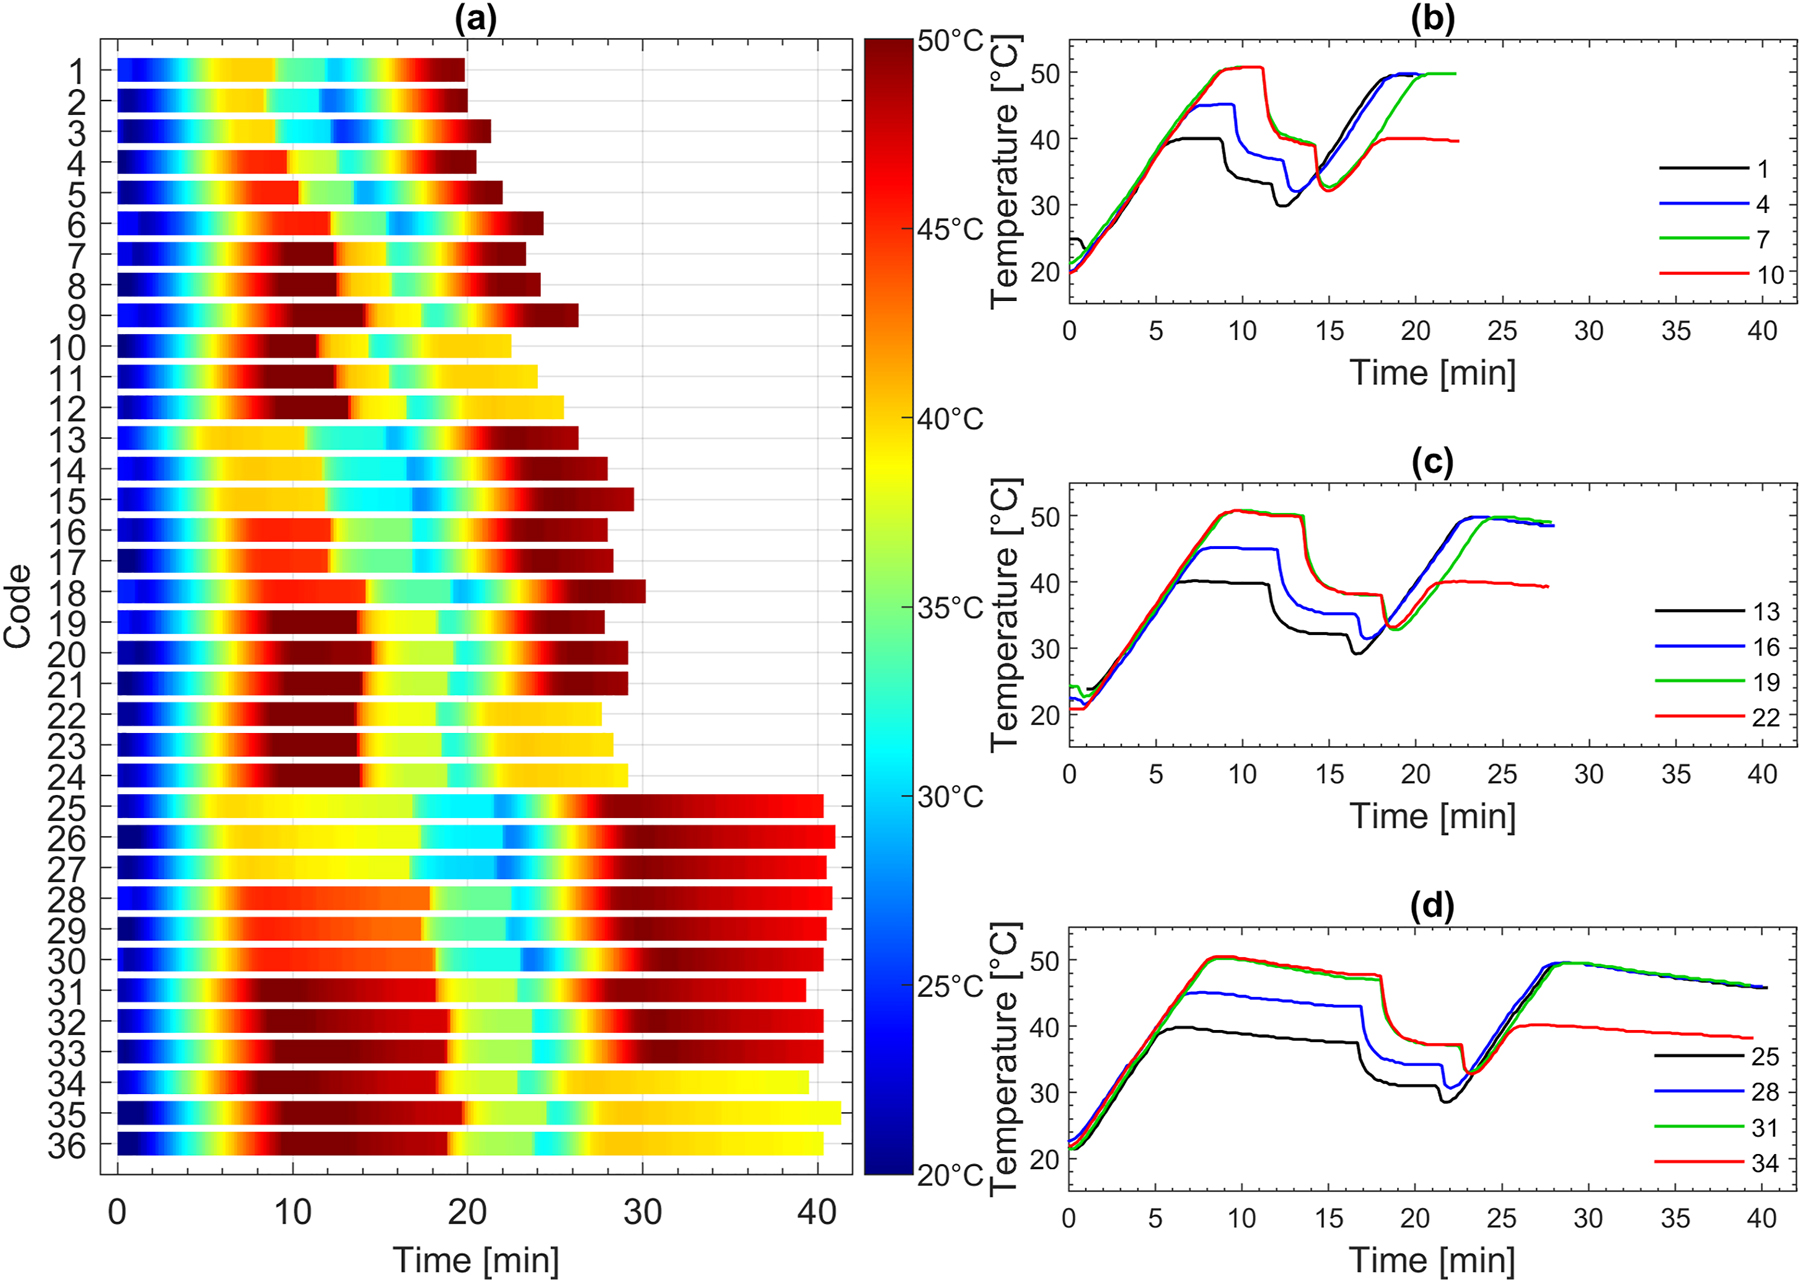
Measured temperature profiles shown in top down view with color-coded temperature (a); exemplary all 20-min cycles with lowest water consumption (b); the corresponding 30-min cycles (c); and 40-min cycles (d); (more detailed explanation of the cycle parameters of individual program codes can be found in Table 1).
2.8 Statistical tests
When significant differences are reported in the results and discussion section, the following methodology was used: When testing the significance of differences in cleaning performance or energy consumption between individual program codes, the data were first tested for normal distribution using the Kolmogorov-Smirnov test, and then unpaired t-tests were applied with Welch’s correction (statistical significance P < 0.05). Significance tests for differences between more than two program codes were carried out after testing the normal distribution using ordinary one-way analysis of variance (ANOVA).
3 Results and discussion
3.1 Temperature-time profiles
Figure 3 lists the temperature/time profiles for each program code. Due to unavoidable time required for the draining phases, water inlet and reaching the target temperatures, some profiles may deviate slightly from their target time, especially for the largest water volume (Table 1). Likewise, a small portion of the initial drain and water inlet time was truncated in the temperature profiles (about 1–2 min), so other minor deviations are possible.
Overall, Figure 3(a) illustrates the basic cycle types with low to high temperatures in the main wash section and the cycles with low rinsing temperature at high main wash temperature. Figure 3(b) depicts selected profiles with 20 min run times in a more common view. Program codes 1, 4, 7, 10 (Figure 3(b)) are the shortest profiles with the lowest water volume (8 L). Figure 3(c) and (d) show the corresponding 30-min and 40-min cycles. It can be seen there that after the first rinse process and the intake of the new water for the final rinse cycle, the temperature may slightly deviate (around 29 °C, 31 °C, 33 °C, depending on the previous main wash temperature of 40 °C, 45 °C or 50 °C, respectively). Thus, the temperature difference to reach the maximum rinse temperature of 50 °C of about 19 °C is almost identical to the average temperature difference from the beginning of a cycle to a main wash temperature of only 40 °C.
3.2 Energy consumption
The energy consumption values shown in Figure 4 are the mean values of the six runs performed for each code (two detergents in triplicate determination). The individual values and standard deviations can be found in Supplementary Material S6. Figure 4 shows the increasing energy consumptions with increasing amount of water (Table 1). For example, the difference between 8 L and 10 L of water accounted for about 0.07 kWh for the shortest cycles (code 1 and code 3) and similarly 0.05 kWh for the corresponding longest cycles (code 25 and code 27). The results also confirm the principle of the Eco-cycles because the energy consumption hardly increases with prolonged durations, since basically only the heating process has a distinct influence on the consumption here. The energy consumption of the tested Eco-cycle was the highest with 0.362 kWh until the end of the main wash and 0.623 kWh in total, although the difference to some tested Short-cycles (e.g. codes 21 and 33) was small (0.054 and 0.069 kWh in total, respectively).
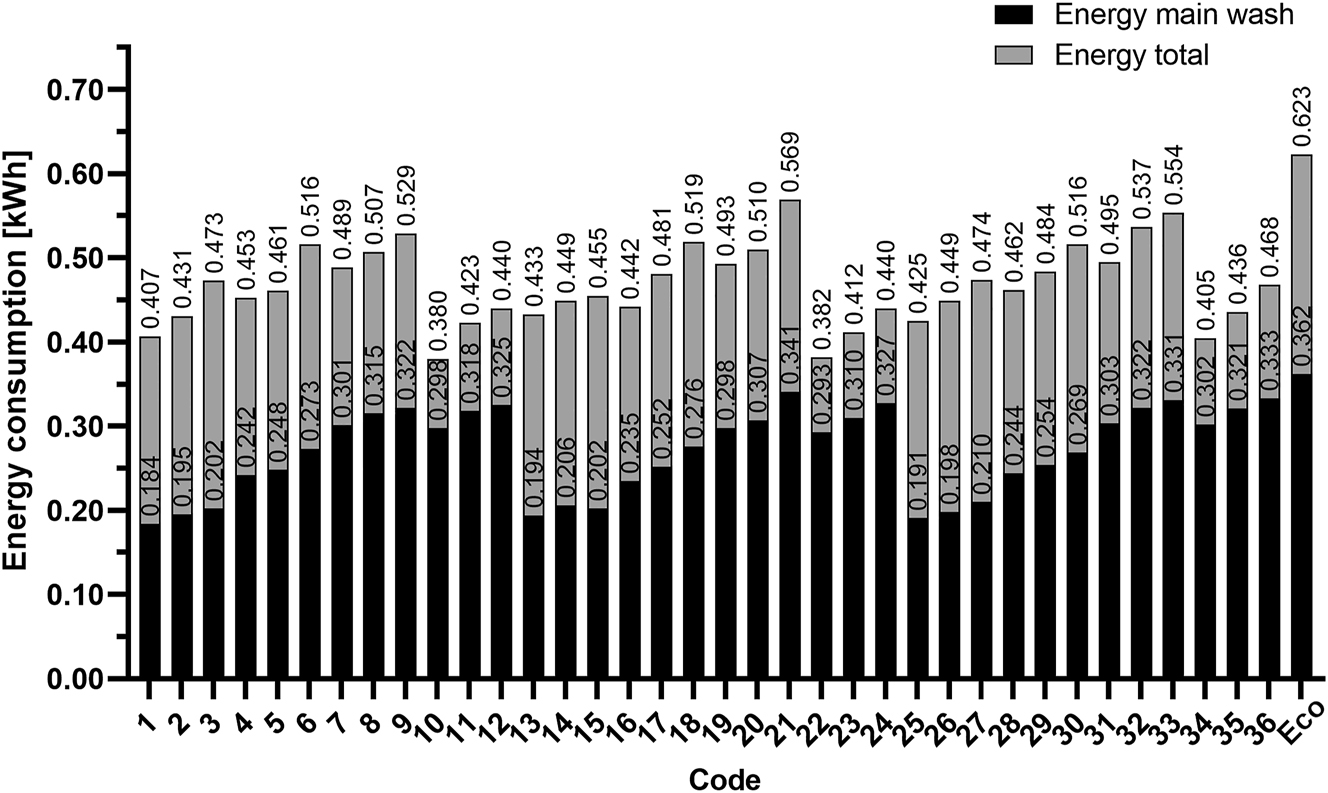
Average cumulated energy consumption of all test codes with visual differentiation of the proportion of energy consumption in the main wash cycle and the remaining energy until the end of a program.
For the codes with the lowest main wash temperature of 40 °C at 8 L of water consumption and 50 °C rinse temperature (codes 1, 13 and 25), the energy consumption in the main wash cycle corresponded approximately to the additional energy consumption until the end of the cycle; in principle, the energy required to reheat the water to rinse temperature. Since the dishwasher was still warm from the main wash cycle, the subsequent temperature difference decreased from the inlet of the new water until the rinse temperature was reached (see also Figure 3). Codes 10–12, 22–24 and 34–36 should be considered particularly interesting. Due to the relatively high main wash temperature (50 °C), these had a comparatively high energy consumption up to the main wash section (about 0.31 kWh in average). However, they had a very low energy consumption during the final rinse process. Lowering the temperature during the final rinse phase, or even omitting a hot final rinse process could therefore save a great deal of energy, although, this will probably lead to poor drying of the dishes. Since drying represents a significant proportion of the energy requirement, a close look at this phase is important in research.
3.3 Cleaning performance
When using the market product, the removal of tea soiling according to the IKW protocol seems to be unproblematic (Figure 5(a)). Complete soil removal was possible there with almost all program combinations (Figure 5(a)). However, when reference detergent D was used, a clear distinction could be made in the performance of individual program codes for the removal of tea soil. For example, the shortest programs with the lowest temperatures, i.e. 40 °C and 45 °C (codes 1–6), showed virtually no cleaning effect. However, as soon as the temperature rose to 50 °C (codes 7–9), the cleaning performance increased to about 3.5–5. A similar effect could also be observed with the 30-min cycles at 40 °C in the main wash (codes 13–15) when the reference detergent was used. Again, almost no tea soil removal was detectable. However, with only 5 °C higher in the main wash (codes 16, 17, 18), the soil reduction also increased to about 3.5–5. For codes 19, 20, 24, 31 to 33 and 35, an almost complete to total reduction was observed when using the reference detergent (Figure 5(a)). These findings can mainly be explained by the fact that reference detergent D contains activated oxygen bleach, whereas the branded detergent uses a manganese catalyst, which is more active at lower temperature.
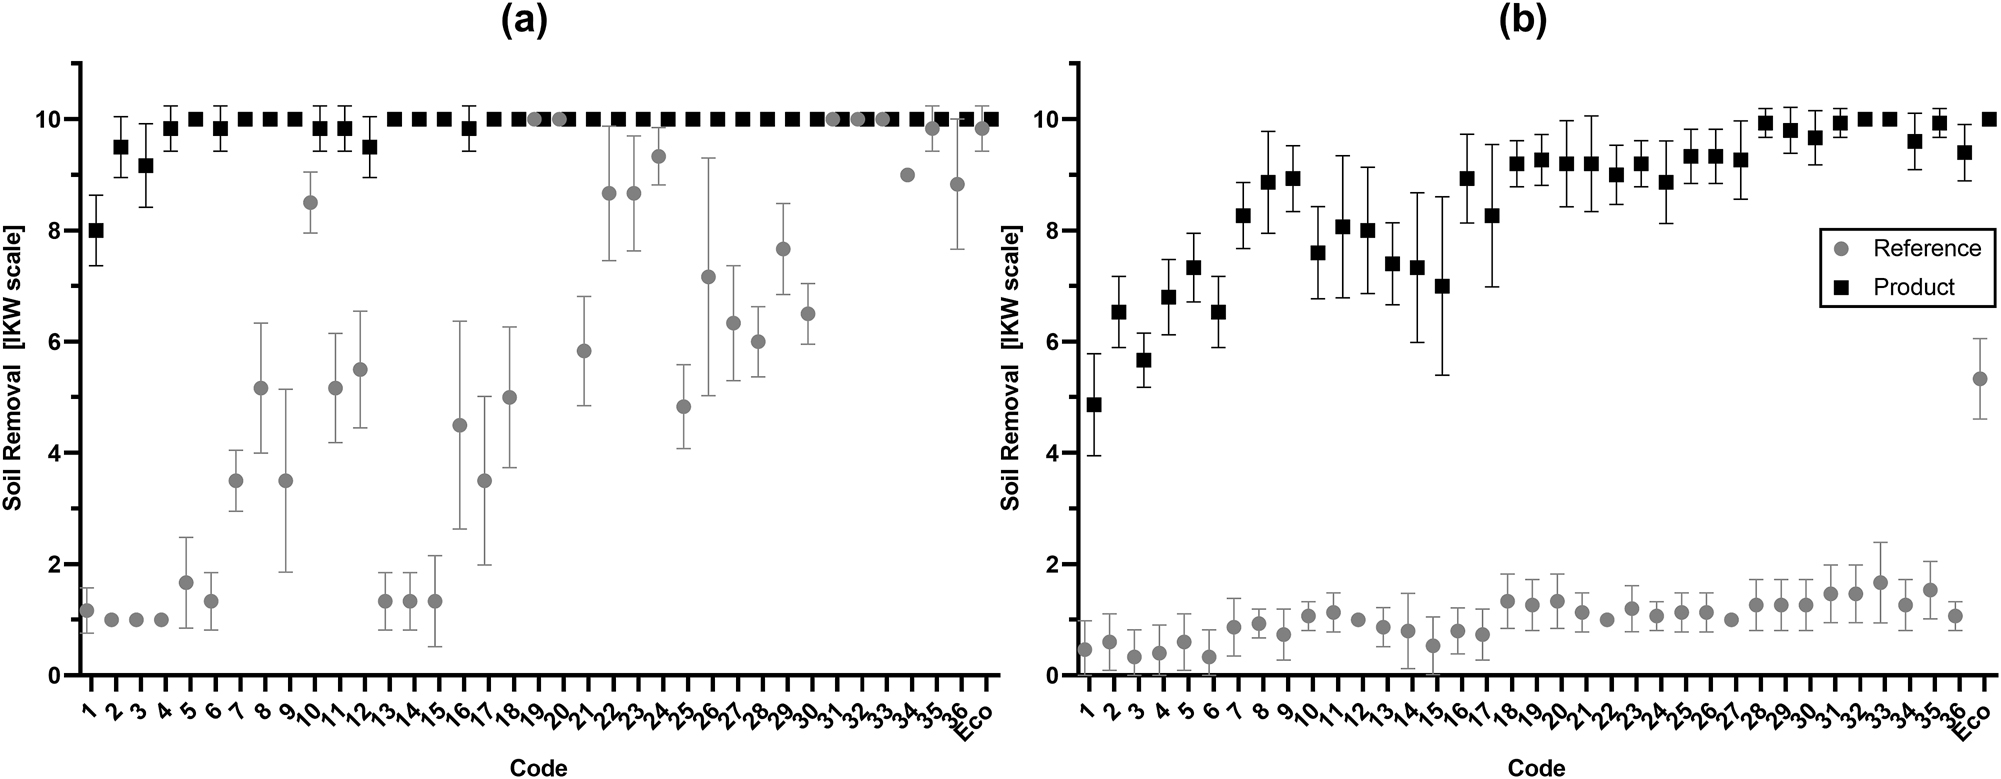
Soil removal values based on IKW scale 14 after cleaning soiled teacups (a) and crème brûlée (b) with program codes 1–36. Shown are the values of the reference detergent with reference rinse aid (reference) and those of the market product (Product).
In contrast to the tea soils, the reference detergent had almost no effect on the crème brûlée removal (Figure 5(b)). Even at the highest main wash and rinse temperature (50 °C) and the longest program duration (40 min), the reference detergent did not achieve a reduction higher than 1.7 out of 10. However, when using the Eco-program, a distinctly higher reduction of 5.3 for crème brûlée could be achieved (Figure 5(b)), even though this value is associated with clearly visible soil residues. When using the commercial brand product, a reduction of 4.9–7.3 was achieved even for codes 1–6. From code 18 up to and including code 36, an almost complete reduction was obtained (Figure 5(b)). Interestingly, the very short programs codes 8 and 9 (20 min) also achieved reductions of almost 9 (Figure 5(b)), albeit at the highest main wash temperature of 50 °C (comparison Table 1). Like codes 32 and 33, Eco showed complete crème brûlée soil removal when using the market test product.
With regards to the CFT-tiles, especially the BEY soiling could be effectively removed with the market product. With the exception of codes 1 to 4, almost complete reductions were achieved there (Figure 6(a)). In the case of DM soiling (Figure 6(b)), when the branded product was used, codes 1–6, as well as 14 and 15, with about 62 %–76 % SRI, did not show very low reductions, but nevertheless lower reductions than for the remaining codes. The trend for codes 13–16 (Figure 6(b)) is interesting, as increasing the amount of water from 8 L to 9 L (code 13 and code 14) led to a decrease in performance and increasing from 40 °C to 45 °C (code 15 and code 16) in the main wash cycle led to a clear increase in cleaning performance (from 76 % SRI of code 15 to 93 % of code 16). Strikingly, the corresponding SRI for soiling BC using the reference detergent resulted in a very high standard deviation, since the test soiling did not come off evenly, as for the market product, but the soiling remained in large flakes. Consequently, despite a rather low cleaning performance, larger pieces of the soiling came off, resulting in a high standard deviation, since this did not always happen.
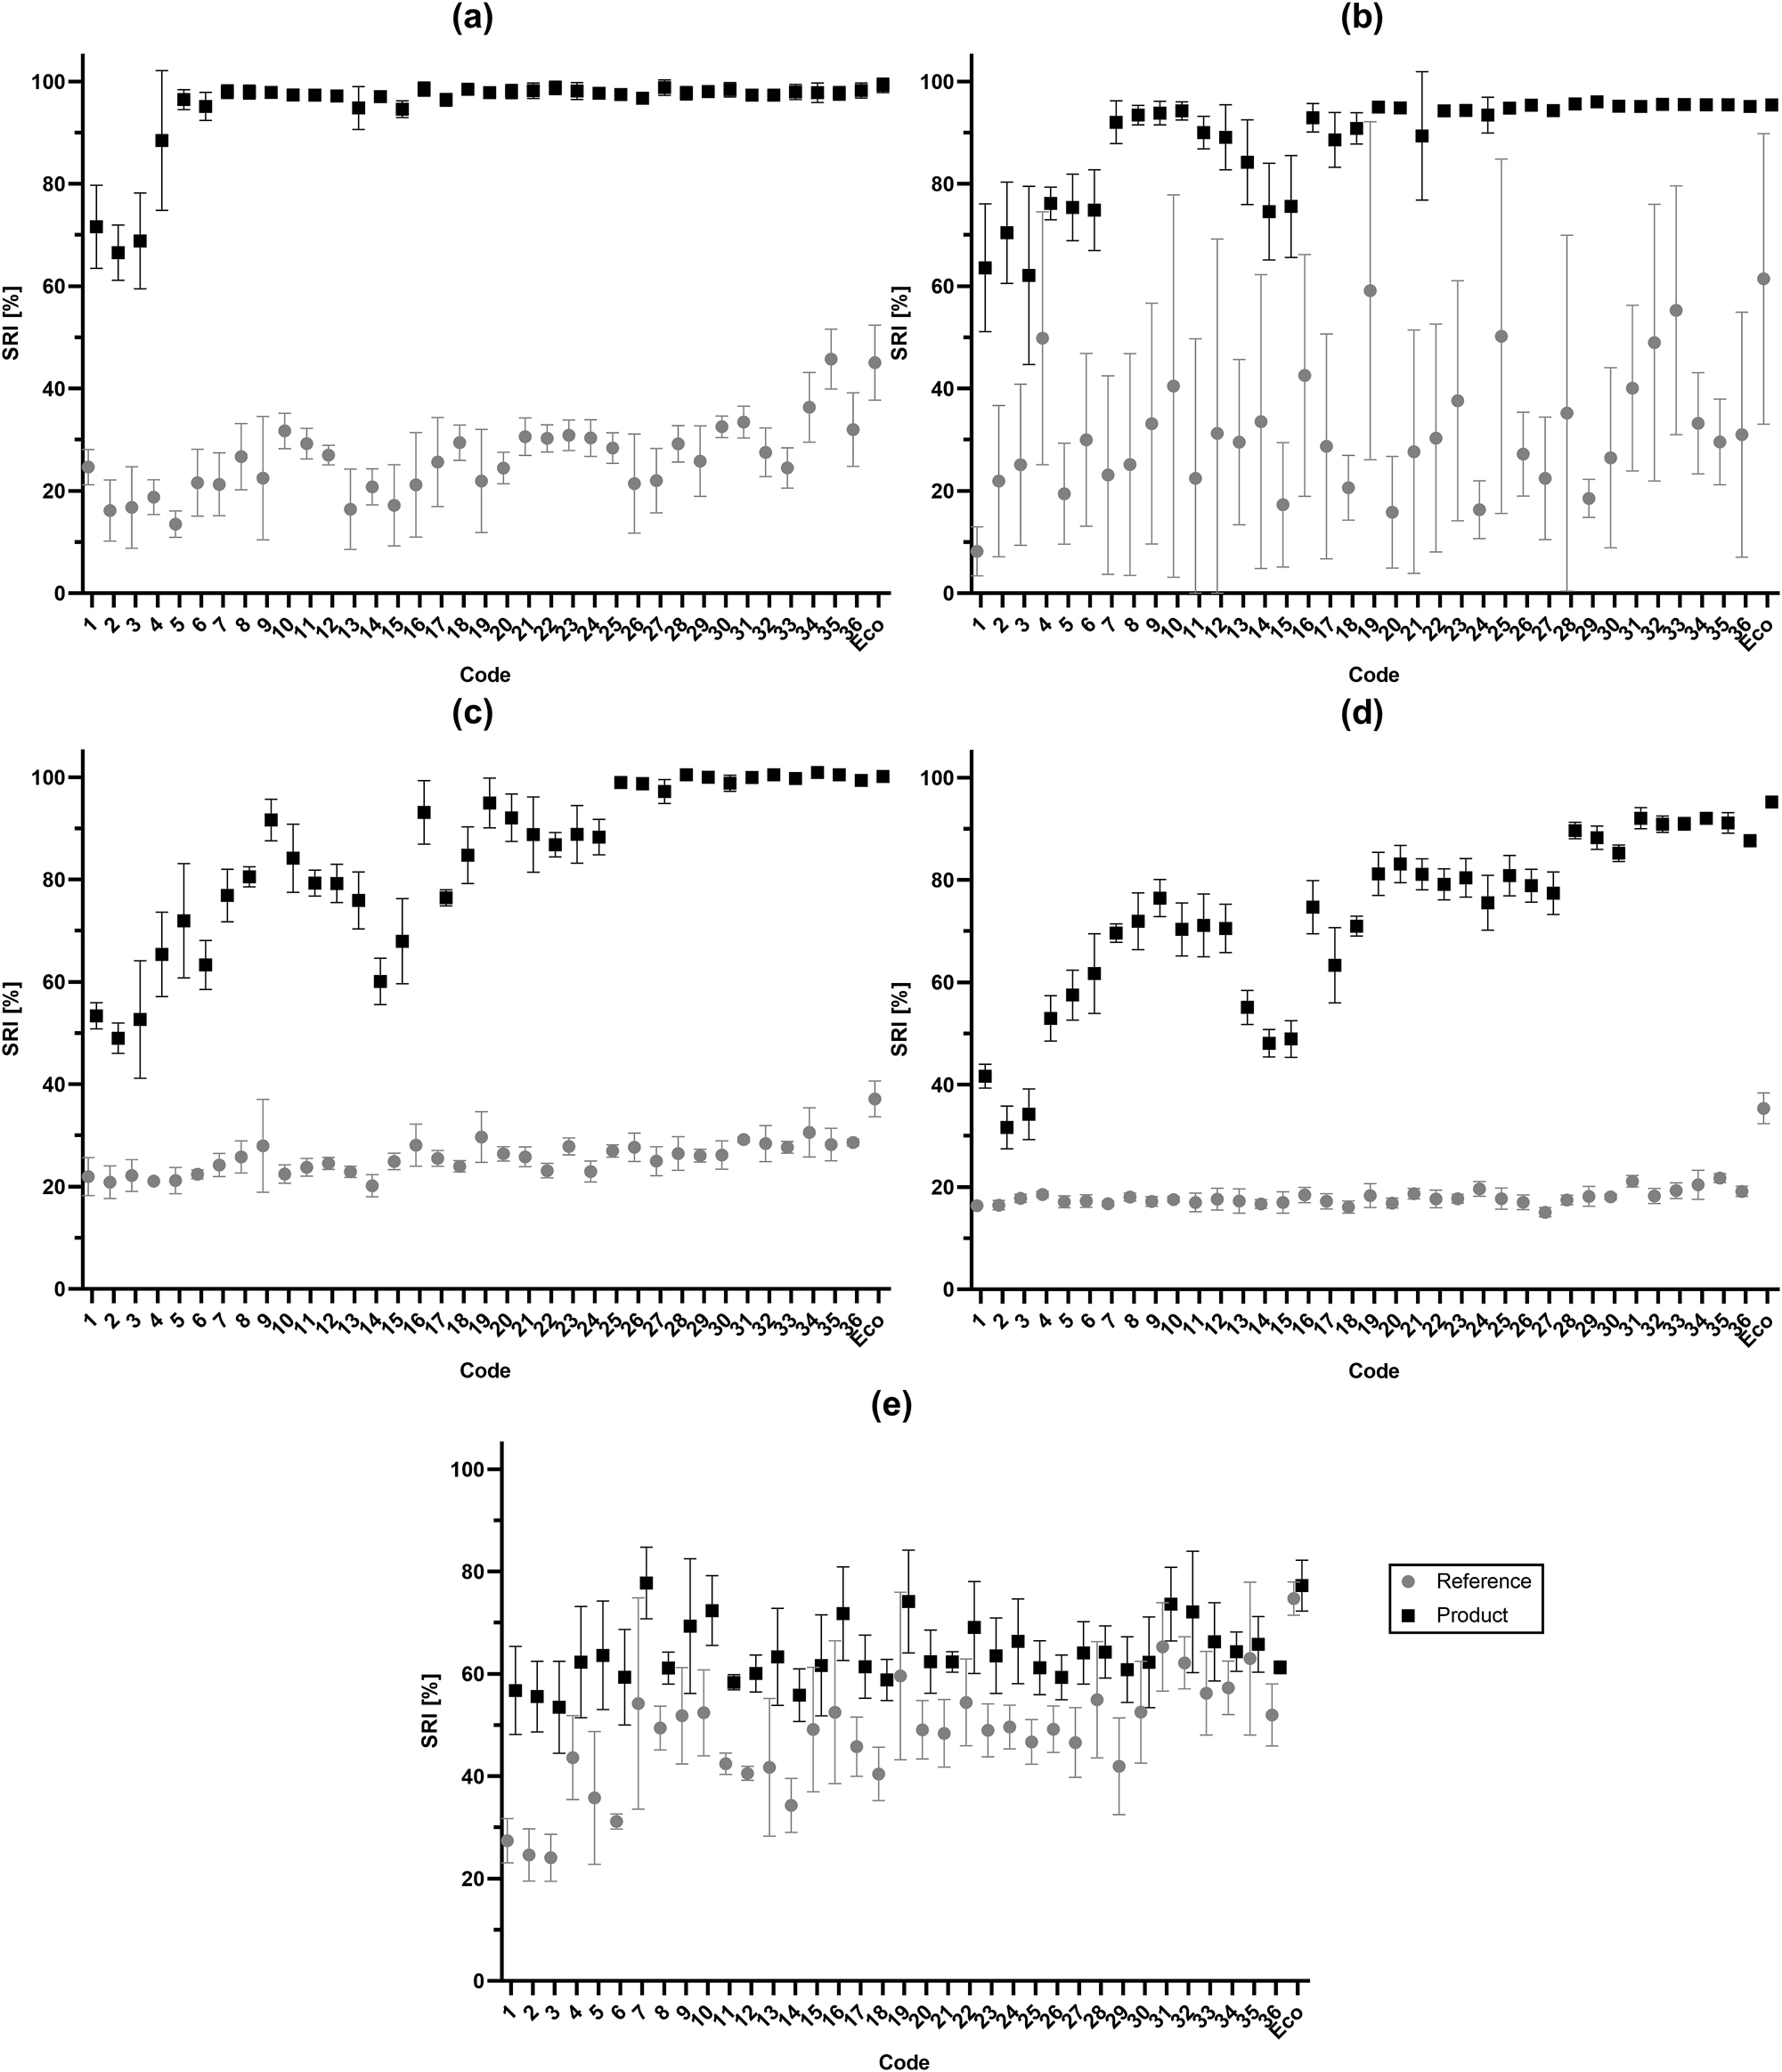
SRI values after cleaning the test soils with program codes 1–36 from CFT-tile soils BEY (a), DM (b), BC (c), MS (d), DT (e). Shown are the values of the reference detergent with reference rinse aid (reference) and those of the commercial brand test product (product).
Being a protein-based soiling (BC; Figure 6(c)) and a starch-based soiling (MS, Figure 4(c)), these soils are fundamentally different types of soils. However, the SRI values pattern was almost identical when the market cleaner was used. The SRI values for BC and MS increased trend wise from codes 1–9 and decreased again at codes 10–15, possibly reflecting the continuous increase in temperature in the main wash cycle in codes 1–9, while the rest of the parameters, except for the water amounts, did not vary there. As soon as the temperature dropped from 50 °C to 40 °C in the final rinse phase (codes 10–12), the values started to drop again. Especially for MS, an abrupt drop in performance was observed for codes 13–15. These program codes are 10 min longer than codes 1–12, but have a lower main rinse temperature of 40 °C than codes 4–12. The BC test soiling (Figure 6(c)) was completely removed with the test product from codes 25 to 36, whereas the reduction in MS soiling (Figure 6(d)) is on average 12 % lower overall than the BC soiling values. The reference cleaner showed no noticeable effect on the MS soiling (Figure 6(d)) with an SRI average of 17.9 %. For MS (Figure 6(c)), the reference cleaner performed similarly poorly, with an average of 25.4 % SRI. For DT soiling (Figure 6(e)), while the differences between the reference detergent and branded product were generally small, for codes 1–3, the cleaning performance of the market product was much higher than that of the reference detergent with an SRI of 55 % (compared to 25 % SRI). The highest SRI values at DT (>70 %) were achieved with the market product at codes 7, 9, 10, 16, 19, 31 and 32. For the reference cleaner, the highest DT SRI values (>60 %) were obtained at codes 31, 32, and 35, with only a 2.8 % difference in cleaning performance between the reference cleaner and the branded product at code 35. However, the branded product had a lower standard deviation at code 35 and DT soiling (Figure 6(e)).
If the total soil removal is considered as a function of the main wash temperature (Figure 7(a)), the decreasing scatter and the shift to higher cleaning efficiencies at higher temperatures become apparent. However, the differences in soil removal were smaller between 45 °C and 50 °C. Overall, the opposite is true for the rinse temperature (Figure 7(b)), where higher reductions with smaller variations were achieved with the 40 °C variants, probably due to the correspondingly higher main wash temperature. All test cycles with only 40 °C in the rinse cycle had 50 °C in the main wash. With increasing cycle length, the proportion of low cleaning efficiencies decreased (Figure 7(c)), although DT soiling in particular was hardly reduced more with increasing time (Figure 7(c)). It is interesting to note that the amount of water (Figure 7(d)), which has a particularly large influence on energy consumption (see Figure 4 and Table 1), generally showed a very small influence on the cleaning performance. Therefore, when developing an economical Short-cycle, it is possible to rely on the lowest tested water quantity. However, it should not be neglected that, depending on the machine, the amount of water cannot be varied too much as the amount of water is important for the pump to run smoothly.
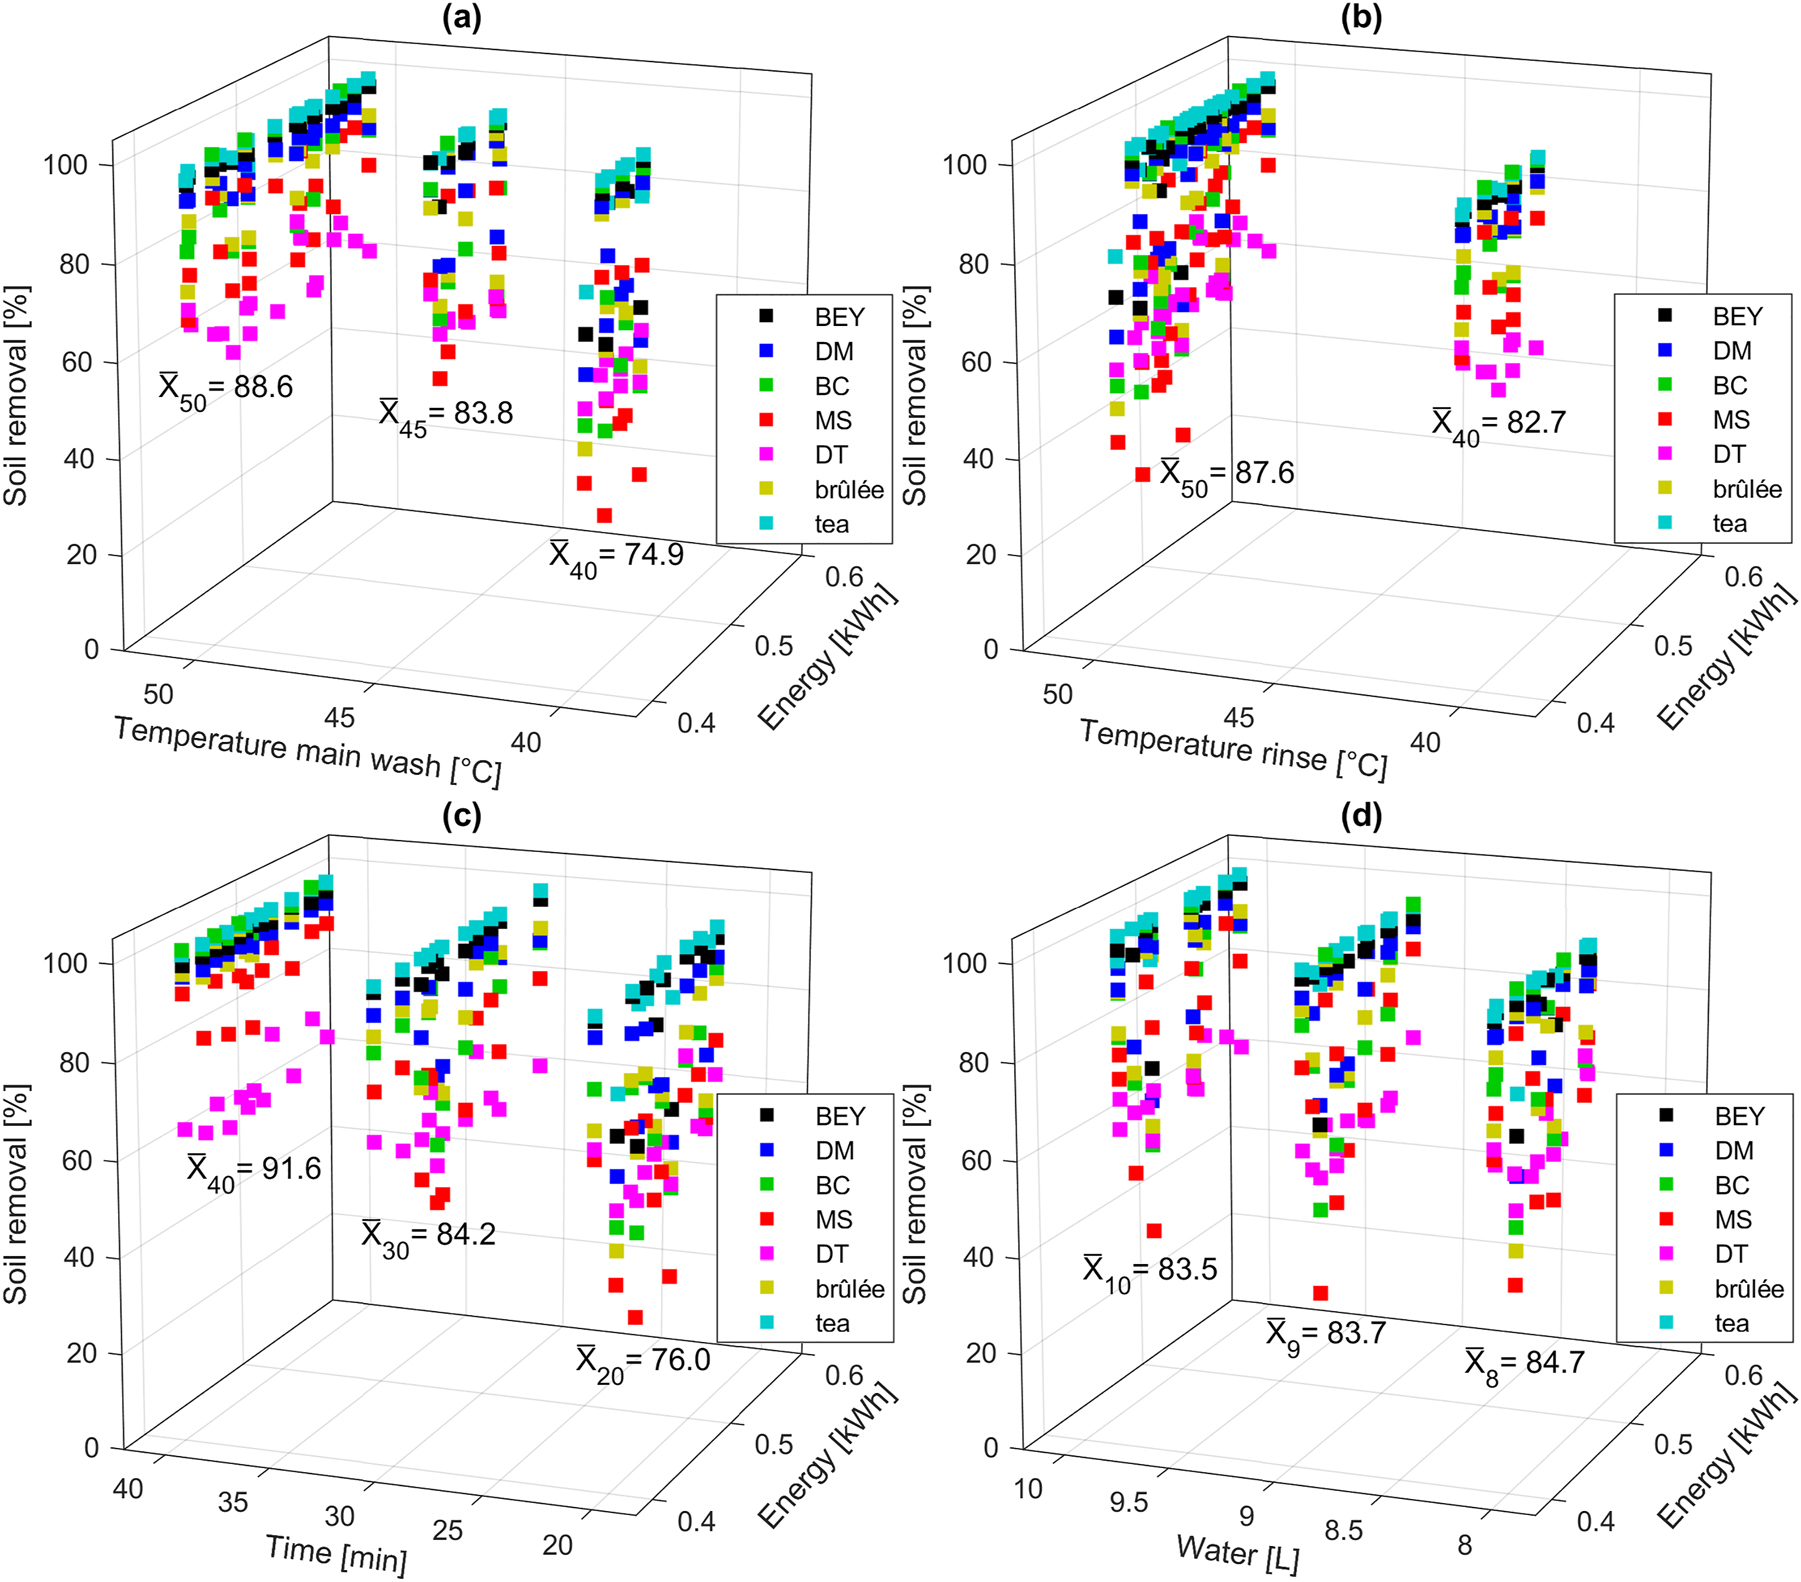
Energy consumption scatter diagrams showing the average cleaning performance of all soiling using the commercial test product, plotted in three-dimensional space as a function of main wash temperature (a), rinse temperature (b), time (c), and water consumption (d). The values for crème brûlée and tea soil were scaled to %. The arithmetic mean X‾ over all soil removal values of the parameters shown is displayed below the corresponding clusters. The respective indices of X‾ refer to the front main axes (main wash temperature, rinse temperature, time, water consumption). The figure includes only the data of the programmed short-cycles, but no the eco-cycle data.
Figure 8(a) illustrates the performance of the individual program codes for all soiling types in relation to their energy consumption. The difficulties to remove the DT soiling (highly discriminative tea) for all program codes are striking, independent of their energy consumption, whereas the tea soil was removed particularly easily with almost all program combinations. It should be noted that codes 10 and 22, with the lowest energy consumption, achieved very high reductions here. In Figure 8(b), the values have been averaged accordingly for a better overview and to assess the mean cleaning performance across all investigated soils. Here, code 10 and code 22 exhibit a mean cleaning performance of about 85 % and 88 %, respectively, with an energy consumption of only 0.38 kWh each (Figure 8(b)). The average cleaning efficiency is even higher for code 34 with an average of 92 % soil removal at a still very low energy consumption of 0.405 kWh. Codes 10, 22 and 34 represent cycles with 8 L of water consumption, 50 °C main wash cycle and 40 °C as the maximum rinse temperature with durations of 20, 30 and 40 min, respectively (Table 2).
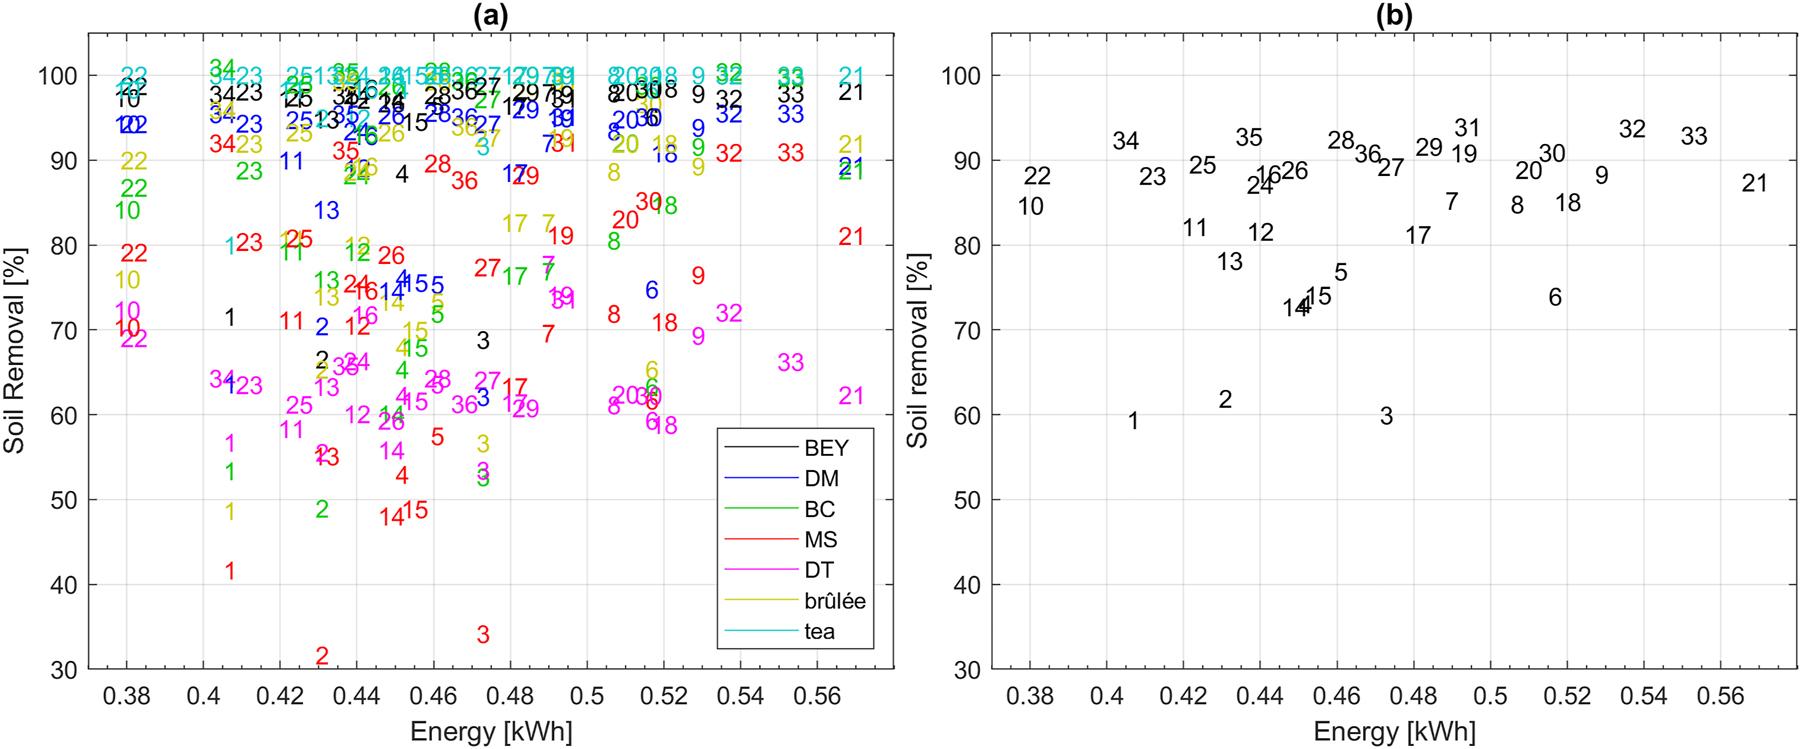
Individual averaged soil removal depending on the energy consumption of all program codes using the market product (a) and mean value over all different soiling types depending on the energy consumption of all program codes (b). The values for crème brûlée and tea were scaled to %. The figure includes only data of the programmed short-cycles and no eco data.
These combinations are able to realize high cleaning performances, probably thanks to the comparatively high main wash temperature and very low total energy consumption due to the low final rinse temperature. It should be noted that our tests did not focus on the drying of the dishes, but it is obvious that these codes (10, 22, 34) would lead to dishes with a higher degree of residual moisture. Since even the shortest cycle with only 20 min total duration (code 10) is able to achieve a very high cleaning performance, it would be interesting to investigate after how many additional minutes which dishes are dried and how well. It is possible that the total cycle duration could thus be significantly longer than 20 min, but still shorter than typical 1 h cycles. Program codes with only 20 min duration at 40 °C in the main wash cycle (codes 1, 2, 3) show the lowest cleaning performance (Figure 8(b)) and with 10 L of water (code 3) even an energy consumption that is in the middle range of all determined energy consumptions (0.47 kWh).
3.4 Recommendations for “proxy” short-cycles
In a recent investigation, we determined the average energy consumption per cycle based on a large number of dishwashers. 12 Here, for Eco-cycles, the average consumption of the machines studied was about 0.901 kWh. The maximum energy consumption was 1.130 kWh, the minimum 0.740 kWh and the average cycle length was approximately 3.3 h. However, these values refer to fully loaded machines and therefore cannot be directly compared with the values presented in the current study. The Eco-cycle programmed in this work consumes 0.735 kWh with 13 place settings and 0.623 kWh with the test setup (see Figure 4) and lasts 197 min. Modern Eco-cycles, which were not yet included in that study 12 could already consume notably less energy.
The energy consumption of the program combinations representing Short-cycles with more than 90 % cleaning performance analyzed in this study range from 0.405 kWh to 0.553 kWh and average around 0.485 kWh and is thus far below the consumptions of the Eco-cycle (0.623 kWh) (Figure 4).
Table 3 presents the program codes (sorted in descending order of their cleaning performance) that achieve more than 90 % cleaning performance. This was obtained for 10 program codes apart from the Eco-program, which achieved the highest averaged cleaning performance. While all codes uses at least 45 °C in the main wash cycle, three of the codes are based on the particularly low consumption design, which omits a hot rinsing phase and uses only 40 °C there (codes 34, 35, 36). Most interestingly, for cycles 31–33 it becomes obvious that increasing the amount of water leads to a tendentially lower cleaning performance, although the differences are not significant. The differences in energy consumption, however, are well pronounced, especially for the 8 L code 31.
Program codes that achieve higher average soil removal than 90 % using the tested market product.
| Code | T main (°C) | Time (min) | Water (L) | T rinse (°C) | Energy consumption (kWh) | Averaged cleaning performance (soil removal, %) |
|---|---|---|---|---|---|---|
| Eco | 50 | 197 | 11 | 50 | 0.623 | 95.3 |
| 31 | 50 | 40 | 8 | 50 | 0.494 | 93.9 |
| 32 | 50 | 40 | 9 | 50 | 0.537 | 93.8 |
| 33 | 50 | 40 | 10 | 50 | 0.553 | 92.9 |
| 35 | 50 | 40 | 9 | 40 | 0.437 | 92.8 |
| 28 | 45 | 40 | 8 | 50 | 0.461 | 92.4 |
| 34 | 50 | 40 | 8 | 40 | 0.405 | 92.4 |
| 29 | 45 | 40 | 9 | 50 | 0.484 | 91.6 |
| 30 | 45 | 40 | 10 | 50 | 0.516 | 90.9 |
| 19 | 50 | 30 | 8 | 50 | 0.493 | 90.8 |
| 36 | 50 | 40 | 10 | 40 | 0.468 | 90.8 |
It is important to state that the cleaning performances of all codes achieving more than 90 % soil removal (Figure 9(a)) do not differ significantly from each other. In contrast, the associated energy consumptions differ significantly for most of the programs (Figure 9(b)). Thus, program combinations 32 and 33 should not be considered as energy-saving short-cycles, as they consume significantly more energy than code 31 with no noticeable difference in cleaning performance. Here, clearly, the higher energy consumptions for codes 32 and 33 can be attributed to the larger water volumes of 9 L and 10 L, respectively. Similarly, codes 34, 35, and 36 all differ significantly in energy consumption (Figure 9(b)), but little in cleaning performance (Figure 9(a)). For this reason, codes 35 and 36 do not offer advantage in speed or cleaning performance over code 34, and also consume more water and energy. Codes 29 and 30 also show no advantage over code 28 and even show slightly worse cleaning performance. Thus, the short-cycles with the highest cleaning performances (>90 %) at the lowest energy consumption are codes 31, 28, 34, and 19. The lowest energy consumption of this selection is code 34 with 0.405 kWh. The shortest cycle of this selection is code 19 at 30 min, with a comparatively high energy consumption (0.493 kWh) of these four codes (31, 28, 34, 19). Code 28 consumes significantly less energy than codes 31 and code 19, which is 10 min shorter (Figure 9(b)) due to the 5 °C lower main wash cycle temperature of code 28 (see Table 3).
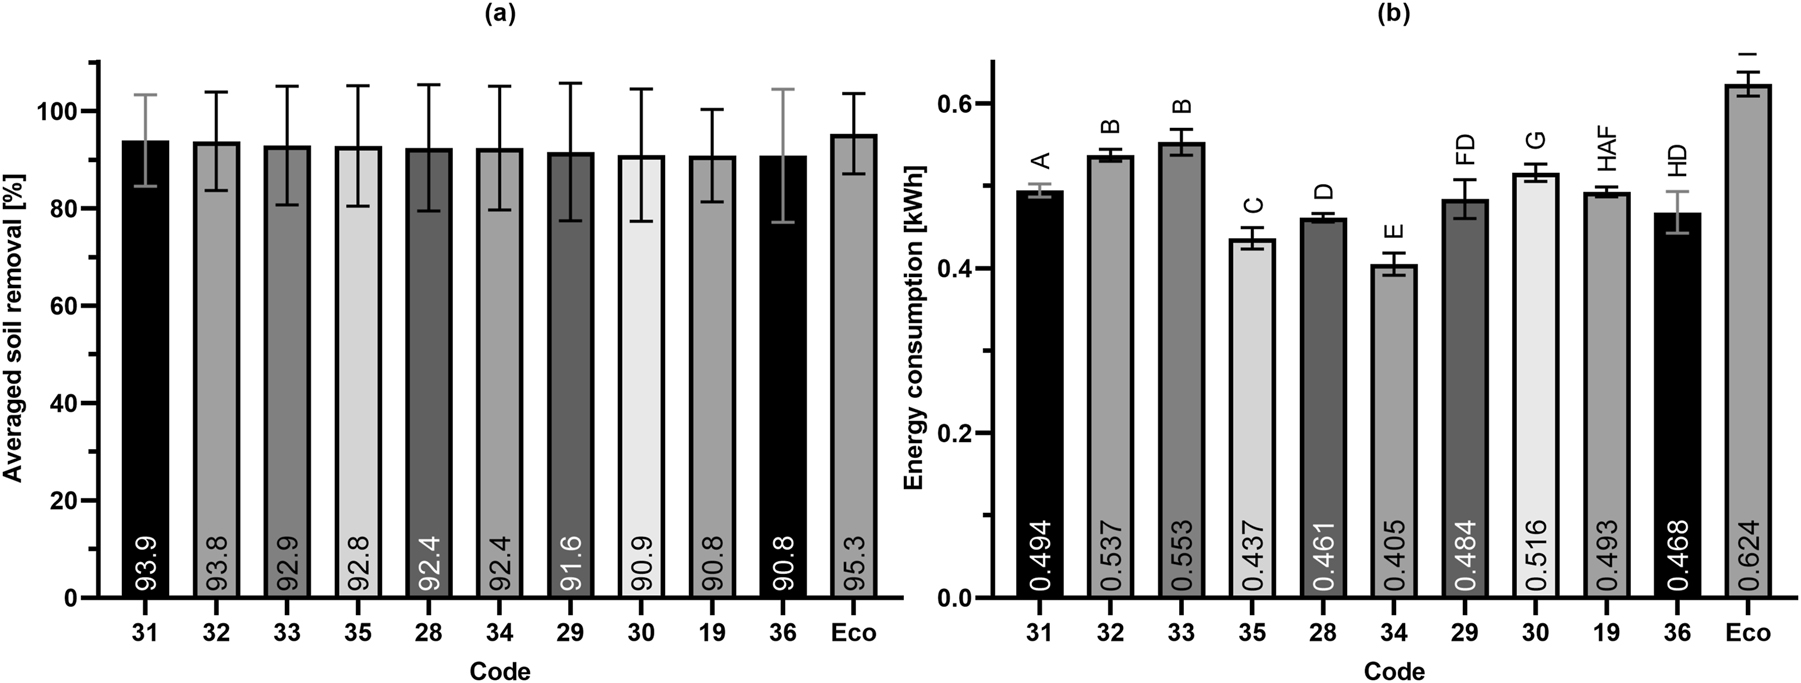
Soil removal averaged over all test soiling of all tested codes with more than 90 % cleaning performance (the values for crème brûlée and tea were scaled to % before averaging) (a); energy consumption of the corresponding cycles tested for significant differences using unpaired t-tests with Welch’s correction (statistical significance P < 0.05) (b). Different letters (A–H) indicate significance differences. Data are normally distributed according to Kolmogorov-Smirnov test.
Following these classifications, a recommendation can be made for Short-cycles with low energy consumption and high cleaning performance. Code 34, which stands out for its significantly low energy consumption with a total cycle length of 40 min. However, this program would need to be examined more closely for its drying performance, as this criterion was not examined here, but must be considered important. Other recommendations may include code 28, which is in the lower consumption range due to the lower main wash temperature of 45 °C (0.461 kWh) and code 19, which consumes significantly more energy (0.493 kWh) than codes 28 and 34, but is the shortest cycle tested (30 min) still with a cleaning performance of over 90 %.
Figure 9(a) indicates that Eco has the highest average cleaning performance, but the differences are not significant, whereas the higher energy consumption of Eco compared to the Short-cycles (Figure 9(b)) is significant. At this point, however, it is very important to consider the influence of water hardness on cleaning performance. Cleaning performance usually decreases with increasing water hardness. 15 , 16 Cations can form strongly charged structures with detergent surfactants, that limit the soil removal. 17 Nevertheless, the results shown here are intrinsically comparable and depict a practical scenario, since consumers can choose to add salt in their dishwasher. Moreover, our latest study shows a similar performance of certain Short-cycle parameter combinations using hard water and market products, thus suggesting a systematic shift in performance with regards to hard versus soft water. 11
None of the program codes with a runtime of only 20 min achieved an average cleaning performance of over 90 %. Nevertheless, they might be of great importance due to their possible consumer convenience. For this reason, Table 4 lists the 10 cycles with a running time of only 20 min in descending order of their cleaning performance. Here, the cycle providing the highest cleaning performance is code 9, which consumes significantly more energy (0.529 kWh) than the related codes 7 and 8, due to the high water volume. This fact is interesting, as increasing water volumes have almost no effect on the cleaning performance on average, as shown in Figure 7(d). However, the relatively high cleaning performance of code 9 is not a linear trend of increasing water volumes of the mentioned program codes 7, 8 and 9 (Table 4). The decisive factor for the high average cleaning performance of code 9 is the unusually high soil removal in the BC soiling (Figure 6(c)). Code 10 is particularly striking as it consumes the least energy (0.38 kWh) due to the low final rinse temperature design (40 °C), but still performs well with 84.7 % soil removal.
Ten shortest program codes with highest average soil removal using the tested market product.
| Code | T main (°C) | Time (min) | Water (L) | T rinse (°C) | Energy consumption (kWh) | Averaged cleaning performance (soil removal, %) |
|---|---|---|---|---|---|---|
| 9 | 50 | 20 | 10 | 50 | 0.529 | 88.36 |
| 7 | 50 | 20 | 8 | 50 | 0.490 | 85.29 |
| 8 | 50 | 20 | 9 | 50 | 0.507 | 84.81 |
| 10 | 50 | 20 | 8 | 40 | 0.380 | 84.69 |
| 11 | 50 | 20 | 9 | 40 | 0.423 | 82.17 |
| 12 | 50 | 20 | 10 | 40 | 0.440 | 81.59 |
| 5 | 45 | 20 | 9 | 50 | 0.461 | 76.90 |
| 6 | 45 | 20 | 10 | 50 | 0.517 | 74.01 |
| 4 | 45 | 20 | 8 | 50 | 0.452 | 73.09 |
| 2 | 40 | 20 | 9 | 50 | 0.431 | 61.94 |
Most cycles with only 40 °C in the main wash perform very poorly in terms of cleaning performance, especially the shortest cycles of only 20 min. However, there are cycles with 40 °C in the main wash and relatively low energy consumption (0.425–0.474 kWh) with cleaning performances between 72.7 % and 89.5 %; these include the 30-min codes 13–15 and the 40-min codes 25–27 (Table 1, Figures 4 and 8(b)). However, when using such low main wash temperatures, microbiological safety must be given particularly critical consideration, as lower washing temperatures are associated with lower microbial count reductions, 18 , 19 but more research should be done in this direction to conclude, especially with regard to optimized detergent formulations and their associated cleaning performance, as well as consumer habits. Compared to even shorter cycles, 30-min cycles are of great interest, as it may not even be possible to achieve temperatures of 45 °C–50 °C in the main wash cycle in 20 min total time with a full load of the machine. Moreover, the average of the short-cycles on the market is about 30 min. 12 For this reason, codes 16 and 22 can also be considered as possible proxy short-cycles. The two codes have almost the same average cleaning performance with about 88 % (see Figure 8(b)), but code 22 consumes only 0.382 kWh, whereas code 16 consumes 0.442 kWh. Both programs consume 8 L of water (see Table 1), but code 22 has 50 °C in the main wash cycle and only 40 °C in the final rinse, and vice versa, code 16 has 40 °C in the main wash cycle and 50 °C in the final rinsing. From an energy point of view, code 22 is highly interesting, as the average cleaning efficiency is relatively high at 88.3 % and the energy consumption is the second lowest of all codes tested at 0.382 kWh (see Figure 4). However, code 22 is expected to have poorer drying than code 16 due to the lower final rinsing temperature. In the study published in 2001, Jones et al. apply a special problem-solving tool for Eco innovation of domestic dishwashing. 20 They come up with several suggestions to save energy in general, but also explicitly in the drying process. For example, an optimal temperature setting determined by the pH value, the use of heat exchangers to capture the heat from the dirty water for the next cycle, or a two-phase detergent use where part of the dirty washing liquid is discarded and replenished, as well as the use of unheated convection and condensation chambers to dry the dishes. 20
Table 5 provides a summary of the optimal proxy Short-cycles described above and summarizes the properties to assess advantages and disadvantages.
Compilation of optimal proxy short-cycles. All listed codes consume 8 L of water.
| Code | T main (°C) | T rinse (°C) | Time (min) | Energy consumption (kWh) | Averaged cleaning performance (soil removal, %) |
|---|---|---|---|---|---|
| 22 | 50 | 40 | 30 | 0.382 | 88.3 |
| 16 | 45 | 50 | 30 | 0.442 | 88.4 |
| 34 | 50 | 40 | 40 | 0.405 | 92.4 |
| 28 | 45 | 50 | 40 | 0.461 | 92.4 |
| 19 | 50 | 50 | 30 | 0.493 | 90.8 |
4 Conclusions
In addition to cleaning performance, consumers are interested in the low energy and water consumptions of automated dishwashing. 5 , 21 Eco-cycles are designed to clean normally soiled dishes with the lowest possible energy and water consumption, 2 but are only used by a fairly small percentage. 2 Consumer acceptance of long-lasting cycles and their regular use has been shown to be limited. 2 , 6 Short-cycles, which according to the manufacturer are designed for lightly soiled dishes, 10 show poor cleaning performance for almost all soils when using the “reference detergent D” with “standard rinse aid C”, which is to be expected as described. However, we have demonstrated here that using a commercially available dishwasher detergent, high cleaning performance can be achieved even with Short-cycle combinations and with significantly lower energy consumption than typical Eco-cycles. Due to the many differences between reference detergent D and the used commercially available detergents, it is not possible to assign an effect to a special ingredient, but this was not the aim of the study, which rather tried to discuss the impact of program parameters on the cleaning efficacy using products which are of considerably different efficacy. The cycles we particularly consider to be in line with this category include designated code 34, 28 and 19, all achieving high cleaning efficiencies (>90 %) in 30–40 min total time with low energy (0.405–0.493 kWh) and water (8 L) consumption. This also applies to the 30-min code 22, which achieves an average cleaning performance of 88.3 %, but consumes only 0.382 kWh in the test setup. However, the drying result, which could possibly be limited due to the low rinsing temperature of 40 °C, must be regarded carefully. The potential energy savings provided by high-performance cleaners and the shorter cycles with low amounts of water and moderate temperatures, combined with an optimization of the dishwasher drying process through innovative solutions like Zeolith® drying technology, 9 , 22 could be significant; however, this could considerably extend the duration of the program. It must be considered that our work resembles a defined scenario with low water hardness, as can be expected with soft water regions or if consumer add salt in their dishwasher. If the water hardness increases, as can occur, for example, in hard water regions and if no salt is used in the dishwasher, a lower cleaning performance can be expected overall, as suggested by a recent study. 11 However, further tests with harder water may be interesting to estimate the role of water hardness under several circumstances more comprehensively. In any case, our study shows that the time saved by using suitable Short-cycles in combination with an effective cleaner is immense at up to more than 2.5 h with a cleaning performance comparable to the Eco-cycle in our test setup. Compensating for low temperatures and short program times with optimized chemistry could lead to a decisive shift towards Short-cycles to save both time and energy.
Taken together, our findings can be used in different ways. As there are different standardized procedures, namely the IEC-standard 13 for the testing of appliances on the one hand (only using reference detergent D, which does not resemble a market detergent) and the IKW-standard 14 on the other hand, which is not a good means to differentiate well between high and low performing detergents, since the cycle used provides a generally good cleaning efficacy anyway. Thus, our study can help, for instance, to identify cycles that provide good cleaning with a currently available detergent (which is normally better performing than the reference detergent), or to choose a program that allows for better differentiation of detergents. It should also be mentioned, though, that the results of this study cannot be transferred into recommendations for an appliance.
About the authors
Thomas J. Tewes, M.Sc. studied Food Science in Kleve and currently works as a principal scientist at Rhine-Waal University of Applied Sciences in the field of hygiene and microbiology.
Laurence Harcq Engineer in Biochemistry, studied Biochemistry in Brussels and worked in Sugar Manufactory (Raffinerie Tirlemontoise) before joining Procter & Gamble in Brussels where worked in different R&D positions in the field ranging from Hand Dish Liquids to New Business Development, Air Care before becoming Europe Autodish R&D Senior Scientist.
Pauline Minot, Engineer in Chemistry, studied Chemistry in Paris (at Ecole Nationale Superieure de Chimie de Paris, ENSCP) and worked in different R&D positions at Procter & Gamble in Brussels, in the field ranging from Hard Surface Cleaners, to Liquid laundry detergent, Laundry pods before becoming Europe Autodish R&D Director
Martin ter Bekke studied Biology/Science and Business Management in Utrecht before joining Procter & Gamble. In his current position as Director Scientific Communications for the European Fabric and Home Care division his focus area is to bring together the internal technical expertise and product propositions and external experts, stakeholder believes and consumers needs to help shape business strategies and brand communication.
Prof. Dr. Dirk P. Bockmühl, Microbiologist, studied Biology in Düsseldorf and worked in different positions in the field of laundry and home care in a consumer goods company, before joining Rhine-Waal University of Applied Sciences in 2010 as a professor for Hygiene and Microbiology.
Acknowledgments
The authors would like to thank Hannes Kümmerle, Ralf Pawlowitsch and Uwe Schaumann from E.G.O. Elektro-Gerätebau GmbH for providing the programmable household dishwasher and for their technical input and support.
-
Research ethics: Not applicable.
-
Author contributions: TJT: execution of experiments; writing, original draft. LH: conceptualization; experimental design. PM: conceptualization; writing, review. MtB: conceptualization, writing; review. DPB: conceptualization, supervision, writing, original draft.
-
Competing interests: All authors declare that they have no conflicts of interest. The authors Thomas J. Tewes and Dirk P. Bockmühl are involved in several third party projects funded by different companies producing dishwashers and cleaners.
-
Research funding: No funding was received to assist with the preparation of this manuscript.
-
Data availability: The raw data can be obtained on request from the corresponding author.
References
1. Alt, T.; Boivin, D.; Altan, M.; Kessler, A.; Schmitz, A.; Stamminger, R. Exploring Consumer Behaviour in Automatic Dishwashing: A Quantitative Investigation of Appliance Usage in Six European Countries. Tenside Surfact. Det. 2023, 60 (2), 106–116. https://doi.org/10.1515/tsd-2022-2488.Suche in Google Scholar
2. Hook, I.; Schmitz, A.; Stamminger, R. Dishwashing Behaviour of European Consumers with Regard to the Acceptance of Long Programme Cycles. Energy Effic. 2018, 11 (7), 1627–1640. https://doi.org/10.1007/s12053-017-9539-y.Suche in Google Scholar
3. Sinner, H. Ueber das Waschen mit Haushaltwasmaschinen: In welchem Umfange Erleichtern Haushaltwaschmachinen und -Geraete das Waeschehaben im Haushalt? Haus und Heim-Verlag: Frankfurt am Main, 1960. https://books.google.de/books?id=RUnzGwAACAAJ.Suche in Google Scholar
4. Stamminger, R. Modelling Dishwashers’ Resource Consumption in Domestic Usage in European Households and Its Relationship to a Reference Dishwasher. Tenside Surfact. Det. 2020, 57 (6), 479–88. https://doi.org/10.3139/113.110714.Suche in Google Scholar
5. Geetha, D.; Tyagi, R. Consumer Behavior and Fascinating Challenges on Household Laundry and Dishwashing. Tenside Surfact. Det. 2016, 53 (6), 568–575. https://doi.org/10.3139/113.110449.Suche in Google Scholar
6. Boyano, A.; Moons, H. Analysing of the Impacts of the Revision of Ecodesign and Energy Label Regulations for Household Dishwashers by Using a Stock Model. Energy Effic. 2020, 13 (6), 1147–1162. https://doi.org/10.1007/s12053-020-09874-4.Suche in Google Scholar
7. Suljug, A.; Hillenstedt, A.; Stamminger, R. Preparatory Studies For Eco-Design Requirements of EuPs - Lot 14: Domestic Washing Machines & Dishwashers; Öko-Institut e.V., Institute for Applied Ecology: Freiburg, 2007.Suche in Google Scholar
8. Abeliotis, K.; Dimitrakopoulou, N.; Vamvakari, M. Attitudes and Behaviour of Consumers Regarding Dishwashing: The Case of Patras, Greece. Resour. Conserv. Recycl. 2012, 62, 31–36. https://doi.org/10.1016/j.resconrec.2012.02.005.Suche in Google Scholar
9. Boyano, A.; Moons, H.; Villanueva, A.; Graulich, K.; Rüdenauer, I.; Alborzi, F. Follow-up of the Preparatory Study for Ecodesign and Energy Label for Household Dishwashers; JRC Technical Reports, Publications Office of the European Union: Luxembourg, 2017.Suche in Google Scholar
10. Alt, T.; Boivin, D.; Altan, M.; Kessler, A.; Schmitz, A.; Stamminger, R. How Many Resources Can Be Saved by Changing Consumers’ Automatic Dishwashing Behaviour? Tenside Surfact. Det. 2023, 60 (3), 191–202. https://doi.org/10.1515/tsd-2022-2489.Suche in Google Scholar
11. Tewes, T. J.; Harcq, L.; Minot, P.; Bockmühl, D. P. Brevity Is the Soul of Wit – How Time, Temperature and Detergent Choice Impact the Cleaning Performance in Domestic Dishwashers. Tenside Surfact. Det. 2024, 61 (1), 10–23. https://doi.org/10.1515/tsd-2023-2563.Suche in Google Scholar
12. Tewes, T. J.; Harcq, L.; Bockmühl, D. P. Use of Automatic Dishwashers and Their Programs in Europe with a Special Focus on Energy Consumption. Clean Technol. 2023, 5 (3), 1067–1079. https://doi.org/10.3390/cleantechnol5030054.Suche in Google Scholar
13. International Electrotechnical Commission. IEC 60436:2015 Electric Dishwashers for Household Use - Methods for Measuring the Performance; IEC Standards - VDE Publishing House VDE VERLAG GmbH: Berlin - Offenbach, 2015.Suche in Google Scholar
14. IKW. Recommendations for the Quality Assessment of the Cleaning Performance of Dishwasher Detergents (Part B, Update 2015) [Internet]. sofw Journal, Home and Personal Care Ingredients and Formulations. 2016, pp. 37–38. https://www.ikw.org/fileadmin/IKW_Dateien/downloads/Haushaltspflege/2016_EQ_Dishwasher_Detergents_Part_B__Update_2015_aktualisiert.pdf (cited 2023-04-29).Suche in Google Scholar
15. Naganthran, A.; Masomian, M.; Rahman, RNZRA; Ali, M. S.; Nooh, H. M. Improving the Efficiency of New Automatic Dishwashing Detergent Formulation by Addition of Thermostable Lipase, Protease and Amylase. Molecules 2017, 22 (9), 1577. https://doi.org/10.3390/molecules22091577.Suche in Google Scholar PubMed PubMed Central
16. Abeliotis, K.; Candan, C.; Amberg, C.; Ferri, A.; Osset, M.; Owens, J.; Stamminger, R. Impact of Water Hardness on Consumers’ Perception of Laundry Washing Result in Five European Countries. Int. J. Consum. Stud. 2015, 39 (1), 60–66. https://doi.org/10.1111/ijcs.12149.Suche in Google Scholar
17. Lim, W. H.; Salmiah, A. Dishwashing Performance of Mixed Palm Stearin Sulfonated Methyl Esters—Nonylphenol Ethoxylate Alcohol. J. Surfactants. Deterg. 2004, 7 (1), 53–58. https://doi.org/10.1007/s11743-004-0288-8.Suche in Google Scholar
18. Brands, B.; Bockmühl, D. P. Experimental Evaluation of Hygienic Conditions in Domestic Dishwashers. Tenside Surfact. Det. 2015, 52 (2), 148–154. https://doi.org/10.3139/113.110360.Suche in Google Scholar
19. Amberg, C. Microbial Reduction in Low Temperature Dishwashing Cycles. Tenside Surfact. Det. 2018, 55 (5), 383–90. https://doi.org/10.3139/113.110580.Suche in Google Scholar
20. Jones, E.; Mann, D.; Harrison, D. D.; Stanton, P. N. An Eco-Innovation Case Study of Domestic Dishwashing Through the Application of TRIZ Tools. Creat. Innov. Manag. 2001, 10 (1), 3–14. https://doi.org/10.1111/1467-8691.00186.Suche in Google Scholar
21. Richter, C. P. Automatic Dishwashers: Efficient Machines or Less Efficient Consumer Habits? Int. J. Consum. Stud. 2010, 34 (2), 228–234. https://doi.org/10.1111/j.1470-6431.2009.00839.x.Suche in Google Scholar
22. Bichler, S.; Gorny, S.; Seifert, M.; Kessler, A.; Stamminger, R. How to Improve Sustainability and Environmentally Friendly Behaviour in Automatic Dishwashing? Example: Germany. Tenside Surfact. Det. 2015;52 (5), 340–350. https://doi.org/10.3139/113.110384.Suche in Google Scholar
Supplementary Material
This article contains supplementary material (https://doi.org/10.1515/tsd-2024-2589).
© 2024 the author(s), published by De Gruyter, Berlin/Boston
This work is licensed under the Creative Commons Attribution 4.0 International License.
Artikel in diesem Heft
- Frontmatter
- Short Communication
- Removal of indomethacin from water using covalent organic polymers
- EU CLP Regulation
- The EU Detergent Industry Network ‘DetNet’ – an industry approach for the EU CLP classification of detergent and cleaning products for skin and eye effects
- Dishwashing
- Short and sweet: balancing energy savings and cleaning performance to identify efficient short-cycles for domestic dishwashers
- Saving resources without sacrificing results: an empirical investigation of the dishwashing reality of British consumers in an international comparison
- Synthesis
- Synthesis and emulsification properties of polyglyceryl estolides prepared from fatty acids
- Hydroformylation of branched olefins catalyzed by Co2(CO)8 for synthesis of branched alcohol ethoxylates and their surfactant properties
- Physical Chemistry
- Rheological characterization on novel viscoelastic tetrameric polyhydroxy cationic surfactant/sodium chloride micelle solutions
- Dynamic light scattering study on quercetin/surfactant/solvent system
- Comparative studies on physicochemical properties of cadmium and neodymium soaps in solid-state
- Enhanced removal of toxic Disperse Blue 35 dye through cloud point extraction: influence of parameters and solvent regeneration
- Review Article
- Cationic Gemini surfactants: a review on synthesis and their applications