Analysis of trends and variability of climatic parameters in Teff growing belts of Ethiopia
-


Abstract
The purpose of this study was to analyze the trend and variability of rainfall and temperature parameters in the teff growing belts of Ethiopia. The data were obtained from weather stations and covered 1981–2018. Data analyses were carried out with descriptive statistics and time trend regression model. The results showed that short-season rainfall declined by 0.474 mm, while long-season rainfall increased by 2.72 mm. Also, the short season rainfall showed higher variability when compared to the long season rainfall. The standardized seasonal rainfall anomalies indicated severe and extreme droughts (<−1), and the results were in alignment previous droughts. In addition, over the period, the maximum and minimum temperature significantly increased by 0.13 and 0.15°C, respectively. The coefficients of variation (CV) for maximum and minimum temperatures were 2.24 and 5.10%, respectively. Anomalies in maximum and minimum temperatures were negatively low in 1981–1997 but positive in 2003–2018. There were teff yield anomalies and variability. It was concluded that variations in selected climatic parameters or their interactions accounted for teff yield variability. This necessitates provision of adequate adaptation strategies to minimize the impacts of climate change on the yields of teff.
1 Introduction
Globally, climate change is one of the most important challenges of agricultural sustainability and development. This is evident in its impacts on crop yields and environmental sustainability [1,2]. Observable distributional variability in the patterns of some climatic parameters now presents indisputable evidences on the reality of climate change. This problem is manifesting as variability in some climatic parameters like rainfall and temperature [3]. Although high variations in some regional weather data are considerably normal, existence of spatial and temporal variability is of utmost concern [4]. In Ethiopia, seasonal variability in some weather parameters is among the major bottlenecks of sustainable crop production. Access to weather-related information that can assist farmers in their daily farm decisions is also limited. Therefore, most of the farmers are confronted with a scenario of decision making under climate risks and uncertainties [5]. In Ethiopia, extremes of climatic events are manifesting in the form of flooding, droughts, progressive shifts in rainfall distribution, and extremely hot or cold weather. These problems have been reported in other East African countries like Kenya and Tanzania [6,7].
Variability in climate parameters occurs due to natural and periodic changes in the circulation of the air and ocean, volcanic eruptions, and other related factors. Feistel and Hellmuth [8] reported that fluctuations in relative humidity cause variations in temperature. It was further noted that relative humidity and rainfall are proportionally related, implying that variability in temperature causes fluctuations in both relative humidity and rainfall. Seasonal changes in solar radiations and urbanization also influence temperature variability [9,10]. Sampson et al. [9] also found that urban growth, population increase, deforestation, and air pollutants influence temperature variability. Ruiz-Valero et al. [10] found that variations in solar radiation result in variation in the interior of temperature, while Medvigy and Beaulieu [11] reported that solar radiation variability is correlated with increase rainfall variability.
Moreover, it had been reported that extremes of climate events, largely in the form of variability in rainfall distribution and delay on the onset date are accounting for significant decline in crop yields in different parts of Ethiopia [12]. Crop yields are extremely sensitive to fluctuations in precipitation as well as temperature, and there is a fundamental concern that traditional farming practices may not be suited to produce sufficient crop yields under current climatic contexts. In Ethiopia, it had been reported that some topographical and geographical factors are accounting for climate change within the country [13]. It should also be emphasized that topographic heights bring about the instability of conditional thermodynamic, while the strength of rainfall producing systems such as the Inter-Tropical Convergence Zone (ITCZ) and Tropical Easterly Jet influences the volume and patterns of rainfall over a low topography [14,15].
Some studies have shown positive trend in extreme temperature and rainfall based on some historical data in different regions in Ethiopia [16,17]. Tamiru et al. [18] reported that annual rainfall variability was high in Eastern Ethiopia with variability index of 25%. However, no research has studied the trend and variability of climate factors along specific crop growing area such as the teff growing belt. Therefore, analyses of climate trends and crop yield variability in specific crop growing belt is essential for addressing stagnations in crop productivity in Ethiopia. This paper therefore seeks to characterize rainfall (seasonal) and temperature (minimum and maximum) trends and its variability in teff growing belt of Ethiopia. The findings will be of use to policy makers in making regional decisions on issues pertaining to climate variability in Ethiopia. In the remaining parts of this paper, the data and methods of the study, results and discussion and conclusions were presented.
2 Data and methods
2.1 Selection of study area and climatic variables
This study was carried out in the main teff growing belts of Ethiopia. The major teff growing zones are found in the Amhara region (north Gondar, south Gondar, west Gojam, east Gojam, and north Shea) and Oromia region (north Shea, south west Shea, and east Shea). The rationale for selecting these zones was that these two regions accounted for 85.4% of the land areas cultivated under teff crop during 2017/18 production period. The selected climatic parameters were rainfall (short- and long-season) and temperature (crop growing period mean maximum and minimum temperatures). These were considered as two major climatic variables that have significant impacts on crop production, vegetation covers and water resources.
2.2 Description of the study area
The teff growing belts in Ethiopia mostly cover the Weyna Dega and Kolla agro-climatic zones. Geographically, these belts represent the central and the northwest parts of the country. East Gojjam, east Shewa, west Shewa and north Shewa zones are the four most important teff producing belts and are located in the Amhara and Oromia regional states. However, small quantity of teff is also grown in Tigray, SNNP and Benshangul-Gumuz regions (see Figure 1). Engdawork [19] submitted that the entire Shewa of Oromia and Gojjam of Amhara regions are the major teff surplus producing areas, while the entire Wollo zones, Tigray region, and the Harar/Dire Dawa regions and Somali region are considered as deficit areas.
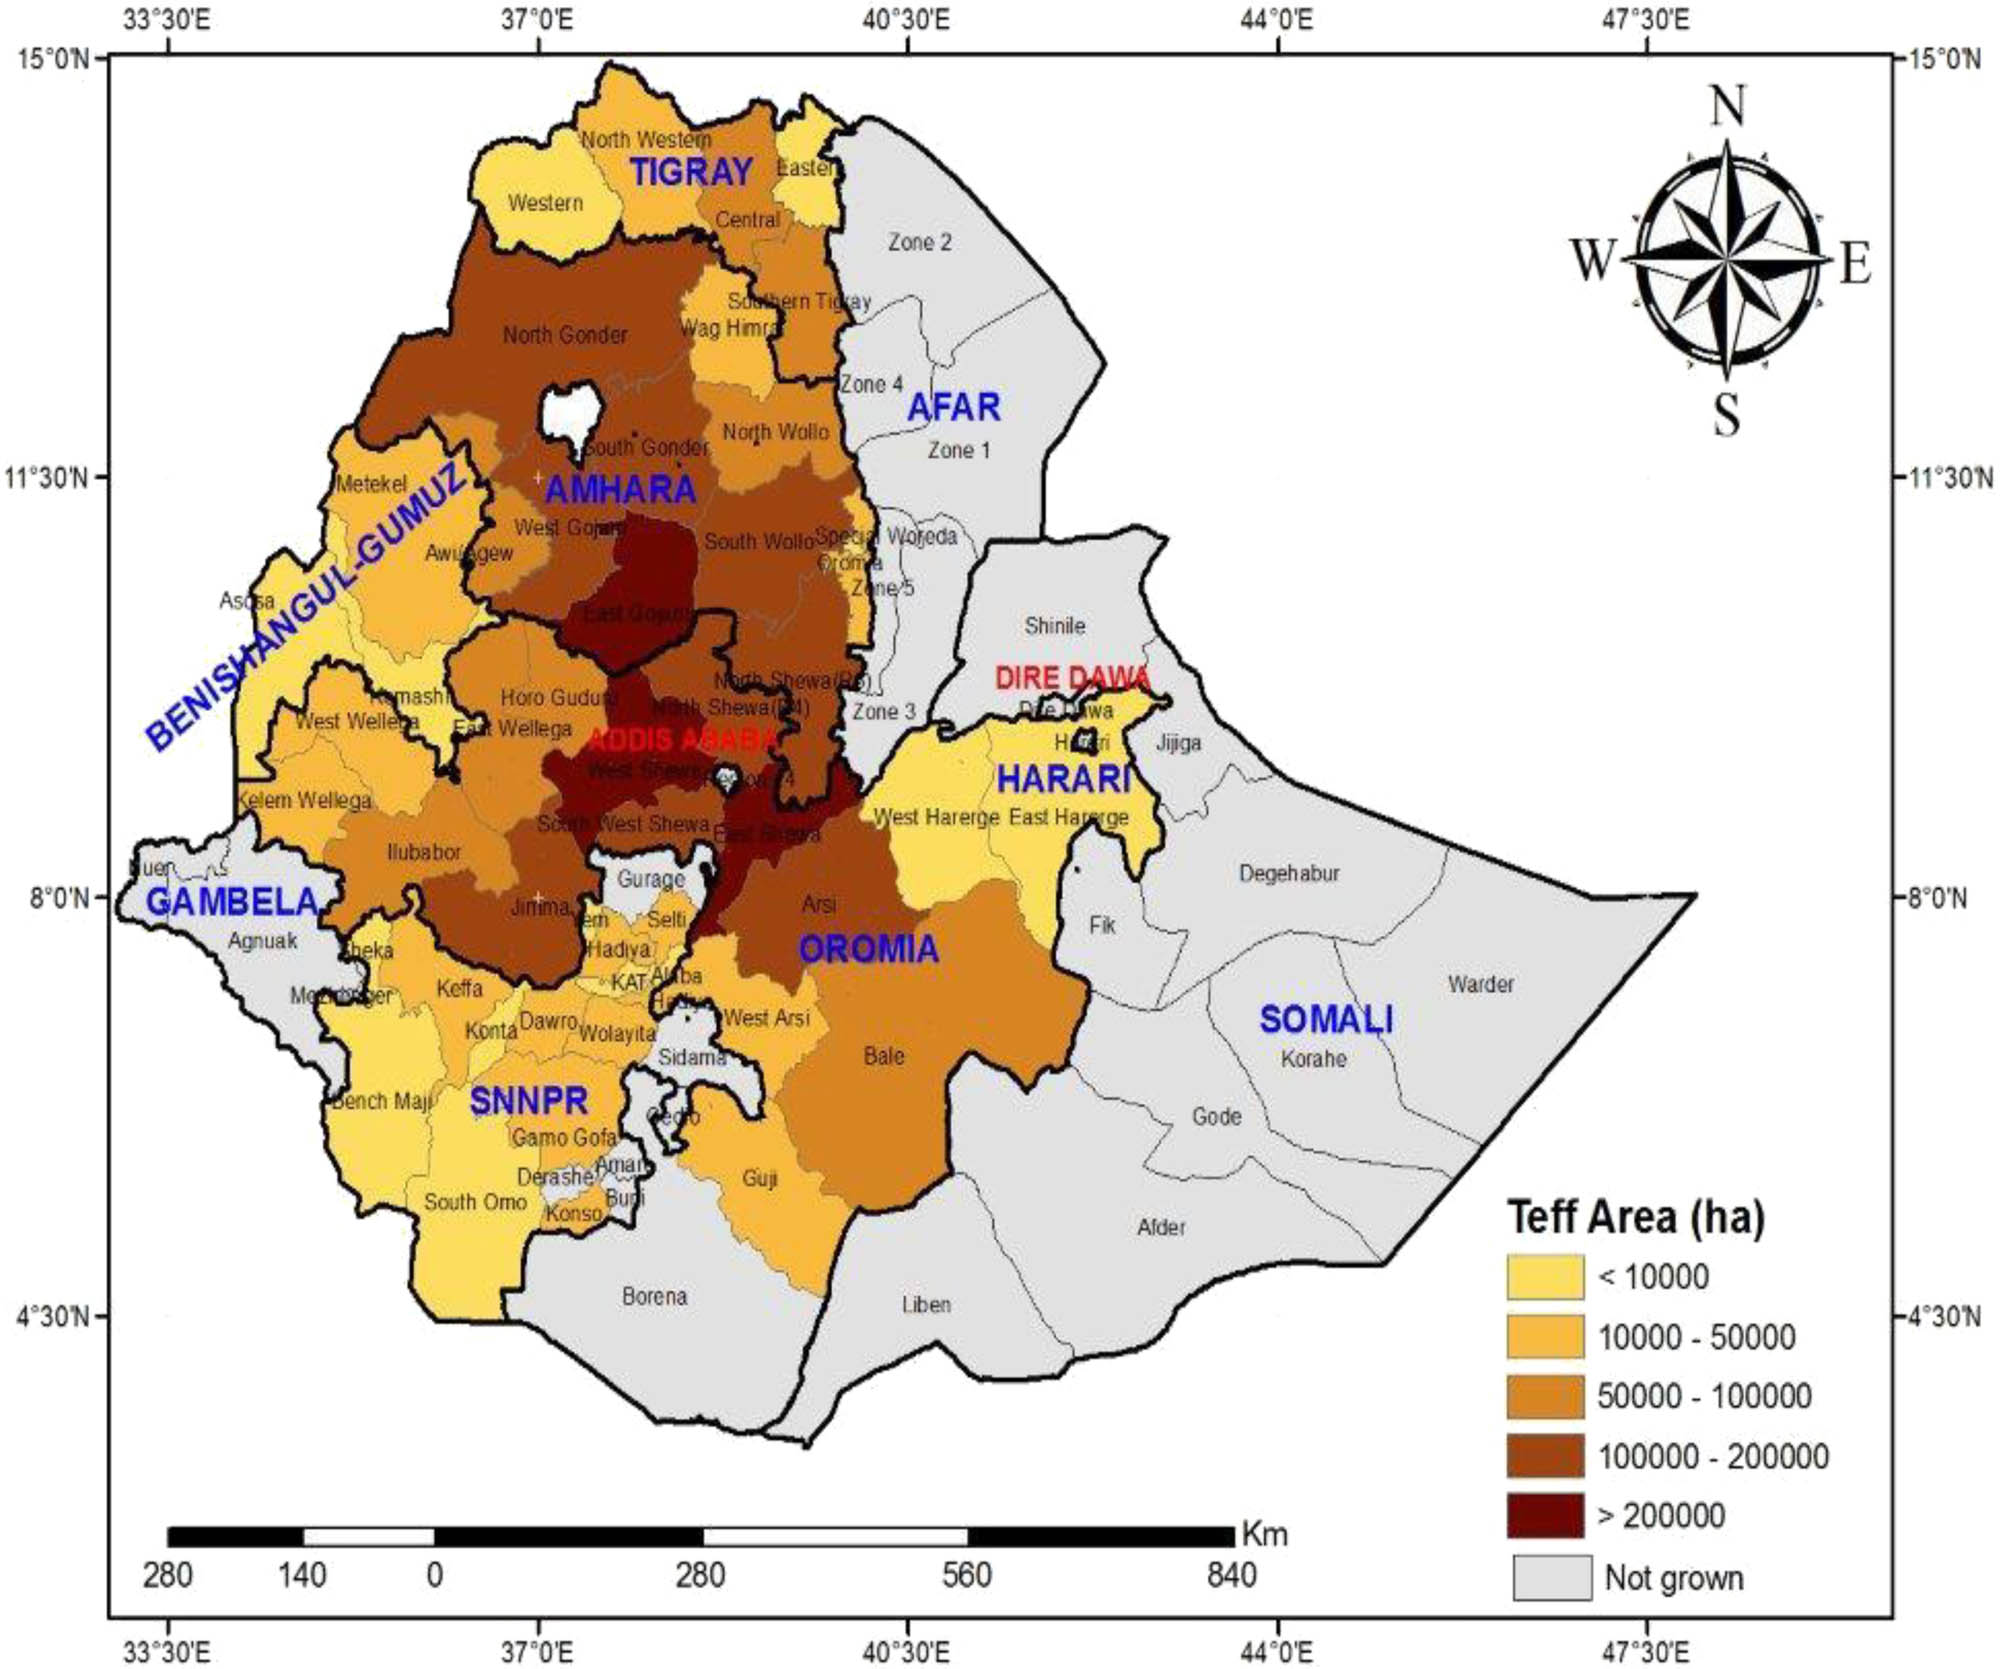
Map of major teff producing areas of Ethiopia. Source: Yumba et al. (2014).
Furthermore, the teff growing areas fall under two patterns of rainfall which are the short-season and long-season rainfall. The short-rainfall season normally covers the central parts of northern highlands (north and south Wollo zones, and north Shewa zones), the central (Shewa zones), the southern mid-highlands (SNNP region), and the eastern highlands (Afar, east and west Hararge zones) of the country. Conversely, the long-rain season covers the southwestern (highland zones of SNNP region), the western (Gambella, west Oromia, and Benishangul-Gumuz regions); northwestern highlands (Awi, Gojam and Gondar zones); the central and highlands of northeastern in the Shewa zones, north and south Wollo zones, southern Tigray zones and highlands of Afar region); the eastern highlands (east and west Hararge zones, and the highlands of Somali region) and southeastern (Arsi and highlands of Bale) parts of the country.
2.3 Data type and sources
The data were obtained from the Ethiopian Central Statistical Agency (CSA) and the Ethiopian National Meteorological Agency (NMA). Some data gaps in teff yields were complemented with FAOSTAT database. The data on weather (temperature and precipitation) for the period from 1981 to 2018 were from the National Meteorological Agency (NMA) of Ethiopia. These data were aggregated and averaged from representative weather stations based in major teff growing belts for the short-rainfall season (February, March, April, and May) and long-rainfall season (June, July, August and September). An aggregate average data at national level for both crop growing seasons were calculated by taking average of the data from the selected weather stations for teff crop over the 1981–2018 period. Data for a total of 12 weather stations that are evenly located in the teff crop growing belt were selected, classified, recorded and used for this study.
The methodological approaches used to collect and analyze climate dada, validation of data and analysis is presented in Figure 2.

Flowchart of methodological framework used to obtain and analyze climate data, modeling trends, and variability of climatic parameters.
2.4 Empirical model specification
In order to address the objective of this study, trends in climate variables (temperature and precipitation) and year-to-year variation of precipitation and temperature had been characterized using standardized anomaly of rainfall (∆R t ) or temperature (∆T t ) and coefficient of variation (CV) of the data series. To investigate the nature of trends in rainfall and temperature data series, linear trend lines has been fitted for both annual and seasonal scenarios. The linear trend line is given by:
On the other hand, the long term standardized anomaly of rainfall (∆R t ) for a given locality or pool of locations over a period t is given by:
where ∆R t is standardized rainfall anomaly, R t is mean annual rainfall of a particular year t, Ṝ t is the long-term mean over a period of observation, and σ is the standard deviation of annual mean rainfall over the long run (period of observation). Similarly, the long term standardized anomaly of temperature (∆T) for a given location or pool of locations over a period t is given by:
where ∆T
t
is standardized temperature anomaly for period t, T
t
is the mean annual temperature of a particular year t,
Furthermore, the inter-seasonal variability of national level aggregated rainfall and temperature variables were evaluated using CV, which is expressed as:
where CV
R,T
represents the CV of aggregate rainfall/temperature variables, σ is the standard deviation of rainfall or temperature data series, and Ṝ and
3 Results
3.1 Trend of climate factors in teff growing belts
A linear trend line has been fitted to both seasons’ rainfall data to identify the extent and direction of changes in both short-season and long-season rainfall in teff growing areas. The results in Figure 3 showed a decreasing trend in the short-season rainfall, while it portrayed an increasing trend in the long-season rainfall. The figure also indicates that the amount of short-season rainfall has a decreasing trend with a magnitude of −0.472 mm but the parameter is statistically insignificant (p > 0.10). Conversely, the long-season rainfall revealed an increasing trend with a magnitude of 2.868 mm and statistically significant (p < 0.10) (Table 1). This implies that as time increase there is significant increase (2.868 mm/year) in the amount of long-season rainfall in teff growing areas.
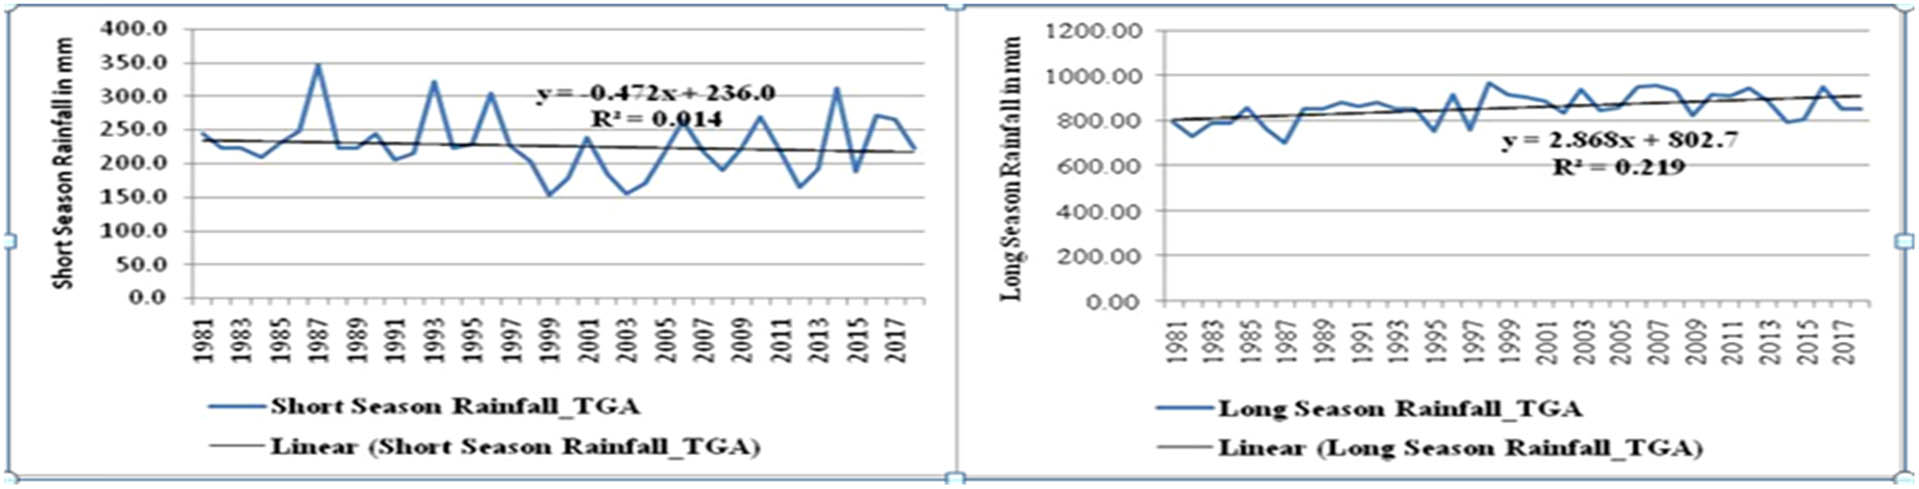
Trend of Short- and Long-Rainfall in teff growing belts, 1981–2018. Source: Computed based on raw data from NMA of Ethiopia, 2019.
Linear trend determinant of rainfall teff growing areas of Ethiopia (1981–2018)
| Variables | β (slope) | St. error | t-stat | Adjusted R 2 | PIF |
|---|---|---|---|---|---|
| Short-season rainfall_TGA | −0.472 | 0.658 | −0.718 | −0.013 | 1.000 |
| Long-season rainfall_TGA | 2.868** | 0.900 | 3.187 | 0.20 | 1.000 |
**Indicates 10% level of significance.
Provision of some variability indices for some time intervals would make more meaning in analyzing data on climate factors given that climate change is about variability in the weather parameters over time. Consequently, the pattern and trend in seasonal rainfall in teff growing areas over time had been examined in decadal intervals so as to understand more about the variability in weather parameters. Figure 4 presents pattern and trend of decadal short-season and long-season rainfall in teff growing areas. The graph depicts that short season rainfall decreased over 5 years, shift direction and increased up to the seventh year, and then starts decreasing till the ninth year of each decade in a similar fashion. Moreover, long season rainfall revealed a slight rising tendency in all decadal categories in the teff growing areas. In general, the decadal short-season rainfall exhibited relatively pronounced fluctuations or variations than that of long-season rainfall over each of the decades in teff growing areas.

Pattern and trend of decadal short- and long-season rainfall in teff growing areas.
Table 2 shows the trends of decadal short- and long-season rainfall. However, only the trend slope values in the first decade (1981–1990) were statistically significant, with a magnitude of 10.05 mm/decade for teff growing areas. Although none is statistically significant (p > 0.10), short-season decadal rainfall trend values revealed pronounced variation.
Decadal trend of seasonal rainfall data in Teff growing areas (1981–2018)
| Season | Crop growing area | Decadal categories | 1981–2018 | |||
|---|---|---|---|---|---|---|
| 1981–1990 | 1991–2000 | 2001–2010 | 2011–2018 | |||
| Short-season rainfall | Teff | 2.520 | −7.114 | 5.538 | 7.424 | −0.472 |
| Long-season rainfall | Teff | 10.05* | 6.316 | 3.245 | −7.77 | 2.868** |
* and ** represents 5 and 10% level of significance, respectively.
In order to analyze the pattern and trends of temperature in teff growing areas, maximum (MaxTemp) and minimum (MinTemp) temperature data were collected from 12 weather stations as recorded by NMA of Ethiopia and aggregated for each crop. Ordinary linear regression ((OLR) ŷ = αt + β) was adopted where the rate of change is expressed as α and crop growing period temperatures as ŷ at the given time, t. The gradient of trends was calculated using the slope of the linear regression expressed in °C per year.
Figure 5 presents the pattern and trend of maximum and minimum temperatures in teff growing areas over the period 1981–2018. The results of the trend analysis of temperatures in Table 3 revealed that both maximum and minimum temperatures showed increasing trend over the period. The rate and magnitude of the trend were 0.13°C for maximum temperature and 0.16°C for minimum temperature. The trend values estimated for both maximum and minimum temperatures were statistically significant (p < 0.01). The results indicated that with increase in time, there would be rise in maximum temperature by 0.13 and 0.16°C in minimum temperature.

Trend of temperature in teff growing areas, 1981–2018. Source: Computed based on raw data from NMA of Ethiopia, 2019.
Temperature trend (slope) test-statistic for teff growing areas over 1981–2018
| Variables | β (slope) | St. error | t-stat | Adjusted R 2 | Durbin–Watson | PIF |
|---|---|---|---|---|---|---|
| MaxTemp_TGA | 0.134*** | 0.025 | 5.290 | 0.42 | 1.822 | 1.000 |
| MinTemp_TGA | 0.157*** | 0.024 | 6.530 | 0.53 | 1.573 | 1.000 |
*** indicates 1% level of significance.
3.2 Climate change and variability in teff growing belts
In order to analyze variability in rainfall, standardized anomaly of rainfall (deviations from long period mean) and CV were employed. In the case of rainfall anomaly, very low values of rainfall anomaly correspond to severe drought periods. On the other hand, the degree of rainfall variability (CV) is classified as less variable (CV < 20%), moderately variable (20–30%) and highly variable (CV > 30%), [24].
Figure 6 presents the short-season rainfall and long-season rainfall anomalies in the teff growing areas in 1981–2018. The rainfall anomaly during short-rainfall season in teff growing areas ranged from +2.50 in 1987 to −0.92 in 1984 while it ranged from +1.16 in 1998 to −2.85 in 1982 during long-season rainfall. The result indicates that the average rainfall anomaly in teff growing areas during both short-season and long-season rainfall over the years 1981–1987, 1997/98, 2003/04, and 2014/15 were found to be very low and severe. These years were found to coincide with the drought years of 1984/85, 1993/94, 2003/04, and 2014/15. As standardized rainfall anomalies in seasonal or annual is less than negative one (<−1), it indicates a severe and extreme drought. Therefore, the years from 1999 to 2006 during short-season rainfall and the years from 1981 to 1987 during long-season rainfall defined some severe and extreme droughts in teff growing areas. Equally, the CV showed that short-season rainfalls are moderately variable (CV = 20%) and less variable during the long-season rainfall (CV = 14.4%) in teff growing areas (See Table 4).

Short- and Long-season rainfall anomaly in teff growing areas, 1981–2018.
Seasonal mean rainfall and CV teff crop growing areas
| Season | CV | Mean | St. dev |
|---|---|---|---|
| Short-rainfall season | 19.63 | 223.1 | 43.80 |
| Long-rainfall season | 14.42 | 828.2 | 119.41 |
Source: Computed based on raw data from NMA of Ethiopia, 2019.
The seasonal rainfalls prevailed over the study period (from 1981 to 2018) have also been analyzed in four decadal categories to facilitate easy comprehension of the variability in weather parameters over time. Figure 7 shows the long-season rainfall anomalies by decadal categories. Long-season rainfall anomalies in the first (1981–1990) and second (1991–2000) decades exhibited almost similar results, that is negative (−) values from first to seventh years and positive (+) value during the eighth, ninth and tenth years. The negative values from first to fourth and seventh years in both decades exhibited severe and extremely dry years. In the third and fourth decadal categories, the long-season rainfall anomalies showed more fluctuations than the first and second decadal categories.

Decadal long-season rainfall anomaly in teff growing areas.
The variability in seasonal rainfall has also been examined based on decadal category of the CVs categorized. Table 5 shows that short-season rainfall was moderately variable in the second (23%) and fourth (22%) decadal categories. Short-season rainfalls are less variable in the remaining decadal categories, exhibiting a CV ranging from 11.5 to 19%. Contrastingly, long-season rainfall exhibited less variability in all decadal categories.
Decadal CV% for short- and long-season rainfalls in teff growing areas, 1981–2018
| Seasonal rainfall type | Crop area | CV (%) per decade and overall period | ||||
|---|---|---|---|---|---|---|
| I. 1981–1990 | II. 1991–2000 | III. 2001–2010 | IV. 2011–2018 | 1981–2018 | ||
| Short-season rainfall | Teff | 16.2 | 22.8 | 18.0 | 21.8 | 19.6 |
| Long season rainfall | Teff | 7.5 | 7.9 | 5.7 | 6.6 | 14.4 |
In general, as verified by CV, rainfall was found more variable during short-season and less variable during long-season. The standardized seasonal or annual rainfall anomalies was less than negative one (<−1). This indicates a severe and extreme droughts. Accordingly, the standardized rainfall anomalies from first to fourth and seventh years in the first and second decades exhibited severe and extremely dry years. These years were found to coincide with the major drought years documented in the country, particularly with the drought years of 1984/85, 1993/94, 2003/04, and 2014/15.
In order to examine the extent of variability in temperature parameters, analysis has been carried out using standardized anomalies of temperature depicted in figures and CV as analytical tools. The crop growing period (Feb–Sept) mean maximum and minimum temperatures were estimated to be 25.8 and 11.7°C, respectively (see Table 6).
Descriptive statistics for maximum and minimum temperatures in teff growing areas
| Variables | CV (%) | Mean (°C) | Std error | St. dev |
|---|---|---|---|---|
| MaxTemp | 2.24 | 25.8 | 0.0890 | 0.5484 |
| MinTemp | 5.10 | 11.7 | 0.0973 | 0.5995 |
Figure 8 presents anomalies of maximum and minimum temperatures. The results showed that maximum temperature anomalies were very low and negative over the period of 1981–1997. As opposed to that, between 2003 and 2018, the maximum temperature anomalies were positive. The anomalies of minimum temperature almost followed the same pattern as that of maximum temperature. The CV for both maximum (2.24%) and minimum temperatures (5.1%) showed less variability.

Anomalies of maximum and minimum temperature in teff growing areas, 1981–2018.
Furthermore, decadal anomalies of temperatures variables have been examined. Figure 9 presents analysis of standardized decadal anomalies of minimum and maximum temperatures in teff growing areas. It can be observed that minimum temperatures in most cases have positive anomalies in the first (1981–1990) and second (1991–2000) decades. The results imply a presence of pronounced variations in minimum temperature across the decadal categories.

Decadal minimum and maximum temperature anomalies in teff growing areas.
The decadal pattern of maximum temperature anomalies revealed positive value for 5 years in the first decade and negative values for 4 years each in the second (1991–2000) and third (2001–2010) decadal categories (see Figure 9).
3.3 Crop yield variability in crop growing areas
In order to measure the degree of variability in cereal crops yield, crop yield anomalies and CV have been used. Figure 10 presents year to year crop yield anomalies for teff crop in 1981–2018. The year to year teff yield anomalies depicted a negative values from 1981 to 2006, except in 1991. It also portrayed a positive value from 2006 to 2018, but with more of increasing trend from 2011 to 2018. The positive values in the preceding analysis represent a positive effect on yield anomalies while the negative values indicate negative effect on yield anomalies. In other words, a positive yield anomaly shows that data is above the mean value (long-term mean), while negative yield anomaly signifies negative impact of the climate or weather and vice versa. It can be observed from the figure that teff crop showed yield variability (negative value) in similar fashion during the first two and half (2½) decades and a positive and increasing yield anomalies over the last decade (2007–2018).

Year to year yield anomalies of teff crop.
The CV that were computed for the yields of teff confirmed variability over the study’s period. Table 7 presents the CVs for teff crop over the period 1981–2018. The CV exhibited that the yield of teff is moderately variable with a variability index of 30%.
CV for teff yield over the period 1981–2018
| Crop | No of observations | CV (%) | Mean (kgs) | St. deviation | Variability |
|---|---|---|---|---|---|
| Teff | 38 | 30.0 | 1012.4 | 303.8 | Moderately variable |
Source: Computed based on raw data from CSA, Consecutive Bulletins.
4 Discussion
The short-season rainfall exhibited a declining trend due to changes that are annually experienced in some environmental parameters, which have resulted into global warming. The decline of short-season rainfall in eastern, south and southwestern Ethiopia is caused by the corresponding persistent warming of the South Atlantic Ocean and Sea Surface Temperature (SST) over the tropical eastern Pacific Ocean that influence El Niňo-Southern Oscillation (ENSO) episodes [20]. The results on seasonal rainfall decline also agree with that of Hayelom et al. [21] who in their analysis of trends of precipitation and temperature in Southern Tigray of Ethiopia over the period 1981–2010 found an increasing (positive) and significant trend in summer (long-season) rainfall. Birara et al. [22] also analyzed the trend and variability of rainfall and temperature in the Tana basin area of Ethiopia using data obtained from selected weather stations for the period 1980–2015 and observed a significant increasing trend in rainfall in Kimerdengay (3.94 mm/year) and Addis Zemen (2.5 mm/year) weather stations during the long-rainfall season. Arragaw and Woldeamlak [23] in their study of spatiotemporal variability and trends in rainfall and temperature in the central highlands of Ethiopia over the period 1983–2013 reported an increasing trend in long-season rainfall (June to September), although insignificant. Conversely, the findings of Asfaw et al. [16] contradicts with the results of the current study. In their study in the north central Ethiopia (Woleka Sub-basin) covering the period 1981–2015 found a significant decline in annual and long-season with a magnitude of −1.503 and −1.312, respectively.
The long- and short-season rainfall trend analysis in decadal category had also been conducted by some researchers in a similar approach. Yadav et al. [24] analyzed the decadal trends of seasonal rainfall in Uttar Pradesh region of India, using data stretching through 1954–2013. The examination ultimately affirmed that the main season or monsoon (JJAS) rainfall demonstrated an increasing trend (0.5 mm/year) between 1954 and 1983, while a decreasing trend (−2.09 mm/year) was recorded during the period of 1984–2013, evidencing a divergent from the overall period (1954–2013) trend value (−4.143 mm/year). Likewise, Naveendrakumar et al. [25] interpreted the seasonal rainfall trends in Sri Lanka using 50-year data, from 1961 to 2010. The 50-year data were subsequently divided into five decades and the trend slopes of annual rainfall during the last decade (2001–2010) showed an increasing trend (+2.6 mm/year) which was significant and a decreasing trend (negative) during the other four decades (1961–1970; 1971–1980; 1981–1990; and 1991–2000).
Equally, the results of trend analysis of temperature parameters revealed an increasing trend in the mean maximum and minimum temperatures over the period under study. The results align with global warming, which modifies rainfall patterns, lengthens crop growing season in some regions, brings extreme events like flooding and droughts, and alters the ranges of some infectious diseases. The increase in crop growing period mean temperatures correlates with decreasing trend observed in the short-season rainfall which may affect seedbed preparation for cereal crops including teff. This finding has been confirmed by the study findings of Benti and Abera [26] who in their study of climatic parameters in Masha of Southern Ethiopia reported that increasing temperatures had direct relationship with decreasing rainfall; both phenomena might be related to rising of atmospheric CO2. They reported that annual temperature was increased as global CO2 increased while rainfall was decreased. This increase of temperature and global cumulative CO2 and decline of rainfall can affect agricultural production of the region, which needs to improve soil and water management, short season seed supply, and pipe irrigation practices to reduce the risks of climate change.
Regarding the trends in temperature parameters, the findings of this study are consistent with other studies conducted in Ethiopia and climatically related countries. Warwade et al. [27] found that in India, both maximum and minimum temperatures showed significantly increasing trend over the period of study. On the other hand, Hayelom et al. [21] in their study in Northern Ethiopia found an increasing trend in maximum temperature with a rate of change of 0.0013. Furthermore, Daba [28] in his analysis of the agro-climatic variability of selected woredas of western Oromia in Ethiopia observed an increasing trend in average annual minimum and maximum temperature of Bako area (known for growing maize and teff crops) which was statistically significant. Tamiru et al. [18] in their analysis of rainfall and temperature variability in Miesso area of eastern Ethiopia over the period 1990–2009 also found a consistent increasing trend of long and short season minimum temperature with trend values of 0.137 and 0.0124°C, respectively. They also found a consistent increasing trend in average maximum temperature during short-rain season and a slightly increasing trend in average maximum temperature during long-rain season with a magnitude of 0.1113 and 0.060°C/year respectively.
As to the variability of climatic parameters, the result of this study agrees with the findings of Dagne [29] and Abegaz and Mekoya [30]. Dagne [29] in his study of climate change and variability in Sekota Woreda of Ethiopia found moderately variable long-season rainfall (CV = 23.8%) and inter-annual rainfall fluctuation as annual rainfall anomalies (defined as deviations from the 30-year mean rainfall) were not consistent throughout the 30 years. It was also found that approximately half of the years within the study periods experienced annual rainfall that was below normal (mean). Abegaz and Mekoya [30] in their analysis of variability and time series trend of rainfall and temperature in the north central Ethiopia found rainfall anomalies for years 1984, 1987, 1991–1992, 1993–1994, 2002, 2009, 2012, 2015/2016 which were also drought years that either coincided or followed El Nino events. Further, Dandesa et al. [31] in their assessment of climate variability in Borena zone, Ethiopia using rainfall anomaly found that the sone received seven years of moderate to extreme wetness and eight years of moderate to extreme dryness out of the thirty-two years study period. The time series based rainfall anomalies indicated drought occurrence during 1984, 1992, 2000, 2004, 2009 and 2011.
Regarding variability in yield of teff, the study findings corroborate with the findings of Omoyo et al. [32] and Panda et al. [33]. Omoyo et al. [32] examined some selected climate variable and maize yield variability in eastern Kenya and reported that the distribution of the entire crop yield data set was varying with magnitude from +3 to −3. Thus, the higher the values of maize yield anomaly, the higher the impact of the climate. Panda et al. [33] in their study on climate and crop yield variability in three districts of Odisha, India observed negative crop yields in maize and rice due to rainfall deficits.
5 Strengths and limitations
The strength of this study was its focus on specific crop growing belts, which may have nearly similar agro-ecology. Although teff is found in almost all cereal growing areas of Ethiopia, the major teff growing belts are the Central and Mid-highland areas of the country. Studying and availing reliable information on the trend and variability of climatic parameters prevailing in such specific agro-ecologies will enable policy makers to design appropriate adaptation and mitigation strategies that curb the threats driven from increasing temperatures and declining seasonal and annual rainfalls. On the other hand, the limitation of the study was its coverage of climatic parameters. This study considered seasonal rainfall and temperature variables. Climatic parameters, however, encompass air pressure, relative humidity, solar radiation, and CO2. These climatic factors should be the focus of future research in the same agro-ecology and landscape.
6 Conclusion, recommendation and future directions
The results indicated that short-season rainfall had a decreasing trend while long-season rainfall increased. However, the results of temperatures trend analysis revealed that both maximum and minimum temperatures had increasing trend. There was high variability of rainfall during short-season and less variability during long-season. Furthermore, there were some anomalies in the yields of teff. Variability in rainfall and temperature has some implications on crop production and food security. Therefore, the negative impacts of these climatic parameters can be addressed through development of some adaptation strategies. These should include the use of drought resistant crop varieties, short duration crop varieties and crop diversification, changes in calendar of crop planting, conserving soil moisture through appropriate tillage practices, and improvement in the efficiency of irrigation. Furthermore, afforestation and reforestation measures need to be expanded to decarbonize emissions through carbon sequestration. It is also recommended that future research should include additional climatic parameter such as air pressure, relative humidity, solar radiation and CO2.
Acknowledgments
The authors are grateful to the different Institutions that made available the dataset used in this study.
-
Funding information: The authors state no funding involved.
-
Author contributions: AG conceptualized and wrote the manuscript as part his PhD thesis under the supervision of AS. AS provided supervisory role and assisted in rewriting the introduction and verifying some of the results.
-
Conflict of interest: The authors state no conflict of interest.
-
Data availability statement: The data that support the findings of this study are available from Ethiopian Central Statistical Agency, the Ethiopian National Meteorological Agency, and FAOSTAT but restrictions apply to the availability of these data, which were used under license for the current study, and so are not publicly available.
References
[1] Hatamian M, Rezaei Nejad A, Kafi M, Souri MK, Shahbazi K. Interaction of lead and cadmium on growth and leaf morphophysiological characteristics of European hackberry (Celtis australis) seedlings. Chem Biol Technol Agric. 2020;7(1):1–8.2.10.1186/s40538-019-0173-0Search in Google Scholar
[2] Ebrahmi M, Souri MK, Mousavi A, Sahebani N. Biochar and vermicompost improve growth and physiological traits of eggplant (Solanum melongena L.) under deficit irrigation. Chem Biol Technol Agric. 2021;8(1):1–14.10.1186/s40538-021-00216-9Search in Google Scholar
[3] Berhane A, Hadgu G, Worku W, Abrha B. Trends in extreme temperature and rainfall indices in the semi‑arid areas of Western Tigray, Ethiopia. Env Syst Res. 2020;9(3):1–20.10.1186/s40068-020-00165-6Search in Google Scholar
[4] Eshetu G, Johansson T, Garedew W. Rainfall trend and variability analysis in Setema-Gatira area of Jimma, Southwestern Ethiopia. Afr J Agric Res. 2016;11(32):3037–45.10.5897/AJAR2015.10160Search in Google Scholar
[5] Teklu T. An overview of tef and durum wheat production in Ethiopia. Addis Ababa, Ethiopia: Institute of Agricultural Research; 2000.Search in Google Scholar
[6] Gebrechorkos SH, Hulsmann S, Bemofer C. Changes in temperature and precipitation extremes in Ethiopia, Kenya and Tanzania. Int J Climatol. 2018;39:18–30.10.1002/joc.5777Search in Google Scholar
[7] FAO. Analysis of price incentives for Teff in Ethiopia, Technical notes series, MAFAP by Assefa B., Demeke M., Lanos B, Rome; 2015.Search in Google Scholar
[8] Feistel R, Hellmuth O. Relative humidity: a control valve of the steam engine climate. J Human Earth Future. 2021;2(2):140–82.10.28991/HEF-2021-02-02-06Search in Google Scholar
[9] Sampson AP, Weli VE, Nwagbara MO, Eludoyin OS. Sensations of air temperature variability and mitigation strategies in urban environments. J Human Earth Future. 2021;2(2):100–13.10.28991/HEF-2021-02-02-02Search in Google Scholar
[10] Ruiz-Valero L, Faxas-Guzmán J, Ferreira J, González V, Guerrero N, Ramirez F. Thermal performance of facades based on experimental monitoring of outdoor test cells in tropical climate. Civ Eng J. 2021;7(12):1982–97.10.28991/cej-2021-03091773Search in Google Scholar
[11] Medvigy D, Beaulieu C. Trends in daily solar radiation and precipitation coefficients of variation since 1984. J Clim. 2011;25:1330–9.10.1175/2011JCLI4115.1Search in Google Scholar
[12] Bekele F. Characterizing current and future rainfall variability and its effect on wheat and barley production in Sinana District, South Eastern Ethiopia. Unpublished MSc Thesis. Haramaya University; 2015.Search in Google Scholar
[13] Asnani G. Tropical meteorology. Revised (1st edn). 2005.Search in Google Scholar
[14] Tesfaye H. Climatic variability and support feedback mechanism in relation to the Sahelo-Ethiopian droughts. M.Sc. Thesis, Department of Meteorology, U.K: University of Reading; 1986.Search in Google Scholar
[15] Hoefsloot P. LEAP (Livelihood Early Assessment Protection) version 2.1 for Ethiopia. By collaborative action of FAO, World Bank and World food programme. The Netherlands; 2009.Search in Google Scholar
[16] Asfaw A, Simane B, Hassen A, Bantider A. Variability and time series trend analysis of rainfall and temperature in northcentral Ethiopia: a case study in Woleka sub-basin. Weather Clim Extrem. 2018;19:29–41.17.10.1016/j.wace.2017.12.002Search in Google Scholar
[17] Mekasha A, Tesfaye K, Duncan AJ. Trends in daily observed temperature and precipitation extremes over three ethiopian eco-envirnments. Int J Climatol. 2014;34:1990–9.10.1002/joc.3816Search in Google Scholar
[18] Tamiru S, Tesfaye K, Mamo G. Analysis of rainfall and temperature variability to guide Sorghum (Sorghum bicolor) production in Miesso Areas; Eastern Ethiopia. Int J Sustain Agric. 2015;2(1):1–11.10.18488/journal.70/2015.2.1/70.1.1.11Search in Google Scholar
[19] Engdawork T. Understanding Teff: A review of supply and marketing issues. Addis Ababa, Ethiopia: Ethiopia Commodity Exchange Authority; 2009.Search in Google Scholar
[20] Seleshi Y, Zanke U. Recent changes in rainfall and rainy days in Ethiopia. Int J Climatol. 2004;24:973–83.10.1002/joc.1052Search in Google Scholar
[21] Hayelom B, Chen Y, Marsie Z, Negash M. Temperature and precipitation trend analysis over the Last 30 Years in Southern Tigray Regional State, Ethiopia; 2017, www.preprints.org.10.20944/preprints201702.0014.v1Search in Google Scholar
[22] Birara, H, Pandey RP, Mishra SK. Trend and variability analysis of rainfall and temperature in the Tana basin region, Ethiopia. J Water Clim Change. 2018;9:555–68, https://iwaponline.com/jwcc/article-pdf/9/3/555/484803/jwc0090555.10.2166/wcc.2018.080Search in Google Scholar
[23] Arragaw A, Woldeamlak B. Local spatio temporal variability and trends in rainfall and temperature in the central highlands of Ethiopia. Geogr Ann Phys Geogr. 2017;99:85–101. 10.1080/04353676.2017.1289460.Search in Google Scholar
[24] Yadav S, Sachan AK, Basu D. Decadal trend analysis of rainfall over Uttar Pradesh (India). Disaster Adv. 2019;12(2):1–7.Search in Google Scholar
[25] Naveendrakumar G, Vithanage M, Kwon HH, Iqbal MCM, Pathmarajah S, Obeysekera J. Five decadal trends in averages and extremes of rainfall and temperature in Sri Lanka. Adv Meteorol. 2018;2018:1–13. 10.1155/2018/4217917.Search in Google Scholar
[26] Benti F, Abera M. Trend analyses of temperature and rainfall and their response to global CO2 Emission in Masha, Southern Ethiopia. J Sustain Agric. 2019;34(1):67–75.10.20961/carakatani.v34i1.28022Search in Google Scholar
[27] Warwade P, Sharma N, Ahrens B, Pandey A. Characterization and analysis of the trend of climate variable (temperatures) for the North Eastern Region of India. Int J Recent Sci Res. 2015;6(4):3618–24.Search in Google Scholar
[28] Daba M. Agro climatic characterization in selected woredas of Western Oromia, Ethiopia. J Earth Sci Clim Change. 2018;9(3):1–7.10.4172/2157-7617.1000455Search in Google Scholar
[29] Dagne GB. Climate change and variability: Smallholder farmers’ perceptions and indigenous adaptation responses in Sekota Woreda, Amhara Region, Northeast Ethiopia. Unpublished MSc Dissertation. Addis Ababa University; 2018.Search in Google Scholar
[30] Abegaz WB, Mekoya A. Rainfall variability and trends over Central Ethiopia. Int J Environ Sci Nat Resour. 2020;24(4):0215–27.31.10.19080/IJESNR.2020.24.556144Search in Google Scholar
[31] Dandesa T, Korecha D, Nigatu L, Cheneka BR. Assessment of climatic variability and development of localized climate prediction method for livestock production in borana area. Southern Ethiopia; Env Sci Ind J. 2017;13(3):1–30.Search in Google Scholar
[32] Omoyo NN, Wakhungu J, Oteng S. Effects of climate variability on maize yield in the arid and semi arid lands of lower eastern Kenya. Agric Food Secur. 2015;4(8):1–13.33.10.1186/s40066-015-0028-2Search in Google Scholar
[33] Panda A, Sahu N, Behera S, Sayama T, Sahu L, Avtar R, et al. Impact of climate variability on crop yield in Kalahandi, Bolangir, and Koraput Districts of Odisha, India. Climate. 2019;7(126):1–12. 10.3390/cli7110126.Search in Google Scholar
© 2022 Abera Gayesa Tirfi and Abayomi Samuel Oyekale, published by De Gruyter
This work is licensed under the Creative Commons Attribution 4.0 International License.
Articles in the same Issue
- Regular Articles
- Foliar application of boron positively affects the growth, yield, and oil content of sesame (Sesamum indicum L.)
- Impacts of adopting specialized agricultural programs relying on “good practice” – Empirical evidence from fruit growers in Vietnam
- Evaluation of 11 potential trap crops for root-knot nematode (RKN) control under glasshouse conditions
- Technical efficiency of resource-poor maize farmers in northern Ghana
- Bulk density: An index for measuring critical soil compaction levels for groundnut cultivation
- Efficiency of the European Union farm types: Scenarios with and without the 2013 CAP measures
- Participatory validation and optimization of the Triple S method for sweetpotato planting material conservation in southern Ethiopia
- Selection of high-yield maize hybrid under different cropping systems based on stability and adaptability parameters
- Soil test-based phosphorus fertilizer recommendation for malting barley production on Nitisols
- Effects of domestication and temperature on the growth and survival of the giant freshwater prawn (Macrobrachium rosenbergii) postlarvae
- Influence of irrigation regime on gas exchange, growth, and oil quality of field grown, Texas (USA) olive trees
- Present status and prospects of value addition industry for agricultural produce – A review
- Competitiveness and impact of government policy on chili in Indonesia
- Growth of Rucola on Mars soil simulant under the influence of pig slurry and earthworms
- Effect of potassium fertilizer application in teff yield and nutrient uptake on Vertisols in the central highlands of Ethiopia
- Dissection of social interaction and community engagement of smallholder oil palm in reducing conflict using soft system methodology
- Farmers’ perception, awareness, and constraints of organic rice farming in Indonesia
- Improving the capacity of local food network through local food hubs’ development
- Quality evaluation of gluten-free biscuits prepared with algarrobo flour as a partial sugar replacer
- Effect of pre-slaughter weight on morphological composition of pig carcasses
- Study of the impact of increasing the highest retail price of subsidized fertilizer on rice production in Indonesia
- Agrobiodiversity and perceived climatic change effect on family farming systems in semiarid tropics of Kenya
- Influences of inter- and intra-row spacing on the growth and head yield of cabbage (Brassica oleracea var. capitata) in western Amhara, Ethiopia
- The supply chain and its development concept of fresh mulberry fruit in Thailand: Observations in Nan Province, the largest production area
- Toward achieving sustainable development agenda: Nexus between agriculture, trade openness, and oil rents in Nigeria
- Phenotyping cowpea accessions at the seedling stage for drought tolerance in controlled environments
- Apparent nutrient utilization and metabolic growth rate of Nile tilapia, Oreochromis niloticus, cultured in recirculating aquaculture and biofloc systems
- Influence of season and rangeland-type on serum biochemistry of indigenous Zulu sheep
- Meta-analysis of responses of broiler chickens to Bacillus supplementation: Intestinal histomorphometry and blood immunoglobulin
- Weed composition and maize yield in a former tin-mining area: A case study in Malim Nawar, Malaysia
- Strategies for overcoming farmers’ lives in volcano-prone areas: A case study in Mount Semeru, Indonesia
- Principal component and cluster analyses based characterization of maize fields in southern central Rift Valley of Ethiopia
- Profitability and financial performance of European Union farms: An analysis at both regional and national levels
- Analysis of trends and variability of climatic parameters in Teff growing belts of Ethiopia
- Farmers’ food security in the volcanic area: A case in Mount Merapi, Indonesia
- Strategy to improve the sustainability of “porang” (Amorphophallus muelleri Blume) farming in support of the triple export movement policy in Indonesia
- Agrarian contracts, relations between agents, and perception on energy crops in the sugarcane supply chain: The Peruvian case
- Factors influencing the adoption of conservation agriculture by smallholder farmers in KwaZulu-Natal, South Africa
- Meta-analysis of zinc feed additive on enhancement of semen quality, fertility and hatchability performance in breeder chickens
- Meta-analysis of the potential of dietary Bacillus spp. in improving growth performance traits in broiler chickens
- Biocomposites from agricultural wastes and mycelia of a local mushroom, Lentinus squarrosulus (Mont.) Singer
- Cross transferability of barley nuclear SSRs to pearl millet genome provides new molecular tools for genetic analyses and marker assisted selection
- Detection of encapsulant addition in butterfly-pea (Clitoria ternatea L.) extract powder using visible–near-infrared spectroscopy and chemometrics analysis
- The willingness of farmers to preserve sustainable food agricultural land in Yogyakarta, Indonesia
- Transparent conductive far-infrared radiative film based on polyvinyl alcohol with carbon fiber apply in agriculture greenhouse
- Grain yield stability of black soybean lines across three agroecosystems in West Java, Indonesia
- Forms of land access in the sugarcane agroindustry: A comparison of Brazilian and Peruvian cases
- Assessment of the factors contributing to the lack of agricultural mechanization in Jiroft, Iran
- Do poor farmers have entrepreneurship skill, intention, and competence? Lessons from transmigration program in rural Gorontalo Province, Indonesia
- Communication networks used by smallholder livestock farmers during disease outbreaks: Case study in the Free State, South Africa
- Sustainability of Arabica coffee business in West Java, Indonesia: A multidimensional scaling approach
- Farmers’ perspectives on the adoption of smart farming technology to support food farming in Aceh Province, Indonesia
- Rice yield grown in different fertilizer combination and planting methods: Case study in Buru Island, Indonesia
- Paclobutrazol and benzylaminopurine improve potato yield grown under high temperatures in lowland and medium land
- Agricultural sciences publication activity in Russia and the impact of the national project “Science.” A bibliometric analysis
- Storage conditions and postharvest practices lead to aflatoxin contamination in maize in two counties (Makueni and Baringo) in Kenya
- Relationship of potato yield and factors of influence on the background of herbological protection
- Biology and life cycle Of Diatraea busckella (Lepidoptera: Crambidae) under simulated altitudinal profile in controlled conditions
- Evaluation of combustion characteristics performances and emissions of a diesel engine using diesel and biodiesel fuel blends containing graphene oxide nanoparticles
- Effect of various varieties and dosage of potassium fertilizer on growth, yield, and quality of red chili (Capsicum annuum L.)
- Review Articles
- Germination ecology of three Asteraceae annuals Arctotis hirsuta, Oncosiphon suffruticosum, and Cotula duckittiae in the winter-rainfall region of South Africa: A review
- Animal waste antibiotic residues and resistance genes: A review
- A brief and comprehensive history of the development and use of feed analysis: A review
- The evolving state of food security in Nigeria amidst the COVID-19 pandemic – A review
- Short Communication
- Response of cannabidiol hemp (Cannabis sativa L.) varieties grown in the southeastern United States to nitrogen fertilization
- Special Issue on the International Conference on Multidisciplinary Research – Agrarian Sciences
- Special issue on the International Conference on Multidisciplinary Research – Agrarian Sciences: Message from the editor
- Maritime pine land use environmental impact evolution in the context of life cycle assessment
- Influence of different parameters on the characteristics of hazelnut (var. Grada de Viseu) grown in Portugal
- Organic food consumption and eating habit in Morocco, Algeria, and Tunisia during the COVID-19 pandemic lockdown
- Customer knowledge and behavior on the use of food refrigerated display cabinets: A Portuguese case
- Perceptions and knowledge regarding quality and safety of plastic materials used for food packaging
- Understanding the role of media and food labels to disseminate food related information in Lebanon
- Liquefaction and chemical composition of walnut shells
- Validation of an analytical methodology to determine humic substances using low-volume toxic reagents
- Special Issue on the International Conference on Agribusiness and Rural Development – IConARD 2020
- Behavioral response of breeder toward development program of Ongole crossbred cattle in Yogyakarta Special Region, Indonesia
- Special Issue on the 2nd ICSARD 2020
- Perceived attributes driving the adoption of system of rice intensification: The Indonesian farmers’ view
- Value-added analysis of Lactobacillus acidophilus cell encapsulation using Eucheuma cottonii by freeze-drying and spray-drying
- Investigating the elicited emotion of single-origin chocolate towards sustainable chocolate production in Indonesia
- Temperature and duration of vernalization effect on the vegetative growth of garlic (Allium sativum L.) clones in Indonesia
- Special Issue on Agriculture, Climate Change, Information Technology, Food and Animal (ACIFAS 2020)
- Prediction model for agro-tourism development using adaptive neuro-fuzzy inference system method
- Special Issue of International Web Conference on Food Choice and Eating Motivation
- Can ingredients and information interventions affect the hedonic level and (emo-sensory) perceptions of the milk chocolate and cocoa drink’s consumers?