Influence of irrigation regime on gas exchange, growth, and oil quality of field grown, Texas (USA) olive trees
-
Staci Parks


Abstract
Olive (Olea europaea L.) oil production is an emerging industry in Texas (USA). However, limited research has been conducted to determine best irrigation practices for Texas growers. In this study, established “Arbequina” olive trees from three south Texas orchard locations were used to investigate effects of irrigation volume on olive tree gas exchange, growth, and oil quality. Twelve-year-old trees were exposed to three irrigation regimes. Over the course of two growing seasons, leaf gas exchange, shoot growth, and oil quality were measured. Data from a single orchard and growing season are presented. Differences in monthly and overall leaf gas exchange data were not found. Based on soil surface area under each tree’s dripline, depth of total water applied to each tree (irrigation plus precipitation) ranged from 1,451 (three-emitter irrigation treatment) to 759 mm (one-emitter irrigation treatment). Trees exposed to the three-emitter irrigation treatment produced the greatest shoot growth. Fruit mass and fruit volume were greatest for trees which had the fewest emitters (lowest irrigation volumes). Oil pressed from each experimental tree rendered extra virgin olive oil. Oil chemical analysis indicates total phenols tended to be greatest from trees receiving the least volume of irrigation. For Texas olive growers, research suggests there are opportunities to reduce irrigation, yet maintain olive oil quality.
1 Introduction
Because of particularly high levels of monosaturated fatty acids and antioxidants, extra virgin olive oil (EVOO; a significant component of the Mediterranean diet) promotes numerous health benefits. In fact, epidemiological data suggest significant health advantages (low heart disease and fewer incidences of cancer) for those consuming olive oil [1,2]. For the past number of years, increased popularity of the Mediterranean diet and the diet’s associated health benefits have increased worldwide olive oil production and use [2,3,4,5].
Olive trees are adapted to drought and maintain an ability to produce fruit in extreme climates [6]. These adaptations involve many morphological, physiological, and anatomical leaf level characteristics [7,8,9,10,11], and may be improved with orchard management practices [12,13]. In Mediterranean countries, olives have traditionally been grown in orchards without supplemental irrigation [7,14,15]. However, use of supplemental irrigation has been shown to increase olive tree yield and potentially reduce alternating biannual yield patterns [16]. Therefore, use of supplemental irrigation has become common in both modern (high density) and traditional orchards [17]. Because of dwindling worldwide water resources, deficit irrigation (DI) strategies have become common practice in olive orchards [11,15,17].
Olive oil quality is dependent upon a number of factors, including cultivar, irrigation volume, phenological stage when irrigation is applied, fruit maturity (harvest timing), oil extraction method, oil processing technique, and oil storage time, or circumstances [1,11,15]. Oils produced from the fruit of the Spanish cultivar “Arbequina” are aromatic, have low bitterness and pungency, and display apple, almond, and artichoke undertones [3,15]. In addition, “Arbequina” oil is typified by low oleic and phenol contents and oxidative stability [15,18]. EVOO produced from “Arbequina” has high acceptance in worldwide oil markets and with consumers [3,15]. Furthermore, because of low vegetative vigor, early production, and consistent yield [15], “Arbequina” olive trees are ideal for intensely managed olive oil production orchards [19].
For proper fruit and oil development, it is thought to be critical for olive growers to alleviate water stress during crucial stages of fruit development and schedule irrigation levels accordingly [20]. However, recent research reveals sustained DI (supplying a fixed water deficit throughout the irrigation season) works well with high-density olive orchards [19]. Irrigating olive trees at a crop evapotranspiration (ETC) of approximately 70% of reference evapotranspiration (ETO) (mm) has been recommended [19,21,22]. However, Grattan et al. [23] and Berenguer et al. [16] reveal maximum olive fruit yield occurred when trees were irrigated between 70 and 75% ETC, whereas maximum oil quality occurred when trees were irrigated between 33 and 40% ETC.
If timed properly, DI strategies can ultimately save water and optimize olive production and oil quality [23,24]. In many olive growing regions, DI applied to a number of olive cultivars has successfully reduced irrigation volume while maintaining fruit quality, yet only a small influence on olive oil yield has been found [4,14,19,20,25,26,27]. However, results have been variable. Wahbi et al. [14] exposed adult, traditional field grown (6 m × 6 m spacing) O. europaea “Picholine Marocaine” trees to several surface drip irrigated, DI treatments. Partial root-zone drying (PRD) treatments resulted in less vegetative growth, and oil yield was reduced only 15–20% compared with control trees. However, PRD trees realized a 50% reduction in irrigation water and up to a 70% increase in water use efficiency (ratio of oil yield to volume of water applied). In addition, for 4 years in a super high-density (1.8 m × 3.9 m spacing) California orchard, “Arbequina” trees were subjected to three surface drip irrigated, DI treatments [19]. Irrigation treatments included 58 (control), 44 and 30% ETC (70% ETO). Tree growth (shoot growth, trunk diameter increase, and pruning weights) was lower in non-control trees. Fruit yield was lower and oil yield was greater for trees irrigated at 30% ETC compared with trees irrigated at 44% ETC. Furthermore, because non-control trees were smaller when compared with control trees, water-stressed trees were more compact in size which expedited mechanical fruit harvesting [19]. In Spain, García et al. [15] irrigated “Arbequina” trees with similar irrigation until late summer, followed by four DI treatments (six, four, two, or one irrigation emitters for each tree) during the oil synthesis stage up to harvest (late August through late October). Results indicate maximum oil production was obtained under moderate water stress (four emitters for each tree), but total phenolics were reduced 24% compared with control treatment (six emitters for each tree) trees [15].
Within the state of Texas, high-density olive (Olea europaea L.) trees planted for oil production likely began in the mid to late 1990s [28]. Today, there are over 150 olive growers within Texas. These growers manage approximately 1,400 ha and over 2 million trees [29]. Olive oil producers indicate “Arbequina,” “Koroneiki,” and “Picual” are the top three olive cultivars planted within Texas. In addition, the state was recently separated into five olive growing regions (Figure 1) [29]. Within Texas, limited information is available for growers regarding production practices [30,31,32,33,34]. Consequently, Texas growers require research evaluating the response of olive tree irrigation volume on tree physiology, growth, oil yield, and oil sensory and chemical characteristics. Therefore, goals of this research were to determine effects of three irrigation regimes on olive tree leaf gas exchange, shoot growth, fruit characteristics, and oil chemical and sensory features within three established olive orchards located in central and south Texas.
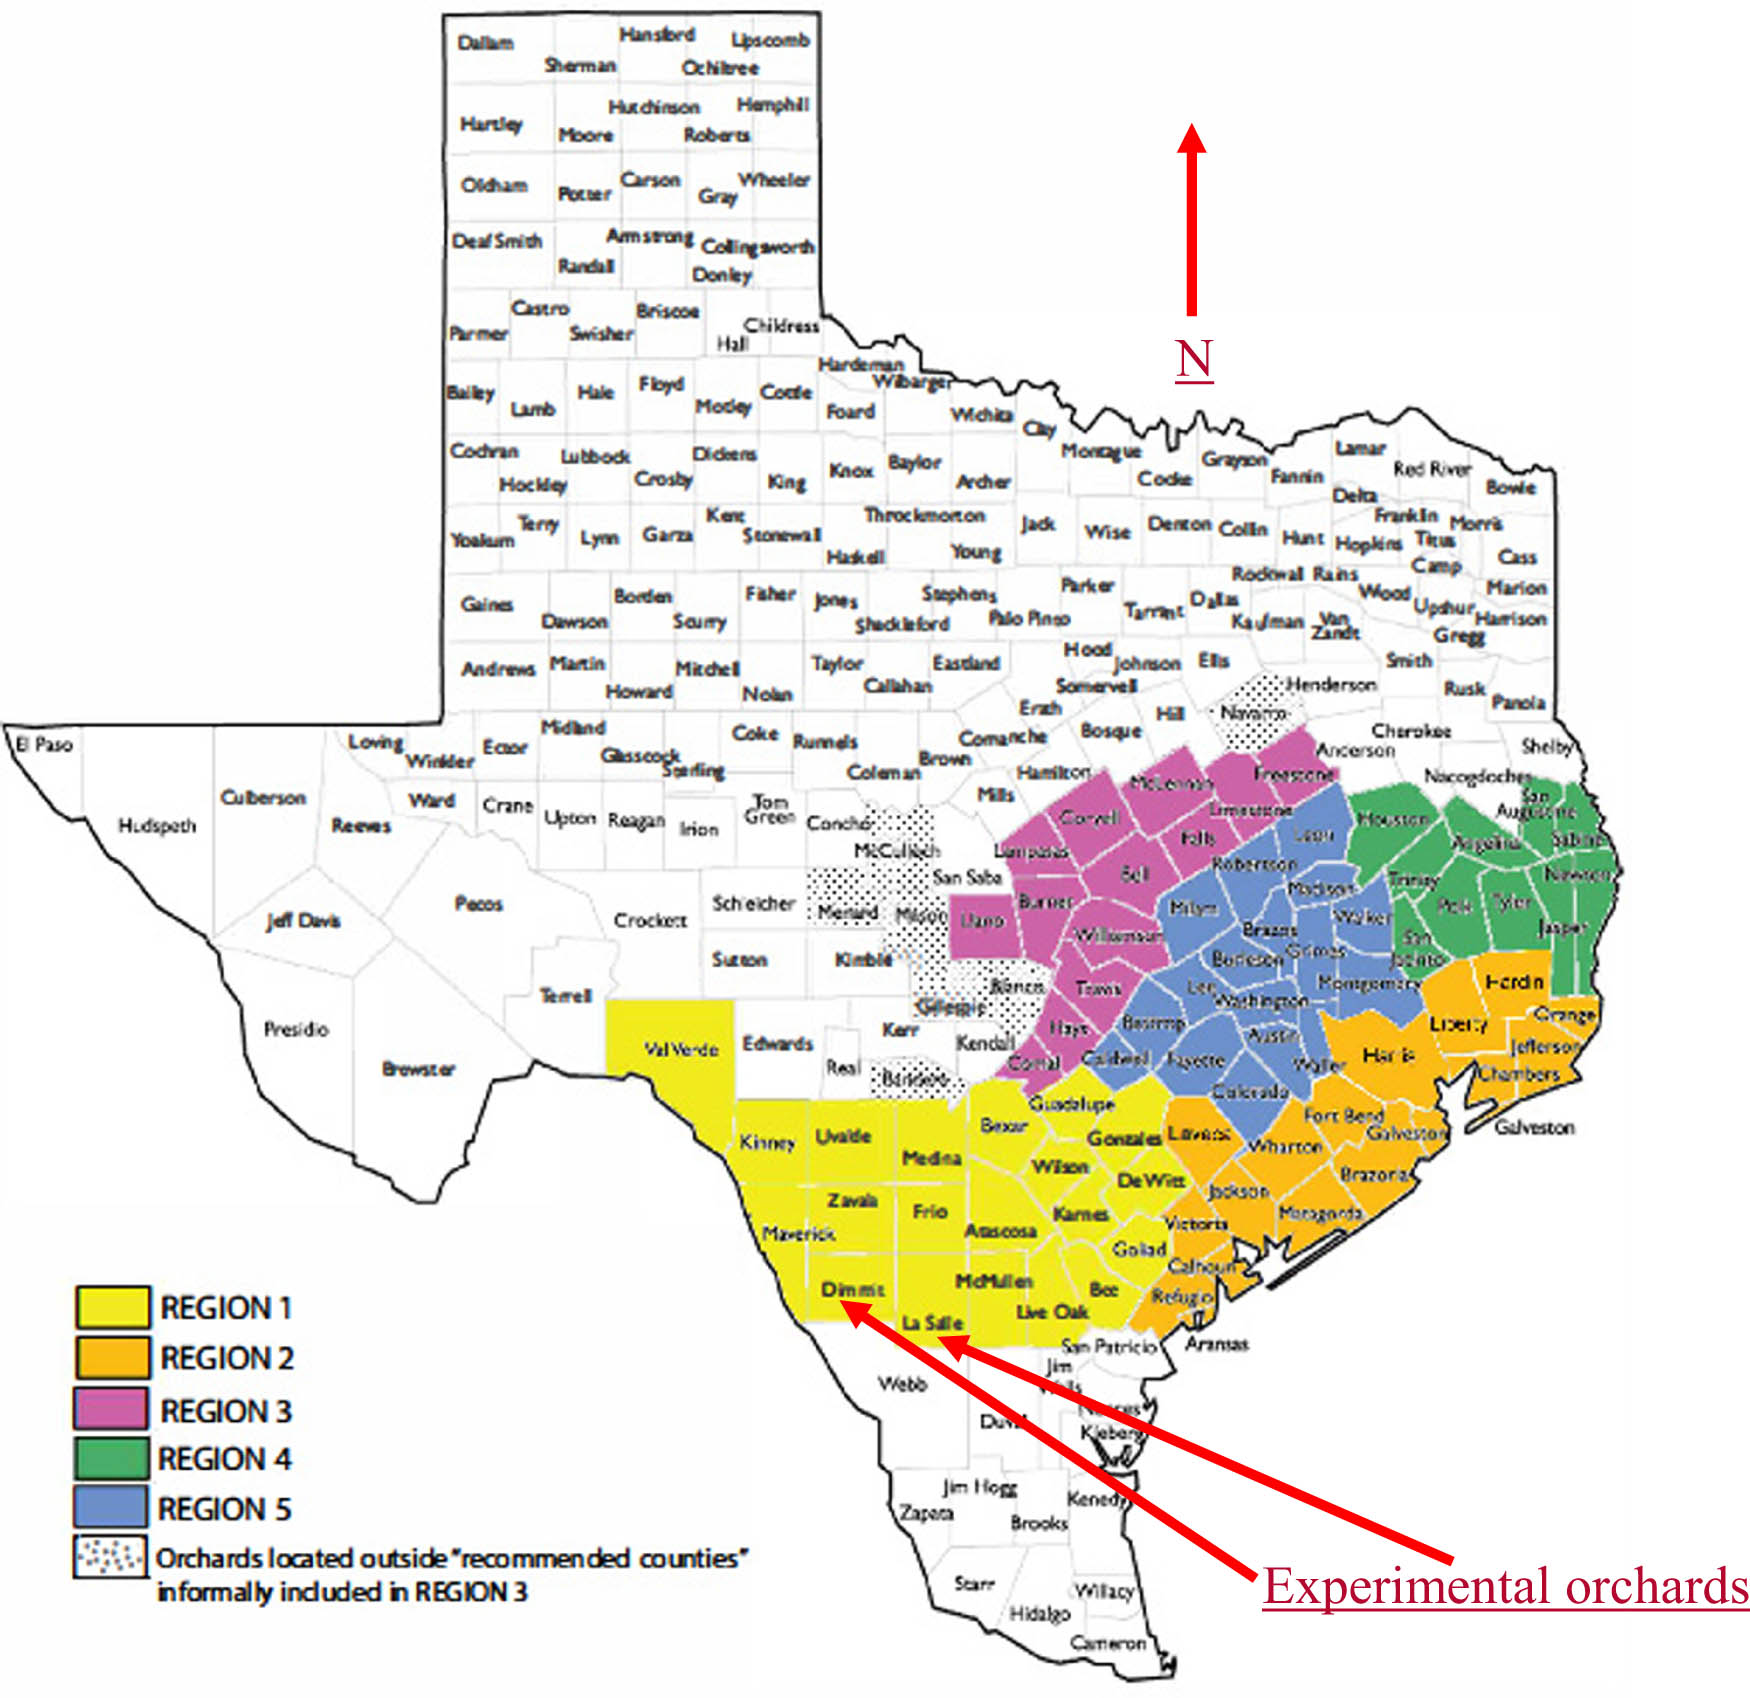
Texas Olive Growing Regions (Texas Association of Olive Oil 2021). Experimental orchards were located in Texas Olive Growing Region 1. Experimental orchards 1 and 2 were located in Dimmitt County, and experimental orchard 3 was located in La Salle County, TX.
2 Materials and methods
2.1 Experiment locations and design
Experiments were conducted over two consecutive growing seasons (2012 and 2013), in three different established “Arbequina” olive orchards. Orchard 1 was located near Carrizo Springs, TX (28.62°N:99.27°W). The second orchard (Orchard 2) was established near Asherton, TX (28.26°N:99.77°W), and the third orchard (Orchard 3) was adjacent to Artesia Wells, TX (28.18°N:99.17°W). Orchard 1 trees were planted in 2005 with a row × tree spacing of 3.0 m × 2.3 m (planting density of 235 trees ha−1). Orchard 1 soil is classified as a Pryor sandy clay loam [35]. Orchard 2 trees were planted in 2007 at a row × tree spacing of 2.7 m × 2.1 m (planting density of 278 trees ha−1). Soil for Orchard 2 is categorized as a Dilley fine sandy loam [35]. Orchard 3 was also established in 2005 at a planting density of 160 trees ha−1 (row × tree spacing of 3.4 m × 3.0 m). Orchard 3 soil is classified as a Webb very fine sandy loam [35].
The experimental design for each orchard was a randomized complete block design. Each orchard contained three blocks with 21 experimental trees located within each block. Within each block (tree row), irrigation treatments were randomized, and seven consecutive trees received the same irrigation treatment (within each orchard, 21 total trees received the same irrigation regime). Within the same block, two trees between differing irrigation levels were used to create a buffer zone [16]. Surface drip irrigation emitters were installed at each location. Emitter flow was 3.8 L h−1. Irrigation treatments were implemented by varying the number of emitters placed near each tree [15]. Control trees (T3) had three emitters near each tree (one emitter near the trunk and one emitter placed 90 cm from the trunk on either side of the tree), T2 trees had two emitters for each tree (one emitter placed 90 cm from the tree on either side of the trunk), and T1 trees had one emitter for each tree (single emitter near the tree trunk).
For each orchard, irrigation management (timing and volume) and overall orchard management (pest control, pruning, fertilization, harvesting, etc.) were monitored by the orchard supervisor. Therefore, although each year orchard trees were exposed to three irrigation treatments, because orchard managers varied their management practices, irrigation volume applied at each orchard location differed. Each orchard location used groundwater for irrigation. Orchard location groundwater pH ranged from 8.0 to 8.2, and electrical conductivity ranged from 0.63 to 1.21 dS m−1.
-
Ethical approval: The conducted research is not related to either human or animal use.
2.2 Data collection
Because orchard managers did not relate irrigation volume to ETO or ETC data, to correlate volume of water applied to experimental trees with previous research, and to assist olive growers apply research findings to future orchard irrigation requirements, it was necessary to estimate depth of water (mm) applied to trees used in this study. Fox and Montague [36] and Montague and Bates [37] indicate tree irrigation requirements may be estimated using soil surface area (mm) under the dripline of the tree. Using a similar approach, the following formula was used to calculate depth of water (irrigation plus precipitation) received by each experimental tree:
where I is the irrigation depth (mm), V is the volume of water (irrigation plus precipitation) received by each tree (mm3), and A is the estimated soil surface area under the tree’s dripline (mm2) [36,37]. Fraction of ETO (W) received by each tree was calculated as:
A weather station was installed at each orchard location (Weatherhawk Model 916; Campbell Scientific, Logan, UT, USA), and local incoming solar radiation, wind speed, relative humidity, air temperature, and precipitation data were collected. Onsite ETO (ASCE Penman-Monteith Standardized Form) was calculated using ETO calculation software included within the Weatherhawk software. Vapor pressure deficit (VPD) for each location was calculated as the difference between the amount of water vapor in the air compared with what the air could hold at saturation vapor pressure [37,38].
To determine the influence of irrigation regime on olive tree leaf gas exchange, monthly mid-day measurements were estimated with a portable infrared gas analyzer system (LI-6400 XT; LI-COR, Lincoln, NE, USA). Each year, leaf gas exchange data collection in each orchard began in May and concluded in mid-August. Monthly leaf gas exchange data were measured on the middle three trees of each irrigation regime within each block (nine trees for each treatment measured at each location monthly). For each tree and measurement date, ten randomly selected, full sun leaves from current year’s growth were selected for measurement. Leaf stomatal conductance (G S), photosynthetic rate (A N), and leaf to air vapor pressure deficit (LVPD) were measured. Influence of irrigation regime on vegetative tree growth was determined by measuring shoot elongation from ten random shoots of each experimental tree. Shoots were tagged at the beginning of each growing season, and late in the growing season, measurements were made from the previous year’s bud scale scar to the shoot tip.
Each year (end of August), 50 drupes were harvested randomly from each tree, individually weighed (m), and measured (length [l] and width [w]). Volume (v) for each drupe was calculated as [39]:
Drupe density (d) was estimated as:
In addition, fruits from each irrigation regime were kept separately and then pressed with a bench top press system (The Olive Oil Source, Santa Maria, CA, USA) using traditional fruit press methodology (see Appendix). Steps in oil preparation included hand harvesting, washing, crushing, malaxation of paste, hydraulic pressing, and centrifuging and decantation of oil [3]. Oil samples from each irrigation regime were analyzed for chemical and sensory qualities (Agbiolab, Inc., Durham, CA, USA).
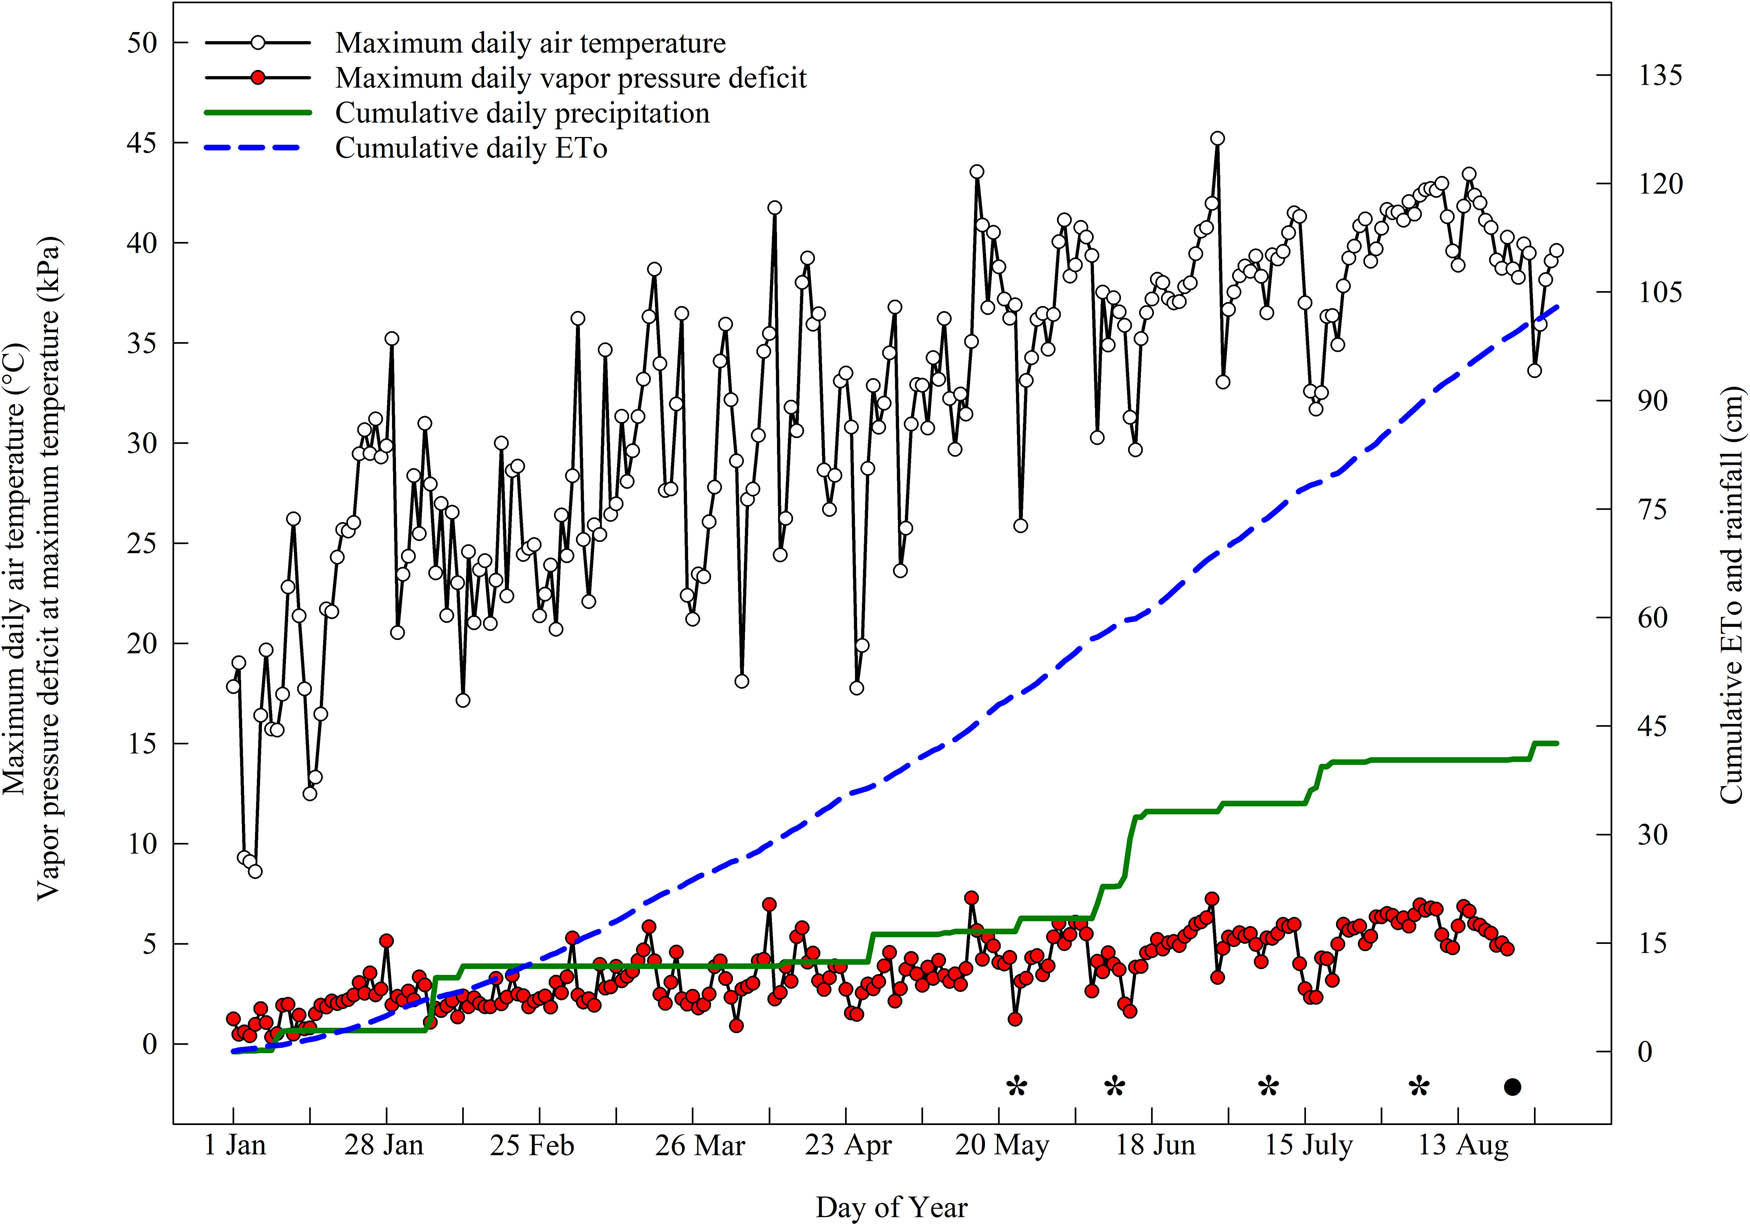
Maximum daily air temperature, VPD at maximum daily air temperature, cumulative reference evapotranspiration (ETO), and cumulative rainfall data (1 January–31 August) for olive (Olea europaea L. cv. “Arbequina”) Orchard 3 (located near Artesia Wells, TX) during the second growing season. Asterisks indicate dates leaf gas exchange data were collected. Circular symbol indicates fruit harvest date.
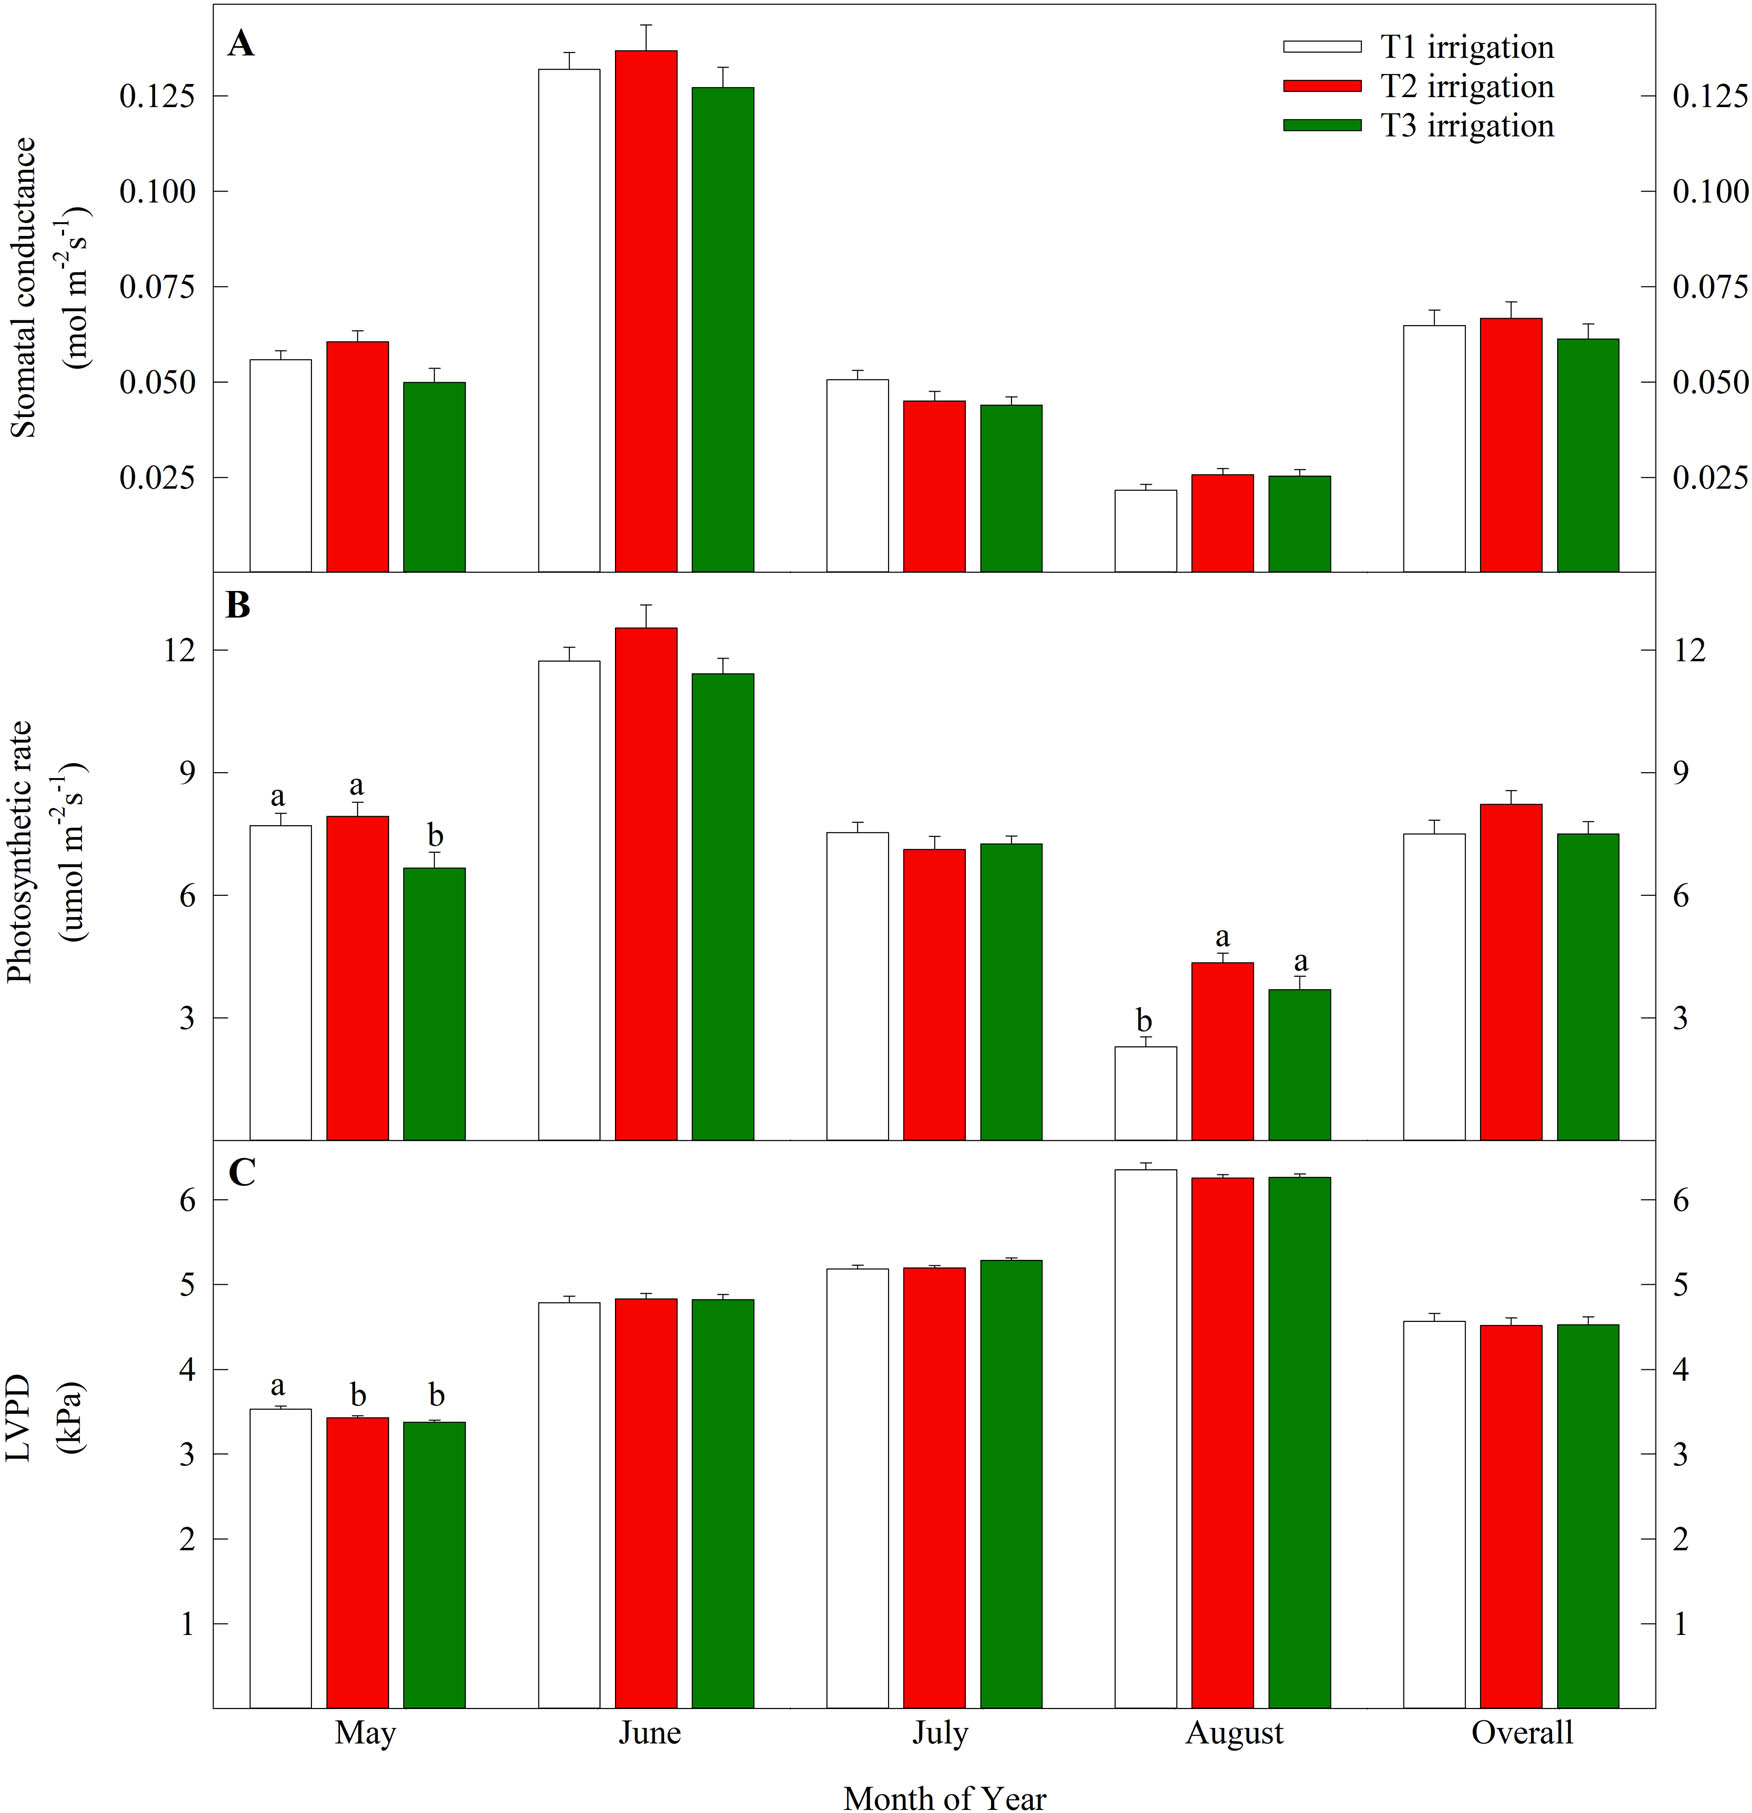
Effect of three irrigation regimes on leaf stomatal conductance (a), photosynthetic rate (b), and LVPD (c) for olive trees (Olea europaea L. cv. “Arbequina”) growing in Orchard 3 (located near Artesia Wells, TX). Letters above each bar represent differences between T1 (single irrigation emitter), T2 (two irrigation emitters), and T3 (control, three irrigation emitters) irrigation treatments (Tukey–Kramer test, P ≤ 0.05). Error bars represent SE for each irrigation regime.
2.3 Statistical analysis
Monthly leaf gas exchange parameters (G S, A N, and LVPD), and yearly pooled monthly leaf gas exchange data, shoot growth, and fruit measurements were analyzed using one-way analysis of variance with a General Linear Models procedure appropriate for a randomized complete block design (SAS version 9.4, SAS Institute, Cary, NC, USA). If mean differences were detected, least square means were separated by Tukey–Kramer’s multiple comparison procedure (α ≤ 0.05). Daily maximum temperature, VPD at maximum daily temperature, rainfall, and ETO were plotted against day of the year (1 January through 31 August). Because statistical trends between years and across orchards were similar (statistical analysis of irrigation regime effects did not differ between years or orchards), data from a single orchard (Orchard 3) and growing season (season 2) are presented. In addition, because of limited sample size, statistical analysis could not be performed on olive oil chemical and sensory qualities. However, mean data trends are presented.
3 Results and discussion
3.1 Weather and irrigation
During summer months of growing season 2, Orchard 3 climate was hot and arid. Data indicate that greatest air temperature was 41.8°C (29 June), and greatest VPD at maximum daily temperature was 7.3 kPa (16 May) (Figure 2). In addition, during the production year (1 January through 31 August), there was roughly 40% less rainfall (42.6 cm) than ETO (102.9 cm) (Figure 2). Because the location of Orchard 3 is somewhat isolated and rural, historic weather data were unavailable. However, historic weather data were gathered from Cotulla, TX (located approximately 14 km north of Orchard 3) [40]. During the Orchard 3 production year, rainfall (42.6 cm) was slightly greater than mean precipitation for that time period (41.8 cm) (Figure 2). In addition, over the course of the growing season, historical mean monthly high air temperature and Orchard 3 mean monthly high air temperature data were comparable (data not shown). Similar to daily maximum air temperature, VPD at maximum daily temperature trended upwards as the growing season progressed (Figure 2). Monthly, mean VPD at maximum daily air temperature for Orchard 3 during January, April, and August was 1.8, 3.3, and 5.9 kPa, respectively. Olive trees are native and adapted to semi-arid climates [3,7,19]. Over previous years, a number of authors have presented data regarding response of olive trees to DI [19,26,27,41] or estimated olive tree water use [42,43]. The vast majority of these experiments were conducted in locations with arid growing conditions (low precipitation, high maximum daily air temperature, maximum daily VPD, and daily total ETO). Climatic conditions were similar to each of the experimental olive orchards used in this study. If fact, compared with much of the literature regarding olive tree DI and water use, growing conditions in experimental orchards would be considered more arid.
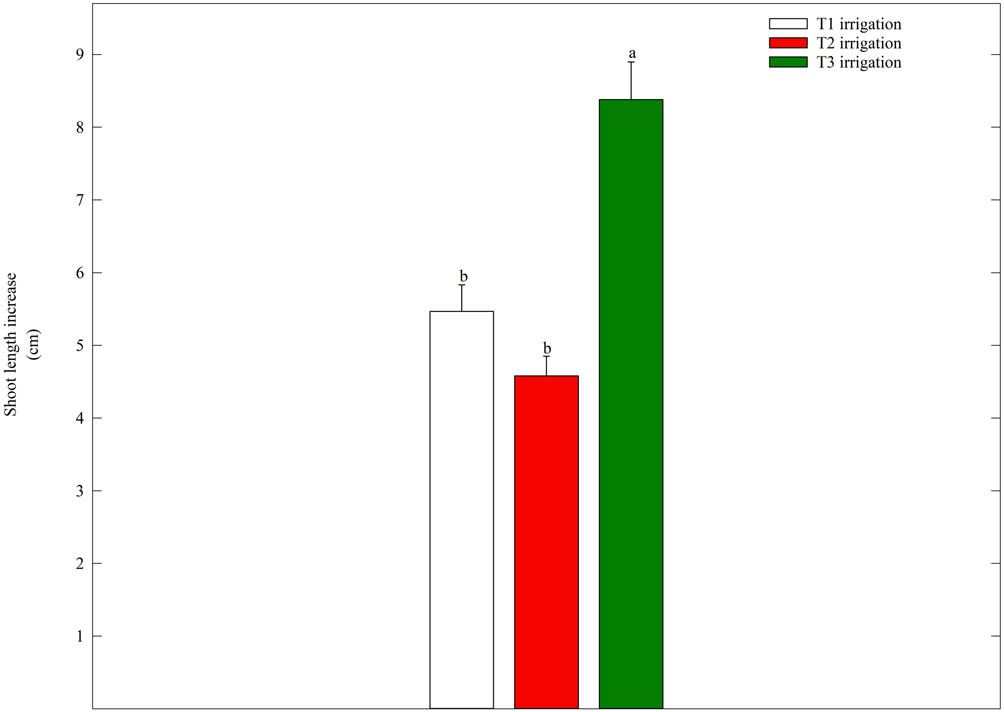
Effect of three irrigation regimes on shoot length increase for olive trees (Olea europaea L. cv. “Arbequina”) growing in Orchard 3 (located near Artesia Wells, TX). Letters above each bar represent differences between T1 (single irrigation emitter), T2 (two irrigation emitters), and T3 (control, three irrigation emitters) irrigation treatments (Tukey–Kramer test, P ≤ 0.05). Error bars represent SE for each irrigation regime.
Seasonal total irrigation depth (irrigation plus precipitation) for T3, T2, and T1 irrigation regimes were 1,451, 1,109, and 759 mm tree−1, respectively (Table 1). In addition, mean W ranged from 0.74 (T1) to 1.41 (T3). Irrigation depth (mm) is provided in several olive DI studies [4,19,22,23,44,45,46,47]. However, because size and age of orchard trees are quite variable, individual olive tree irrigation volume data are less frequently presented [16,26]. Based on the following equation, over a 4-year period, Rosecrance et al. [19] irrigated mature “Arbequina” trees at four rates (ranging from 58 to 30% ETC):
Effect of irrigation regime (T1 – one emitter tree−1, T2 – two emitters tree−1, T3 – three emitters tree−1) and precipitation on olive (Olea europaea L. cv. “Arbequina”) tree irrigation
| Applied irrigation | Season total irrigation∗ | ETO fraction (W)† | ||
|---|---|---|---|---|
| Volume (L) | Depth (mm) | (mm) | (%) | |
| Irrigation level | ||||
| T3 | 6,750 | 1,025 | 1,451 | 1.41 |
| T2 | 4,500 | 683 | 1,109 | 1.08 |
| T1 | 2,109 | 333 | 759 | 0.74 |
Mean area under each tree equals 6,585,170 mm2.
Growing season ETO total equals 1,029 mm.
Season total precipitation equals 426 mm.
∗Season total irrigation equals AI plus precipitation.
†W – season total irrigation (mm) per growing season ETO total (mm).
where the crop coefficient (K C) = 0.68 [21], and the reduction coefficient (K R) = 1.0 (trees were mature and had greater than 53% canopy cover) [23]. Over the 4-year period, annual ETO ranged from 1,178 to 1,251 mm, and annual precipitation varied from 468 to 610 mm (a more mesic location than the current study). Based on greatest irrigation depth (58% ETC), applied irrigation (AI) to each tree ranged from 417 to 450 mm. In a similar study in Spain, over a 3-year period, Iniesta et al. [4] calculated AI for mature “Arbequina” olive trees. The control treatment matched estimated tree ET (evapotranspiration) using a calculated K C factor [48] and AI to make up the difference between ET and precipitation. Other treatments consisted of continuous DI (CDI) that applied 25% of AI throughout the growing season and regulated DI (RDI) that applied a similar irrigation volume as CDI, but with a mid-summer period without irrigation. Yearly precipitation varied from 432 to 584 mm. AI for control trees ranged from 359 to 589 mm, whereas RDI trees received 88–120 mm of irrigation. These reports and others [21,27,46,49] indicate a number of methods using ETO, ETC, and various K C values (based on soil texture, precipitation, fruit maturity, and climate) have successfully been used to estimate olive tree irrigation depth and volume requirements.
As is common in Texas, irrigation in the current study was based on grower experience and not ETO, K C, or calculated ETC values. However, by calculating depth of irrigation water applied (mm), seasonal total irrigation (mm), W (ratio of I to ETO) values from irrigation volume applied (L), mean area under the tree’s dripline, and growing season ETO values (Table 1), our results seem to follow irrigation trends from each of these previous studies. Based on previous research, it seems T3 and T2 trees in the current study were over irrigated (Table 1) and not subjected to DI [19,22,47,49]. ETO fraction (W) received by T3 and T2 trees was 1.41 and 1.08, respectively, whereas W for T1 irrigation trees was 0.74 (Table 1). As previously mentioned, ETC for “Arbequina” and several olive cultivars is believed to be approximately 0.70 [19,21,22,47,49]. Therefore, W for “Arbequina” trees in the current study is similar to ETC for olive cultivars grown in arid locations. Compared with the T3 and T2 irrigation levels, T1 irrigation treatment for “Arbequina” trees in the current study saved 691 and 350 mm of irrigation, respectively, over the course of the growing season. Therefore, if an orchard configuration was set at 160 trees ha−1, compared to T3 and T2 irrigated trees, T1 total growing season water savings for each ha of orchard would be 742,560 and 382,560 L, respectively (Table 1). Our results and methodology indicate using area under a mature olive tree’s dripline, ETO values, a K R of 1.0, and an K C value of 0.70 could potentially reduce “Arbequina” olive tree irrigation volume and conserve a significant volume of water.
3.2 Leaf gas exchange
Orchard 3 monthly pooled leaf G S data indicate no differences (Figure 3). However, mean leaf G S data trends increased from May to June, but decreased from June through August (Figure 3). Similar trends were found for leaf A N, yet monthly leaf A N differences between irrigation regimes were found in May (T3 and T2 irrigation regimes had greater leaf A N) and August (T2 and T3 irrigation regimes leaf A N was greater) (Figure 3). However, overall pooled monthly A N differences were not found (Figure 3). There were LVPD differences in May (Figure 3), whereas no differences in LVPD were found from June through August, and pooled monthly means exhibited no LVPD differences. Unlike GS and AN, monthly LVPD means trended upward from May through August (Figure 3).
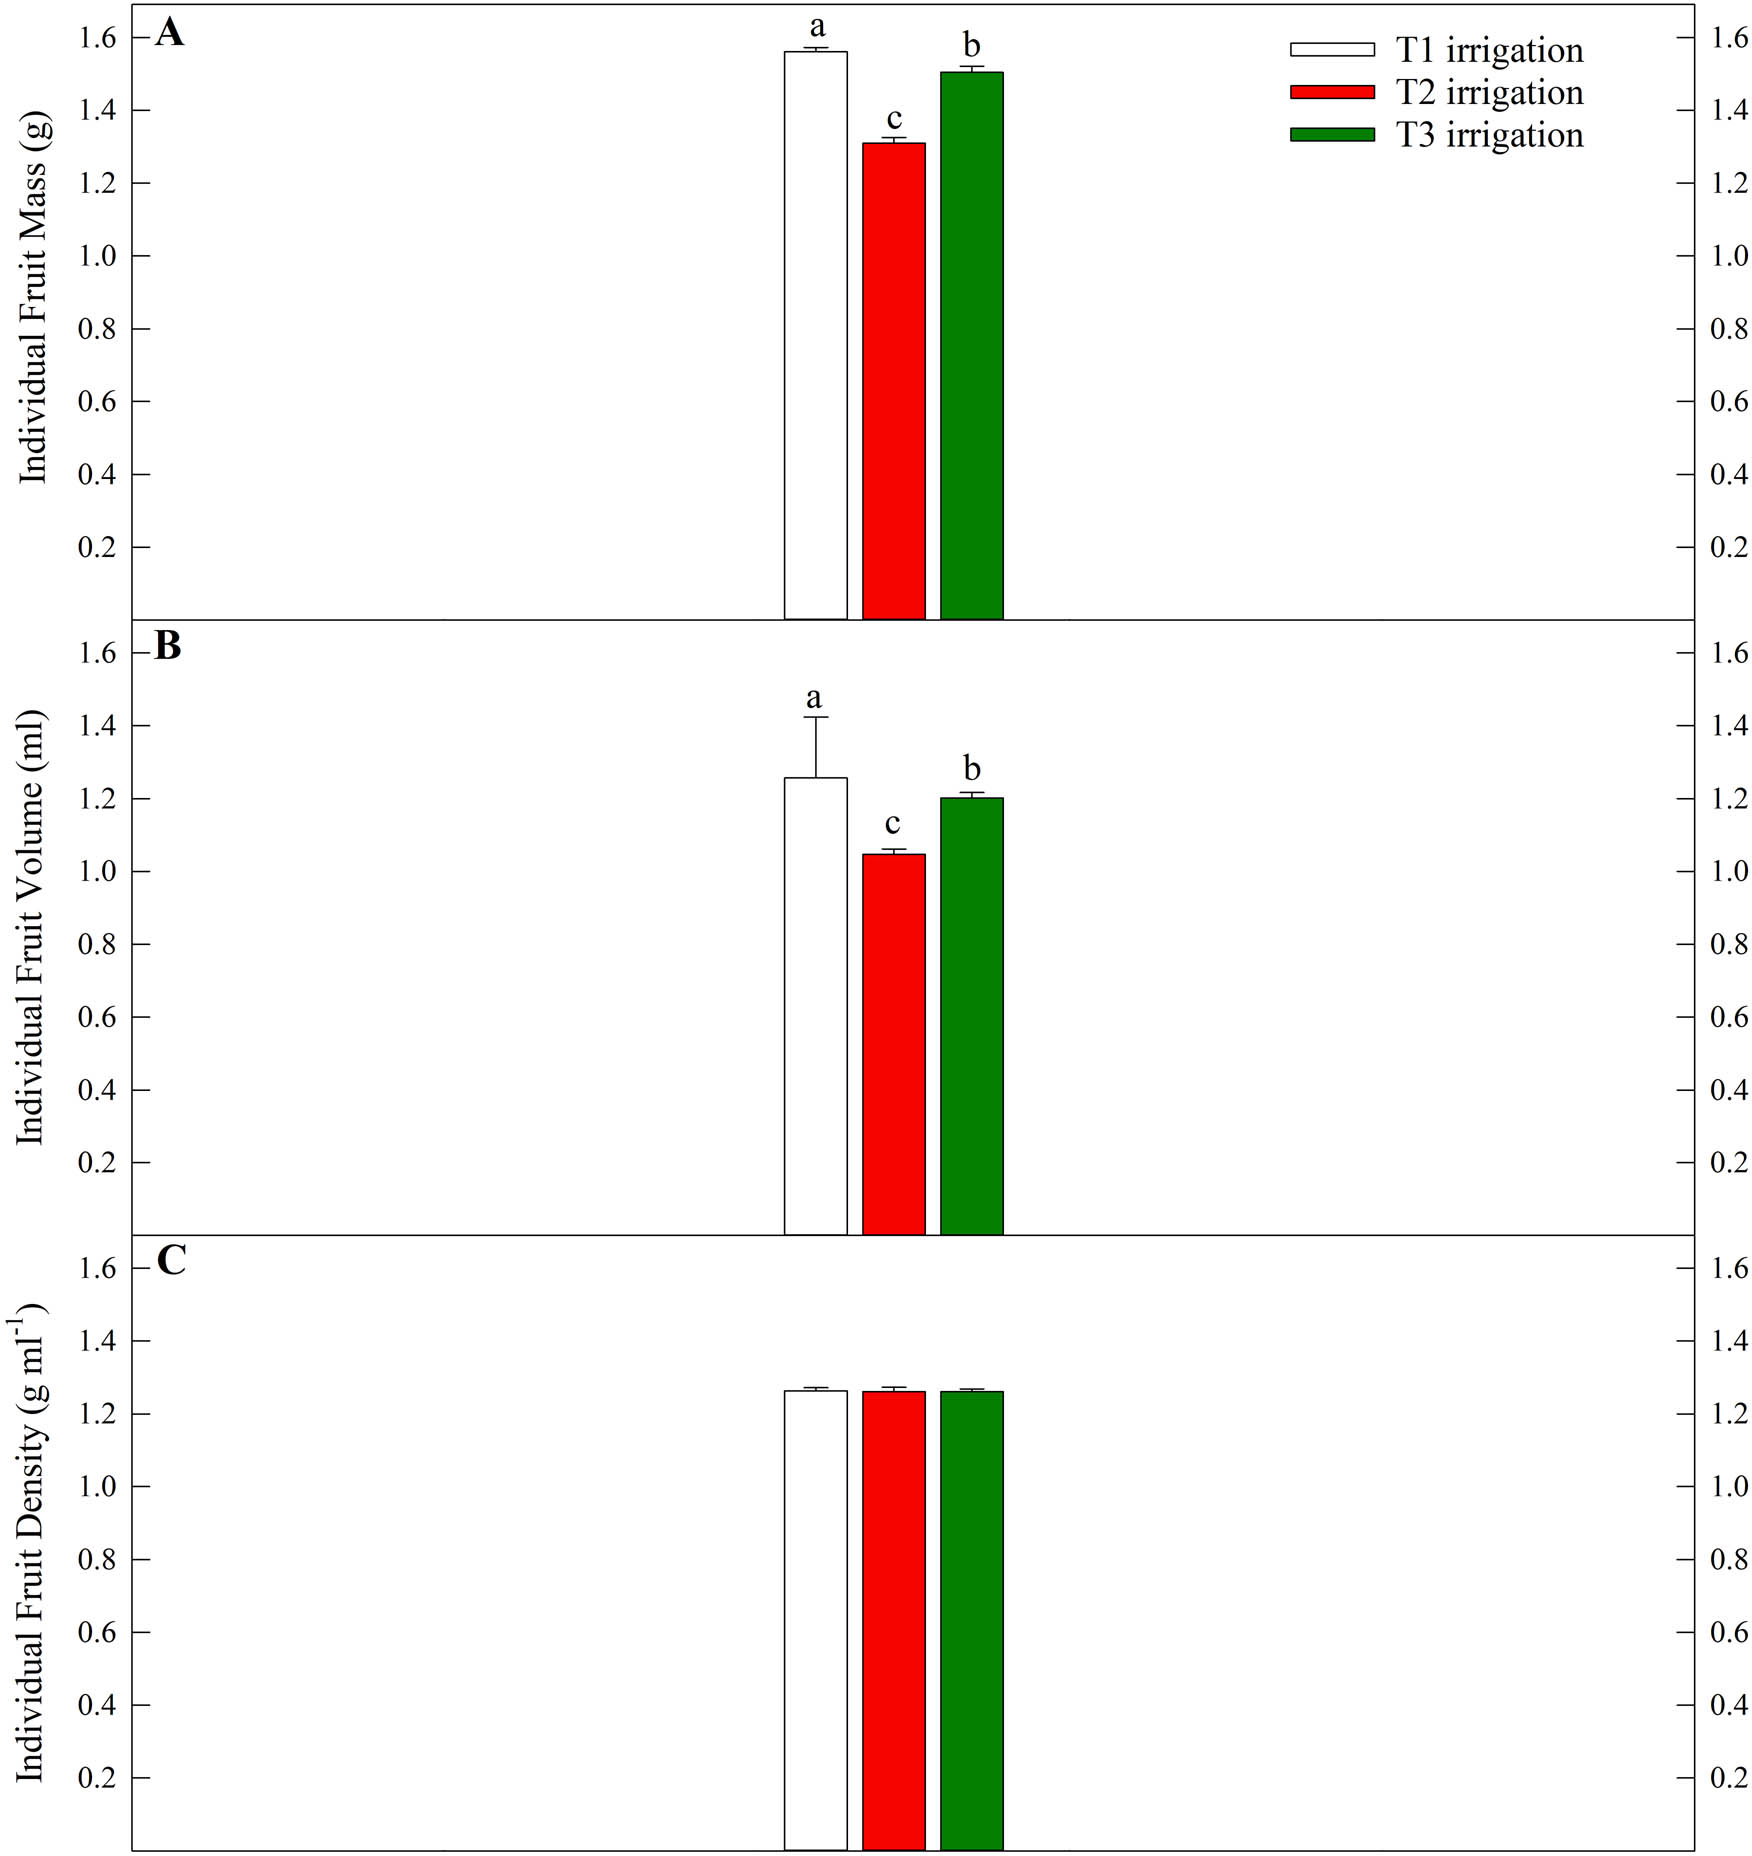
Effect of three irrigation regimes on individual fruit mass (a), individual fruit volume (b), and individual fruit density (c) for olive trees (Olea europaea L. cv. “Arbequina”) growing in Orchard 3 (located near Artesia Wells, TX). Letters above each bar represent differences between T1 (single irrigation emitter), T2 (two irrigation emitters), and T3 (control, three irrigation emitters) irrigation treatments (Tukey–Kramer test, P ≤ 0.05). Error bars represent SE for each irrigation regime.
Moriana et al. [49] estimated daily ETC and exposed 18-year-old, field grown, surface drip irrigated O. europaea “Picual” trees to four different irrigation treatments: no water deficits (I1), 75% DI within a period during the summer without irrigation (I2), irrigation the same as I2, but with summer irrigation (I3), and no irrigation (I4). Over the course of the growing season, leaf gas exchange was measured on numerous occasions. Diurnal and mid-day leaf gas exchange and stem water potential data indicate I1 trees were under less water stress, had greater soil moisture, and greater leaf G S and A N compared with I2, I3, and I4 trees. In addition, for less stressed trees, Moriana et al. [49] reports leaf G S was closely associated with VPD. In contrast, a similar study investigated response of mature, field grown O. europaea “Frantoio” and “Leccino” trees to DI [6]. Trees were not irrigated or drip irrigated and subjected to DI of 100 or 66% ETO. Leaf G S and A N were less for non-irrigated trees and differed between cultivars. However, leaf gas exchange differences were not found between DI trees of the same cultivar. Comparable to our data, other reports [7,8,20,46] indicate leaf gas exchange of olive trees subjected to irrigation treatments (irrigation rates ranging from no irrigation to greater than 100% ETO) can differ, or be similar between irrigation treatments.
In the current and previous experiments, it is likely leaf gas exchange differences among irrigation treatments were dependent upon a combination of factors such as weather (air temperature, VPD, precipitation, etc.), soil type, irrigation frequency, length of water stress treatment, tree genotype, tree age, phenological stage, or morphological characteristics [6,7,8,20,50]. Orchard 3 seasonal G S and A N patterns were similar (Figure 3) and indicate a close coupling of these gas exchange constituents [49]. Similar results are reported with field grown “Frantoio” and “Leccino” olive cultivars exposed to DI [6]. Previous reports [7,41,43,49] suggest olive leaf gas exchange is closely associated with VPD and LVPD. Data from Orchard 3 indicate a similar trend. It is clear VPD and LVPD increased throughout the growing season (Figures 2 and 3). Our data suggest greatest olive leaf G S and A N occurred when LVPD was approximately 4.5 kPa (June) and thereafter decreased as LVPD increased in later months (Figure 3).
Similar to Tognetti et al. [6], despite implementing three irrigation regimes, leaf gas exchange data (G S, A N, and LVPD) of olive trees in the current study were generally similar throughout the growing season, and mean, monthly pooled data did not differ (Figure 3). Soil moisture and tree water status (leaf or stem water potential) are key indicators of water stress in olives [49]. However, because these data were not collected throughout each growing season, the extent of water stress applied to experimental trees is difficult to assess. In general, olive tree gas exchange parameters (G S and A N) tend to decrease as soil moisture decreases [8,20,49]. Orchard 3 received slightly greater than normal precipitation during the growing season (Figure 2). In addition, irrigation management of the orchard did not base irrigation volume on seasonal ETO or ETC, but on past experience and perceived orchard need (which is common for Texas olive producers). As stated previously, effects of olive tree irrigation volume on leaf gas exchange are dependent upon a number of factors [6,7,8,20,49]. Based on our data, it seems despite olive trees in Orchard 3 being exposed to three irrigation regimes, trees from each irrigation treatment were likely not exposed to sufficient soil moisture stress (sufficient DI) to induce leaf gas exchange differences between irrigation treatments.
3.3 Shoot growth
Irrigation regimes influenced mean shoot growth. Trees exposed to the T3 irrigation regime had greater shoot growth compared with trees treated with T1 and T2 irrigation regimes (Figure 4). When compared with mean shoot growth for the T1 and T2 irrigation regimes, mean shoot growth was approximately 40% greater for trees exposed to the T3 irrigation regime (Figure 4). These results are consistent with other observations from arid climates in which olive tree shoot growth, canopy volume, leaf area, or trunk cross-sectional area were greater for trees receiving greater irrigation volume [4,19,51]. Maintaining tree size is critical for high density olive production. Although fine-tuning DI will vary with cultivar, soils, and climate [51,52], reduction of vegetative growth by DI is an effective method to control canopy size. Shoot growth patterns for T1 trees indicate assimilate partitioning toward less vegetative dry matter accumulation for olive trees subjected to less irrigation and is the basis for DI strategies [22]. Therefore, Texas olive growers who instigate DI in their orchards will likely reduce pruning costs, increase interior canopy light interception, improve tree harvest efficiency and productivity, and enhance tree water use efficiency [4,14,26,45].
3.4 Fruit characteristics
Fruit mass, volume, and density results also reveal differences between irrigation regimes. Fruit harvested from trees receiving the T1 irrigation regime had the greatest mass and volume. However, there were no differences in fruit density between irrigation regimes (Figure 5). Our results differ from those of Grattan et al. [23], who indicate an increasing curvilinear response (less irrigation to greater irrigation) for individual “Arbequina” fruit mass from trees exposed to numerous DI irrigation treatments. However, Wahbi et al. [14] subjected mature O. europaea “Picholine Marcaine” trees to four PRD irrigation treatments. They report no differences in fruit diameter or fruit mass between irrigation treatments. Others [15,22,25,41] report inconsistent results relating individual fruit mass, volume, and density with olive cultivars and irrigation treatment.
Because of the source/sink balance for carbon allocation in olive and other fruit crops [51,53], greater crop load has been shown to decrease size and mass of olive drupes [51]. Nevertheless, because of limited access to research orchards, and time required to remove fruits from trees, crop load was not measured in this study. However, previous studies indicate crop load is sensitive to irrigation treatments, and olive tree yield increases with an increase in irrigation volume [22,25,41,51]. It is likely greater fruit mass and increased fruit volume for T1 trees in our study occurred because fruit load for T1 irrigation regime trees was lower when compared with trees receiving T3 and T2 irrigation levels. However, it is interesting to note individual fruit density across irrigation regimes was consistent (Figure 5).
3.5 Oil chemical and sensory characteristics
As previously mentioned, because of challenges associated with fruit harvest, all fruits were not collected from each tree. However, drupes were collected from each experimental olive tree and pressed according to irrigation regime. Because of a limited sample size, statistical analysis of olive oil characteristics was not performed. However, oil chemical and sensory attributes for each irrigation regime are presented (Tables 2 and 3). Based on International Olive Oil Council [5], qualitative standards of peroxide value (≤20), free acidity (≤0.8), and UV absorbance (K 232 ≤ 2.5, K 270 ≤ 0.22, ΔK ≤ 0.01), all samples were determined to be EVOO (Table 2).
Effect of irrigation regime (T1 – one emitter tree−1, T2 – two emitters tree−1, T3 – three emitters tree−1) on olive (Olea europaea L. cv. “Arbequina”) oil chemical analysis
| Peroxide value | Free acidity | UV absorbance | Total phenols | |||
|---|---|---|---|---|---|---|
| (meq O2 kg oil−1) | (% Oleic) | K 232 | K 270 | ΔK | (gallic acid eq mg kg oil−1) | |
| *Irrigation level | ||||||
| T1 | 7.68 | 0.27 | 1.897 | 0.114 | −0.003 | 100.0 |
| T2 | 4.84 | 0.21 | 1.672 | 0.114 | −0.002 | 76.0 |
| T3 | 5.98 | 0.24 | 1.711 | 0.115 | −0.002 | 69.0 |
*International Olive Oil Council qualitative standards for extra virgin olive oil (EVOO) are: peroxide value (≤20), free acidity (≤ 0.8), and UV absorbance (K 232 ≤ 2.5, K 270 ≤ 0.22, ΔK ≤ 0.01). Chemical analysis for all samples from each irrigation level meet International Olive Oil Council EVOO standards.
Effect of irrigation regime (T1 – one emitter tree−1, T2 – two emitters tree−1, T3 – three emitters tree−1) on olive (Olea europaea L. cv. “Arbequina”) oil sensory analysis
| Fruity* | Bitter | Pungent | Defects | Mild/Robust | |
|---|---|---|---|---|---|
| Irrigation level | |||||
| †T1 | 6.6 | 2.3 | 2.8 | None | Mild |
| ‡T2 | 6.9 | 1.4 | 1.7 | None | Mild |
| #T3 | 5.8 | 1.6 | 3.1 | None | Mild |
*Numerical ratings represent a scale of 0–10 and indicate the presence of specific attributes as defined by the International Olive Oil Council (IOOC) and the level of intensity of the specific attribute. If defects is “none,” then negative attributes were not detected. All samples qualified for IOOC extra virgin olive oil standards.
Sensory Description:
†Aroma reflected mostly ripe olive fruit described as buttery, floral, nutty, ripe apple, and tropical, accompanied by a hint of green fruit described as green apple. Also noted was cherry and mild astringency.
‡Aroma reflected mostly ripe olive fruit described as buttery, ripe apple, and tropical with a hint of ripe banana, accompanied by some green fruit described as green almond. Also noted was cherry, a hint of hay-straw, and mild astringency.
#Aroma reflected a mix of both green and ripe olive fruit described as green apple, green banana, buttery, and ripe banana, with hints of green almond and nutty. Also noted were hints of cherry and hay-straw. No astringency perceived.
Oil peroxide content decreased with greater water applied to experimental trees, whereas total phenols tended to increase with less irrigation volume. However, free acidity, K 232, K 270, and ΔK values remained stable across irrigation regimes (Table 2). Effects of reduced irrigation on olive oil quality are widely supported in the literature [15,27,41]. Berenguer et al. [16] indicate oil peroxide, free acidity, and UV absorbance were only slightly affected by irrigation volume applied to young “Arbequina” olive trees grown in a super high-density orchard. Similarly, irrigation treatment did not influence oil peroxide, free acidity, or UV absorbance values in traditional spaced, mature O. europaea “Frantoio” trees [41]. Nevertheless, García et al. [15] and Ahumada-Orellana et al. [53] indicate UV absorbance had greater values for water-stressed fruit. In addition, olive oil oxidative stability (which estimates time of oil resistance to oxidation) was found to be reduced in oil from trees which had been exposed to DI during the oil synthesis phenological stage of the growing season [11,15]. Others suggest if DI is applied throughout the entire growing season, an increase in olive oil oxidative stability may be found [16,54].
Numerous phenolic compounds found in EVOO contribute to the oil’s bitter taste and oxidation resistance [1,11,15]. Olive oil phenolic compounds act as antioxidants and delay the onset of oxidation and rancidity. As a result, EVOO phenolic compounds seem to have positive impacts on cardiovascular and cancer disease prevention and extend EVOO shelf life [2,55,56]. Although the phenolic content of olive oil is related to a number of factors (tree genotype, local climate and soil, orchard management technique, crop maturation level at harvest, oil extraction method, oil storage method, etc.) [1,16,27,41], our research and others [15,27,41,57] indicate olive trees exposed to DI (reduced irrigation) produce oils with greater phenolic compound levels when compared with non-DI olive trees. In fact, results from our experiment are analogous to previous reports [15,27,41,57]. We found total phenolics in oil produced from T1 trees was 24 and 31% greater when compared with T2 and T3 irrigation trees, respectively (Table 2).
Differences in total oil phenolics because of irrigation treatments are likely attributed to greater water content within fruits harvested from trees receiving greater irrigation volume. Polyphenols are soluble in water and significant amounts of phenolics are likely carried away during the oil extraction process [1,27,57]. In addition, olive trees under water stress show increased biosynthesis of enzyme activity (l-phenylalanine ammonia-lyase) for production of phenolic compounds [1,57,58]. “Arbequina” oil phenolic levels from our experiment seem to be lower [1,11,15,54,57,58] or similar [15,16] when compared with previous reports. However, oil produced from “Arbequina” trees is generally lower in phenolics when compared with phenolic levels of oil produced from other olive cultivars [11,15].
Olive oil quality is not only determined on the basis of chemical parameters, but also by sensory evaluation [58]. It is believed that the most critical, positive EVOO volatile attribute is “fruity.” However, “bitterness” and “pungency” are key volatiles as well [16,57]. Similar to olive oil phenolic content, a number of factors contribute to the presence and concentration of volatile compounds in EVOO (cultivar, orchard geographic area, local climate and soil, orchard management, fruit health, harvest scheme, fruit ripeness at harvest, fruit storage technique, oil extraction process, and oil storage method) [27,57]. In addition, olive tree water status has been found to influence EVOO volatile compounds. Benelli et al. [58] subjected “Frantoio” olive trees to three DI treatments and harvested fruit from different light sample zones within each tree’s canopy. They report olive oil volatile compounds were influenced by growing season fruit exposure to light and irrigation volume. They suggest differences in tree water status influenced concentration of volatile compounds found in olive oil, and which volatile compounds were present in oil [59]. However, volatile compounds and sensory characteristics from EVOO produced from mature “Arbequina” trees subjected to several DI treatments over three growing seasons did not differ [57]. Additional olive oil sensory data from trees subjected to DI [15,16,27] reveal inconsistent oil sensory response.
Our data suggest oil from T1 and T2 irrigation treatments increased “fruity” sensory characteristics from experimental olive trees. In addition, when compared with T2 and T3 irrigation treatments, the sensory characteristic “bitter” was greater for T1 treatment trees (Table 3). Olive oil sensory characteristic levels of “fruity,” “bitter,” and “pungent” produced from “Arbequina” trees in the current study are similar to EVOO sensory attributes presented in previous reports [15,57,59,60,61], but differ from others [16]. Moreover, olive oil sensory descriptive terms in our research are consistent between irrigation treatments (Table 3). Oil sensory descriptive terms such as “buttery,” “green apple,” “cherry,” “ripe banana,” “green almond,” “tropical,” and “ripe olive fruit” appear throughout sensory descriptions of oil from each irrigation regime. Tovar et al. [57] describes “Arbequina” olive oil with sweet fruit sensory attributes, whereas McEwan [62] indicates sensory characteristics of “Arbequina” olive oil as slightly pungent, sweet, and green. Our results indicate that EVOO from T1 irrigation regime trees received a greater “bitter” sensory analysis score when compared with oil from either T2 or T3 irrigation trees (Table 3). Also, “green” is mentioned more frequently as a sensory descriptor for oil from trees receiving the T3 irrigation treatment compared with oil from T1 and T2 irrigated trees. In addition, “astringency” is stated in the sensory description only for oils from T1 and T2 trees (Table 3). These sensory attributes are directly related to greater olive oil phenolic content [15,55,58,60] and seem to be greatest in EVOO from trees receiving the least amount of irrigation (Tables 2 and 3).
4 Conclusion
Availability of agricultural water is of critical importance in Texas. Because producing olives for oil in Texas is becoming a common agricultural endeavor, Texas olive growers are seeking orchard management information to enhance production of quality olive oil more efficiently. Lowering irrigation volume applied to olive orchards through DI seems to be a management technique that enables olive growers to significantly reduce irrigation volume, yet optimize EVOO quality without significantly affecting fruit or oil yield parameters. Through proper orchard management, our research suggests DI may assist Texas growers manage olive tree vegetative growth, increase fruit and oil phenolic content, moderate olive oil chemical and sensory characteristics, and reduce orchard irrigation volume. However, research demonstrates that timing and intense management of DI are critical factors Texas olive growers must consider. Although limited in scope, this research is a starting point and seems to be the first report on the influence reduced irrigation may have on olive oil production in Texas. To reduce costs and improve yield and oil quality, Texas olive growers should strongly consider using described methodologies (area under a mature olive tree’s dripline, ETO values, a K R of 1.0, and an K C value of 0.70) to reduce “Arbequina” olive tree irrigation volume and conserve significant irrigation water. Future research should consider the influence DI may have on Texas olive crops over additional growing seasons and cultivars. In addition, data should be collected on tree physiology (relationship of leaf gas exchange to leaf or stem water potential), total tree yield, and water use efficiency (oil yield/irrigation applied) and include an economic assessment of DI, crop yield, and oil characteristics (volume, chemical, and sensory).
Acknowledgments
The authors thank the Texas Association of Olive Oil for their assistance. This article represents a portion of the thesis submitted by Stacy Parks for the MS degree in the Department of Plant and Soil Science at Texas Tech University. Mention of a trademark, proprietary product, or vendor does not constitute a guarantee or warranty of the product by Texas Tech or Texas A&M University and does not imply the product’s approval to the exclusion of other products or vendors that also may be suitable.
-
Funding information: Research was funded in part by the Department of Plant and Soil Science and the Texas Department of Agriculture (Specialty Crop Block Grant #12-25-B-1256).
-
Author contributions: TM: conceptualization, funding acquisition, supervision, writing, statistics, review, editing, revisions; SP: data acquisition, writing – original draft.
-
Conflict of interest: The authors state no conflict of interest.
-
Data availability statement: The datasets generated during and/or analyzed during the current study are available from the corresponding author on reasonable request.
Appendix
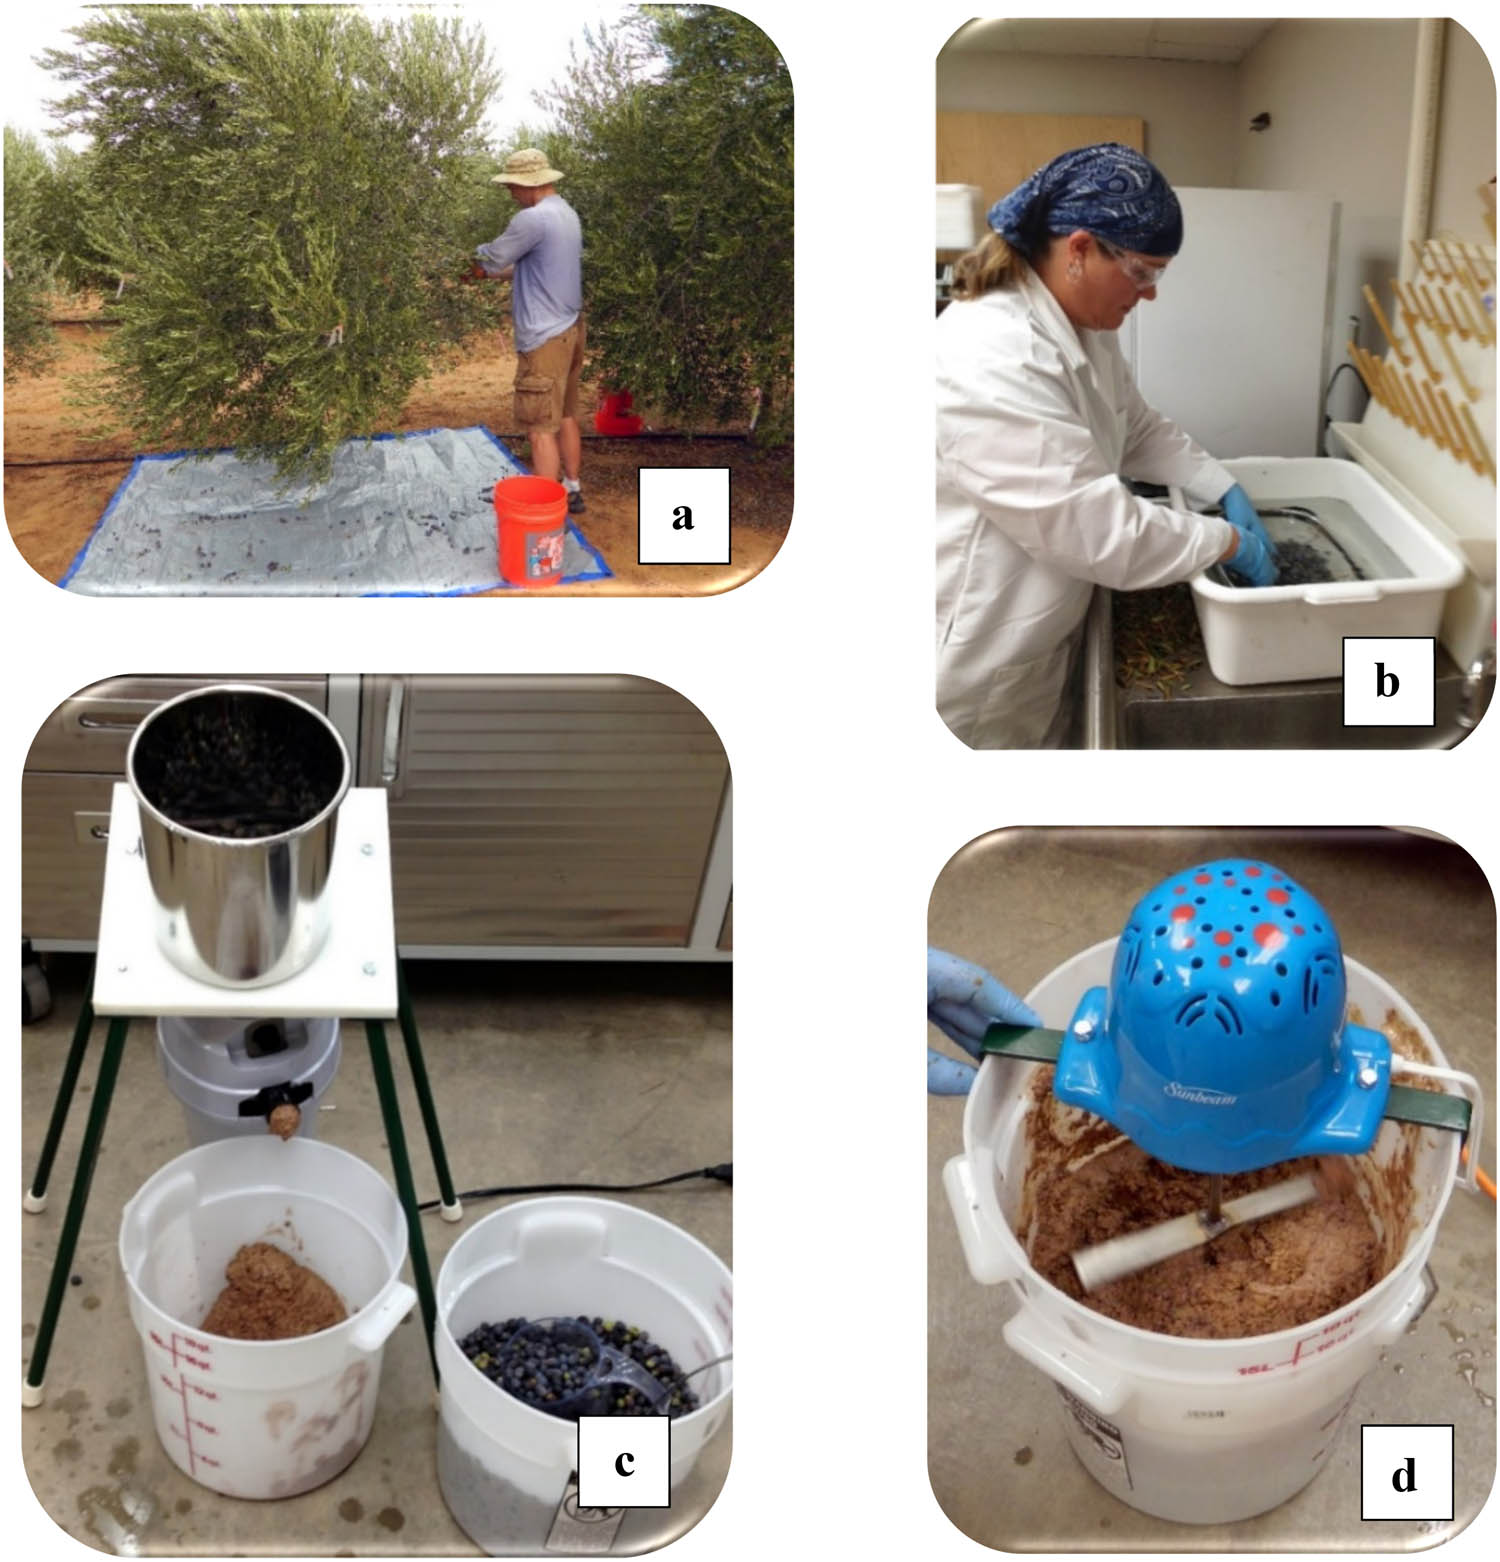
Olive oil preparation: hand harvesting fruit (a), washing fruit (b), crushing fruit (c), and malaxation of fruit paste (d).
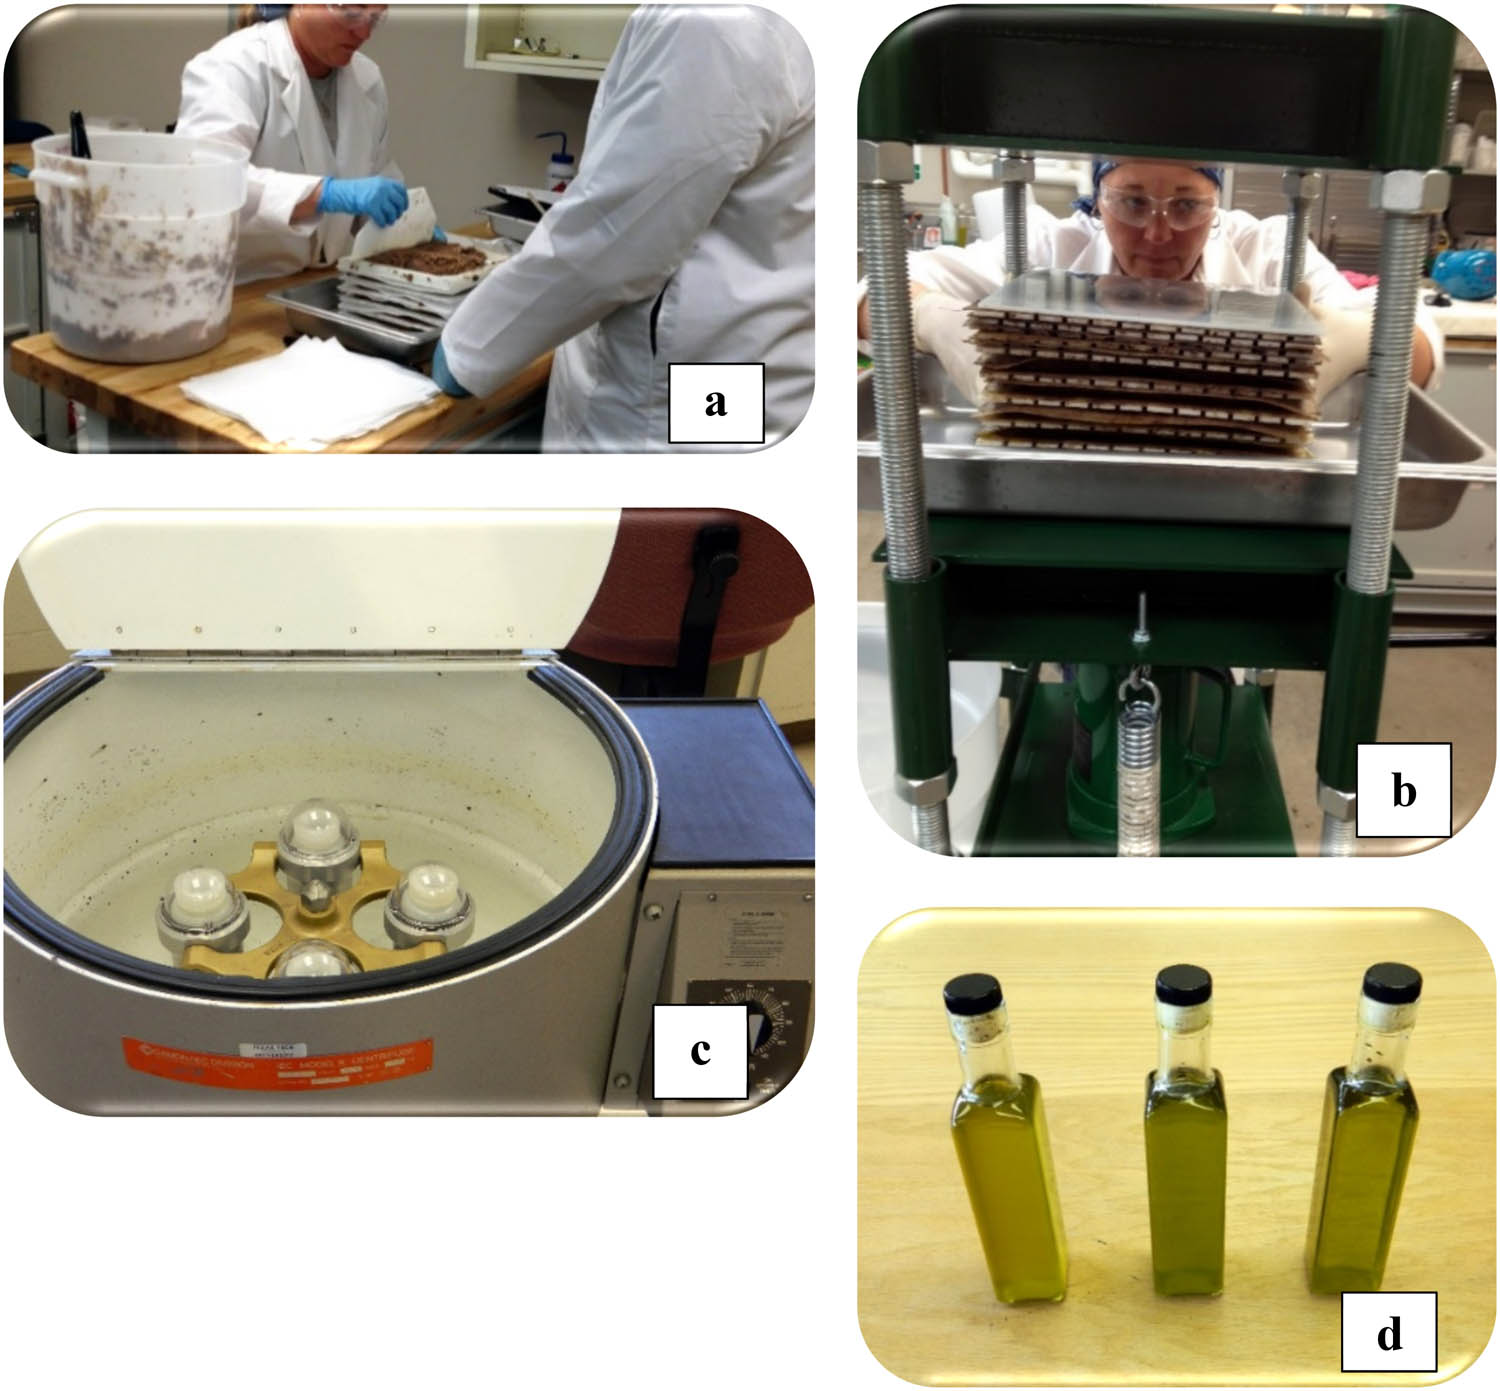
Olive oil preparation: preparing paste for hydraulic pressing (a), hydraulic pressing (b), centrifuging and decantation of oil (c), and samples of bottled oil (d).
References
[1] Anastasopoulos E, Kalogeropoulos N, Kaliora AC, Kountouri A, Andrikopoulos NK. The influence of ripening and crop year on quality indices, polyphenols, terpenic acids, squalene, fatty acid profile, and sterols in virgin olive oil (Koroneiki cv.) produced by organic versus non-organic cultivation method. Intl J Food Sci Technol. 2011;46:170–8. 10.1111/j.1365-2621.2010.02485.x.Search in Google Scholar
[2] Owen, RW, Giacosa A, Hull WE, Haubner R, Würtele G, Spiegelhalder B, et al. Olive-oil consumption and health: The possible role of antioxidants. Lancet Oncol. 2000;1:107–12. 10.1016/S1470-2045(00)00015-2.Search in Google Scholar
[3] Vossen P. Olive oil: history, production, and characteristics of the world’s classic oils. HortScience. 2007;42:1093–100. 10.21273/HORTSCI.42.5.1093.Search in Google Scholar
[4] Iniesta F, Villalobos FJ, Orgaz F, Testi L. The effects of regulated and continuous deficit irrigation on the water use, growth and yield of olive trees. European J Agron. 2009;30:258–65. 10.1016/j.eja.2008.12.004.Search in Google Scholar
[5] International Olive Oil Council; 2021. https://www.internationaloliveoil.org/Search in Google Scholar
[6] Tognetti R, d’Andria R, Sacchi R, Lavini A, Morelli G, Alvino A. Deficit irrigation affects seasonal changes in leaf physiology and oil quality of Olea europaea (cultivars Frantoio and Leccino). Annu Appl Bio. 2007;150:169–86. 10.1111/j.1744-7348.2007.00117.x.Search in Google Scholar
[7] Guerfel M, Baccouri O, Boujnah D, Chaïbi W, Zarrouk M. Impacts of water stress on gas exchange, water relations, chlorophyll content and leaf structure in the two main Tunisian olive (Olea europaea L.) cultivars. Sci Hort. 2009;119:257–63. 10.1016/j.scienta.2008.08.006.Search in Google Scholar
[8] Giorio P, Sorrentino G, d’Andria R. Stomatal behaviour, leaf water status and photosynthetic response in field-grown olive trees under water deficit. Environ Expt Bot. 1999;42:95–104. https://www.sciencedirect.com/science/article/pii/S0098847299000234.10.1016/S0098-8472(99)00023-4Search in Google Scholar
[9] Dichio B, Xiloyannis C, Angeropoulos K, Nuzzo V, Bufo SA, Celano G. Drought-induced variations of water relations parameters in Olea europaea. Plant and Soil. 2003;257:381–9. https://link.springer.com/article/10.1023/A:1027392831483.10.1023/A:1027392831483Search in Google Scholar
[10] Therios IN. Olives: Crop production science in horticulture.18. Wallingford, UK: CABI International Publishing; 2009.Search in Google Scholar
[11] Gómez del Campo M, García JM. Summer deficit-irrigation strategies in a hedgerow olive cv. Arbequina orchard: Effect on oil quality. J Agri Food Chem. 2013;61:8899–905. 10.1021/jf402107t.Search in Google Scholar PubMed
[12] Souri MK, Hatamian M. Aminochelates in plant nutrition: A Review. J Plant Nut. 2019;42:67–78. 10.1080/01904167.2018.1549671.Search in Google Scholar
[13] Zivdar S, Arzani K, Souri MK, Moallemi N, Seyyednejad SM. Physiological and biochemical response of live (Olea europaea L.) cultivars to foliar potassium application. J Agr Sci Tech. 2016;18:1897–908. chromeextension://efaidnbmnnnibpcajpcglclefindmkaj/viewer.html?pdfurl=http%3A%2F%2Fir.jkuat.ac.ke%2Fbitstream%2Fhandle%2F123456789%2F3666%2FJAST_Volume%252018_Issue%2520Supplementary%2520Issue_Pages%25201897-1908.pdf%3Fsequence%3D1%26isAllowed%3Dy&clen=217795.Search in Google Scholar
[14] Wahbi S, Wakrim R, Aganchich B, Tahi H, Serraj R. Effects of partial rootzone drying (PRD) on adult olive tree (Olea europaea) in field conditions under arid climate: I. Physiological and agronomic responses. Agri Ecol Environ. 2005;106:289–301. 10.1016/j.agee.2004.10.015.Search in Google Scholar
[15] García JM, Hueso A, Gómez-del-Campo M. Deficit irrigation during the oil synthesis period affects olive oil quality in high-density orchards (cv. Arbequina). Agr Water Mgt. 2020;230:105858. 10.1016/j.agwat.2019.105858.Search in Google Scholar
[16] Berenguer MJ, Vossen PM, Grattan SR, Connell JH, Polito VS. Tree irrigation levels for optimum chemical and sensory properties of olive oil. HortScience. 2006;41:427–32. 10.21273/HORTSCI.41.2.427.Search in Google Scholar
[17] Pérez-López D, Gijón MC, Moriana A. Influence of irrigation rate on the rehydration of olive tree plantlets. Agr Water Mgt. 2008;95:1161–6. 10.1016/j.agwat.2008.04.012.Search in Google Scholar
[18] Mansouri F, Ben Moumen A, Lopez G, Fauconnier ML, Sindic M, Serghini-Caid H, et al. Preliminary characterization of monovarietal virgin olive oils produced in eastern area of Morocco. Proceedings Inside Food Symposium; 2013. p. 6.Search in Google Scholar
[19] Rosecrance RC, Krueger WH, Milliron L, Bloese J, Garcia C, Mori B. Moderate regulated deficit irrigation can increase olive oil yields and decrease tree growth in super high density ‘Arbequina’ olive orchards. Sci Hort. 2015;190:75–82. 10.1016/j.scienta.2015.03.045.Search in Google Scholar
[20] Moriana A, Pérez-López D, Gómez-Rico A, de los Desamparados Salvador M, Olmedilla N, Ribas F, et al. Irrigation scheduling for traditional, low-density olive orchards: Water relations and influence on oil characteristics. Agr Water Mgt. 2007;87:171–9. 10.1016/j.agwat.2006.06.017.Search in Google Scholar
[21] Girona J, Luna M, Arbonés A, Mata M, Rufat J, Marsal J. Young olive trees responses (Olea europaea cv. “Arbequina”) to different water supplies. Water function determination. Acta Hort. 2002;586:277–80. 10.17660/ActaHortic.2002.586.53.Search in Google Scholar
[22] Moriana A, Orgaz F, Pastor M, Fereres E. Yield responses of a mature olive orchard to water deficits. J Amer Soc Hort Sci. 2003;128:425–31. 10.21273/JASHS.128.3.0425.Search in Google Scholar
[23] Grattan SR, Berenguer MJ, Connell JH, Polito VS, Vossen PM. Olive oil production as influenced by different quantities of applied water. Agr Water Mgt. 2006;85:133–40. 10.1016/j.agwat.2006.04.001.Search in Google Scholar
[24] Costa JM, Ortuño MF, Chaves MM. Deficit irrigation as a strategy to save water: Physiology and potential application to horticulture. J. Integrative Plant Biol. 2007;49:1421–34. https://onlinelibrary.wiley.com/doi/pdf/10.1111/j.1672-9072.2007.00556.x.10.1111/j.1672-9072.2007.00556.xSearch in Google Scholar
[25] Melgar JC, Mohamed Y, Navarro C, Parra MA, Benlloch M, Fernández-Escobar R. Long-term growth and yield responses of olive trees to different irrigation regimes. Agr Water Mgt. 2008;95:968–72. 10.1016/j.agwat.2008.03.001.Search in Google Scholar
[26] Caruso G, Rapoport HF, Gucci R. Long-term evaluation of yield components of young olive trees during the onset of fruit production under different irrigation regimes. Irr Sci. 2013;31:37–47. https://link.springer.com/content/pdf/10.1007/s00271-011-0286-0.pdf.10.1007/s00271-011-0286-0Search in Google Scholar
[27] Caruso G, Gucci R, Urbani S, Esposto S, Taticchi A, Di Maio I, et al. Effect of different irrigation volumes during fruit development on quality of virgin olive oil cv. Frantoio. Agri Water Mgt. 2014;134:94–103. 10.1016/j.agwat.2013.12.003.Search in Google Scholar
[28] Malik NS, Bradford JM, Brockington J. Growing olives in Texas. HortScience. 2004;39:799B. 10.21273/HORTSCI.39.4.799B.Search in Google Scholar
[29] Texas Association of Olive Oil; 2021. https://txaoo.org/.Search in Google Scholar
[30] Malik, NSA, Bradford JM. Genetic diversity and clonal variation among olive cultivars offer hope for selecting cultivars for Texas. J Amer Pomol Soc. 2004;58:203–9. https://search.proquest.com/docview/209772773/6055C602F7E44BC8PQ/5?accountid=7098. Melgar JC, Mohamed Y, Serrano N, García-Galavís PA, Navarro C, Parra MA, et al. Long term responses of olive trees to salinity. Agr Water Mg. 2009;96:1105–13. 10.1016/j.agwat.2009.02.009Search in Google Scholar
[31] Henry GM, Hoyle JA, Beck LL, Cooper T, Montague T, McKenney C. Evaluation of mulch and preemergence herbicide combinations for weed control in high-density olive (Olea europaea L.) production. HortScience. 2015;50:1338–41. 10.21273/HORTSCI.50.9.1338.Search in Google Scholar
[32] Texas A&M AgriLife Extension Service; 2015. https://aggie-horticulture.tamu.edu/fruit-nut/files/2015/04/olives_2015.pdf.Search in Google Scholar
[33] Leskovar D, Othman Y. Nitrogen management for improving root and shoot components of young ‘Arbequina’ olives. HortScience. 2019;54:175–80. 10.21273/HORTSCI13397-18.Search in Google Scholar
[34] Othman Y, Leskovar D. Nitrogen management influenced root length intensity of young olive trees. Sci Hort. 2019;246:726–33. 10.1016/j. scienta.2018.11.052 Search in Google Scholar
[35] Natural Resources Conservation Service; 2021. https://websoilsurvey.nrcs.usda.gov/app/.Search in Google Scholar
[36] Fox L, Montague T. Influence of irrigation regime on growth of select field-grown tree species in a semi-arid climate. J Enviro Hort. 2009;27:134–8. 10.24266/0738-2898-27.3.134.Search in Google Scholar
[37] Montague, T., Bates A. Response of two field-grown maple (Acer) species to reduced irrigation in a high vapor pressure, semi-arid climate. Arboric and Urban For. 2015;41:334–45. 10.48044/jauf.2015.029.Search in Google Scholar
[38] Campbell GS, Norman JM. An introduction to biophysics. 2nd edn. New York, NY: Springer-Verlag; 1998.10.1007/978-1-4612-1626-1Search in Google Scholar
[39] Rizzo R, Caleca V, Lombardo A. Relation of fruit color, elongation, hardness, and volume to the infestation of olive cultivars by the olive fruit fly, Bactrocera oleae. Entomol Expt Appl. 2012;145:15–22. https://onlinelibrary.wiley.com/doi/10.1111/j.1570-7458.2012.01311.x.10.1111/j.1570-7458.2012.01311.xSearch in Google Scholar
[40] U.S. Climate Data; 2021. https://www.usclimatedata.com/climate/cotulla/texas/united-states/ustx2406.Search in Google Scholar
[41] Gucci R, Caruso G, Gennai C, Esposto S, Urbani S, Servili M. Fruit growth, yield and oil quality changes induced by deficit irrigation at different stages of olive fruit development. Agr Water Mgt. 2019;212:88–98. 10.1016/j.agwat.2018.08.022.Search in Google Scholar
[42] Testi L, Orgaz F, Villalobos FJ. Variations in bulk canopy conductance of an irrigated olive (Olea europaea L.) orchard. Environ Expt Bot. 2006;55:15–28. 10.1016/j.envexpbot.2004.09.008.Search in Google Scholar
[43] Testi L, Orgaz F, Villalobos FJ. Carbon exchange and water use efficiency of a growing, irrigated olive orchard. Environ Expt Bot. 2008;63:168–77. 10.1016/j.envexpbot.2007.11.006.Search in Google Scholar
[44] Tognetti R, d’Andria R, Lavini A, Morelli G. The effect of deficit irrigation on crop yield and vegetative development of Olea europaea L. (cvs. Frantoio and Leccino). European J Agron. 2006;25:356–64. 10.1016/j.eja.2006.07.003.Search in Google Scholar
[45] Correa-Tedesco G, Rousseaux MC, Searles PS. Plant growth and yield responses in olive (Olea europaea) to different irrigation levels in an arid region of Argentina. Agri Water Mgt. 2010;97:1829–37. 10.1016/j.agwat.2010.06.020.Search in Google Scholar
[46] Goldhammer DA, Dunai J, Fergusson L. Water use of ‘Manzanillo’ olives and responses to sustained deficit irrigation. Acta Hort. 1993;335:365–71.10.17660/ActaHortic.1993.335.44Search in Google Scholar
[47] Orgaz, F, Testi L, Villalobos FJ, Fereres E. Water requirements of olive orchards – II: Determination of crop coefficients for irrigation scheduling. Irrig Sci. 2006;24:77–84. 10.1007/s00271-005-0012-x.Search in Google Scholar
[48] Moumen, Z, Elhassnaoui I, Khaddi W, Wahba MAS, Lahrach A. Assessment of deficit irrigation efficiency. Case Study: Middle Sebou and Innaouene downstream. Open Agric. 2021;6:102–14. 10.1515/opag-2021-0223.Search in Google Scholar
[49] Moriana A, Villalobos FJ, Fereres E. Stomatal and photosynthetic responses of olive (Olea europaea L.) leaves to water deficits. Plant Cell Environ. 2002;25:395–405. 10.1046/j.0016-8025.2001.00822.x.Search in Google Scholar
[50] Magliulo V, D’Andria R, Lavini A, Morelli G, Patumi M. Yield and quality of two rainfed olive cultivars following shifting to irrigation. J Hort Sci Biotechnol. 2003;78:15–23. 10.1080/14620316.2003.11511578.Search in Google Scholar
[51] d’Andria R, Lavini A, Morelli G, Patumi M, Terenziani S, Calandrelli D, et al. Effect of water regimes on five pickling and double aptitude olive cultivars (Olea europaea L.). J Hort Sci Biotechnol. 2004;79:18–25. 10.1080/14620316.2004.11511731.Search in Google Scholar
[52] Pavel EW, Dejong TM. Source-and sink-limited growth periods of developing peach fruits indicated by relative growth rate analysis. J Amer Soc Hort Sci. 1993;118:820–4. 10.21273/JASHS.118.6.820.Search in Google Scholar
[53] Ahumada-Orellana LE, Orega-Farías S, Searles PS. Olive oil quality response to irrigation cut-off strategies in a super-high density orchard. Agr Water Mgt. 2018;202:81–8. 10.1016/j.agwat.2018.02.008.Search in Google Scholar
[54] García JM, Cuevas MV, Fernández JE. Production and oil quality in ‘Arbequina’ olive (Olea europaea, L.) trees under two deficit irrigation strategies. Irr Sci. 2013;31:359–70. https://link.springer.com/content/pdf/10.1007/s00271-011-0315-z.pdf.10.1007/s00271-011-0315-zSearch in Google Scholar
[55] Owen RW, Giacosa A, Hull WE, Haubner R, Spiegelhalder B, Bartsch H. The antioxidant/anticancer potential of phenolic compounds isolated from olive oil. European J Cancer. 2000;36:1235–47. 10.1016/S0959-8049(00)00103-9.Search in Google Scholar
[56] Agbiolab; 2021. https://drive.google.com/file/d/lOygbDwEPW4vL17FsyUjy2E3QBo14f05P/view.Search in Google Scholar
[57] Tovar MJ, Romero MP, Alegre S, Girona J, Motilva JM. Composition and organoleptic characteristics of oil from Arbequina olive (Olea europaea L) trees under deficit irrigation. J Sci Food and Agr. 2002;82:1755–63. 10.1002/jsfa.1246.Search in Google Scholar
[58] Benelli G, Caruso G, Giunti G, Cuzzola A, Saba A, Raffaelli A, et al. Changes in olive oil volatile organic compounds induced by water status and light environment in canopies of Olea europaea L. trees. J Sci Food Agr. 2015;95:2473–81. 10.1002jsfa.6977.Search in Google Scholar
[59] Angerosa F, Servili M, Selvaggini R, Taticchi A, Esposto S, Montedoro G. Volatile compounds in virgin olive oil: Occurrence and their relationship with quality. J Chromatograp. 2004;1054:17–31. 10.1016/j.chroma.2004.07.093.Search in Google Scholar
[60] Morelló JR, Romero MP, Ramo T, Motilva MJ. Evaluation of L-phenylalanine ammonia-lyase activity and phenolic profile in olive drupe (Olea europaea L.) from fruit setting period to harvesting time. Plant Sci. 2005;168:65–72. 10.1016/j.plantsci.2004.07.013.Search in Google Scholar
[61] Servili MS, Esposto E, Lodolini R, Selvaggini A, Taticchi S, Urbani G, et al. Irrigation effects on quality, phenolic composition, and selected volatiles of virgin olive oils Cv. Leccino. J Agr Food Chem. 2007;55:6609–18. 10.1021/jf070599n.Search in Google Scholar PubMed
[62] McEwan JA. Consumer attitudes and olive oil acceptance: the potential consumer. Grasas y Aceites. 1994;45:9–15. http://grasasyaceites.revistas.csic.es/index.php/grasasyaceites/article/view/963/97210.3989/gya.1994.v45.i1-2.963Search in Google Scholar
© 2022 Staci Parks and Thayne Montague, published by De Gruyter
This work is licensed under the Creative Commons Attribution 4.0 International License.
Articles in the same Issue
- Regular Articles
- Foliar application of boron positively affects the growth, yield, and oil content of sesame (Sesamum indicum L.)
- Impacts of adopting specialized agricultural programs relying on “good practice” – Empirical evidence from fruit growers in Vietnam
- Evaluation of 11 potential trap crops for root-knot nematode (RKN) control under glasshouse conditions
- Technical efficiency of resource-poor maize farmers in northern Ghana
- Bulk density: An index for measuring critical soil compaction levels for groundnut cultivation
- Efficiency of the European Union farm types: Scenarios with and without the 2013 CAP measures
- Participatory validation and optimization of the Triple S method for sweetpotato planting material conservation in southern Ethiopia
- Selection of high-yield maize hybrid under different cropping systems based on stability and adaptability parameters
- Soil test-based phosphorus fertilizer recommendation for malting barley production on Nitisols
- Effects of domestication and temperature on the growth and survival of the giant freshwater prawn (Macrobrachium rosenbergii) postlarvae
- Influence of irrigation regime on gas exchange, growth, and oil quality of field grown, Texas (USA) olive trees
- Present status and prospects of value addition industry for agricultural produce – A review
- Competitiveness and impact of government policy on chili in Indonesia
- Growth of Rucola on Mars soil simulant under the influence of pig slurry and earthworms
- Effect of potassium fertilizer application in teff yield and nutrient uptake on Vertisols in the central highlands of Ethiopia
- Dissection of social interaction and community engagement of smallholder oil palm in reducing conflict using soft system methodology
- Farmers’ perception, awareness, and constraints of organic rice farming in Indonesia
- Improving the capacity of local food network through local food hubs’ development
- Quality evaluation of gluten-free biscuits prepared with algarrobo flour as a partial sugar replacer
- Effect of pre-slaughter weight on morphological composition of pig carcasses
- Study of the impact of increasing the highest retail price of subsidized fertilizer on rice production in Indonesia
- Agrobiodiversity and perceived climatic change effect on family farming systems in semiarid tropics of Kenya
- Influences of inter- and intra-row spacing on the growth and head yield of cabbage (Brassica oleracea var. capitata) in western Amhara, Ethiopia
- The supply chain and its development concept of fresh mulberry fruit in Thailand: Observations in Nan Province, the largest production area
- Toward achieving sustainable development agenda: Nexus between agriculture, trade openness, and oil rents in Nigeria
- Phenotyping cowpea accessions at the seedling stage for drought tolerance in controlled environments
- Apparent nutrient utilization and metabolic growth rate of Nile tilapia, Oreochromis niloticus, cultured in recirculating aquaculture and biofloc systems
- Influence of season and rangeland-type on serum biochemistry of indigenous Zulu sheep
- Meta-analysis of responses of broiler chickens to Bacillus supplementation: Intestinal histomorphometry and blood immunoglobulin
- Weed composition and maize yield in a former tin-mining area: A case study in Malim Nawar, Malaysia
- Strategies for overcoming farmers’ lives in volcano-prone areas: A case study in Mount Semeru, Indonesia
- Principal component and cluster analyses based characterization of maize fields in southern central Rift Valley of Ethiopia
- Profitability and financial performance of European Union farms: An analysis at both regional and national levels
- Analysis of trends and variability of climatic parameters in Teff growing belts of Ethiopia
- Farmers’ food security in the volcanic area: A case in Mount Merapi, Indonesia
- Strategy to improve the sustainability of “porang” (Amorphophallus muelleri Blume) farming in support of the triple export movement policy in Indonesia
- Agrarian contracts, relations between agents, and perception on energy crops in the sugarcane supply chain: The Peruvian case
- Factors influencing the adoption of conservation agriculture by smallholder farmers in KwaZulu-Natal, South Africa
- Meta-analysis of zinc feed additive on enhancement of semen quality, fertility and hatchability performance in breeder chickens
- Meta-analysis of the potential of dietary Bacillus spp. in improving growth performance traits in broiler chickens
- Biocomposites from agricultural wastes and mycelia of a local mushroom, Lentinus squarrosulus (Mont.) Singer
- Cross transferability of barley nuclear SSRs to pearl millet genome provides new molecular tools for genetic analyses and marker assisted selection
- Detection of encapsulant addition in butterfly-pea (Clitoria ternatea L.) extract powder using visible–near-infrared spectroscopy and chemometrics analysis
- The willingness of farmers to preserve sustainable food agricultural land in Yogyakarta, Indonesia
- Transparent conductive far-infrared radiative film based on polyvinyl alcohol with carbon fiber apply in agriculture greenhouse
- Grain yield stability of black soybean lines across three agroecosystems in West Java, Indonesia
- Forms of land access in the sugarcane agroindustry: A comparison of Brazilian and Peruvian cases
- Assessment of the factors contributing to the lack of agricultural mechanization in Jiroft, Iran
- Do poor farmers have entrepreneurship skill, intention, and competence? Lessons from transmigration program in rural Gorontalo Province, Indonesia
- Communication networks used by smallholder livestock farmers during disease outbreaks: Case study in the Free State, South Africa
- Sustainability of Arabica coffee business in West Java, Indonesia: A multidimensional scaling approach
- Farmers’ perspectives on the adoption of smart farming technology to support food farming in Aceh Province, Indonesia
- Rice yield grown in different fertilizer combination and planting methods: Case study in Buru Island, Indonesia
- Paclobutrazol and benzylaminopurine improve potato yield grown under high temperatures in lowland and medium land
- Agricultural sciences publication activity in Russia and the impact of the national project “Science.” A bibliometric analysis
- Storage conditions and postharvest practices lead to aflatoxin contamination in maize in two counties (Makueni and Baringo) in Kenya
- Relationship of potato yield and factors of influence on the background of herbological protection
- Biology and life cycle Of Diatraea busckella (Lepidoptera: Crambidae) under simulated altitudinal profile in controlled conditions
- Evaluation of combustion characteristics performances and emissions of a diesel engine using diesel and biodiesel fuel blends containing graphene oxide nanoparticles
- Effect of various varieties and dosage of potassium fertilizer on growth, yield, and quality of red chili (Capsicum annuum L.)
- Review Articles
- Germination ecology of three Asteraceae annuals Arctotis hirsuta, Oncosiphon suffruticosum, and Cotula duckittiae in the winter-rainfall region of South Africa: A review
- Animal waste antibiotic residues and resistance genes: A review
- A brief and comprehensive history of the development and use of feed analysis: A review
- The evolving state of food security in Nigeria amidst the COVID-19 pandemic – A review
- Short Communication
- Response of cannabidiol hemp (Cannabis sativa L.) varieties grown in the southeastern United States to nitrogen fertilization
- Special Issue on the International Conference on Multidisciplinary Research – Agrarian Sciences
- Special issue on the International Conference on Multidisciplinary Research – Agrarian Sciences: Message from the editor
- Maritime pine land use environmental impact evolution in the context of life cycle assessment
- Influence of different parameters on the characteristics of hazelnut (var. Grada de Viseu) grown in Portugal
- Organic food consumption and eating habit in Morocco, Algeria, and Tunisia during the COVID-19 pandemic lockdown
- Customer knowledge and behavior on the use of food refrigerated display cabinets: A Portuguese case
- Perceptions and knowledge regarding quality and safety of plastic materials used for food packaging
- Understanding the role of media and food labels to disseminate food related information in Lebanon
- Liquefaction and chemical composition of walnut shells
- Validation of an analytical methodology to determine humic substances using low-volume toxic reagents
- Special Issue on the International Conference on Agribusiness and Rural Development – IConARD 2020
- Behavioral response of breeder toward development program of Ongole crossbred cattle in Yogyakarta Special Region, Indonesia
- Special Issue on the 2nd ICSARD 2020
- Perceived attributes driving the adoption of system of rice intensification: The Indonesian farmers’ view
- Value-added analysis of Lactobacillus acidophilus cell encapsulation using Eucheuma cottonii by freeze-drying and spray-drying
- Investigating the elicited emotion of single-origin chocolate towards sustainable chocolate production in Indonesia
- Temperature and duration of vernalization effect on the vegetative growth of garlic (Allium sativum L.) clones in Indonesia
- Special Issue on Agriculture, Climate Change, Information Technology, Food and Animal (ACIFAS 2020)
- Prediction model for agro-tourism development using adaptive neuro-fuzzy inference system method
- Special Issue of International Web Conference on Food Choice and Eating Motivation
- Can ingredients and information interventions affect the hedonic level and (emo-sensory) perceptions of the milk chocolate and cocoa drink’s consumers?