Placental growth factor as a predictive marker of preeclampsia in twin pregnancy
-
 ,
,

Abstract
Objectives
Placental growth factor (PlGF) has been reported as a good biomaker for the prediction of preeclampsia occurring in the short term in singleton pregnancies, in women presenting with clinical suspicion of preeclampsia. This study aims to evaluate the predictive value of the PlGF in twin pregnancies.
Methods
Twin pregnancies with clinically suspected preeclampsia (24 weeks 0 days–36 weeks 6 days of gestation) were enrolled in this study. The threshold of PlGF for predicting preeclampsia was determined on the basis of a receiver-operating characteristic curve to predict preeclampsia and the short-term occurrence of preeclampsia.
Results
Within 1 week, 2 weeks, and 4 weeks of testing respectively, a cutoff value of 215 pg/mL for PlGF to predict preeclamsia in twin pregnancies suspected to have preeclampsia has a specificity of 100 %[51.7 %, 100 %], 100 %[62.9 %, 100 %], 93.8 %[667.6 %, 99.7 %], and a negative predictive value of 100 %[94.8 %, 100 %], 100 %[95.0 %, 100 %], and 98.9 %[93.0 %, 99.9 %].
Conclusions
A cutoff value of 215 pg/mL for PlGF is a useful tool to exclude the development of preeclampsia within 4 weeks of measurement.
Introduction
Preeclampsia, complicating 2–8 % of all pregnancies, remains a major cause of maternal morbidity and mortality worldwide [1], [2], [3]. Discovery of circulating angiogenic factors in the pathogenesis of preeclampsia has been a major advance for both diagnosis and prognosis. Recent publications have confirmed that the level of the pro-angiogenic factor, placental growth factor (PlGF), can be measured in the maternal serum and is specifically relates to the onset and severity of preeclampsia. The PlGF cutoff value of 100 pg/mL have a very high negative predictive value in ruling out the development of preeclampsia needing delivery within 14 days of testing among women with suspected preeclampsia [4], [5], [6], [7], [8], [9]. Twin pregnancies have a 2–3 times higher risk for preeclampsia than singleton pregnancies, whereas only little research has studied the predictive value of the PlGF in twin pregnancies [10], 11]. Thus, Better guidance is needed on the risk stratification among twin pregnant women with suspected preeclampsia.
In this study, we aimed to evaluate whether PlGF is also applicable to twin pregnancies to help predict the risk of preeclampsia, and to explore the optimal cutoff value of PlGF in predicting preeclampsia.
Materials and methods
Study design and participants
This was a single-center, prospective observational study with data collected retrospectively in twin pregnancies. Women aged 18 years and older who presented with suspected preeclampsia with a live twin pregnancy, booking for antenatal care between 24 weeks 0 days–36 weeks 6 days gestation at Hospital of Maternal and Health of Tangshan between July 2020 and February 2022 were invited to participate. Suspected preeclampsia was defined if one or more of the following signs or symptoms are met: headache with visual disturbances, epigastric or right upper-quadrant pain, dipstick proteinuria, new-onset or worsening of existing hypertension, a headache with visual disturbances, abnormal maternal blood tests that were suggestive of disease (such as hepatic or thrombocytopenia or renal dysfunction), and fetal growth restriction. This study was approved by the Ethics Committee of the Hospital of Maternal and Health of Tangshan, and all participants signed informed consent.
Definitions and outcome measures
The outcome was the diagnosis of preeclampsia , as defined by the international Society for the Study of Hypertension in Pregnancy 2018 recommendations [12].
Materials
Maternal blood sample was collected from each participant at recruitment. A volume of 5 mL of maternal blood was drawn using EDTA tubes for plasma samples. Samples were inverted at least five times after blood drawing and left to clot at room temperature for 30 min before centrifugation. Plasma was collected after centrifugation and stored at 2° C–8° C until analysis. All samples were analyzed within 24 h.
Plasma levels of PlGF were measured in batch using a commercial PlGF assay at clinical laboratory, on an automated immunoassay platform (iRaTe 1,600/300; Aucheer, China). Sample analysis was performed according to the manufacturer’s instruction.
The assay uses fluorescent labeled recombinant murine monoclonal antibodies and detects PlGF specifically and quantitatively, in the range of 12–3,000 pg/mL, in≈12 min. The assay coefficients of variation for PlGF was <15 %.
Data collection and follow up
Baseline characteristics and confirmation eligibility were obtained during participants interview. Gestational age was determined based on the last menstrual period. Maternal characteristics and medical, obstetric histories were recorded; maternal weight and height were measured. Mean arterial pressure (MAP) was measured by validated automated devices (BP3AQ1 Microlife, Taipei, Taiwan) according to the manufacture’s protocol. Pregnancy outcomes were obtained from the medical file of patient. Patients’ follow-up continued until hospital discharge.
Statistical analysis
The formulae for calculating multiple of the median (MoM) values of PlGF were determined by multivariate regression analysis of factors including gestational age and maternal characteristics(maternal age, maternal weight, parity, conception, diabetes mellitus) of singleton pregnancies using the clinical data from Hospital of Maternal and Health of Tangshan. Measured values of PlGF were converted into MoMs.
Statistical Package of SPSS version 19.0 was used for analysis. A receiver operating characteristic (ROC) curve analysis was performed to determine the optimal cutoff predictive value of PlGF and PlGF MoM for preeclampsia. Chi-square test, T-test, Kruskal Wallis test and ANOVA were used for data analysis All statistical tests were bilateral. A p-value of <0.05 was considered statistically significant.
Results
Demographics and characteristics
Between July 2020 and February 2022, a total of 298 twin pregnancies were enrolled, of which 141 were suspected with preeclampsia and eligible for analysis. Baseline characteristics and laboratory findings based on the clinical diagnosis at time of study entry are shown in Table 1. A total of 36 patients developed preeclampsia were observed, and the incidence of preeclampsia was 25.53 %.
Baseline characteristics of the study participants.
| No preeclampsia (n=105) | Preeclampsia (n=36) | p-Valuea | p-Valueb | |
|---|---|---|---|---|
| Age | 31.28 ± 4.28 | 31.22 ± 4.31 | 0.948 | 0.758 |
| Gestational age at delivery | 36.34 ± 1.42 | 35.41 ± 1.74 | 0.002 | 0.005 |
| Gestational age at screening | 30.89 ± 4.69 | 31.16 ± 4.21 | 0.759 | 0.959 |
| Weight, kg | 74.73 ± 12.20 | 82.59 ± 12.88 | 0.002 | 0.002 |
| BMI | 28.36 ± 4.25 | 31.68 ± 4.65 | <0.001 | <0.001 |
| Systolic blood pressure, mmHg | 122.50 ± 12.83 | 132.11 ± 13.35 | <0.001 | <0.001 |
| Diastolic blood pressure, mmHg | 76.59 ± 10.36 | 83.00 ± 13.33 | 0.004 | 0.005 |
| MAP | 91.89 ± 10.38 | 99.37 ± 12.14 | <0.001 | <0.001 |
| PlGF, pg/mL | 483.13 ± 509.22 | 197.94 ± 186.65 | 0.001 | <0.001 |
| PlGF MoM | 1.26 ± 1.23 | 0.54 ± 0.55 | <0.001 | <0.001 |
| Gravidity | 0.595 | – | ||
| 1 | 47 (44.76 %) | 16 (44.44 %) | ||
| 2 | 26 (24.76 %) | 12 (33.33 %) | ||
| >=3 | 32 (30.48 %) | 8 (22.22 %) | ||
| Parity | 0.195 | – | ||
| 0 | 71 (67.62 %) | 31 (86.11 %) | ||
| 1 | 25 (23.81 %) | 4 (11.11 %) | ||
| >=2 | 9 (8.57 %) | 1 (2.78 %) | ||
| Conception | 0.511 | – | ||
| Spontaneous | 62 (59.05 %) | 19 (52.78 %) | ||
| Assisted | 43 (40.95 %) | 17 (47.22 %) | ||
| Diabetes mellitus | 0.63 | – | ||
| No | 90 (85.71 %) | 32 (88.89 %) | ||
| Yes | 15 (14.29 %) | 4 (11.11 %) | ||
| Thyroid abnormalities | 0.295 | – | ||
| No | 89 (84.76 %) | 33 (91.67 %) | ||
| Yes | 16 (15.24 %) | 3 (8.33 %) | ||
| Anemia | 0.783 | – | ||
| No | 95 (90.48 %) | 32 (88.89 %) | ||
| Yes | 10 (9.52 %) | 4 (11.11 %) | ||
| Scarred uterus | 0.251 | – | ||
| No | 81 (77.14 %) | 31 (86.11 %) | ||
| Yes | 24 (22.86 %) | 5 (13.89 %) | ||
| Previous adverse pregnancy outcomes | 0.262 | – | ||
| No | 97 (92.38 %) | 31 (86.11 %) | ||
| Yes | 8 (7.62 %) | 5 (13.89 %) | ||
| Epatitis | 0.099 | 0.16 | ||
| No | 104 (99.05 %) | 34 (94.44 %) | ||
| Yes | 1 (0.95 %) | 2 (5.56 %) |
-
Results are presented as mean ± SD. p<0.05 is considered significant. MAP, mean arterial pressure; PlGF, placental growth factor; MoM, multiple of median. at-test; bKruskal Wallis test.
Placental growth factor in twin pregnancies with and without the development of preeclampsia
The distribution of PlGF and PlGF MoMs, between 24 and 36 weeks gestation, of twin pregnancies suspected with preeclampsia was shown in Figure 1. MoM calculations were not adjusted for chorionicity because there was no difference in PlGF levels based on chorionicity (Figure 2).
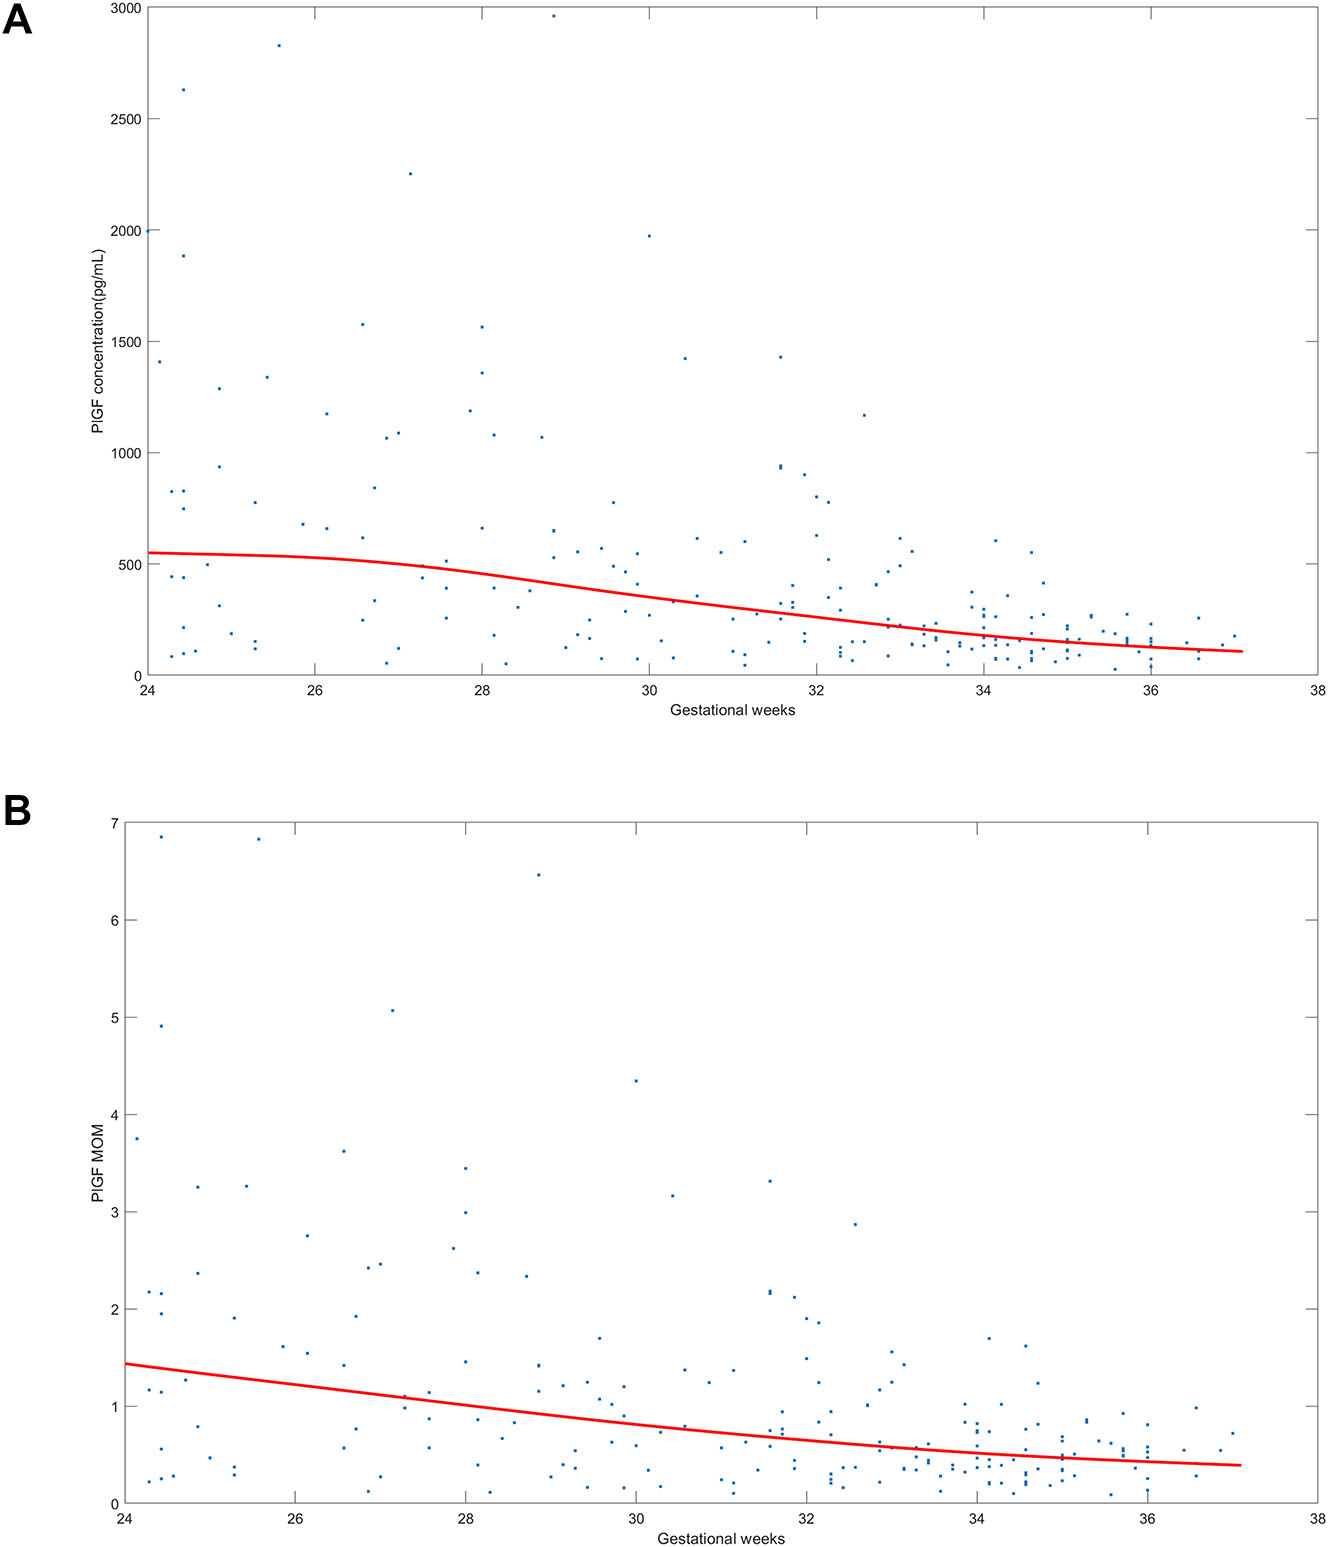
The distribution of placental growth factor (PlGF) and PlGF multiple of the median (MoM) in twin pregnancies with suspected preeclampsia. (A) Shows the distribution of PlGF value and (B) shows the distribution of PlGF MoM between 24 weeks 0 days–36 weeks 6 days gestation in twin pregnancies clinically suspected of having preeclampsia. The blue dots means PlGF concentration in (A) and PlGF MoM in. (B) The red line means the median of PlGF concentration in (A) and the median of PlGF MoM in (B).
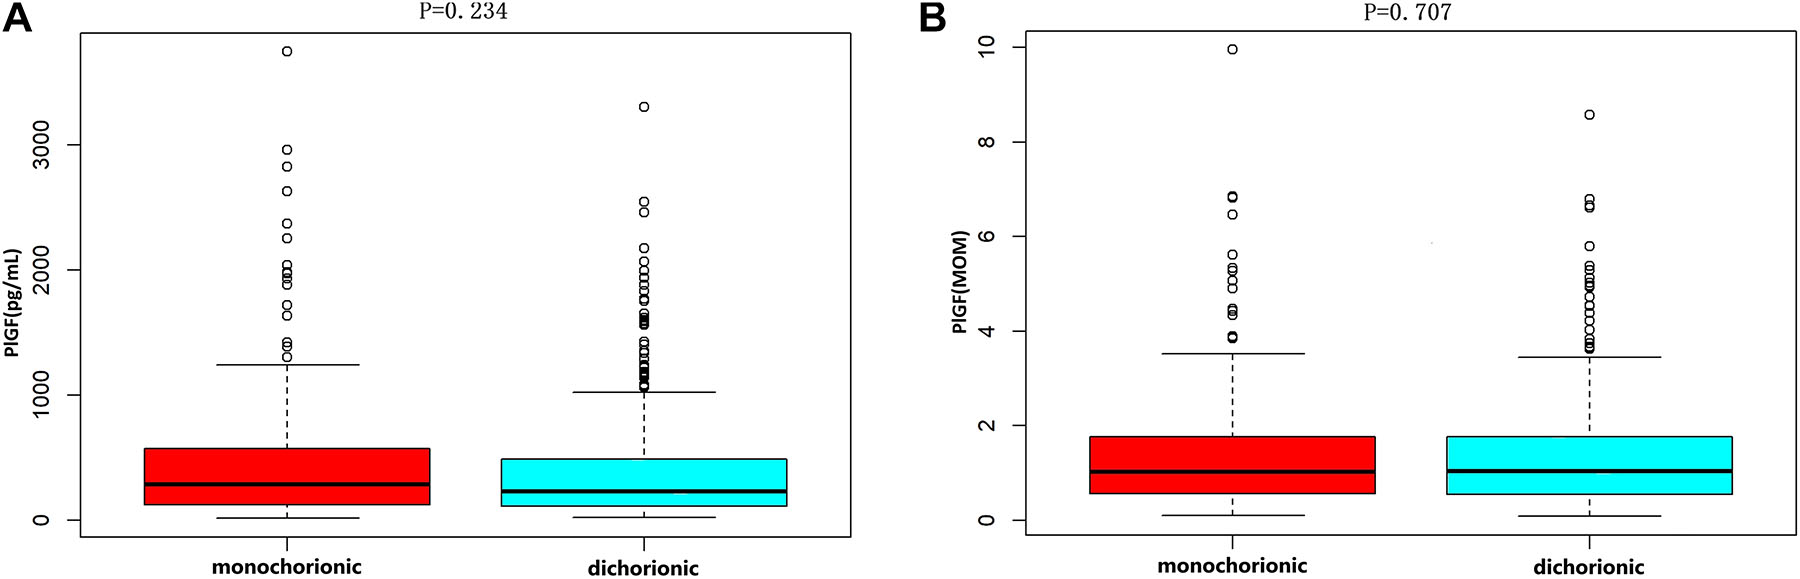
Placental growth factor levels based on chorionicity. (A) Shows the PlGF value in monochorionic and dichorionic pregnancies (p=0.707). (B) Shows the PlGF MoM in monochorionic and dichorionic pregnancies (p=0.234). The bottom edge and the top edge of each box represents the minimum value and the 90 % percentile, respectively. The band within the box represents the median value.
Patients who developed preeclampsia had significantly lower PlGF levels (p<0.001), both PlGF values and PlGF MoMs, compared with unaffected pregnancies (Figure 3A and B). The results showed that, between 24 and 36 weeks gestation, PlGF showed well separation between the two groups, indicating that PlGF could be used to predict the risk of preeclampsia in twin pregnant women suspected with preeclampsia.
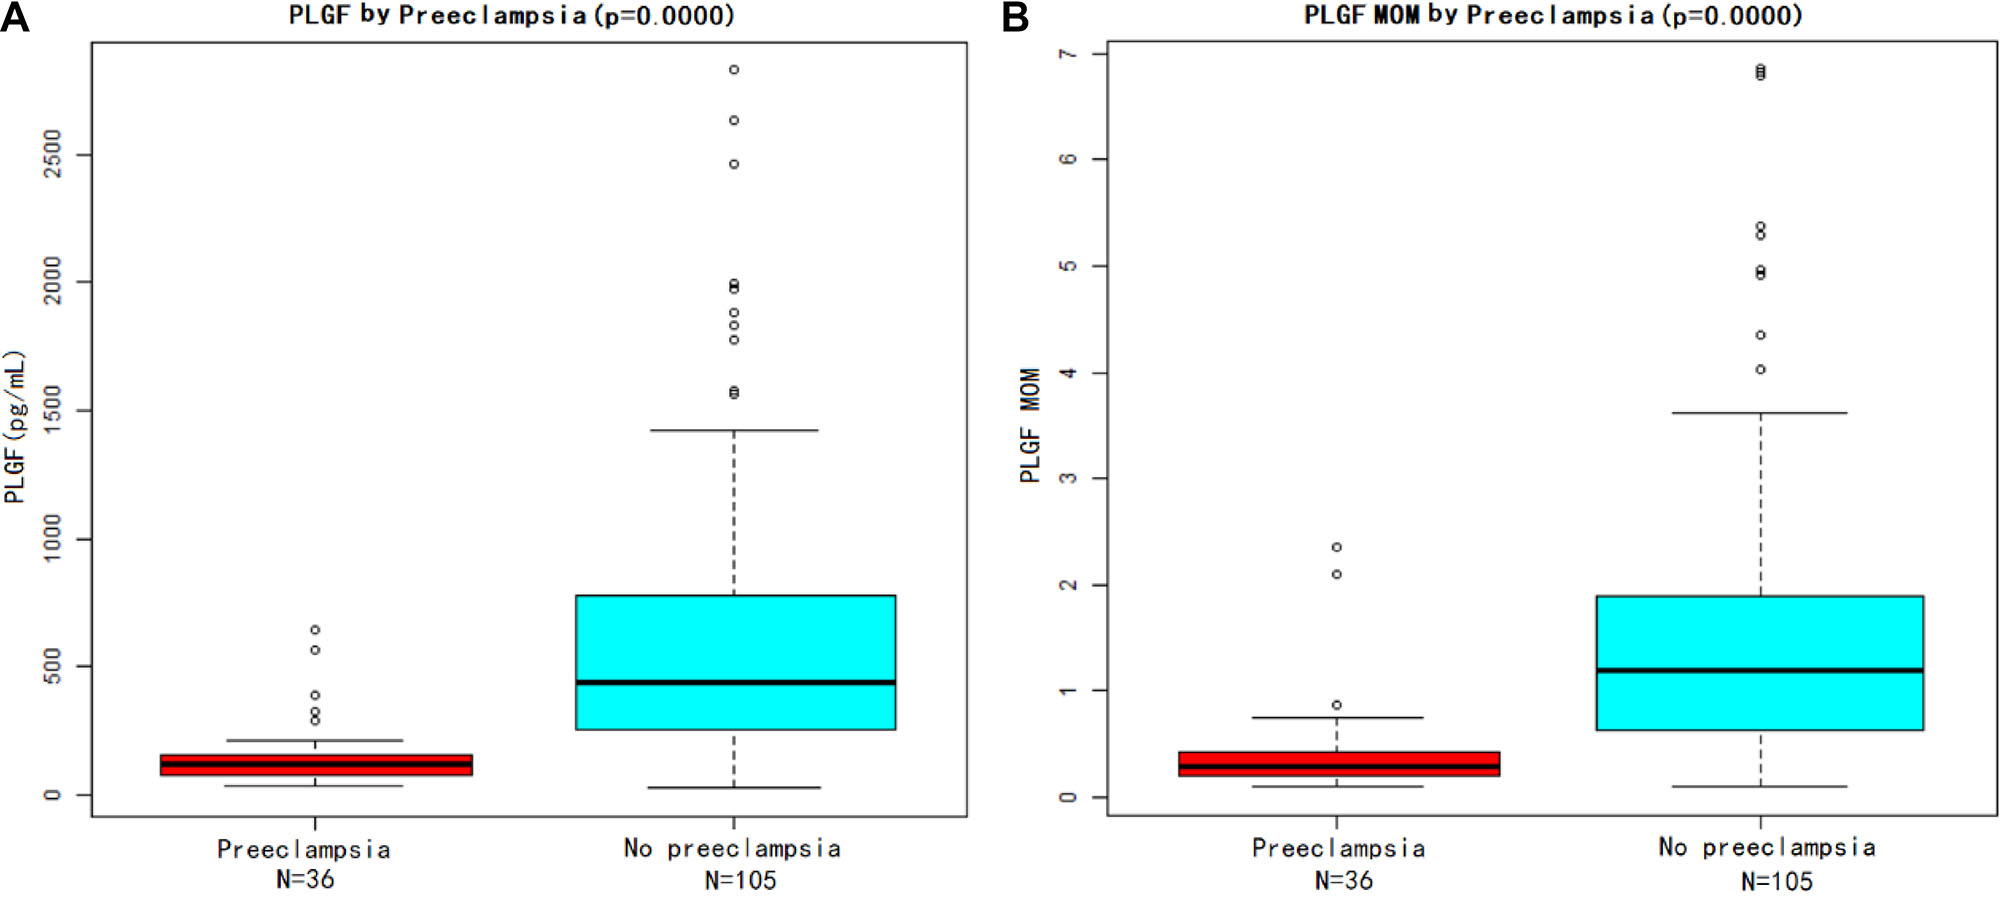
Placental growth factor (PlGF) value and PlGF multiple of the median (MoM) in women with preeclampsia and without preeclampsia. (A) Shows the PlGF level and (B) shows the PlGF MoM. The bottom edge and the top edge of each box represents the minimum value and the 90 % percentile, respectively. The band within the box represents the median value.
The performance of placental growth factor in twin pregnancies to predict preeclampsia
We further preformed the ROC analysis for PlGF and PlGF MoM. The PlGF and PlGF MoM showed good performance in diagnosis of preeclampsia. No significant difference in the effect of PlGF (AUC, 0.863 [0.796–0.931]; sensitivity, 86.1 % [74.8–97.4 %]; specificity, 80 % [72.3–87.7 %]) and PlGF MOM (AUC, 0.865 [0.794–0.936]; sensitivity, 83.3 % [74.1–97.3 %]; specificity, 81.0 % [73.4–88.5 %]) was observed in the prediction of preeclampsia (Table 2). The optimal cutoff value for preeclampsia predicting was 215 pg/mL for PlGF or 0.564 for PlGF MoM (Figure 4).
The performance of placental growth factor (PlGF) and PlGF multiple of median (MoM) in predicting preeclampsia.
| Method | Risk cutoff | AUC | Specificity | Sensitivity | Accuracy |
|---|---|---|---|---|---|
| PlGF, pg/mL | 215.0 | 0.863 | 0.800 | 0.861 | 0.816 |
| PlGF MOM | 0.564 | 0.865 | 0.810 | 0.833 | 0.816 |
-
AUC, area under receiver operating curve.
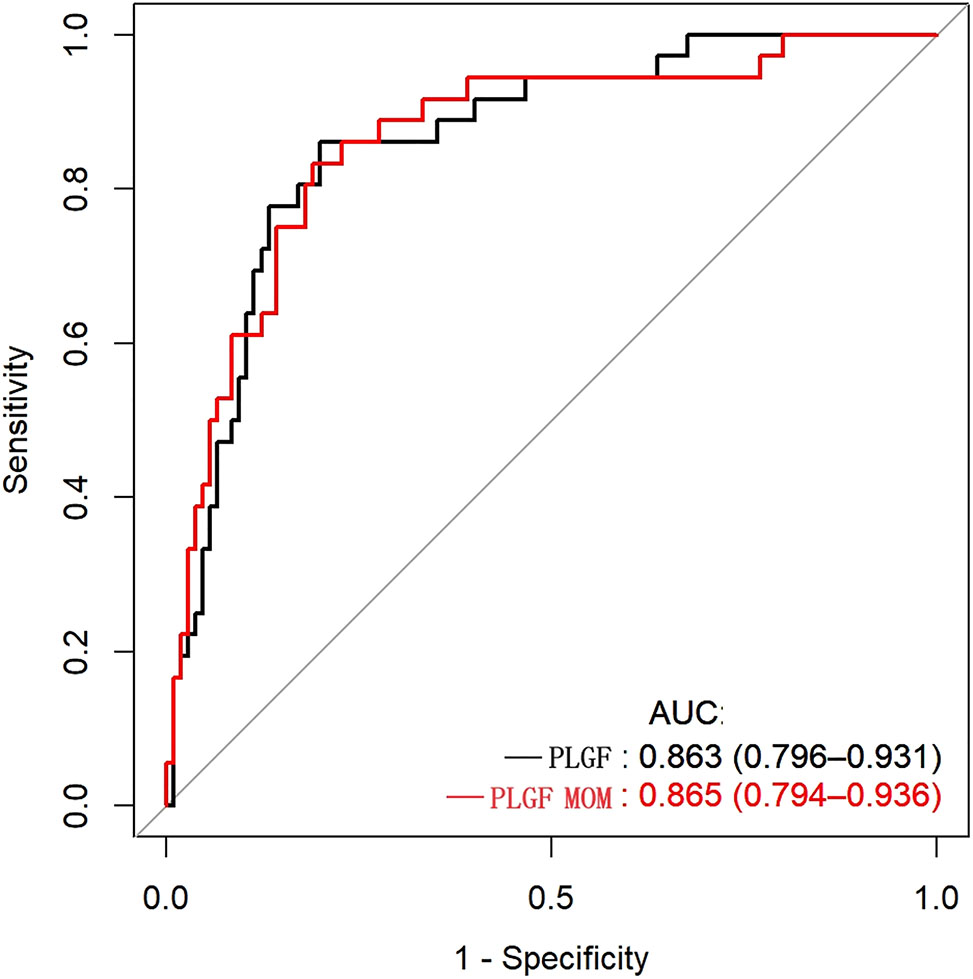
Predictive performance of placental growth factor (PlGF) value and PlGF multiple of the median (MoM) in predicting preeclampsia receiver-operating characteristic curve(ROC) analysis of PlGF and PlGF MoM as a predictor of preeclampsia. Area under receiver operating curve (AUC) denotes area under the curve.
We also compared the prediction performance for preeclampsia using a cutoff value of 215 pg/mL with using PlGF percentiles at different gestation. As shown in Table 3, the cutoff of the 15th percentile had a good predictive performance (66.7 % sensitivity, 90.5 % specificity, 84.4 % accuracy) but not superior to the performance of the cutoff value of 215 pg/mL.
The performance of placental growth factor (PlGF) and PlGF percentile at different gestational intervals in predicting preeclampsia.
| Method | Risk cutoff | Specificity | Sensitivity | Accuracy |
|---|---|---|---|---|
| PlGF, pg/mL | 215.0 | 0.800 | 0.861 | 0.816 |
| PlGF percentile | 5th | 0.971 | 0.306 | 0.801 |
| 10th | 0.933 | 0.444 | 0.809 | |
| 15th | 0.905 | 0.667 | 0.844 | |
| 20th | 0.866 | 0.694 | 0.823 | |
| 25th | 0.838 | 0.722 | 0.809 |
We further try to evaluate the predictive performance of PlGF and PlGF MoM for the short-term occurring of preeclampsia after recruitment. Results showed that PlGF cutoff of 215 pg/mL and 0.564 MoM had a similar high accuracy in determine preeclampsia. The sensitivity of PlGF for predicting preeclampsia within 1 week, 2 weeks, and 4 weeks was 100 % [51.7 %, 100.0 %], 100 % [62.9 %, 100.0 %], and 93.8 % [67.6 %, 99.7 %], respectively, and the negative predictive values were 100 % [94.8 %, 100 %], 100 % [95.0 %, 100 %], and 98.9 % [93.0 %, 99.9 %], respectively (Figure 5 and Table 4). The sensitivity of PlGF MoM for predicting preeclampsia within 1 week, 2 weeks, and 4 weeks was 100 % [51.7 %, 100.0 %], 100 % [62.9 %, 100.0 %], and 87.5 % [60.4 %, 97.8 %], respectively, and the negative predictive values were 100 % [95.0 %, 100 %], 100 % [95.0 %, 100 %], and 97.8 % [91.5 %, 99.6 %], respectively (Figure 5 and Table 4). No significantly difference between the performance of PlGF and PlGF MoM.
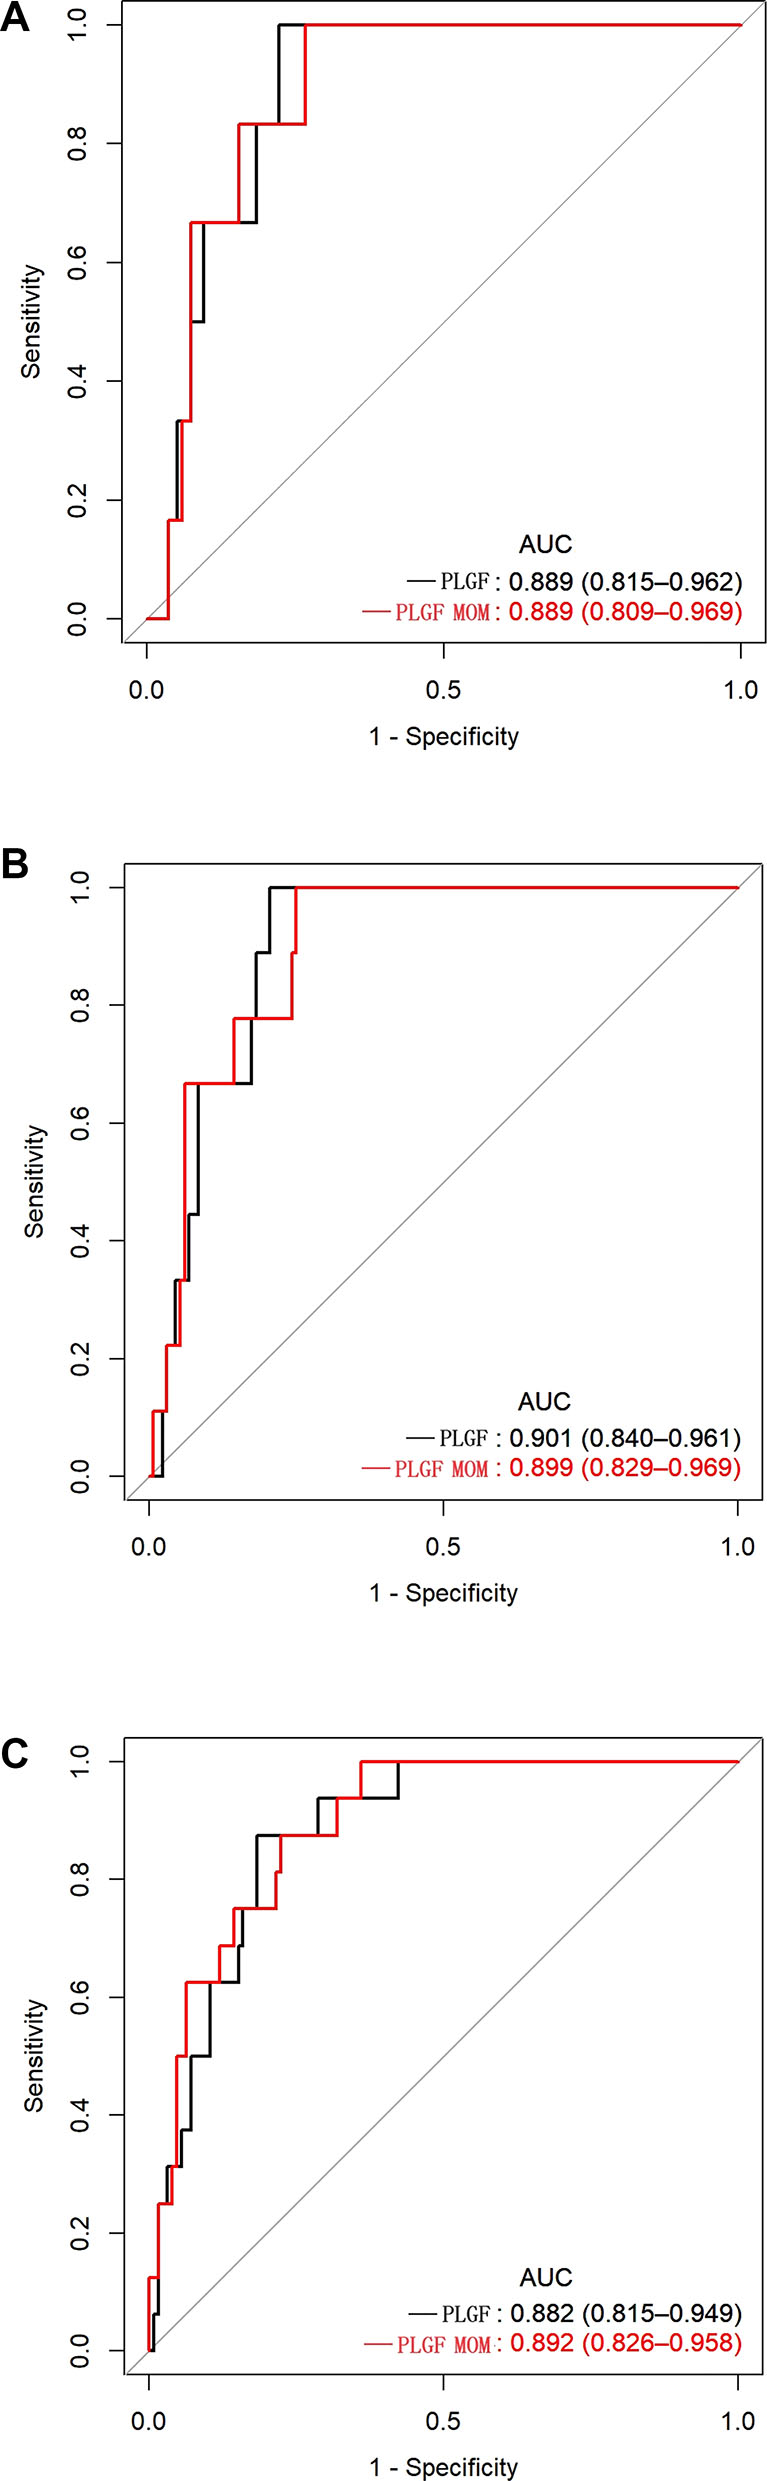
Predictive performance of placental growth factor (PlGF) value and PlGF multiple of the median(MoM) in predicting the short-term occurring of preeclampsia. Receiver-operating characteristic curve (ROC) analysis of PlGF and PlGF MoM as a predictor of preeclampsia within 1 week (A), 2 weeks (B) and 4weeks (C). Area under receiver operating curve (AUC) denotes area under the curve.
The predictive performance of placental growth factor (PlGF) and PlGF multiple of median (MoM) for the short-term occurring of preeclampsia of twin pregnancies with suspected preeclampsia.
| Test cut-off | Sensitivity (95 % CI) | Specificity (95 % CI) | PPV (95 % CI) | NPV (95 % CI) |
|---|---|---|---|---|
| Within 1 week of PlGF testing | ||||
| 215 pg/mL | 100.0 % (51.7 %, 100.0 %) | 65.9 % (57.2 %, 73.7 %) | 11.5 % (4.8 %, 24.1 %) | 100.0 % (94.8 %, 100 %) |
| 0.564 MoM | 100.0 % (51.7 %, 100.0 %) | 67.4 % (58.7 %, 75.1 %) | 12.0 % (5.0 %, 25.0 %) | 100.0 % (95.0 %, 100.0 %) |
| Within 2 weeks of PlGF testing | ||||
| 215 pg/mL | 100.0 % (62.9 %, 100.0 %) | 67.4 % (58.6 %, 75.2 %) | 17.3 % (8.7 %, 30.8 %) | 100 % (95.0 %, 100 %) |
| 0.564 MoM | 100.0 % (62.9 %, 100.0 %) | 68.9 % (60.2 %, 76.5 %) | 18.0 % (9.0 %, 31.9 %) | 100.0 % (95.0 %, 100.0 %) |
| Within 4 weeks of PlGF testing | ||||
| 215 pg/mL | 93.8 % (67.6 %, 99.7 %) | 70.4 % (61.5 %, 78.1 %) | 28.8 % (17.5 %, 43.2 %) | 98.9 % (93.0 %, 99.9 %) |
| 0.564 MoM | 87.5 % (60.4 %, 97.8 %) | 71.2 % (62.3 %, 78.8 %) | 28 % (16.7 %, 42.7 %) | 97.8 % (91.5 %, 99.6 %) |
Given the very wide range of gestational age at recruitment, we divided the enrolled women into two groups, women enrolled at less than 32 weeks of gestation and ≥32 weeks of gestation, and evaluated the predictive performance of PLGF cut-off value of 215 pg/mL for preeclampsia in the two groups, respectively. Due to there were no preeclampsia occured within 1 week of PlGF testing in women enrolled at less than 32 weeks of gestation, we only evaluated the PlGF performance for predicting preeclampsia within 2 weeks, and 4 weeks in this group. In women enrolled at less than 32 weeks of gestation, the sensitivity of PlGF for predicting preeclampsia in within 2 weeks, and 4 weeks was 100 % [5.5 %, 100 %] and 100 % [31 %, 100 %], respectively; the specificity was 70.8 % [60.5 %, 79.4 %] and 72.3 % [62.0 %, 80.8 %], respectively; the positive predictive value was 0 % [0 %, 14.6 %] and 10.3 % [2.7 %, 28.5 %], respectively; the negative predictive value was 100 % [85.4 %, 100 %] and 100 % [93.3 %, 100 %], respectively (Figure 6 and Table 5). In women enrolled at≥32 weeks of gestation, the sensitivity of PlGF for predicting preeclampsia in within 1week, 2 weeks, and 4 weeks was 100 % [51.7 %, 100.0 %], 100 % [59.8 %, 100 %] and 92.3 % [62.1 %, 99.6 %], respectively; the specificity was 55.3 % [38.5 %, 71.0 %], 58.3 % [40.9 %, 70.4 %] and 64.5 % [45.4 %, 80.2 %], respectively; the positive predictive value was 26.1 % [11.1 %, 48.7 %], 34.8 % [17.2 %, 57.2 %] and 52.2 % [17.2 %, 57.2 %], respectively; the negative predictive value was 100 % [80.8 %, 100 %], 100 % [80.8 %, 100 %] and 95.2 % [74.1 %, 99.8 %], respectively (Figure 7 and Table 6).
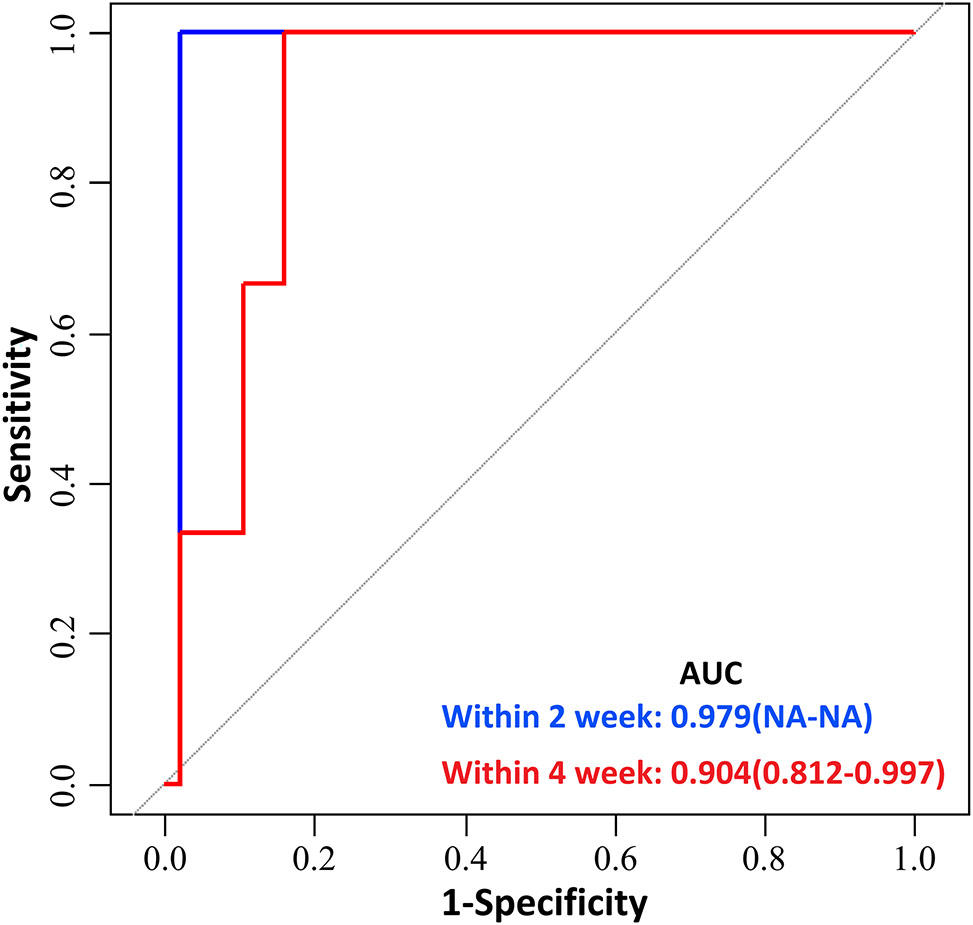
Predictive performance of placental growth factor (PlGF) value in predicting the short-term occurring of preeclampsia between 24 weeks 0 days and 31 weeks 6 days. Receiver-operating characteristic curve (ROC) analysis of PlGF as a predictor of preeclampsia within 2 and 4 weeks between 24 weeks 0 days and 31 weeks 6days. Area under receiver operating curve (AUC) denotes area under the curve.
The predictive performance of placental growth factor (PlGF) for the short-term occurring of preeclampsia of twin pregnancies with suspected preeclampsia in women enrolled between 24 weeks 0 days and 31 weeks 6 days.
| Test cut-off | Sensitivity (95 % CI) | Specificity (95 % CI) | PPV (95 % CI) | NPV (95 % CI) |
|---|---|---|---|---|
| Within 2 weeks of PlGF testing | ||||
| 215 pg/mL | 100 % (5.5 %, 100 %) | 70.8 % (60.5 %, 79.4 %) | 0 % (0 %, 14.6 %) | 100 % (85.4 %, 100 %) |
| Within 4 weeks of PlGF testing | ||||
| 215 pg/mL | 100 % (31.0 %, 100 %) | 72.3 % (62.0 %, 80.8 %) | 10.3 % (2.7 %, 28.5 %) | 100 % (93.3 %, 100 %) |
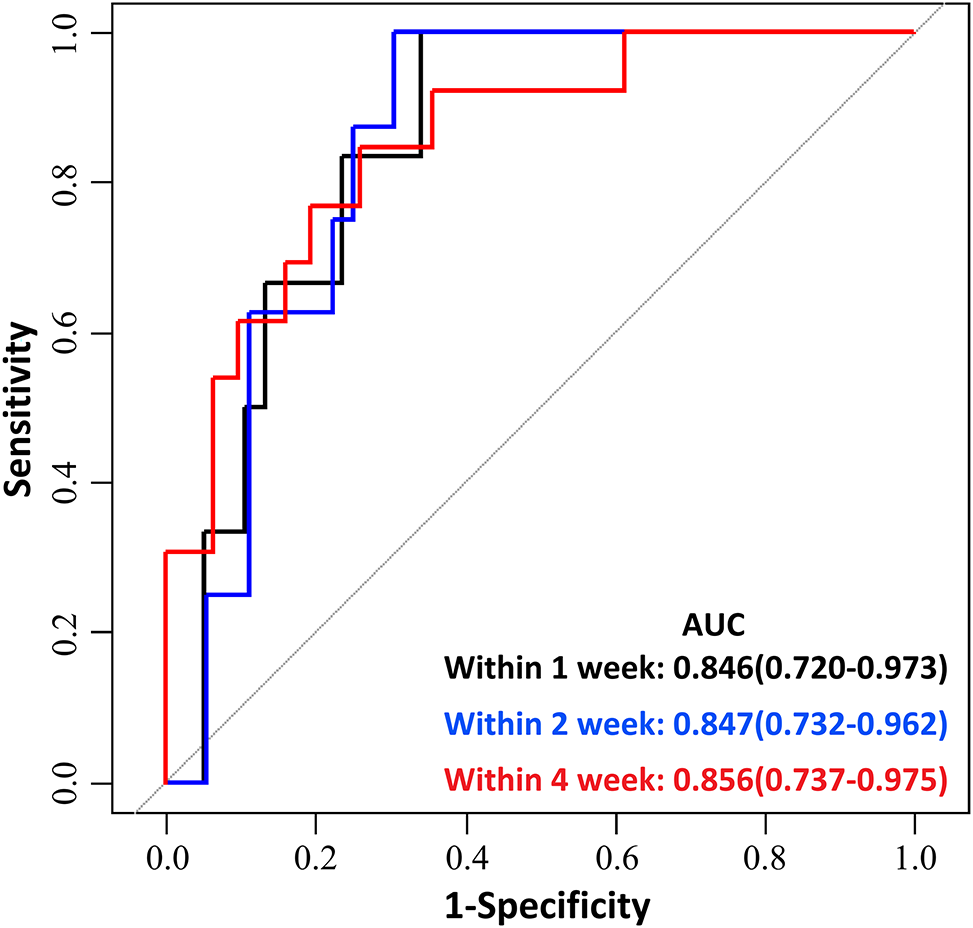
Predictive performance of placental growth factor (PlGF) value in predicting the short-term occurring of preeclampsia between 32 weeks 0 days and 36 weeks 6 days gestation. Receiver-operating characteristic curve (ROC) analysis of PlGF as a predictor of preeclampsia within 1 week, 2 and 4weeks between 32 weeks 0 days and 36 weeks 6 days gestation. Area under receiver operating curve (AUC) denotes area under the curve.
The predictive performance of Placental growth factor for the short-term occurring of preeclampsia of twin pregnancies with suspected preeclampsia in women enrolled between 32 weeks 0 days–36 weeks 6 days gestation.
| Test cut-off | Sensitivity (95 % CI) | Specificity (95 % CI) | PPV (95 % CI) | NPV (95 % CI) |
|---|---|---|---|---|
| Within 1 week of PlGF testing | ||||
| 215 pg/mL | 100 % (51.7 %, 100 %) | 55.3 % (38.5 %, 71.0 %) | 26.1 % (11.1 %, 48.7 %) | 100 % (80.8 %, 100 %) |
| Within 2 weeks of PlGF testing | ||||
| 215 pg/mL | 100 % (59.8 %, 100 %) | 58.3 % (40.9 %, 70.4 %) | 34.8 % (17.2 %, 57.2 %) | 100 % (80.8 %, 100 %) |
| Within 4 weeks of PlGF testing | ||||
| 215 pg/mL | 92.3 % (62.1 %, 99.6 %) | 64.5 % (45.4 %, 80.2 %) | 52.2 % (36.9 %, 67.3 %) | 95.2 % (74.1 %, 99.8 %) |
Mean arterial pressure slightly increase the predictive performance for preeclampsia
Given that blood pressure was measured by all participants, and the MAP was considered as a critical marker for predicting preeclampsia [13], whether adding MAP would improve the performance remained unclear. The result showed that MAP slightly increase the predictive performance for preeclampsia by PlGF (AUC 0.891 vs. AUC 0.863, Figure 8). The optimal calculation model of PlGF plus MAP was presented as follows: YPlGF+MAP=exp(−7.91318 + 0.07924*MAP −0.00789*PlGF).
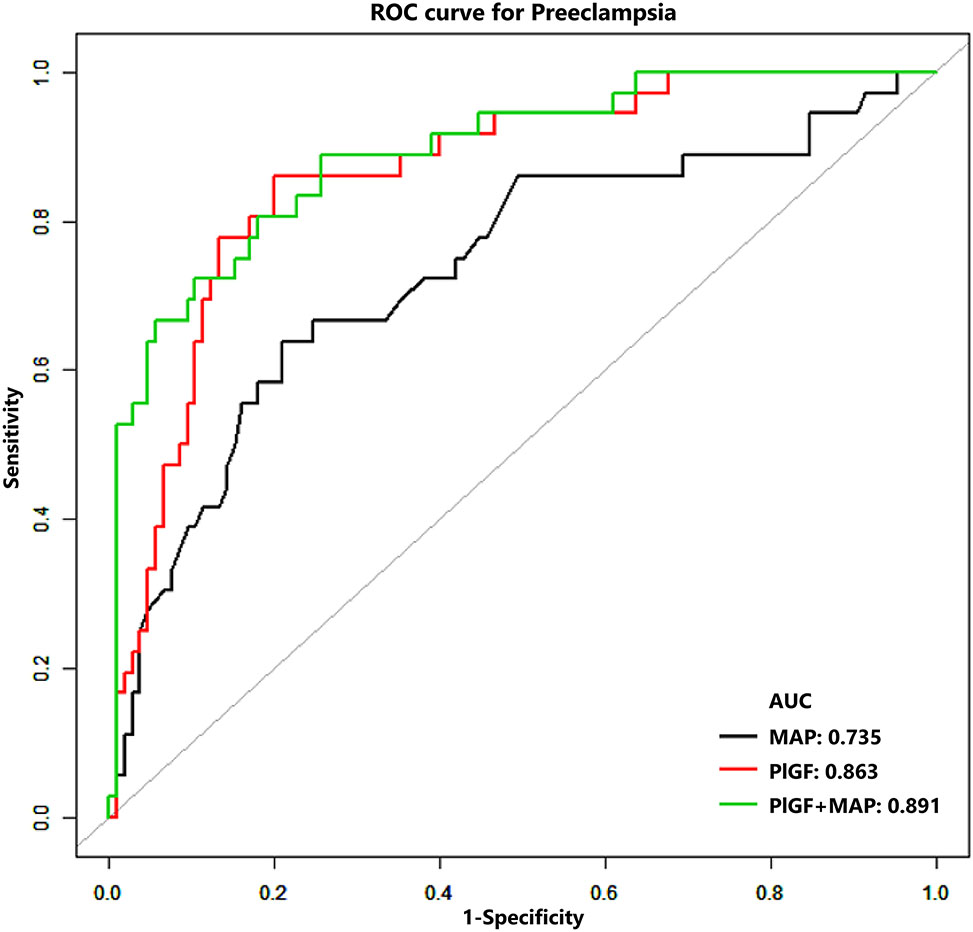
Predictive performance of placental growth factor (PlGF) value and PlGF plus mean arterial pressure (MAP) in predicting preeclampsia green line indicate the performance of PlGF plus MAP (AUC=0.891), which is slightly better than the performance of PlGF only (red line) (AUC=0.863). MAP only performed worse in predicting preeclampsia (AUC=0.735).
Discussion
Accurate prenatal prediction and recognition of preeclampsia are critical for deciding suitable management strategies. However, although antiangiogenic and angiogenic factors have been demonstrated to be good biomarkers for predicting preeclampsia and is increasingly being used in clinical practice in singleton pregnancies, the use of antiangiogenic and angiogenic factors in twin pregnancies is still need to be studied.
In this study, the predictive performance of an angiogenic factor, PlGF, for preeclampsia in twin pregnancies was studied and the following two important clinical observations were made:(1) a cutoff of 215 pg/mL at 24–36 weeks of gestation in an ROC analysis was a useful predictor for preeclampsia in women with twin pregnancies suspected with preeclampsia and (2) MAP can slightly increase the predictive performance of PlGF.
To the best of our knowledge, this study is the first to determine the optimal cutoff PlGF value for predicting impending preeclampsia in women within twin pregnancies and to analysis its performance within 1,2 and 4 weeks of recruitment. The PlGF level of >215 pg/mL had a high negative predictive value (100 %) for preeclampsia within 2 weeks (14 days) of PlGF measurement, which is higher than the negative predictive value (98.3 %) in women with singleton pregnancies suspected of having preeclampsia and have a PlGF level of >100 pg/mL within 14 days of PlGF measurement [8].
Several publication have shown that PlGF level is lower in twin pregnancies Who developed preeclampsia than pregnancies unaffected preeclampsia, which is consistent with our findings [14], 15]. However, a clear cut-off value for PlGF in predicting preeclampsia for twin pregnancies was not determined in previous studies.
Since the sFlt-1/PlGF ratio and PlGF are often used to compare their performance in predicting preeclampsia in singleton pregnancies, we sought to compare the performance of sFlt-1/PlGF ratio in publicated twin pregnancies studies and our PlGF study. Shinohara et al. have demonstrated in their retrospective study that a cutoff sFlt-1/PlGF ratio of ≤22.2 is potentially indicative of preeclampsia absence within 4 weeks in twin pregnancies with a negative predictive value of 100 %, which is a little better than the cutoff PlGF value of >215 pg/mL in our study with a negative predictive value of 98.1 %. However, sFlt-1/PlGF ratio of ≤22.2 is only applicable for 28–32 gestational weeks [16].
We also found that MAP can slightly increase the predictive performance for preeclampsia during 24–36 weeks gestation in twin pregnancies, which is reasonable. Because MAP was positively associated with the development of preeclampsia and was used to predict preeclampsia in the first, second and third trimester [17], [18], [19].
Our study had several limitations. First, it might be difficult to extrapolate our results to the general population because of the relatively small sample size. The single-center design of this study also limits the application of the results to larger populations. Therefore, additional large-scale, multi-center studies are required. Second, randomized trials are necessary to determine if the cutoff, when used in clinical practice as opposed to the current standard of care, could reduce hospitalizations and costs, with similar or better outcomes in regard to fetal and maternal adverse outcomes. In addition, the PlGF concentrations were measured using Aucheer immunoassays, and the optimal cutoff for the PlGF may differ when other assays are used.
Conclusions
Our data showed that effective screening for preeclampsia can be provided by the PlGF assay in twin pregnancies with clinically suspected preeclampsia. A cutoff value of 215 pg/mL for PlGF, assessed using Aucheer PlGF immunoassays, is identified as a useful tool to exclude the development of preeclampsia within 4 weeks of measurement.
-
Research ethics: Research involving human subjects complied with all relevant national regulations, institutional policies and is in accordance with the tenets of the Helsinki Declaration (as revised in 2013), and has been approved by the Ethical Committee of The Hospital of Maternal and Health of Tangshan, China (approval number: 2022-011-01).
-
Informed consent: Informed consent was obtained from all individuals included in this study.
-
Author contributions: All authors have accepted responsibility for the entire content of this manuscript and approved its submission.
-
Use of Large Language Models, AI and Machine Learning Tools: None declared.
-
Conflict of interest: The authors state no conflict of interest.
-
Research funding: None declared.
-
Data availability: Not applicable.
References
1. Ananth, CV, Keyes, KM, Wapner, RJ. Pre-eclampsia rates in the United States, 1980–2010: age-period-cohort analysis. BMJ 2013;347:f6564. https://doi.org/10.1136/bmj.f6564.Search in Google Scholar PubMed PubMed Central
2. Duley, L. The global impact of pre-eclampsia and eclampsia. Semin Perinatol 2009;33:130. https://doi.org/10.1053/j.semperi.2009.02.010.Search in Google Scholar PubMed
3. Magee, LA, Brown, MA, Hall, DR, Gupte, S, Hennessy, A, Karumanchi, SA, et al.. The 2021 International society for the study of hypertension in pregnancyclassification, diagnosis & management recommendations for international practice. Pregnancy Hypertens 2022;27:148. https://doi.org/10.1016/j.preghy.2021.09.008.Search in Google Scholar PubMed
4. Wiles, K, Chappell, LC, Lightstone, L, Bramham, K. Updates in diagnosis and management of preeclampsia in women with CKD. Clin J Am Soc Nephrol 2020;15:1371–80. https://doi.org/10.2215/cjn.15121219.Search in Google Scholar PubMed PubMed Central
5. Torry, DS, Wang, HS, Wang, TH, Caudle, MR, Torry, RJ. Preeclampsia is associated with reduced serum levels of placenta growth factor. Am J Obstet Gynecol 1998;179:1539–44. https://doi.org/10.1016/s0002-9378(98)70021-3.Search in Google Scholar PubMed
6. Levine, RJ, Maynard, SE, Qian, C, Lim, KH, England, LJ, Schisterman, EF, et al.. Circulating angiogenic factors and the risk of preeclampsia. N Engl J Med 2004;350:672–83. https://doi.org/10.1056/nejmoa031884.Search in Google Scholar
7. Chappell, LC, Duckworth, S, Seed, PT, Griffin, M, Myers, J, Mackillop, L, et al.. Diagnostic accuracy of placental growth factor in women with suspected preeclampsia: a prospective multicenter study. Circulation 2013;128:2121–31. https://doi.org/10.1161/circulationaha.113.003215.Search in Google Scholar PubMed
8. Duhig, KE, Myers, J, Seed, PT, Sparkers, J, Lowe, J, Hunter, RM, et al.. Placental growth factor testing to assess women with suspectedpre-eclampsia: a multicentre, pragmatic, stepped-wedge cluster-randomised controlled trial. Lancet 2019;393:1807–18. https://doi.org/10.1016/s0140-6736(18)33212-4.Search in Google Scholar PubMed PubMed Central
9. Duhig, KE, Webster, LM, Sharp, A, Gill, C, Seed, PT, Shennan, AH, et al.. Diagnostic accuracy of repeat placental growth factor measurements in women with suspected preeclampsia: a case series study. Acta Obstet Gynecol Scand 2020;99:994–1002. https://doi.org/10.1111/aogs.13818.Search in Google Scholar PubMed PubMed Central
10. Kaaja, R. Predictors and risk factors of pre-eclampsia. Minerva Ginecol 2008;60:421–9.Search in Google Scholar
11. Laine, K, Murzakanova, G, Sole, KB, Pay, AD, Heradstveit, S, Raisanen, S. Prevalence and risk of pre-eclampsia and gestational hypertension in twin pregnancies: a population-based register study. BMJ Open 2019;9:e029908. https://doi.org/10.1136/bmjopen-2019-029908.Search in Google Scholar PubMed PubMed Central
12. Brown, MA, Magee, LA, Kenny, LC, Karumanchi, SA, McCarthy, FP, Saito, S, International Society for the Study of Hypertension in Pregnancy (ISSHP), et al.. The hypertensive disorders of pregnancy: ISSHP classification, diagnosis & management recommendations for international practice. Pregnancy Hypertens 2018;13:291–310. https://doi.org/10.1016/j.preghy.2018.05.004.Search in Google Scholar PubMed
13. Tan, MY, Syngelaki, A, Poon, LC, Rolnik, DL, O’Gorman, N, Delgado, JL, et al.. Screening for pre-eclampsia by maternal factors and biomarkers at 11–13 weeks’ gestation. Ultrasound Obstet Gynecol 2018;52:186–95. https://doi.org/10.1002/uog.19112.Search in Google Scholar PubMed
14. Rana, S, Hacker, MR, Modest, AM, Salahuddin, S, Lim, KH, Verlohren, S, et al.. Circulating angiogenic factors and risk of adverse maternal and perinatal outcomes in twin pregnancies with suspected pre-eclampsia. Hypertension 2012;60:451–8. https://doi.org/10.1161/hypertensionaha.112.195065.Search in Google Scholar PubMed PubMed Central
15. Dröge, L, Herraìz, I, Zeisler, H, Schlembach, D, Stepan, H, Küssel, L, et al.. Maternal serum sFLT1/PlGF ratio in twin pregnancies with and without pre-eclampsia in comparison with singleton pregnancies. Ultrasound Obs. Gynecol. 2015;45:286–93. https://doi.org/10.1002/uog.14760.Search in Google Scholar PubMed
16. Shinohara, S, Sunami, R, Kasai, M, Yasuda, G, Uchida, Y. Predictive value of the sFLT1/PlGF ratio for pre-eclampsia in twin pregnancies: a retrospective study. Hypertens Pregnancy 2021;40:330–5. https://doi.org/10.1080/10641955.2021.1987455.Search in Google Scholar PubMed
17. O’Gorman, N, Wright, D, Poon, LC, Rolnik, DL, Syngelaki, A, de Alvarado, M, et al.. Multicenter screening for preeclampsia by maternal factors and biomarkers at 11-13 weeks’gestation: comparison to NICE guidelines and ACOG recommendations. Ultrasound Obstet Gynecol 2017;49:756–60.10.1002/uog.17455Search in Google Scholar PubMed
18. Gallo, DM, Wright, D, Casanova, C, Campanero, M, Nicolaides, KH. Competing risks model in screening for preeclampsia by maternal factors and biomarkers at 19-24 weeks’ gestation. Am J Obstet Gynecol 2016;214:619.e1–e17. https://doi.org/10.1016/j.ajog.2015.11.016.Search in Google Scholar PubMed
19. Tsiakkas, A, Saiid, Y, Wright, A, Wright, D, Nicolaides, KH. Competing risks model in screening for preeclampsia by maternal factors and biomarkers at 30-34 weeks’ gestation. Am J Obstet Gynecol 2016;215:87.e1–e17. https://doi.org/10.1016/j.ajog.2016.02.016.Search in Google Scholar PubMed
© 2025 the author(s), published by De Gruyter, Berlin/Boston
This work is licensed under the Creative Commons Attribution 4.0 International License.
Articles in the same Issue
- Frontmatter
- Review
- Sex differences in lung function of adolescents or young adults born prematurely or of very low birth weight: a systematic review
- Original Articles – Obstetrics
- Shifts in peak month of births and socio-economic factors: a study of divided and reunified Germany 1950–2022
- The predictive role of serial transperineal sonography during the first stage of labor for cesarean section
- Gestational weight gain and obstetric outcomes in women with obesity in an inner-city population
- Placental growth factor as a predictive marker of preeclampsia in twin pregnancy
- Learning curve for the perinatal outcomes of radiofrequency ablation for selective fetal reduction: a single-center, 10-year experience from 2013 to 2023
- External validation of a non-invasive vaginal tool to assess the risk of intra-amniotic inflammation in pregnant women with preterm labor and intact membranes
- Placental fetal vascular malperfusion in maternal diabetes mellitus
- The importance of the cerebro-placental ratio at term for predicting adverse perinatal outcomes in appropriate for gestational age fetuses
- Comparing achievability and reproducibility of pulsed wave Doppler and tissue Doppler myocardial performance index and spatiotemporal image correlation annular plane systolic excursion in the cardiac function assessment of normal pregnancies
- Characteristics of the pregnancy and labour course in women who underwent COVID-19 during pregnancy
- Original Articles – Fetus
- Sonographic visualization and measurement of the fetal optic chiasm and optic tract and association with the cavum septum pellucidum
- The association among fetal head position, fetal head rotation and descent during the progress of labor: a clinical study of an ultrasound-based longitudinal cohort study in nulliparous women
- Fetal hypoplastic left heart syndrome: key factors shaping prognosis
- The value of ultrasound spectra of middle cerebral artery and umbilical artery blood flow in adverse pregnancy outcomes
- Original Articles – Neonates
- A family-centric, comprehensive nurse-led home oxygen programme for neonatal chronic lung disease: home oxygen policy evaluation (HOPE) study
- Effects of a respiratory function indicator light on visual attention and ventilation quality during neonatal resuscitation: a randomised controlled crossover simulation trial
- Short Communication
- Incidence and awareness of dysphoric milk ejection reflex (DMER)