Selection of the optimal solution of acoustic screens in a graphical interpretation of biplot and radar charts method
-
Ryszard Dachowski


Abstract
The choice of an optimal solution among various available technological and material undertakings often becomes a problem of the engineering community. A multi-criteria technical and economic analysis is used in order to facilitate decision making. The objective of this article is to present biplot methods and radar charts as a possibility of graphic presentation of research results by obtaining an optimal solution on the example of an analysis of technological and material undertakings of acoustic screens. The research consisted in identifying technological and material solutions of the selected acoustic screens, and then defining features (criteria) and cases (technological and material solutions). The results were presented in radar charts and biplot-type graphs. The methodology consisted in generating a data matrix, which is then processed, decomposed and finally scaled. The calculations were carried out in the Statistica programme. The carried-out analysis showed that the spider web and biplot methods differ from each other. The biplot graph more precisely describes the solutions, and it presents the correlations between variables and cases.
1 Introduction
The road network development and the dynamic automotive industry development are associated with traffic noise. One of the most effective, fast and economical ways to reduce the noise level associated with car traffic are acoustic screens [4]. The design of acoustic screens is related to the fulfilment of effectiveness conditions, i.e. maximum noise reduction, while maintaining the aesthetics, fitting the screen in the natural landscape and obtaining the desired durability that provides the long-term functioning and undemanding maintenance. The technological and material solution of the acoustic screens should be chosen in a way that ensures appropriate operational effects at low costs [7]. The choice of a specific technological and material solution among the selected types of the acoustic screens requires the analysis of environmental, technological, functional, structural and economic factors. In practice, the decision is made unreasonably, taking into account only investment costs, the result of which is the selection of inefficient solutions and those disturbing the natural landscape. The filling, which determines acoustic insulation, is considered the most important element of the acoustic screen construction [16].
In the classification, in terms of the material, the screens can be divided into:
– metal,
– concrete,
– timber,
– plastic,
– glass ones,
– other.
The group of metal screens includes aluminium and steel covers. Metal cassettes are often used in Poland. The filling of such a panel is made of mineral wool which is covered by a perforated aluminium or steel layer. The acoustic properties of this type of screens are relatively good. Both sound absorbing and reflecting screens are produced. The housing is available in any colour. Perforated screens with large holes allow for growing with climbing plants [6]. The price of metal screens is relatively low, but it should be noted that such panels require maintenance and use of anti-corrosion agents, which entails additional costs [4].
Concrete panels are among the oldest solutions protecting from noise. The technical properties allow for making the load-bearing structure elements and filling of concrete. The panels are usually built from a load-bearing reinforced concrete slab, to which it is possible to fix the noise insulation slabs, e.g. such as sawdust concrete, gravelite-concrete or timber-concrete. The concrete panels have a large mass, thanks to which they perfectly reduce noise. The concrete panels are resistant to the action of weather conditions and they are very durable. The timber-concrete slabs can be permanently dyed in the mass to any colour within the RAL range. The price of the timber-concrete screens is affordable, in addition, it should be taken into account that they do not require maintenance [6, 15, 17].
Mineral wool is used as a filling element of the timber screen. The screens made of wood are environmentally friendly and very well received by local communities. The disadvantage of the timber solution is flammability and additional costs associated with maintenance (impregnation), as well as the possibility of biological corrosion [4]. With proper operation and the use of cyclic impregnation, wood is a durable material. The acoustic insulation of the timber solution is quite good when using climbing plants. The insulation increases on the surface of the screen.
The example of the plastic screen is a polyvinyl chloride (PVC) panel. The PVC screens are filled with mineral wool enclosed with a polyvinyl chloride layer. This type of solution is characterised by good acoustic parameters. A huge disadvantage of PVC panels is their deformability under the influence of sunlight. The polyvinyl chloride screens are very aesthetic [4, 6].
The glass screens include panels made of natural tampered glass and polymethylmethacrylate (PMMA), colloquially called acrylic ones. The glass screens are used in places where the achievement of a transparent acoustic screen is required. The glass screens are glued of one or several slabs, depending on the needs. Additional layers increase acoustic properties, mechanical strength and they are associated with an increase in price. The disadvantage of glass screens is slender resistance to damage. The polymethylmethacrylate slabs are characterised by very good insulating properties with a high light transmission coefficient. These types of screens do not absorb sounds. The polymethylmethacrylate screens are very expensive. They belong to the most expensive solutions available in the market. When selecting the screens made of glass, frequent maintenance should be taken into account [4, 6, 16].
The “green wall” type screens consist of a galvanized frame, a mineral wool filling covered with a green plastic mesh and a steel grid. The steel grid is used in order to enable creepers to climb the construction, improving aesthetics and additionally the noise insulation. The “green wall” is very often used in Polish cities due to the low price and good acoustic insulation. The climate prevailing in Poland is not conducive to the development of creepers. An additional obstacle to the growth of vegetation includes the measures used for de-icing the surface during winter [4, 6].
The variety of available screens justifies the analysis of individual technological and material solutions. The objective of this article is to compare the biplot methods and radar charts as a possibility of graphic presentation of the research results by obtaining an optimal solution on the example of an analysis of the technological and material undertakings of the acoustic screens.
2 Methods
The decision-making process is extremely complicated and difficult. The choice is always accompanied by possible variants. The assessment of the accuracy of choice during the decision-making time is practically impossible. The accuracy and effects of the decision can be assessed from the perspective of time. The indication of proper conduct is inherently associated with a risk [1, 3, 10, 13].
The multi-criteria decision analysis (MCDA) is characterised by the active participation of the decision maker. The decision maker chooses the criteria and assigns weightings to them. The multi-criteria decision analysis is subjective assessment. The multi-criteria decision analysis consists of three stages: structuring the decision-making level, analysing the decision-making problem and the solution implementation [10, 11].
The first stage – the decision level structuring starts with the analysis of the environment of the decision problem. It involves the observation of the surroundings in order to thoroughly know and identify the problem [2, 9]. After conducting the analysis, it is important to formulate a decision problem, that is to determine the decision subject and purpose. Then, the decision variants and components of the possibilities are determined. The last stage of structuring the decision problem is the selection of criteria for assessing individual variants. The variants are usually evaluated on the basis of several criteria or one of them (single-criterion analysis). The criteria should not overlap [12]. The most effective analysis contains 7±2 criteria of a quantitative nature [5].
The next component, that is the analysis of the decision problem, consists of two stages: assessment and selection of a decision-making variant. At this stage, it is important to choose a method that will support the decision-making. When choosing a method, it is crucial to consider the restrictions that may relate to a given method. The methods used in case of multi-criteria decision-making that support the decision-making process are based on the methodology of operational research, which allows to determine a set of acceptable solutions, and then to select an optimal solution from this set. It is carried out on the basis of the assessment of the solutions taken into account, using a set of defined criteria. The selection of an optimal variant follows the synthetic evaluation of the option, to which the partial assessment was assigned [9].
The solution implementation and the assessment of effects constitute the final stage of the decision analysis. The result of the carried-out analysis should be a decision that takes into account the preferences of a decision-making person or persons. The decision-making analysis processes held information with the use of quantitative methods with active human participation [10].
The Compositional Data Analysis method is used for statistical data preparation. It was introduced in 1986 by Aitchison. CDA presents complex data in the form of vectors. The components of vectors are percentages or proportions, the sum of which is contained in a certain whole (100%). The components belong to dependent variables.
The following features are characteristic for a set of component data:
– row of matrices refers to a single solution,
– columns present criteria,
– matrix components are non-negative,
– rows of matrices add up to unity,
– the correlation coefficient between components will change after removing one of the variables [8].
For the graphic interpretation of the CDA method, among others, the spider web and biplot graphs are used.
3 Results
The spider web method allows for selection, if multiple variants are available. The decision is made after selecting the appropriate assessment criteria and assigning the weightings to them. The variables used for the optimal solution selection among the selected types of acoustic screens are:
– DV1 – Durability (durability determined during the exploitation, without the use of additional safeguards),
– DV2 - Performance economy (purchase price with assembly and maintenance costs),
– DV3 - Acoustic insulation (class of acoustic absorption and isolation from airborne sounds according to the norm PN-EN 1793-2:2001),
– DV4 - Required maintenance (use of additional security and cleaning),
– DV5 - Aesthetic values (fitting into the natural landscape).
Specific criteria presented desirable, undesirable and neutral values. The above criteria were assigned weightings, the sum of which was included in the whole (1.00). The higher the weighting, the greater the impact of a given criterion on the final result of the analysis. The durability gained the highest weighting. It was defined as the most important criterion. The aesthetic values obtained the lowest weighting, reaching a minimal impact on the analysis result. The weightings of the criteria were presented in Table 1.
Weights assigned to criteria.
| Number | Symbol | Weight |
|---|---|---|
| 1 | DV1 | 0,30 |
| 2 | DV2 | 0,25 |
| 3 | DV3 | 0,20 |
| 4 | DV4 | 0,15 |
| 5 | DV5 | 0,10 |
The criteria were expressed in medians from 1 to 5. The highest value meant the most favourable solution. the Table 2 presents the ratings together with justification The assessment of each solution was the product of a given weighting and the criterion subjected to the weighting. The results are shown in Table 3
Justification of the assessment.
| DV1 | DV2 | DV3 | DV4 | DV5 | ||||||
|---|---|---|---|---|---|---|---|---|---|---|
| Timber- concrete | The most durable solution, >50 years | 5 | relatively low price | 4 | B3(43 dB), A4 (13 dB) | 5 | maintenance is not required | 5 | Fairly aesthetic solution (the possibility of coloring plates in any | 3 |
| Green wall | Durable solution but exposed to acts of vandalism | 3 | very cheap solution, the cheapest of the analyzed cases | 5 | B3(33 dB), A4 (12 dB) | 4 | required maintenance (partial replacement of the filling and cleaning) | 1 | color) aesthetic solution (boards can grow on climbing plants) | 4 |
| Aluminium | susceptible to corrosion | 2 | very cheap solution, the cheapest of the analyzed cases | 5 | B3(26 dB), A3 (10 dB) | 3 | required maintenance (use of corrosion protection and cleaning) | 1 | Fairly aesthetic solution (the possibility of coloring plates in any color) | 3 |
| Tempered glass | high durability, with increased thickness of the board, durability increases | 4 | the most expensive solution (the price increases with the thickness of the plate) | 1 | B3(33 dB), A4 (12 dB) | 4 | required maintenance (frequent cleaning) | 1 | very aesthetic solution (transparent plates do not curtain the natural landscape) | 5 |
| Timber | without impregnation, not durable (biological corrosion) | 2 | wood is a common material and is relatively cheap. However, the price of cyclic impregnation should be taken into account | 3 | B3(31 dB), A3 (10 dB) | 3 | susceptible to vandalism in the form of graffiti and need to be painted over each time to restore the original look | 3 | Aesthetic solution that fits into the natural landscape | 4 |
Evaluation of solutions including weights.
| Number | Type of acoustic screen | Evaluation of solutions including weights | ||||
|---|---|---|---|---|---|---|
| DV1 | DV2 | DV3 | DV4 | DV5 | ||
| 1 | Composite (timber-concrete) | 1,50 | 1,00 | 1,00 | 0,75 | 0,30 |
| 2 | Green wall | 0,90 | 1,25 | 0,80 | 0,15 | 0,40 |
| 3 | Aluminum | 0,60 | 1,25 | 0,60 | 0,15 | 0,30 |
| 4 | Tempered glass | 1,20 | 0,25 | 0,80 | 0,15 | 0,50 |
| 5 | Timber | 0,60 | 0,75 | 0,60 | 0,45 | 0,40 |
As the technological and material undertakings, the cases, one of each type of the acoustic screens, were chosen:
– timber-concrete screen,
– green wall panel,
– aluminium panel,
– natural tempered glass screen,
– timber panel.
The data presented in Table 3 were normalized and transformed according to the Compositional Data Analysis. Rows of matrices add up to unity. The graphs (Figure 1-5) in the polar axis system show the surface areas of individual technological and material solutions of the acoustic screens: 1-timber-concrete screen, 2-”green
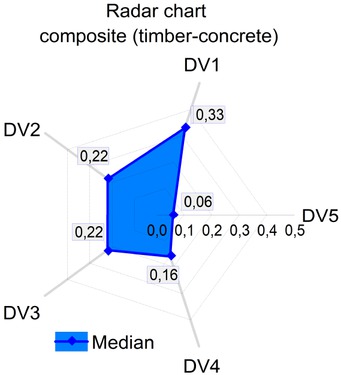
Radar chart for timber-concrete screen. A1 = 0,105
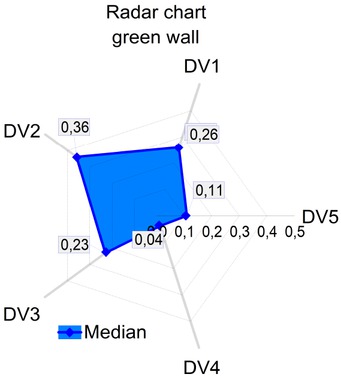
Radar chart for “green wall”. A2 = 0,103
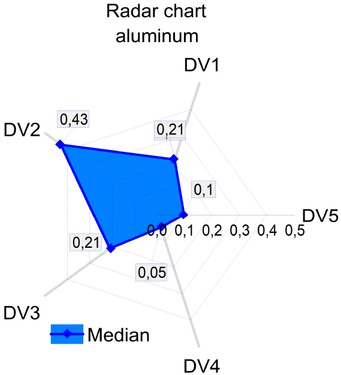
Radar chart for aluminum. A3 = 0,102
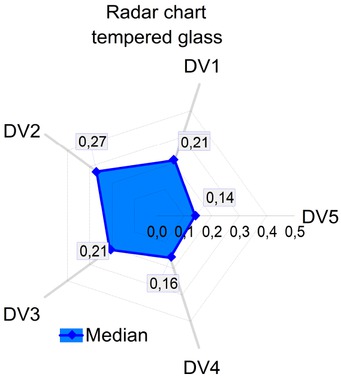
Radar chart for tempered glass. A4 = 0,096
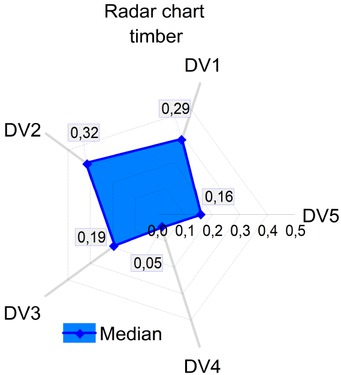
Radar chart for timber. A5 = 0,101
wall”, 3-aluminium panel, 4-tampered glass screen, 5-timber panel.
According to the radar chart (spider web), the optimal solution is a timber-concrete screen. It is not possible to read the significance of the criteria for individual cases from the radar charts. The radar charts present the results for individual cases on separate charts, making it impossible to compare them in one figure.
In the radar charts, it is not possible to show relationship of variables and cases.
The multidimensional analysis tools, which include the biplot graphs, allow to determine the relationship between
Surface areas of radar charts.
| Number | Type of acoustic screen | Area |
|---|---|---|
| 1 | Timber-concrete | 0,105 |
| 2 | Green wall | 0,103 |
| 3 | Aluminum | 0,102 |
| 4 | Tempered glass | 0,096 |
| 5 | Timber | 0,101 |
cases (types of acoustic screens) and characteristics (criteria). The biplot graphically presents the elements of rows and columns in one graph, which facilitates the analysis of correlations [13].
In the biplot, the criteria assigned in the spider web method were used. The partial criteria were presented on a scale from 1.00 to 5.00. The value of 5.00 most accurately determines the compliance with the criterion. Data transformed in accordance with the CDA were used.
The main coordinates of the biplot contain nearly 89% of the total variance of five active variables involved in the analysis. In order to present the criteria (variables) and cases (technological and material solutions), 2W graphs were made (Figures 6 and 7). The graphs were then superimposed on each other, facilitating the analysis. The common graph (Figure 8) contains variables (sections) and points presenting the technological and material solutions.
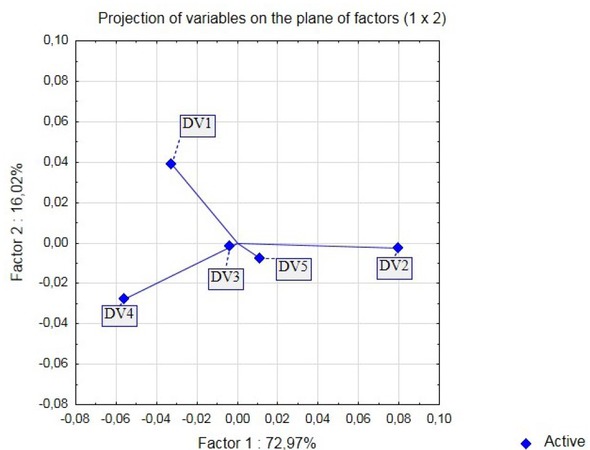
Chart 2W factors for criteria.
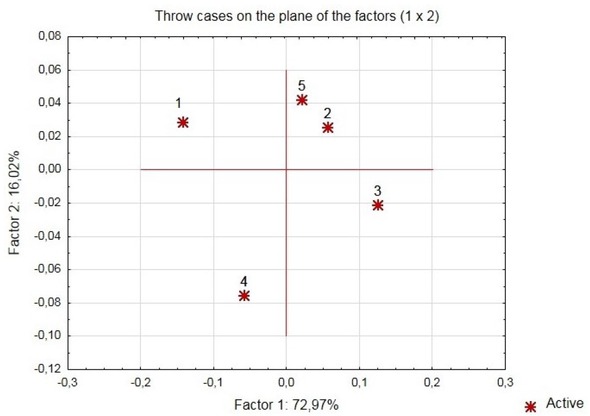
Graph 2W of coordinates of technological and material projects.
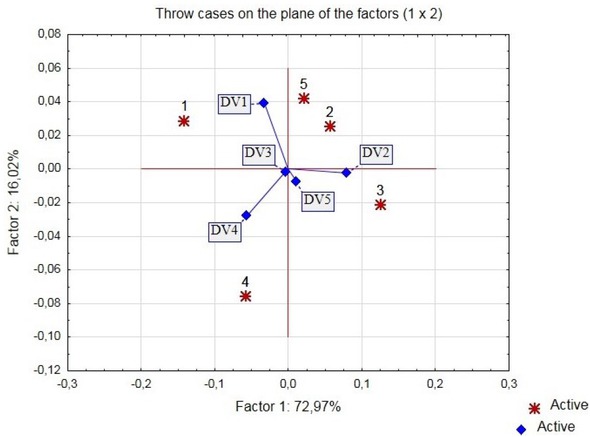
Common coordinate diagram of criteria factors and technology and material factors.
The biplot interpretation indicates relationship between aesthetic values (DV5) and performance economy (DV2), as well as between acoustic insulation (DV3) and required maintenance (DV4). The other criteria are separated from each other, they are not connected with each other. The feature – DV2 (performance economy), which explains almost 73% of the total variance, is tilted to the
Symbols of acoustic screens on the biplot map.
| Symbol | Type of acoustic screen |
|---|---|
| 1 | Timber-concrete |
| 2 | Green wall |
| 3 | Aluminum |
| 4 | Tempered glass |
| 5 | Timber |
horizontal axis. It is a very important criterion. The remaining variables contain 16% of the total variance. The longest segments belong to DV1, DV2 and DV4 variables. The length of the segment is responsible for the feature strength. The DV3 and DV5 variables are not important. The map shows that the timber-concrete (1) and timber screens (5) are indeed durable (DV1). DV1 segment has a position close to points 1 and 5 . The screens made of tempered glass require the maintenance. The “greenwall” and aluminium panels belong to economic solutions. In addition, the aluminium panel is aesthetic.
4 Conclusions
The presented analysis raises the following conclusions:
– The critical literature analysis has distinguished the main criteria for assessing the technological and material solutions of the acoustic screens
– The radar charts make it impossible to show relationship between variables and cases. It is also not possible to determine the significance of the criterion for individual cases.
– The biplot maps allow to determine relationship between features and technological and material solutions.
– The comparison of the graphical interpretation of radar chart and biplot methods allowed to assess the biplot method as more accurate.
– The optimal technological and material solutions for acoustic screens according to the radar charts is a timber-concrete panel.
– The biplot solution gives a broader concept of optimisation. According to this interpretation, the timber-concrete and timber panels is an important technological and material solution for the criterion of durability, glass for the feature of the required maintenance, and the "green wall" for the performance economy. Other criteria are less important. Summing up, the most important criterion also considering the weighting is the economy of performance that explains almost 73% of the total variance. This feature is assigned to the case: “green wall”.
References
[1] Basińska M., The use of multi-criteria optimalization to choose solutions for energy-efflcient buildings, Bulletin of the Polish Academy of Sciences. Technical Sciences, 2017, 6, 815-82610.1515/bpasts-2017-0084Search in Google Scholar
[2] Craig A., Wprowadzenie do analizy decyzyjnej i jej zastosowanie w farmakoekonomii, Pharmacotherapy in Psychiatry and Neurology, 1, 1996Search in Google Scholar
[3] Czermiński A., Czapiewski M., Organizacja procesów decyzyjnych, Wydawnictwo Uniwersytetu Gdańskiego, Gdańsk 1995Search in Google Scholar
[4] Drozd W., Ekrany akustyczne jako metoda ograniczania emisji hałasu w infrastrukturze drogowej, Przegląd budowlany, 2013, 12, 33-39Search in Google Scholar
[5] Keeney R., Raiffa H., Decision with Multiple Objectives: Preferences and Value Trade-Offs, Wiley series in probability and matematical statistics. Applied probability and statistics Cambridge University Press 199310.1017/CBO9781139174084Search in Google Scholar
[6] Kiprian K., Ligus G., Geneza i metody ograniczania hałasu drogowego - ekrany akustyczne, Prace Instytutu Ceramiki i Materiałów Budowlanych, 2011, 8, 95-105Search in Google Scholar
[7] Kompała M., Mrukwa W., Świder J., Teoria a praktyka stosowania ekranów akustycznych, Prace Naukowe GIG. Górnictwo i Środowisko, 2002, 2, 43-52Search in Google Scholar
[8] Labus K., Labus M., Zastosowanie danych złożonych (CDA)wgeologii, Gospodarka Surowcami Mineralnymi, 2006, 2, 39-52Search in Google Scholar
[9] Levin R.I., Kirkpatrick C.A., Rubin D.S., Quantitative Approaches to Management, McGraw-Hill Education 1982Search in Google Scholar
[10] Nermend K., Metody analizy wielokryterialnej i wielowymiarowej we wspomaganiu decyzji, Wydawnictwo Naukowe PWN, Warszawa 2017Search in Google Scholar
[11] Nermend K., Wielokryterialna matoda wektora preferencji jako narzędzie wspomagające proces decyzyjny, Przegląd statystyczny, 2015, 1, 71-92Search in Google Scholar
[12] Panek T., Zwierzchowski J., Statystyczne metody wielowymiarowej analizy porównawczej. Teoria i zastosowania, Oficyna Wydawnicza SGH, Warszawa 2013Search in Google Scholar
[13] Runiański J., Przed decyzją, PWE, Warszawa 1965Search in Google Scholar
[14] Sagan A., Jeden obraz ukazuje więcej niż 10 liczb, czyli jak budować mapy zadowolenia klienta z wykorzystaniem programu Statistica, Stat Soft Polska, 2004Search in Google Scholar
[15] Stryczniewicz L., Betonowe ekrany akustyczne, Budownictwo Technologie Architektura, 2006, 2, 28-29Search in Google Scholar
[16] Szruba M., Ekrany akustyczne rozwiązaniem głośnego problemu, Nowoczesne Budownictwo Inżynieryjne, 2015, 2, 80-84Search in Google Scholar
[17] Zgoła B., Ekrany akustyczne, Budownictwo Technologie Architektura, 2002, 3, 34-36Search in Google Scholar
© 2018 R. Dachowski and K. Gałek, published by De Gruyter
This work is licensed under the Creative Commons Attribution-NonCommercial-NoDerivatives 4.0 License.
Articles in the same Issue
- Regular Article
- Real-scale comparison between simple and composite raw sewage sampling
- 10.1515/eng-2018-0017
- The risks associated with falling parts of glazed facades in case of fire
- Implementation of high speed machining in thin-walled aircraft integral elements
- Evaluating structural crashworthiness and progressive failure of double hull tanker under accidental grounding: bottom raking case
- Influence of Silica (SiO2) Loading on the Thermal and Swelling Properties of Hydrogenated-Nitrile-Butadiene-Rubber/Silica (HNBR/Silica) Composites
- Statistical Variations and New Correlation Models to Predict the Mechanical Behavior and Ultimate Shear Strength of Gypsum Rock
- Analytic approximate solutions to the chemically reactive solute transfer problem with partial slip in the flow of a viscous fluid over an exponentially stretching sheet with suction/blowing
- Thermo-mechanical behavior simulation coupled with the hydrostatic-pressure-dependent grain-scale fission gas swelling calculation for a monolithic UMo fuel plate under heterogeneous neutron irradiation
- Optimal Auxiliary Functions Method for viscous flow due to a stretching surface with partial slip
- Vibrations Analysis of Rectangular Plates with Clamped Corners
- Evaluating Lean Performance of Indian Small and Medium Sized Enterprises in Automotive Sector
- FPGA–implementation of PID-controller by differential evolution optimization
- Thermal properties and morphology of polypropylene based on exfoliated graphite nanoplatelets/nanomagnesium oxide
- A computer-based renewable resource management system for a construction company
- Hygrothermal Aging of Amine Epoxy: Reversible Static and Fatigue Properties
- The selected roof covering technologies in the aspect of their life cycle costs
- Influence of insulated glass units thickness and weight reduction on their functional properties
- Structural analysis of conditions determining the selection of construction technology for structures in the centres of urban agglomerations
- Selection of the optimal solution of acoustic screens in a graphical interpretation of biplot and radar charts method
- Subsidy Risk Related to Construction Projects: Seeking Causes
- Multidimensional sensitivity study of the fuzzy risk assessment module in the life cycle of building objects
- Planning repetitive construction projects considering technological constraints
- Identification of risk investment using the risk matrix on railway facilities
- Comparison of energy parameters of a centrifugal pump with a multi-piped impeller in cooperation either with an annular channel and a spiral channel
- Influence of the contractor’s payment method on the economic effectiveness of the construction project from the contractor’s point of view
- Special Issue Automation in Finland
- Diagnostics and Identification of Injection Duration of Common Rail Diesel Injectors
- An advanced teaching scheme for integrating problem-based learning in control education
- A survey of telerobotic surface finishing
- Wireless Light-Weight IEC 61850 Based Loss of Mains Protection for Smart Grid
- Smart Adaptive Big Data Analysis with Advanced Deep Learning
- Topical Issue Desktop Grids for High Performance Computing
- A Bitslice Implementation of Anderson’s Attack on A5/1
- Efficient Redundancy Techniques in Cloud and Desktop Grid Systems using MAP/G/c-type Queues
- Templet Web: the use of volunteer computing approach in PaaS-style cloud
- Using virtualization to protect the proprietary material science applications in volunteer computing
- Parallel Processing of Images in Mobile Devices using BOINC
- “XANSONS for COD”: a new small BOINC project in crystallography
- Special Issue on Sustainable Energy, Engineering, Materials and Environment
- An experimental study on premixed CNG/H2/CO2 mixture flames
- Tidal current energy potential of Nalón river estuary assessment using a high precision flow model
- Special Spring Issue 2017
- Context Analysis of Customer Requests using a Hybrid Adaptive Neuro Fuzzy Inference System and Hidden Markov Models in the Natural Language Call Routing Problem
- Special Issue on Non-ferrous metals and minerals
- Study of strength properties of semi-finished products from economically alloyed high-strength aluminium-scandium alloys for application in automobile transport and shipbuilding
- Use of Humic Sorbent from Sapropel for Extraction of Palladium Ions from Chloride Solutions
- Topical Issue on Mathematical Modelling in Applied Sciences, II
- Numerical simulation of two-phase filtration in the near well bore zone
- Calculation of 3D Coordinates of a Point on the Basis of a Stereoscopic System
- The model of encryption algorithm based on non-positional polynomial notations and constructed on an SP-network
- A computational algorithm and the method of determining the temperature field along the length of the rod of variable cross section
- ICEUBI2017 - International Congress on Engineering-A Vision for the Future
- Use of condensed water from air conditioning systems
- Development of a 4 stroke spark ignition opposed piston engine
- Development of a Coreless Permanent Magnet Synchronous Motor for a Battery Electric Shell Eco Marathon Prototype Vehicle
- Removal of Cr, Cu and Zn from liquid effluents using the fine component of granitic residual soils
- A fuzzy reasoning approach to assess innovation risk in ecosystems
- Special Issue SEALCONF 2018
- Brush seal with thermo-regulating bimetal elements
- The CFD simulation of the flow structure in the sewage pump
- The investigation of the cavitation processes in the radial labyrinth pump
- Testing of the gaskets at liquid nitrogen and ambient temperature
- Probabilistic Approach to Determination of Dynamic Characteristics of Automatic Balancing Device
- The design method of rubber-metallic expansion joint
- The Specific Features of High-Velocity Magnetic Fluid Sealing Complexes
- Effect of contact pressure and sliding speed on the friction of polyurethane elastomer (EPUR) during sliding on steel under water wetting conditions
- Special Issue on Advance Material
- Effect of thermo-mechanical parameters on the mechanical properties of Eurofer97 steel for nuclear applications
- Failure prediction of axi-symmetric cup in deep drawing and expansion processes
- Characterization of cement composites based on recycled cellulosic waste paper fibres
- Innovative Soft Magnetic Composite Materials: Evaluation of magnetic and mechanical properties
- Statistical modelling of recrystallization and grain growth phenomena in stainless steels: effect of initial grain size distribution
- Annealing effect on microstructure and mechanical properties of Cu-Al alloy subjected to Cryo-ECAP
- Influence of heat treatment on corrosion resistance of Mg-Al-Zn alloy processed by severe plastic deformation
- The mechanical properties of OFHC copper and CuCrZr alloys after asymmetric rolling at ambient and cryogenic temperatures