Factors Influencing the Usage of Interactive Action Technologies in Mathematics Education: Insights from Hungarian Teachers’ ICT Usage Patterns
-
Zoltán Kovács

 und
Gergely Wintsche
und
Gergely Wintsche

Abstract
Mathematics instruction requires interactive action technologies like dynamic geometry. Our research question was: What distinguishes mathematics teachers who use action software frequently from those who use general ICT technologies but action tools less often and those who use ICT technologies rarely? We examined Hungarian mathematics teachers’ attitudes toward ICT, perceived ICT literacy and pedagogical competence, and beliefs about the role of digital tools in mathematical problem-solving. We categorized 349 Hungarian mathematics teachers by ICT use using a Likert scale. Three groups were frequent action tool users, frequent general target tool users but infrequent action technique users, and infrequent ICT tool users. Infrequent technology users scored lowest in all categories. The only stable and significant difference between frequent action software users was their technology attitude.
1 Introduction
Some years ago, one of the first author’s math teacher students expressed a sentiment that struck the author. They said, “I do not know why a subject as beautiful as mathematics should be spoiled by technology. I kept my school math notebooks, and I want to teach math the way my math teacher taught me: with paper and pencil.” While not representative of all math teachers in Hungary, this statement highlights a crucial aspect of the challenge of integrating technology into mathematics education: teachers’ attitudes and approaches.
This anecdote reflects a broader hesitation among some teachers toward embracing digital tools in teaching despite the increasing emphasis on technology in educational curricula worldwide. Institutional culture, defined as the norms, values, and practices of an educational system, plays a significant role in teachers’ attitudes toward the integration of digital technologies in mathematics education (Artigue, 2002). Resistance to technology integration may emerge when traditional values and practices are stable.
The Hungarian National Curriculum (Government of Hungary, 2020) deals in detail with the role of digital tools in teaching mathematics. Based on the Hungarian curriculum, the learner should use digital tools as early as possible, even in the early grades, to practice operations and problem-solving using computer games. Mathematical development games, computers, and other digital tools can enhance learning. Additionally, educators should introduce students to mathematical software that enhances their mathematical knowledge and digital literacy. Finally, learners should reach a level where they can independently utilize calculators, computers, visualization aids, digital information sources, and mathematical software that facilitates the application of mathematics.
This ambitious objective raises several questions, first and foremost, about whether the use of digital tools has been shown to impact learning outcomes positively. The outlined answer is that the benefits of technology in mathematics education are modest, as evidenced by experimental studies. The OECD’s (2015) correlational study provides minimal evidence of the benefits of digital technology use. A thorough literature review (Drijvers, 2018) has revealed that some experimental studies, particularly review studies, have reported significant positive effects. However, they varied considerably, ranging from small to moderate effect sizes. Compared to other innovative interventions, evidence supporting the benefits of digital technology in mathematics teaching is not particularly strong. Drijvers also called for a closer examination of the problem and improved investigation methods.
One factor behind this disappointing fact may be teachers’ actual practice of using digital technology. With the growing capabilities of educational technology and adequate technological infrastructure in schools, integrating technology into mathematics teaching has not been as effective as anticipated.
The OECD Teaching and Learning International Survey (OECD, 2018) revealed that the ratio of teachers who frequently or consistently let students use info-communication tools for projects or class work is approximately 48% in Hungary. In addition, Eszenyiné (2019) has investigated several areas of digital competence of mathematics teachers, and digital content creation is relevant to our research. This includes the use of tools to produce and present information. According to this research, 42% of mathematics teachers have low levels of this competence, and there is no regular use of ICT tools among these teachers. 31% have a medium level and 27% have an advanced level. The relationship between curriculum goals and classroom practice forms the rationale of our research, which examines some possible factors contributing to the utilization of technology in mathematics education in Hungary, focusing on math teachers’ preparedness for the application of digital technology, their attitudes toward digital tools, and their beliefs about the effects of digital tools in mathematical problem-solving.
Our research question is as follows in a raw outlined form: What is the relationship between Hungarian math teachers’ digital tool use habits and their perceived ICT literacy, digital pedagogy knowledge, attitudes toward using technology, and beliefs about the role of digital tools in problem-solving?
Investigating beliefs about the role of digital tools in problem-solving is a novelty of our research, which specifically examined the use of technology by mathematics teachers in the context of problem-solving. Our approach investigates how teachers perceive the role of technology within the well-known problem-solving phases (understand the problem, devise a plan, carry out the plan, and look back) outlined by Polya (1945). This focus allows us to explore the integration of technology in mathematics education and how it can be strategically utilized to enhance the problem-solving process.
To answer the research question, we developed a questionnaire to evaluate Hungarian mathematics teachers’ self-assessed digital competencies and use of digital tools. A total of 349 mathematics teachers participated in this study.
2 Literature Review
The use of digital tools in mathematics education is a complex and evolving field with many potential applications. According to Santos-Trigo (2020), digital tools in mathematics education can be categorized into three main types: mathematical action technologies, conveyance technologies, and online resources. Mathematical action technologies, such as Dynamic Geometry Systems, Computer Algebraic Systems, and computer simulations, enable the representation, exploration, and solving of mathematical tasks. These tools allow for the dynamic modeling of mathematical concepts, enabling students to manipulate objects and observe changes, thus fostering a deeper understanding of mathematical relationships and invariances. Conveyance technologies, including communication applications and presentation tools, facilitate the sharing and discussing of mathematical ideas. Online platforms offer resources such as instructional videos, problem examples, and extensive information on mathematical concepts, thus enhancing the learning experience.
The concept of digital curriculum resources (DCR) further expands the role of digital tools in mathematics education. DCR is defined as organized systems of digital resources in electronic formats that articulate the curricular content (Drijvers, Stacey, & Trouche, 2024). DCRs include digital platforms, software, textbooks, and other materials that help with lesson planning and execution. They give teachers the tools to follow the curriculum in their classrooms, and thus, DCRs are the link between culture, policy, and teacher-curricular practice. In Hungary, the National Public Education Portal (NKP; see the website nkp.hu in Hungarian) is one of the leading educational platforms in Hungary, providing free digital curricular elements and services helpful in the teaching-learning process for public education stakeholders.
Many scientists have reported that the digital shift in mathematics education has also affected problem-solving. Artigue (2002) claims that technological knowledge is not just a supplementary skill but becomes an integral part of mathematical knowledge in digital learning environments. Her perspective anticipates later theoretical developments, such as Borba and Villarreal’s (2005) concept of “humans-with-media” which emphasizes that knowledge is not produced by humans alone but results from a collaborative effort between individuals and various forms of media. This framework emphasizes the technological dimension of thinking and intelligence, acknowledging that the nature of problem-solving and conceptual understanding can change significantly depending on the tools or media used. Barrera-Mora and Reyes-Rodríguez (2013) illustrate how the use of digital technologies has influenced mathematical problem-solving, indicating a change in the methods of instruction and acquisition of knowledge. They emphasized the role of digital technologies in facilitating problem-solving activities. The digital transition is regarded as fostering students’ mathematical skills.
Integrating digital technology, including conveyance tools and mathematical action technologies, into mathematical learning environments helps promote and expand discussion among learners and teachers (Santos-Trigo, Reyes-Martínez, & Aguilar-Magallón, 2015). The authors argue that digital technologies are crucial in problem-solving, enabling students to explore novel ways of representing and solving problems. This encourages creative solutions and enhances problem-solving strategies such as examining special cases. New heuristic strategies, such as dragging and finding foci, emerge during task construction, enhancing dynamic models’ effectiveness. Çekmez and Bülbül (2018) argued that mathematical performance requires problem-solving, and well-designed problem-solving-based learning environments can help students understand mathematical concepts and techniques. Math educators consider dynamic mathematics software a viable tool for building such settings. da Silva, Barbosa, Borba, and Ferreira (2021) reported that integrating GeoGebra and Excel software to explore mathematical problems could be effectively incorporated into mathematical investigations. Abramovich (2022) stated that one of the most notable changes is the growing reliance on digital tools that provide real-time feedback and support for interactive problem-solving. These tools have transformed how students approach mathematical challenges.
Teachers’ digital literacy involves the ability to use and manage technology effectively in educational settings and the skills to assess and understand its broader implications (Hasse, 2017). This includes an awareness of how technology impacts teaching and learning processes, alters relationships and identities in the classroom, and influences complex power dynamics. Teachers must have these competencies to navigate and integrate technology responsibly and effectively into their educational practices. Building on these principles, our research divides teacher digital literacy into two fundamental components: the practical use of tools and pedagogically grounded utilization. This distinction emphasizes the technical ability to handle digital tools and the importance of integrating technology underpinned by sound pedagogical principles (Loveless, 2011).
Mathematics teachers’ attitude toward technology integration in mathematics teaching refers to their perceptions, beliefs, and inclinations regarding using technological tools to support and enhance the teaching and learning of mathematics in education. This encompasses their attitudes toward the potential benefits, challenges, and perceived barriers to incorporating technology into their instructional practices (Pierce & Ball, 2009).
Considering the literature background, we refined our research question by asking, “which factors distinguish mathematics teachers who use action software frequently from those who use general ICT technologies frequently but action tools less frequently and those who use ICT technologies hardly.” The answers were based on a sample of Hungarian mathematics teachers. However, we believe that our research question is sufficiently general and fills a gap in the literature.
While this study focuses on broader applications of digital tools in mathematics education, advancements such as automated reasoning tools exemplify how technology can push the boundaries of engagement and exploration, underscoring the importance of rethinking digital integration in curricula (Recio & Dana-Picard, 2024).
3 An Illustrative Example of Technology-Aided Problem Solving
To illustrate how digital tools can support problem-solving, we provide the following example with emphasis on Polya’s problem-solving phases. What follows is an example of using technology in problem-solving, designed for eighth-grade students (on average, 14 years old) included in the Hungarian National Public Education Portal’s online platform. The Hungarian Government supports this portal, and it is compatible with the National Curriculum.
In 1867, Russia accepted the American offer to purchase its territory in Alaska, deemed of little value. They received 7.2 million US dollars for approximately 1.7 million square kilometers of land, amounting to about $4.2 per square kilometer. Considering inflation alone, if the average annual rate of monetary depreciation had been 2%, what would be the equivalent cost 150 years later? In other words, how many dollars would match the value of 7.2 million USD 150 years later?
The result is 7.2·1.02150 million US dollars. The inflation calculation is a prime example of exponential growth and helps students see how to handle real-life financial problems. However, the exponential expression in the result is not always enough for everyday context. Placing the result into Polya’s four-phase model, the “devise the plan” phase is present: the result shows how to set up the calculation, i.e., formulating a strategy for solving the problem. Although this expression reflects the conceptual understanding of the problem, we naturally ask for the practical value of the result. Polya’s “execute the plan” phase is missing from the above form; moreover, there is no concluding reflection. For practical value, a calculator or spreadsheet application can be used (Figure 1). Repeated multiplication can be used without a reference to power if we use a spreadsheet application, as shown in the figure.
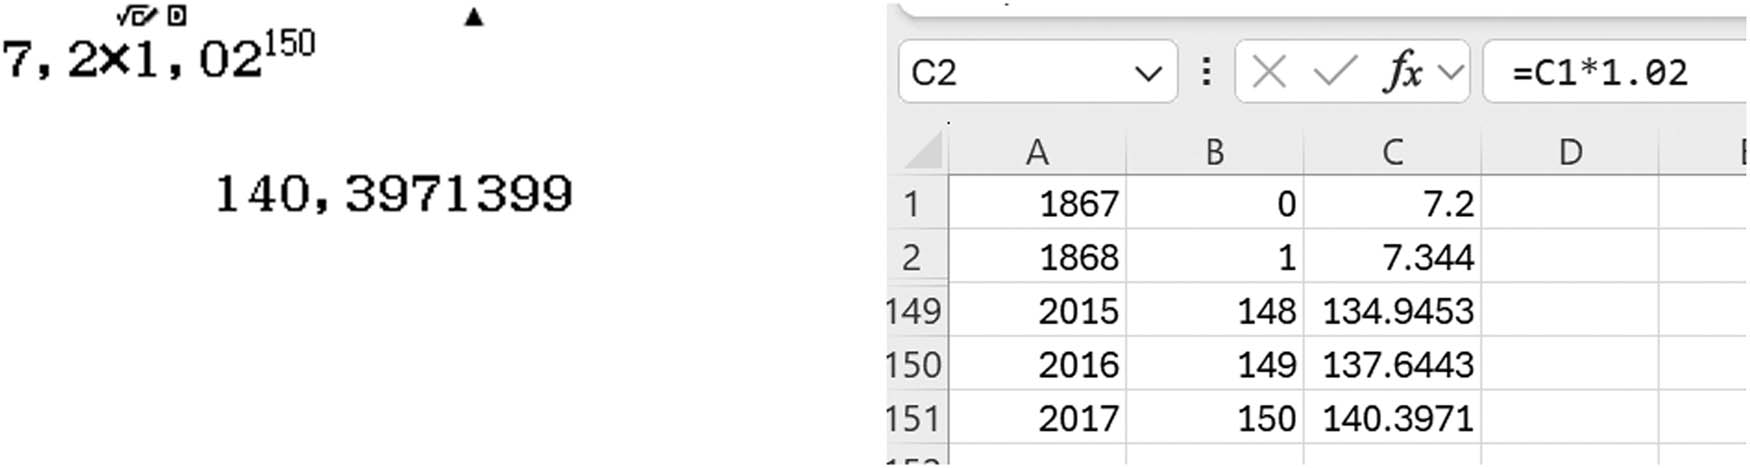
Calculation of the practical value of the exponential expression. Note. Lines 3-148 are hidden in the spreadsheet application screenshot (right).
The fourth Polya step (look back and reflect) may include discussing whether the inflation rate is reasonable. Calling for WolframAlpha, we learn that based on authentic data, the average rate of inflation is 1.91% per year (Figure 2). The deviation between the results (140.4 million versus 123.1 million) is a good possibility that this can be explained by the ratio of (average) inflation rates and has nothing to do with the initial amount of 7.2 million dollars.

The “Look back” phase supported by WolframAlpha, based on the Consumer Price Index.
4 Method
4.1 Questionnaire Development
Our measurement tool consists of four parts. The first part asked for general information (age, highest level of education, and how participants rated their school’s digital equipment). The second part, using a Likert-scale questionnaire, asked for self-assessed digital literacy, pedagogical competence in using digital tools in math teaching, attitudes toward digital technology use, and beliefs about the impact of technology on mathematical problem-solving. The third part measured the frequency of technology usage, which was also based on a Likert-scale questionnaire. Finally, in the fourth part of the questionnaire, respondents were asked to list up to three tools they use in their math lessons and to indicate the purposes for which they use ICT tools most often.
Four points were used where Likert scale questions appeared. We expected that teachers, given their expertise, would have well-formed opinions on technology usage in mathematics teaching. Therefore, the 4-point Likert scale is particularly suitable because the absence of a neutral option in a 4-point scale compels respondents to make a definitive choice, leaning either toward agreement or disagreement. Moreover, research shows that 4-, 5-, 6-, and 11-point scales have similar basic metric properties in terms of means, SDs, item–item correlations, item-total correlations, reliabilities, and exploratory factor analysis (EFA) (Leung, 2011).
The second part of our questionnaire consisted of 17 4-point Likert-scale questions divided into four components:
Self-evaluation of ICT literacy (three questions)
Self-evaluation of pedagogical competence in the use of ICT (three questions)
Attitudes toward ICT use (five questions, including two reverse-scaled items)
Opinion on the impact of technology use on problem-solving (six questions)
We provide some examples:
Component 1. Please rate your assessment of your skill as a computer user.
Component 2. I have a good understanding of how ICT tools support learning processes.
Component 3. Using ICT tools in math lessons frustrated me. (Reverse scale item.)
Before answering the questions in the fourth component, we briefly clarified the notion of a mathematical problem as follows:
In the next section, the mathematical problem is a non-routine task that requires mathematical knowledge, logical thinking, and problem-solving skills.
Example for the fourth component:
Component 4. Math teachers should encourage students to use calculators, mathematical applications, and dynamic geometric tools to solve mathematical problems, even at home.
In this component, four questions were related to Polya’s problem-solving phases. For example, for the look-back phase:
Component 4. Calculators, mathematical applications, and dynamic geometry tools help check solutions to mathematical problems.
In the third part, we obtained information on technology usage. The introduction to this section is as follows.
Select a class that you have taught mathematics in the 2022–23 school year. Questions on the use of tools refer to this class. We are interested in the frequency of use of the ICT tool indicated in the selected class.
We asked about the frequency of use of seven predefined tools. Of these, three were action technologies (dynamic geometry, computer algebra tool, spreadsheet applications), two were conveyance technologies (presentation, interactive board), and two were online resources (instructional video, use of the National Public Education Portal). An example is as follows:
How often do you use mathematical software that can be used for symbolic calculations in mathematics lessons (e.g., Wolfram Alpha)?
The explanation of the four-point Likert scale was: 1. 1–2 times per year at most; 4. weekly (depending on the nature of the subject).
4.2 Reliability and Validity
Statistical analyses were performed using JASP statistical software (JASP Team, 2024). Based on the empirical data for the second part of the questionnaire, we employed EFA to examine the underlying structure of our Likert-scale questionnaire. The Kaiser–Meyer–Olkin measure verified the sampling adequacy for the analysis, yielding an overall MSA of 0.862, indicating a high suitability level for EFA. Bartlett’s test result is χ 2 (136) = 2820.996, p < 0.001, strongly indicates that the variables are correlated in the population. We used an oblique rotation method to allow for correlations between factors, acknowledging the potential interrelatedness of the constructs. The EFA revealed a four-factor solution with the same components as intended during development.
The internal consistency of the questionnaire was assessed using Cronbach’s alpha and the average inter-item correlation. The reliability analysis demonstrated high levels of internal consistency, with Cronbach’s α between 0.800 and 0.871, as shown in Table 1. The average inter-item correlations for these factors were within the optimal range of 0.2–0.7, further confirming the consistency of the items within each factor. These reliability statistics indicate that each factor is coherent, with items consistently measuring the same underlying concept.
The internal consistency of the Likert-scale questionnaire
| Factor | Cronbach’s α | Average interitem correlation |
|---|---|---|
| Perceived ICT literacy | 0.815 | 0.599 |
| Perceived pedagogical competence in the use of ICT | 0.871 | 0.693 |
| Attitudes toward ICT Use | 0.828 | 0.487 |
| Beliefs about the role of digital tools in problem-solving | 0.800 | 0.399 |
In the third part of the questionnaire, we aimed to assess the frequency and types of technology tools used by participants. Seven predefined tools in three groups were examined using a 4-point Likert scale. We proposed the three-factor model (conveyance technologies, math action technologies, and online resources) grounded in theoretical considerations to observe teachers’ digital use habits. Based on our empirical dataset, we applied confirmatory factor analysis (CFA) to validate the model (DeVellis & Thorpe, 2022).
However, upon conducting CFA, we encountered compelling evidence that necessitated rejecting the original model.
In our modified analysis, we developed a two-factor model. We included online resources, i.e., NKP and video use in Factor 1, initially containing the presentation and interactive board. After this step, the model comprised two factors, each associated with a set of observed variables. The two-factor model is rational as it distinctly separates tools used explicitly in mathematics education (math action tools) from those employed more generally in educational settings (general tools). This model gave fit indices better than the three-factor model. The factor loadings were appropriate, representing the strength of the relationships between the latent factors and their respective observed indicators (Table 2). The variable describing the factors was constructed as a weighted average of the responses to each indicator, using factor loadings as weights.
Factor loadings of observed indicators
| Factor | Indicator | Factor load | Std. error | z-Value | p |
|---|---|---|---|---|---|
| Factor 1 | Presentation | 0.673 | 0.074 | 9.103 | p < 0.001 |
| Interactive board | 0.583 | 0.085 | 6.832 | p < 0.001 | |
| NKP | 0.490 | 0.070 | 6.965 | p < 0.001 | |
| Video | 0.568 | 0.069 | 8.255 | p < 0.001 | |
| Factor 2 | CAS | 0.300 | 0.080 | 3.732 | p < 0.001 |
| Dynamic geometry | 0.825 | 0.201 | 4.110 | p < 0.001 |
In summary, our research used the following variables (Table 3).
Variables for statistical analysis
| Variable | Short name | Construction per person | Range, type |
|---|---|---|---|
| Age | — | One answer | Interval |
| Highest level of education | — | One answer | Nominal |
| School’s digital equipment | — | One answer | 1–4, ordinal |
| Perceived ICT literacy | ICT literacy | Average of 3 answers | 1–4, interval |
| Perceived pedagogical competence in the use of ICT | Pedagogy | Average of 3 answers | 1–4, interval |
| Attitudes toward ICT use | Attitude | Average of 5 answers | 1–4, interval |
| Beliefs about the role of digital tools in problem-solving | Belief | Average of 6 answers | 1–4, interval |
| General tool usage | General | The weighted average of 4 answers | 1–4, interval |
| Math action tool usage | Action | The weighted average of 2 answers | 1–4, interval |
5 Results and Discussion
5.1 Demographical Data and School Equipment
Participants aged 21–76 years, with a mean of 50.03 (SD = 9.95); seven responses were missing from the age data. Table 4 presents age-related data for three groups: teachers who teach mathematics but do not have a specific qualification, teachers with a mathematics teacher degree, and teachers with a primary education degree specializing in mathematics.
Descriptive statistics of sample ages
| Age | |||
|---|---|---|---|
| Teachers who teach mathematics but do not have a specific qualification | Teachers with a mathematics teacher degree | Teachers with a primary education degree specializing in mathematics | |
| Valid | 40 | 268 | 34 |
| Missing | 2 | 5 | 0 |
| Mean | 44.43 | 51.12 | 48.06 |
| SD | 10.19 | 9.84 | 8.17 |
| Minimum | 21 | 25 | 28 |
| Maximum | 63 | 76 | 61 |
Teachers with a mathematics specialization reported teaching experience mainly in grades 5–6 (24 out of 34). The majority of those without a mathematics teaching qualification reported experience in grades 5–8 (28 out of 42), with the others teaching in grades 9–12 (Table 5).
Descriptive statistics of sample ages
| Professional qualification | Grade | Total | |||
|---|---|---|---|---|---|
| 5–6 | 7–8 | 9–10 | 11–12 | ||
| Teachers who teach mathematics but do not have a specific qualification | 17 | 11 | 9 | 5 | 42 |
| Teachers with a mathematics teacher degree | 59 | 96 | 51 | 67 | 273 |
| Teachers with a primary education degree specializing in mathematics | 24 | 5 | 4 | 1 | 34 |
| Total | 100 | 112 | 64 | 73 | 349 |
The mean score for the question on schools’ perceived IT equipment was 3.074 (SD = 0.799), which means that schools’ digital equipment should not be a substantial barrier to digital inclusion.
5.2 Reported Devices and Functions
When asked to list the three ICT tools teachers use most often, Respondents most frequently mentioned smart devices (196 people, 56.2%) and calculators (118 people, 33.9%). Since the use of calculators has long been part of the Hungarian tradition of teaching mathematics, at least it is well documented that educational policymakers have recommended their use from the age of 16 since the late 1970s (Halmos & Varga, 1978), it is not surprising that they are widely used, underlining the role of school culture (Artigue, 2002). Our survey did not provide information on the actual use of smart devices, but it can be assumed that smart devices can be classified as conveyance technology. This assumption is confirmed by the fact that the most common function of using ICT devices identified by respondents was to provide demonstrations (270 people, 77.4%). Geogebra was the most frequently mentioned action technology tool (72 mentions, 20.6%), and no other dynamic geometry software was mentioned.
5.3 Questionnaire Results
The unidimensional measures for each component were calculated as the average of individual respondents’ mean scores on the component’s items, taking into account the reverse-scored questions in the Likert scale, see Table 6.
Unidimensional measures of each component of the questionnaire
| Component | Mean | SD |
|---|---|---|
| Perceived ICT literacy | 3.489 | 0.548 |
| Perceived pedagogical competence in the use of ICT | 3.222 | 0.678 |
| Attitudes toward ICT use | 3.477 | 0.583 |
| Beliefs about the role of digital tools in problem-solving | 3.361 | 0.515 |
On a series of Spearman’s correlation analyses, ICT literacy showed a statistically significant, though weak, positive correlation with school equipment (ρ = 0.139, p = 0.009) and a non-significant correlation with age (ρ = 0.023, p = 0.673). When controlling for age, the partial correlation between ICT literacy and school IT equipment slightly increased (ρ = 0.145, p = 0.007), suggesting that age has a minimal moderating effect on this relationship. No significant correlations were found between other variables and schools’ IT equipment.
The Kruskal–Wallis test revealed no significant difference in three of the investigated categories across different levels of educational attainment: H(2) = 2.439, p = 0.295 for perceived ICT literacy, H(2) = 2.344, p = 0.310 for perceived pedagogical competence in the use of ICT, H(2) = 0.196, p = 0.907 for beliefs about the role of digital tools in problem-solving. However, the results indicated a significant difference (H(2) = 8.466, p = 0.015) in attitude toward ICT use, suggesting group variability. Further analysis using Dunn’s Post Hoc Comparisons revealed a significant difference between teachers with a mathematics teacher degree and those with a primary education degree in mathematics (z = −2.703, p bonf = 0.021), and the scores of teachers with a mathematical degree were lower. We are far from understanding this difference, yet we cannot avoid contemplating the introductory anecdote. It could be argued that the image of advanced mathematics in higher education may be less supportive of technology integration. However, further research is needed to confirm this hypothesis.
5.4 Grouping Participants Based on ICT Tool Usage
As reported previously, we initially conducted a factor analysis to understand better the usage patterns of ICT tools among the participants. The two factors obtained were then used to group participants based on the functions general and action. These features were constructed by weighting the variables of each factor with their respective factor loadings. Both functions range between 1 and 4, with a theoretical mean of 2.5, so we used the value 2.5 as the cutoff for forming groups, as follows.
Group 1 (Frequent users of action tools): 95 participants (27.5%): action ≥ 2.5.
Group 2 (General aim tools enthusiasts): 110 participants (31.2%), frequent users of general tools but infrequent users of math action tools: action < 2.5, general ≥ 2.5.
Group 3 (Infrequent users): 144 participants (41.3%), infrequent users of both types of tools: action < 2.5, general < 2.5.
5.5 Variables Examined in the Different User Groups
Figure 3 represents the scores of the four variables under study (ICT literacy, pedagogical competence, attitude, and belief).
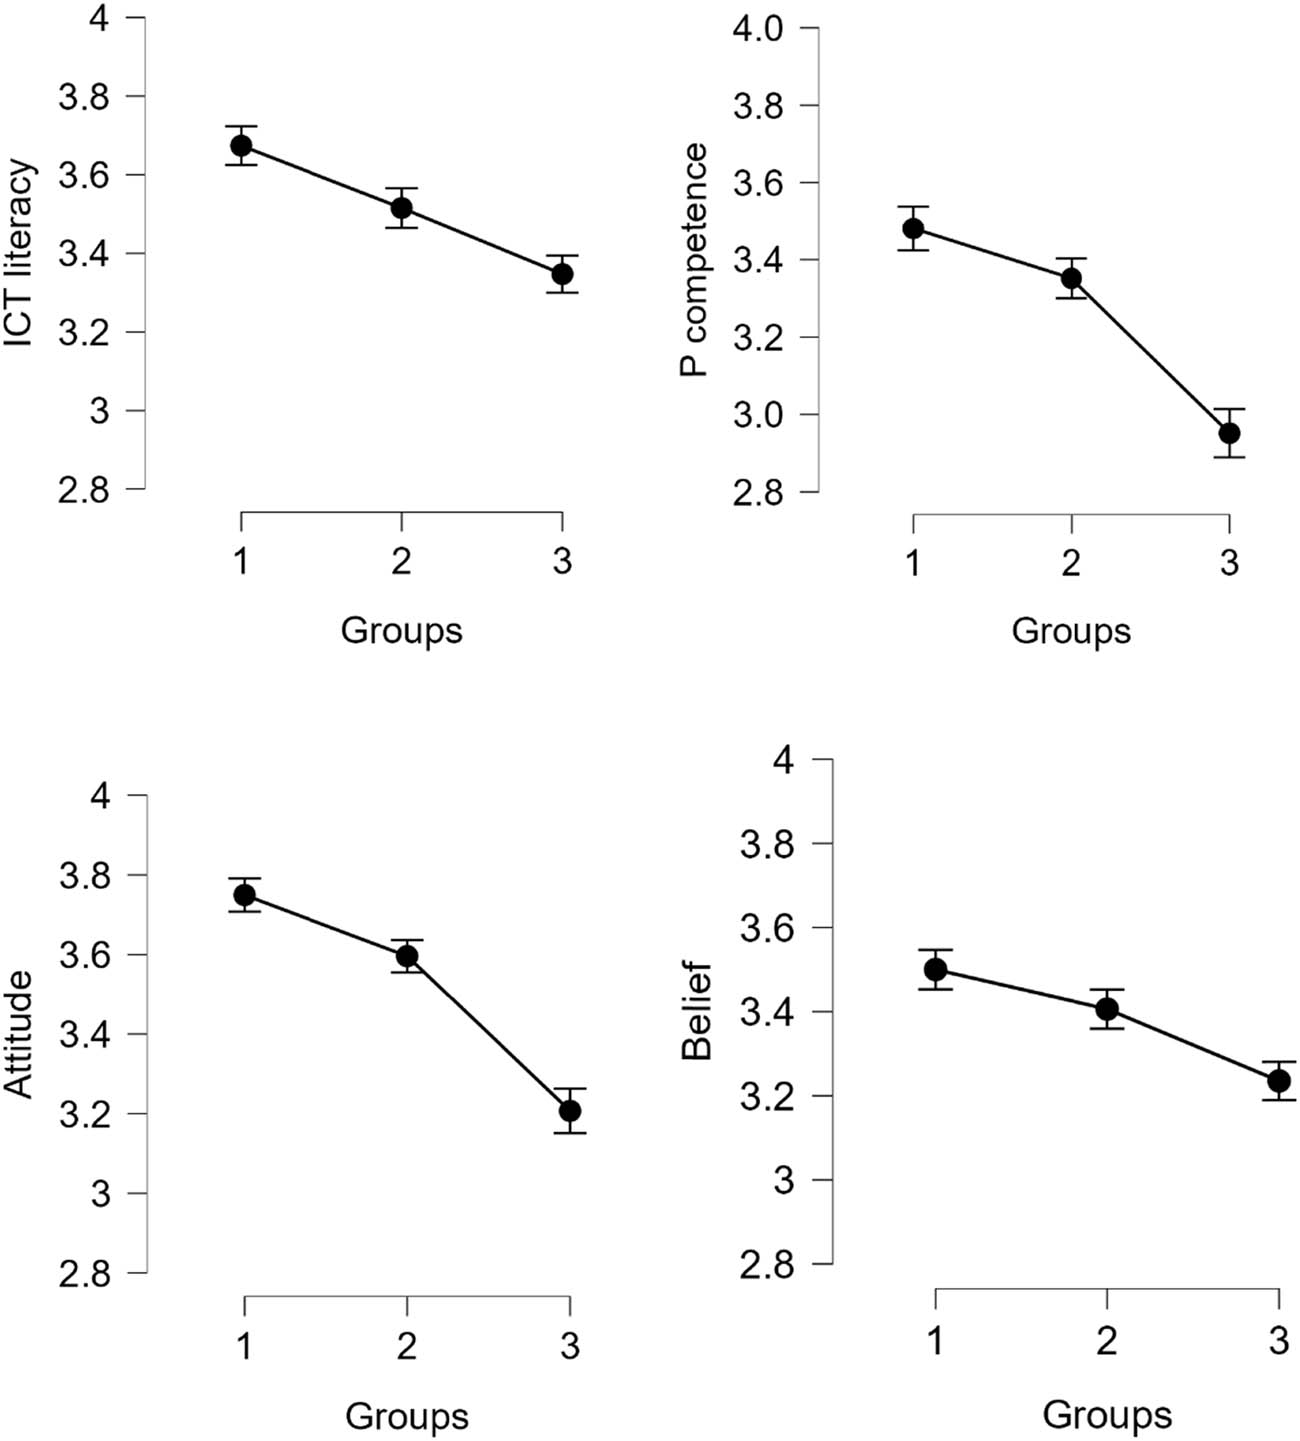
Descriptive plots of mean scores of the four components in the three groups. Group 1: Frequent users of math action tools; Group 2: General aim tool enthusiasts; and Group 3: Infrequent Users. The error bars are based on standard error.
5.5.1 Perceived ICT Literacy Across Groups
The results indicated a statistically significant difference between groups (H(2) = 24.199, p < 0.001). Dunn’s post hoc tests were conducted to examine pairwise differences. The results revealed highly significant differences between groups 1 and 3 (z = 4.894, p bonf < 0.001). Significant differences were also observed between groups 2 and 3 (z = 2.486, p bonf = 0.026). The difference between groups 1 and 2 was not so pronounced (z = 2.370, p bonf = 0.053).
5.5.2 Perceived Pedagogical Competence in the Use of ICT Across Groups
The Kruskal–Wallis test confirmed significant differences among the groups, H(2) = 36.731, p < 0.001. During Dunn’s post hoc comparisons, highly significant differences were found between groups 1 and 3 (z = 5.740, p bonf < 0.001) and groups 2 and 3 (z = 4.150, p bonf < 0.001). There was no significant difference between groups 1 and 2 (z = 1.665, p bonf = 0.288).
5.5.3 Attitude Toward ICT Use Across Groups
The Kruskal–Wallis test confirmed significant differences in attitudes among the groups, H(2) = 57.007, p < 0.001. Dunn’s post hoc comparisons showed significant differences during all pairwise comparisons. The result between groups 1 and 2 is z = 2.754, p bonf = 0.018; for groups 1 and 3, z = 7.349, p bonf < 0.001; and groups 2 and 3, z = 4.625, p bonf < 0.001.
5.5.4 Beliefs About the Role of Digital Tools in Problem-Solving Across Groups
We also got a significant difference for this variable, H(2) = 15.264, p < 0.001. Dunn’s post hoc comparison reveals a significant difference between groups 1 and 3 (z = 3.777, p bonf < 0.001) and groups 2 and 3 (z = 2.478, p bonf = 0.040). There was no significant difference between groups 1 and 2 (z = 1.324, p bonf = 0.557).
The results show that the attitude variable is the only significant separation factor for group 1 (frequent users of math action tools) from the other two groups. Moreover, the Kruskal–Wallis statistic is the highest for this variable. Even though action technology users rate their digital competence highest, the level of digital competence significantly separates infrequent users from the other groups, and the separation of Group 1 from Group 2 is not so pronounced. Similarly, those who use ICT technology in mathematics classrooms rate their digital pedagogical competence as better than infrequent users, regardless of the technology they use.
The analysis of the belief variable gave a surprising result because using digital tools in problem-solving was expected to be an essential separating factor for the group that frequently used action technologies. Nevertheless, we found no significant difference between the first and second groups. A possible explanation for this phenomenon can be found by looking at the answers to the questions about the different phases of the Polya. The analysis of problem-solving phases reveals a significant divergence in evaluating the fourth phase (look back) compared to the other phases. The mean score for the fourth phase stands notably higher at M = 3.662 (SD = 0.557), whereas the mean scores for the preceding phases are lower: first phase (M = 3.223, SD = 0.831), second phase (M = 3.269, SD = 0.740), and third phase (M = 3.241, SD = 0.784). The Wilcoxon signed-rang test statistically supports this disparity. In examining the differences between various phases, there was a significant difference between the first phase and the fourth phase, W = 1265.00, z = −8.309; between the second phase and the fourth phase, W = 1374.00, z = −8.286, p < 0.001; and between the third phase and the fourth phase, W = 1006.00, z = −8.404, p < 0.001. No other significant differences were found. These findings emphasize the distinctive role of the “look back” phase in technology-aided problem-solving in the researched population. Furthermore, although the “look back” phase is much richer than checking results (see our example for technology-aided problem-solving), it will likely be predominant in school practice. Narrowed down to checking, phase 4 does not necessarily require dynamic approaches because a simple calculator is usually enough.
6 Summary
Based on the literature, interactive action technologies, such as dynamic geometry tools and computer algebra software, are crucial in teaching mathematics, especially mathematical problem-solving. Considering this fact, we formulated our research question by asking which factors distinguish mathematics teachers who use action software frequently from those who use general ICT technologies frequently but action tools less frequently and those who use ICT technologies hardly.
To answer this research question, our study examined the following factors in Hungarian mathematics teachers: attitudes toward ICT, their perceived ICT literacy and pedagogical competence in using ICT, and beliefs about the role of digital tools in mathematical problem-solving. We grouped mathematics teachers based on their usage frequency of ICT tools, categorizing them into frequent users of action tools, general aim tool enthusiasts, and infrequent users. The result shows that infrequent technology users had the worst scores in all categories. Moreover, the only stable discriminating factor for frequent math action tool users is the attitude toward technology usage.
Since attitude toward technology usage seems to be the critical factor among mathematics teachers in integrating action tools in teaching, teacher education and professional development programs should encourage favorable ICT attitudes. Inspiration, examples of effective use, and showing how ICT tools affect mathematical problem-solving might influence teachers’ enthusiasm to use these resources. Thus, training programs should prioritize building confidence and positive perceptions around the use of technology in mathematics education.
Acknowledgments
This study was funded by the Research Program for Public Education Development of the Hungarian Academy of Sciences (KOZOKT 2021-16) and University of Debrecen. The authors have declared that no competing interests exist. The authors declare that they have no affiliations with or involvement in any organization or entity with any financial interest in the subject matter or materials discussed in this manuscript.
-
Author contributions: Both authors take responsibility for the entire content of this manuscript, have consented to its submission to the journal, reviewed all the results, and approved the final version of the manuscript. Zoltán Kovács was primarily responsible for the planning, development, data analysis, and writing of the manuscript. Gergely Wintsche supervised the work, validated the methodology, and reviewed the final text.
-
Conflict of interest: Authors state no conflict of interest.
-
Data availability statement: Data available on request from the authors.
References
Abramovich, S. (2022). Technology-immune/technology-enabled problem solving as agency of design-based mathematics education. Education Sciences, 12(8), 514. doi: 10.3390/educsci12080514.Suche in Google Scholar
Artigue, M. (2002). Learning mathematics in a CAS environment: The genesis of a reflection about instrumentation and the dialectics between technical and conceptual work. International Journal of Computers for Mathematical Learning, 7(3), 245–274. doi: 10.1023/A:1022103903080.Suche in Google Scholar
Barrera-Mora, F., & Reyes-Rodríguez, A. (2013). Cognitive processes developed by students when solving mathematical problems within technological environments. Mathematics Enthusiast, 10(1–2), 109–136. doi: 10.54870/1551-3440.1262.Suche in Google Scholar
Borba, M. C., & Villarreal, M. E. (2005). Humans-with-media and the reorganization of mathematical thinking. In Humans-with-media and the reorganization of mathematical thinking. Springer Science + Business Media, Inc. doi: 10.1007/b105001.Suche in Google Scholar
Çekmez, E., & Bülbül, B. Ö. (2018). An example of the use of dynamic mathematics software to create problem-solving environments that serve multiple purposes. Interactive Learning Environments, 26(5), 654–663. doi: 10.1080/10494820.2017.1385029.Suche in Google Scholar
da Silva, R. S. R., Barbosa, L. M., Borba, M. C., & Ferreira, A. L. A. (2021). The use of digital technology to estimate a value of pi: Teachers’ solutions on squaring the circle in a graduate course in Brazil. ZDM – Mathematics Education, 53(3), 605–619. doi: 10.1007/s11858-021-01246-1.Suche in Google Scholar
DeVellis, R. F., & Thorpe, C. T. (2022). Scale development theory and applications. (5th ed.). Thousand Oaks, California: SAGE Publications, Inc.Suche in Google Scholar
Drijvers, P. (2018). Empirical evidence for benefit? Reviewing quantitative research on the use of digital tools in mathematics education. In L. Ball, P. Drijvers, S. Ladel, H. S. Siller, M. Tabach, & C. Vale (Eds.), Uses of technology in primary and secondary mathematics education. ICME-13 Monographs (pp. 161–175). Cham: Springer. doi: 10.1007/978-3-319-76575-4_9.Suche in Google Scholar
Drijvers, P., Stacey, K., & Trouche, L. (2024). Mathematics curricula in the digital era: Policy and implementation. In M. Clements, B. Kaur, T. Lowrie, V. Mesa, & J. Prytz (Eds.), Springer international handbooks of education (pp. 705–734). Springer, Cham: Springer Nature. doi: 10.1007/978-3-031-51474-6_28.Suche in Google Scholar
Eszenyiné, B. M. (2019). Pedagógus digitális kompetencia-körkép 2018. 2. rész: A műveltségi területek eredményei (English title: Digital Competences for Teachers 2018.Part 2: Outcomes in literacy domains). Tudományos És Műszaki Tájékoztatás, 66(4), 187–210.Suche in Google Scholar
Government of Hungary. (2020). A Kormány 5/2020. (I. 31.) Korm. rendelete a Nemzeti alaptanterv kiadásáról, bevezetéséről és alkalmazásáról szóló 110/2012. (VI. 4.) Korm. rendelet módosításáról [Government Decree No. 5/2020 (I. 31.) amending Government Decree No. 110/2012 (VI. 4.) on the publication, introduction and application of the National Core Curriculum.]. Budapest: Magyar Közlöny.Suche in Google Scholar
Halmos, M., & Varga, T. (1978). Change in mathematics education since the late 1950’s - Ideas and realisation; Hungary. Educational Studies in Mathematics, 9(2), 225–244.10.1007/BF00221159Suche in Google Scholar
Hasse, C. (2017). Technological literacy for teachers. Oxford Review of Education, 43(3), 365–378. doi: 10.1080/03054985.2017.1305057.Suche in Google Scholar
JASP Team. (2024). JASP (Version 0.18.3) [Computer software]. https://jasp-stats.org/.Suche in Google Scholar
Leung, S. O. (2011). A comparison of psychometric properties and normality in 4-, 5-, 6-, and 11-point Likert scales. Journal of Social Service Research, 37(4), 412–421. doi: 10.1080/01488376.2011.580697.Suche in Google Scholar
Loveless, A. (2011). Technology, pedagogy and education: Reflections on the accomplishment of what teachers know, do and believe in a digital age. Technology, Pedagogy and Education, 20(3), 301–316. doi: 10.1080/1475939X.2011.610931.Suche in Google Scholar
OECD. (2015). Students, Computers and Learning: Making the Connection. PISA: OECD Publishing. doi: 10.1787/9789264239555-en.Suche in Google Scholar
OECD. (2018). OECD, TALIS 2018 Database.Suche in Google Scholar
Pierce, R., & Ball, L. (2009). Perceptions that may affect teachers’ intention to use technology in secondary mathematics classes. Educational Studies in Mathematics, 71(3), 299–317. doi: 10.1007/s10649-008-9177-6.Suche in Google Scholar
Polya, G. (1945). How to solve it. Princeton, NJ: Princeton University Press.10.1515/9781400828678Suche in Google Scholar
Recio, T., & Dana-Picard, T. (2024). From Thales theorem to octic curves. Maple Transactions, 4(3), 18022. doi: 10.5206/mt.v4i3.18022.Suche in Google Scholar
Santos-Trigo, M. (2020). Problem-solving in mathematics education. In S. Lerman (Ed.), Encyclopedia of mathematics education (pp. 686–693). Cham: Springer. doi: 10.1007/978-3-030-15789-0_129.Suche in Google Scholar
Santos-Trigo, M., Reyes-Martínez, I., & Aguilar-Magallón, D. (2015). The use of digital technology in extending mathematical problem solving reasoning. In L. Uden, D. Liberona, & T. Welzer (Eds.), Learning technology for education in cloud (Vol. 533, pp. 298–309). Cham: Springer. doi: 10.1007/978-3-319-22629-3_24.Suche in Google Scholar
© 2025 the author(s), published by De Gruyter
This work is licensed under the Creative Commons Attribution 4.0 International License.
Artikel in diesem Heft
- Special Issue: Disruptive Innovations in Education - Part II
- Formation of STEM Competencies of Future Teachers: Kazakhstani Experience
- Technology Experiences in Initial Teacher Education: A Systematic Review
- Ethnosocial-Based Differentiated Digital Learning Model to Enhance Nationalistic Insight
- Delimiting the Future in the Relationship Between AI and Photographic Pedagogy
- Research Articles
- Examining the Link: Resilience Interventions and Creativity Enhancement among Undergraduate Students
- The Use of Simulation in Self-Perception of Learning in Occupational Therapy Students
- Factors Influencing the Usage of Interactive Action Technologies in Mathematics Education: Insights from Hungarian Teachers’ ICT Usage Patterns
- Study on the Effect of Self-Monitoring Tasks on Improving Pronunciation of Foreign Learners of Korean in Blended Courses
- The Effect of the Flipped Classroom on Students’ Soft Skill Development: Quasi-Experimental Study
- The Impact of Perfectionism, Self-Efficacy, Academic Stress, and Workload on Academic Fatigue and Learning Achievement: Indonesian Perspectives
- Revealing the Power of Minds Online: Validating Instruments for Reflective Thinking, Self-Efficacy, and Self-Regulated Learning
- Culturing Participatory Culture to Promote Gen-Z EFL Learners’ Reading Proficiency: A New Horizon of TBRT with Web 2.0 Tools in Tertiary Level Education
- The Role of Meaningful Work, Work Engagement, and Strength Use in Enhancing Teachers’ Job Performance: A Case of Indonesian Teachers
- Goal Orientation and Interpersonal Relationships as Success Factors of Group Work
- A Study on the Cognition and Behaviour of Indonesian Academic Staff Towards the Concept of The United Nations Sustainable Development Goals
- The Role of Language in Shaping Communication Culture Among Students: A Comparative Study of Kazakh and Kyrgyz University Students
- Lecturer Support, Basic Psychological Need Satisfaction, and Statistics Anxiety in Undergraduate Students
- Parental Involvement as an Antidote to Student Dropout in Higher Education: Students’ Perceptions of Dropout Risk
- Enhancing Translation Skills among Moroccan Students at Cadi Ayyad University: Addressing Challenges Through Cooperative Work Procedures
- Socio-Professional Self-Determination of Students: Development of Innovative Approaches
- Exploring Poly-Universe in Teacher Education: Examples from STEAM Curricular Areas and Competences Developed
- Understanding the Factors Influencing the Number of Extracurricular Clubs in American High Schools
- Student Engagement and Academic Achievement in Adolescence: The Mediating Role of Psychosocial Development
- The Effects of Parental Involvement toward Pancasila Realization on Students and the Use of School Effectiveness as Mediator
- A Group Counseling Program Based on Cognitive-Behavioral Theory: Enhancing Self-Efficacy and Reducing Pessimism in Academically Challenged High School Students
- A Significant Reducing Misconception on Newton’s Law Under Purposive Scaffolding and Problem-Based Misconception Supported Modeling Instruction
- Product Ideation in the Age of Artificial Intelligence: Insights on Design Process Through Shape Coding Social Robots
- Navigating the Intersection of Teachers’ Beliefs, Challenges, and Pedagogical Practices in EMI Contexts in Thailand
- Business Incubation Platform to Increase Student Motivation in Creative Products and Entrepreneurship Courses in Vocational High Schools
- On the Use of Large Language Models for Improving Student and Staff Experience in Higher Education
- Coping Mechanisms Among High School Students With Divorced Parents and Their Impact on Learning Motivation
- Twenty-First Century Learning Technology Innovation: Teachers’ Perceptions of Gamification in Science Education in Elementary Schools
- Exploring Sociological Themes in Open Educational Resources: A Critical Pedagogy Perspective
- Teachers’ Emotions in Minority Primary Schools: The Role of Power and Status
- Investigating the Factors Influencing Teachers’ Intention to Use Chatbots in Primary Education in Greece
- Working Memory Dimensions and Their Interactions: A Structural Equation Analysis in Saudi Higher Education
- A Practice-Oriented Approach to Teaching Python Programming for University Students
- Reducing Fear of Negative Evaluation in EFL Speaking Through Telegram-Mediated Language Learning Strategies
- Demographic Variables and Engagement in Community Development Service: A Survey of an Online Cohort of National Youth Service Corps Members
- Educational Software to Strengthen Mathematical Skills in First-Year Higher Education Students
- The Impact of Artificial Intelligence on Fostering Student Creativity in Kazakhstan
- Review Articles
- Current Trends in Augmented Reality to Improve Senior High School Students’ Skills in Education 4.0: A Systematic Literature Review
- Exploring the Relationship Between Social–Emotional Learning and Cyberbullying: A Comprehensive Narrative Review
- Determining the Challenges and Future Opportunities in Vocational Education and Training in the UAE: A Systematic Literature Review
- Socially Interactive Approaches and Digital Technologies in Art Education: Developing Creative Thinking in Students During Art Classes
- Current Trends Virtual Reality to Enhance Skill Acquisition in Physical Education in Higher Education in the Twenty-First Century: A Systematic Review
- Understanding the Technological Innovations in Higher Education: Inclusivity, Equity, and Quality Toward Sustainable Development Goals
- Perceived Teacher Support and Academic Achievement in Higher Education: A Systematic Literature Review
- Mathematics Instruction as a Bridge for Elevating Students’ Financial Literacy: Insight from a Systematic Literature Review
- STEM as a Catalyst for Education 5.0 to Improve 21st Century Skills in College Students: A Literature Review
- A Systematic Review of Enterprise Risk Management on Higher Education Institutions’ Performance
- Case Study
- Contrasting Images of Private Universities