Geopolitical Risks and Stock Market Volatility in the SAARC Region
-
Oana Panazan
 and
Emilia Calefariu
and
Emilia Calefariu

Abstract
This study examined the stock market volatility of the member states of the South Asian Association for Regional Cooperation (SAARC) and geopolitical risk (GPR). The analysis period covered January 2014 to March 2024, and the time–frequency wavelet method was used to process the data. The time-varying parameter vector autoregression and spatial autoregressive models helped determine the dynamic connectedness of volatility in the analyzed states. The findings revealed similar stock market connections in Bangladesh and India. In addition, a comparative analysis of stocks in India and Pakistan led to the identification of common elements. The connection between geopolitical concerns and Sri Lankan stocks was the strongest and increased in intensity after 2019. GPR and Nepal’s stock market maintained a continuous but low-intensity relationship. The dynamic connectedness between member states’ stock markets was limited during the review period. The study results could encourage SAARC governments to bridge their political differences to ensure that South Asia becomes a strong partner in the global economy. Equally, our results can benefit investors, financial institutions, regulatory authorities, and governments.
1 Introduction
Over recent years, concerns have increased regarding the effects of geopolitical risk (GPR) on stock markets. GPR is a fundamental element in investment decisions, justifying this trend. According to Caldara and Iacoviello (2022), GPR includes events that affect international peace, such as tensions between states or regions, acts of terrorism, military or nuclear threats, political uprisings, elections, and wars. From a methodological perspective, the GPR index uses the frequency of words denoting geopolitical events appearing in major international newspapers.
The global capital market comprises large and small entities united by dynamic financial links. The South Asian Association for Regional Cooperation (SAARC) is part of the world market and has certain strengths. It is a local intergovernmental and geopolitical association of South Asian states, including India, Afghanistan, Nepal, Sri Lanka, Bangladesh, Pakistan, Bhutan, and the Maldives. A few statistical coordinates underline the importance of SAARC worldwide. The organization owns 3, 52.1, and 21% of the Earth’s surface, world economy, and the world’s population, respectively, with a nominal gross domestic product (GDP) of USD 4.359 trillion (https://www.worlddata). In addition to the significant population and variety of natural resources, SAARC member states can develop and grow financial markets (Ellahi et al., 2021). Although member states share a common historical and cultural heritage, political tensions and differences emerged over time, particularly between India and Pakistan (Chowdhury, 2020), which could determine certain volatility of the financial market.
The literature presents the interconnections between the developing stock markets of the SAARC and the short- and long-term states of the world economy (Prakash & Kumar, 2014; Tripathi & Seth, 2016). For example, Srinivasan et al. (2011) established a long-run two-way causal connection between GDP and foreign investment in Sri Lanka, Bangladesh, the Maldives, Nepal, India, and Pakistan. The interconnections between SAARC national markets are manifested at both macroeconomic and corporate levels. Thus, in addition to global aspects such as economic growth, long-term debt, and stock market development, significant relationships between profitability, liquidity, and the size of companies in the SAARC region are observed (Shahzad et al., 2021). Singh and Ahmed (2016) revealed the degree of financial and currency co-integration of less-developed states in the Asia-Pacific region using a multivariate dynamic conditional correlation generalized autoregressive conditional heteroskedasticity model. They demonstrated that SAARC states are inter-regionally integrated with the Association of Southeast Asian Nations and the Pacific area. Surprisingly, very little research has been conducted on stock volatility and returns in the SAARC states.
Moreover, the literature has identified certain controversies regarding the interconnections between SAARC states, which researchers have not unanimously accepted. For example, Sehgal et al. (2018), employing temporal fluctuations Copula GARCH models, documented that the connection with the foreign exchange market was small in the South Asian region between January 6, 2004, and March 31, 2016. In addition, the SAARC area seems prone to forming speculative bubbles, characterized by the sudden increase in the prices of financial assets, followed by their sudden decrease (Liaqat et al., 2020; Nazir et al., 2020; Tran, 2017).
Wavelet analysis simultaneously enhances the relationship between GPR and stock returns in terms of timing and frequency areas. Wavelet transforms generate a one-dimensional time series that allows for the achievement of research objectives. Because of its advantages over classical statistical methods, wavelet analysis is frequently used in the study of financial time series (Bouri et al., 2020; Chien et al., 2021; Li et al., 2022, 2024). This study used two analysis tools based on a continuous wavelet transform: wavelet coherence and wavelet phase difference.
Taking the gaps indicated in the literature as a starting point, the goals of the research are as follows: (i) evaluate the dynamic movements involving the SAARC member states’ stock markets by applying wavelet analysis, (ii) estimate the intensity of the relationship between GPR events and the volatility of stocks in the analyzed states, and (iii) use the time-varying parameter vector autoregression (TVP-VAR) and spatial autoregressive model (SAR) for establishing dynamic volatility connectedness between markets in the analysis period.
The article proceeds as follows. Section 2 presentss the literature on GPR and stock volatility in the SAARC states. Section 3 presents the data, series, and techniques applied. Sections 4 and 5 present the outcomes and connections, respectively, of similar studies. Section 6 presents the conclusions, limitations, and possible future research directions.
2 Literature Review
Stock volatility refers to the risk of price change caused by continuous adjustments to new information. Early literature demonstrates how periods of high uncertainty affect financial markets, the behavior of market agents, and, implicitly, the evolution of economies (Antonakakis et al., 2014; Brogaard & Detzel, 2015; Singh et al., 2023). During episodes of high volatility, the tradeoffs between volatility and financial stress increase in different geographic regions (Johansson, 2008). Moreover, periods characterized by high levels of uncertainty reduce returns (Arouri et al., 2016).
We believe that the GPR index can be used in SAARC states to cover major geopolitical events, such as the Tripura rebellion (1989–present), the communist war in Afghanistan (1989–1992), ethnic conflict in Nagaland (1993–present), Afghanistan War (2001–2021), war in North-West Pakistan (2004–present), the Islamic State–Taliban conflict (2015–present), India–Pakistan military confrontation (2016), republican insurgency in Afghanistan (2021–present), Afghanistan–Iran clashes (2021 and 2024), the 9/11 attacks in the USA, the Gulf War (1990–1991), annexation of the Crimean Peninsula (2014), terror attacks in Paris (2015), growing Syrian conflict (2011–present), USA–North Korea tensions over nuclear proliferation (2012–present), the proxy war between Qatar and Saudi Arabia (2011–present), USA–China tensions (2018–2020), the COVID-19 outbreak (2019), and the invasion of Ukraine (2022). The listed GPRs influenced stock markets in the SAARC region, increasing volatility and reducing financial market stability.
Most stock returns or volatility studies focus on a single SAARC member state. Following the research portals, we found that most research focuses on India (Chaudhary, 2021; Sreenu, 2023; Upadhyaya et al., 2023), followed by Pakistan (Rashid et al., 2022; Umar et al., 2023), Bangladesh (Sahabuddin et al., 2021), Sri Lanka (Maiti, 2019), and Nepal (Saud & Shakya, 2020). Although we found studies on stock returns that include one or more SAARC member states, they do not consider the organization (Habiba et al., 2020; Jebran & Iqbal, 2016; Morawakage et al., 2019; Shafiq et al., 2023).
Global or regional geopolitical events affect neighboring markets because of the contagion effect. Research, which intensified after the war in Ukraine, reveals that GPR events affect stocks (Raheem & Le Roux, 2023), commodities (Gong & Xu, 2022), gold (Adeosun et al., 2024), oil (Ahmed et al., 2023; He & Sun, 2024), energy (Böyükaslan et al., 2024; Mamman et al., 2024; Wang et al., 2024), and cryptocurrencies (Aysan et al., 2019; Singh et al., 2022). GPR’s emergence caused investors to migrate to heaven assets (Elsayed et al., 2022) for protection against risk. In general, research in the SAARC region has examined the contagion effect from developed markets. For example, Aziz et al. (2021) examined the spread of volatility from the USA to the stock markets of SAARC member countries, including Pakistan, India, Bangladesh, and Sri Lanka, using an EGARCH model. According to the authors, the spillover effect varied over time and was negative in most SAARC states. Bangladesh’s stock market was the most impacted, whereas Pakistan’s stock market volatility did not depend on the forecast horizon.
Studies addressing the influence of GPR events on SAARC states have shown contradictory results. Chaudhry et al. (2018) studied the effects of terrorism on stocks in India, Bangladesh, Sri Lanka, and Pakistan. They argue that Sri Lanka and Bangladesh were less affected than Pakistan and India. Arya and Singh (2022) examined four SAARC states (India, Sri Lanka, Pakistan, and Bangladesh) between February 2013 and March 2021, demonstrating that the COVID-19 pandemic negatively influenced stock returns in the analyzed countries. According to Gajurel and Chawla (2022), SAARC states are the least studied and unexplored of Asian markets. Yang et al. (2021) reported a similar perspective, highlighting the paucity of studies on equity volatility in emerging markets.
Although the previous paragraphs summarized the research progress on the interconnection between GPR events and volatility in the SAARC states, literature on this topic is scarce. To the best of our knowledge, no previous research examined the relationship between GPR events and the volatility of SAARC stock markets over the period under review. Studying stock volatility in the SAARC area is crucial for better understanding local and regional financial markets, risk management, and supporting sustainable economic growth in this complex and diverse region.
3 Data and Methodology
To determine volatility, we collected the daily closing prices of the benchmark for each SAARC state. We secured the daily rates from the Investing platform (https://www.investing.com) for the period from January 1, 2014, to March 5, 2024. We collected daily data using the platform (https://www.matteoiacoviello.com/gpr.htm) for the GPR index. The start date is based on the 45th Session of the SAARC Programming Committee. The closing date corresponds to its 59th session at Kathmandu (https://www.saarc-sec.org), a landmark event in the process of regional cooperation in South Asia. We identified data for five of the eight South Asian countries that constitute SAARC. No observations were available for Bhutan and Afghanistan. In the case of Maldives, the Maldives Stock Exchange Index (MASIX) does not include daily observations, which could have led to erroneous results. The benchmarks for this study are listed in Table 1.
The selected indices
| State | Index |
|---|---|
| Bangladesh | DSE30 |
| India | SENSEX30 |
| Pakistan | KSE |
| Sri Lanka | CSE |
| Nepal | NEPSE |
We conducted the research to generate accurate and reliable results. The research involved going through several stages. In the first stage, equal time series were compiled for each state’s stock exchange volatility and the GPR index. Subsequently, a pair of series were formed between the volatility of the indices and the GPR index. In the second step, we ran stationarity and multicollinearity tests. In the third step, we applied the wavelet transform between the pair of series. In the fourth stage, we realized the phase differences between the series pairs to establish the leading variable and the type of correlation between the variables at different frequencies. The verification of the results was carried out in the last stage to determine the dynamic connectedness of volatility in the analyzed states.
The natural logarithm of the daily closure values was considered to determine volatility. Daily returns were calculated as the initial difference of the converted series
where R i,t is the index return volatility, and Index t and Index t–1 are the closing stock market index prices on consecutive days.
Similar to the normal augmented Dickey–Fuller (ADF) unit root, Phillips Peron (PP) and Kwiatkowski–Phillips–Schmidt–Shin test statistics (KPSS) testing against stationarity are typically conducted with transient dynamics added to the model specification. Subsequently, the empirical regression model can be expressed as follows (Phillips et al., 2015):
where the number of time observations and cross-sectional units are represented as i = 1, …, N, t = 1, …, T, and M is the number of regressors.
The wavelet coherence framework was used in this study due to the advantages it implies compared to classical time series processing models. Widely used in recent years in the study of volatility, wavelet coherence can capture dynamic changes, non-linear relationships, and volatility at different temporal and frequency scales (Mensi et al., 2021; Nasir & He, 2023). A finite interval function is used to create
where m is a scale factor considering the expansion of
A simple wavelet function
Several wavelet coefficients Z, which depend on the scaling and location parameters, are the outcomes of the CWT. In the time-frequency domain, the CWT ascertains how the two variables interact (Torrence & Compo, 1998):
where S denotes a smoothing parameter. The value of
To highlight positive or negative correlations, the wavelet phase difference proposed by Bloomfield et al. (2004) was established using the following relationship:
where Im represents the imaginary parts, and Re represents the real parts.
Wavelet analysis can reflect the subtle changes and characteristics of the connection between GPR and stock volatility in the time–frequency field, allowing us to simultaneously analyze the strength of the link and the varying characteristics of stock returns at different frequencies. Co-movement between x and y is based on the phase difference
We used the TVP-VAR test proposed by Antonakakis and Gabauer (2017) derived from the model developed by Diebold and Yılmaz (2014), which allows the variations to evolve via a stochastic Kalman filter estimation (Koop & Korobilis, 2014). The improved version that was insensitive to the outliers’ model, avoiding the loss of observations, was applied (Antonakakis et al., 2020). The choice of the test was based on the advantages generated, compared with classical models such as the Granger causality test, correlation coefficient, Copula, and rolling-window VAR model (Kaur & Mittal, 2023; Liu & Shigeyuki, 2021; Zhao et al., 2022). The model has been preferred in the study of stock volatility in recent years (He & Sun, 2024; Jana & Sahu, 2023). The test involves the application of several relationships presented as follows:
and
where X
t
are
The dynamic connectedness index uses generalized forecast error variation decompositions (GFEVD) (Pesaran & Shin, 1998). The step error variance h in forecast variable i is due to shocks to variable j
where h-step ahead GFEVD is represented by
The spillover transmitted by the variable i to all variables j, or the total directional connection TO others, is determined by the relation:
The spillover received by variable i from other variables j, or the total directional connection FROM others, is as follows:
The difference between variables TO and FROM has the significance of the total NET directional connection:
Finally, we completed the analysis with the SAR to capture the cross-border influences generated by the shocks of a GPR event on stock markets in neighboring countries. According to the model, the volatility of an index was influenced, in addition to the independent variables, by the dynamics of the stock market indices of the SAARC member countries, according to the relationship (Qu, & Lee, 2015):
where y is the vector of the dependent variable, W is the matrix of spatial weights that captures the relationships between neighboring countries, ρ is the spatial autocorrelation coefficient, X is the matrix of independent variables, β is the vector of coefficients for the independent variables, and ε is the vector of error terms.
Table 2 presents the descriptive statistics of the stock indices. All analyzed series exhibit excess kurtosis. High amplitude values are recorded in the DSE30 index (726.426), followed by SENSEX30 (30.642) and CSE (20.047), while the lowest amplitude is identified in the NEPSE index (8.109). The Jarque-Bera test determines a dataset’s skewness and kurtosis, indicating the distribution’s shape. In the case of the analyzed series, the test’s null hypothesis is rejected, confirming that the series significantly differs from a normal distribution.
Descriptive statistics
| Indicator | DSE30 | SENSEX30 | NEPSE | KSE | CSE |
|---|---|---|---|---|---|
| Mean | 0.00024 | 0.00040 | 0.00030 | 0.00028 | 0.00017 |
| Maximum | 0.53462 | 0.08594 | 0.05884 | 0.06048 | 0.06927 |
| Minimum | −0.51697 | −0.14101 | −0.06226 | −0.07102 | −0.08444 |
| Standard deviation | 0.01781 | 0.00936 | 0.01133 | 0.00953 | 0.00885 |
| Skewness | 9.00672 | −1.49091 | 0.45748 | −0.55626 | −0.82645 |
| Kurtosis | 726.4266 | 30.6425 | 8.10954 | 9.28152 | 20.04705 |
| Jarque-Bera | 68339 | 10087.6 | 3516.269 | 5310.733 | 38280.11 |
| Probability | 0.0000 | 0.0000 | 0.0000 | 0.0000 | 0.0000 |
| Sum | 0.76682 | 1.27859 | 0.95069 | 0.89762 | 0.54775 |
| Sum squared deviation | 0.99345 | 0.27459 | 0.40249 | 0.28484 | 0.24544 |
| Observations | 3,132 | 3,132 | 3,132 | 3,132 | 3,132 |
The excess kurtosis highlights the increased risk of extreme movements and suggests that standard risk models, which assume a normal distribution, might underestimate the risks associated with GPR events. Excess kurtosis reflects heightened volatility and the intensified connection between GPR events and stock market volatility.
4 Results
To apply the wavelet method, the stationarity condition of the analyzed time sequence should be satisfied. ADF, PP, and KPSS tests are applied to confirm the nature of time sequence data (Table 3). The tests allow the assessment of the unit root for each time series. The null hypothesis of the PP and ADF trials indicates the existence of the unit root in the series, while the KPSS test indicates the stationarity of the series. All constructed series exceed the stationarity condition.
Stationarity tests
| Index | ADF | PP | KPSS | |||
|---|---|---|---|---|---|---|
| t-Statistic | Prob. | Adj. t-Stat | Prob. | LM-Stat. | Prob. | |
| DSE30 | −65.48329 | 0.0001 | −79.17769 | 0.0001 | 0.2324 | 0.4418 |
| 1% | −3.43224 | −3.43224 | 0.739 | |||
| 5% | −2.86226 | −2.86226 | 0.463 | |||
| 10% | −2.5672 | −2.5672 | 0.347 | |||
| SENSEX30 | −56.87565 | 0.0001 | −56.87125 | 0.0001 | 0.0416 | 0.0148 |
| 1% | −3.43224 | −3.43224 | 0.739 | |||
| 5% | −2.86226 | −2.86226 | 0.463 | |||
| 10% | −2.5672 | −2.5672 | 0.347 | |||
| NEPSE | −36.17777 | 0.0000 | −54.37915 | 0.0001 | 0.1446 | 0.1342 |
| 1% | −3.43225 | −3.43224 | 0.739 | |||
| 5% | −2.86226 | −2.86226 | 0.463 | |||
| 10% | −2.5672 | −2.5672 | 0.347 | |||
| KSE | −35.47011 | 0.0000 | −52.38057 | 0.0001 | 0.1023 | 0.0927 |
| 1% | −3.43225 | −3.43224 | 0.739 | |||
| 5% | −2.862265 | −2.86226 | 0.463 | |||
| 10% | −2.5672 | −2.5672 | 0.347 | |||
| CSE | −48.09222 | 0.0001 | −49.93313 | 0.0001 | 0.1219 | 0.2691 |
| 1% | −3.43224 | −3.432249 | 0.739 | |||
| 5% | −2.86226 | −2.8622 | 0.463 | |||
| 10% | −2.5672 | −2.5672 | 0.347 | |||
Next, we made a time series of lengths equal to the number of observations in Table 2. We created pairs containing the GPR index, and the returns of every stock index were formed. In this way, five series pairs were obtained for which wavelet coherence and the wavelet coherence phase difference were applied.
The outcomes are presented as scalograms in Figure 1. Such graphs are frequently used to study the yield and volatility of financial assets (Aysan et al., 2023; Jiang & Yoon, 2020; Ziadat et al., 2024). The Ox axis represents the time (days), and the Oy axis represents the normalized frequency (coefficient between 0 and 1). Each graph contains a color gradient between dark blue (minimum value) and dark red (maximum value). Warm colors (toward red) signify high coherence, meaning a significant influence of GPR on the stock index at a certain frequency and time. Cool colors (toward blue) indicate low or no influence. Eight unidirectional arrows appear in each scalogram. The arrowhead (→) indicates that the time sequence is in phase (positively correlated), while (←) indicates that the sequence is outside of phase (negatively correlated). The arrowheads (↗) and (↙) show that the initial variable (GPR) has the leading function. The arrowheads (↘) and (↖) indicate the leading function for the second variable (stock returns). The arrowheads (↑) and (↓) indicate a phase shift of π/2 between the analyzed series.

Continuous wavelet transform of GPR and SAARC stock returns.
5 Discussion
Figure 1 shows a heterogeneous relationship between GPR and stocks in the SAARC states. A common feature of the states is the short-term appearance in the high normalized frequency band (0.0625–0.2) of many adjacent thin vertical regions. Sudden and unexpected geopolitical events cause quick reactions from investors. Strong coherences at high frequencies can manifest such events, but these do not last long. By contrast, if many investors decide to sell simultaneously in front of a perceived GPR, such behavior can cause the market to fall sharply. Such a panic reaction is often observed on scalograms at higher frequencies in the case of unexpected GPR events. Finally, some investors may see the rise in GPR as an opportunity to buy shares at low prices, anticipating a quick investment recovery after the risks subside. Investor behavior can temporarily reverse downtrends, as seen in the short-term scalogram. Such fluctuations are normal in the stock market and denote the self-adjustment of the market to GPR events of less importance (Chen, 2023; Yu et al., 2015).
The red regions in the scalograms for Pakistan, Sri Lanka, and Nepal indicate that the engagement between GPR and stock returns varies on the investment horizon (Agyei, 2023). In case of persistent geopolitical risks, investors can adjust investment strategies, leading to structural changes in the market, as reflected in the scalogram by strong coherences at lower frequencies. Finally, the media and market sentiment play an important role in amplifying the perception of GPR risk. Investors are more likely to react if the media heavily covers a negative political event, which can influence the market more than the GPR event itself.
5.1 GPR and Bangladeshi Stocks
Figure 1 shows how GPR and stock returns are traded off in Bangladesh. The heatmap is mostly blue, indicating periods when the GPR did not significantly influence the stock index DSE 30 during the sampling period. Average coherence is observed in the lower-left quadrant during 2014–2016, suggesting the impact of GPRs (the political rivalry between the Awami League and Bangladesh National Party) on the financial market. The series are negatively correlated, and the leading role belongs to the GPR. Weak coherence determined by a cloud of small arrows is observed in the lower-right quadrant throughout the COVID-19 pandemic. News about the spread of the virus affected stock returns from the beginning of the pandemic until early 2021. The arrowheads continuously point to the right in the intermediate term, suggesting a favorable association. A permanent relationship between variables cannot be identified in the short term, and the arrows are oriented differently. One interesting aspect is the similar evolution of stock markets in Bangladesh and India. The trade between the two states may have influenced the muted effect of stock volatility in Bangladesh. China and India, the largest importers, are known to affect Bangladeshi stock market performance (Gajurel & Chawla, 2022; Uddin et al., 2020). These results reveal that Bangladeshi stocks acted as long-term diversifiers during the period, especially between 2014 and 2020.
5.2 GPR and Indian Stocks
For India, the heat map is mostly blue, except for some yellow-orange arrow islands in the low- and medium-normalized frequency bands. Average coherence was recorded during 2014–2016, marked by a negative correlation between GPR and Indian stocks. A similar situation emerged between the second half of 2018 and 2021, possibly caused by the ongoing Tripura rebellion or ethnic conflict in Nagaland. After the onset of the pandemic in 2020 until the end of the sample period, a negative relationship was observed between GPR and stocks in India. This link can be attributed to the war in Ukraine, which began in February 2022. Singh and Ahmed (2016) suggested that a change in the dynamics was observed in the correlation of South Asian least-developed countries’ exchange rates with China after the global financial crisis.
Contrary to Agyei’s study (2023), our results demonstrate that at the start of the conflict in Ukraine, GPRs led Indian stocks. Still, the relationship was positive only at the beginning of the pandemic in the medium-frequency band and negative otherwise. Compared with Bangladeshi stocks, Indian stocks offer medium-term hedging potential. These dynamics allow risk-averse investors to diversify their portfolios.
5.3 GPR and Pakistani Stocks
The bottom-left quadrant of the chart contains a consistent red region in the average-normalized frequency band. In 2014–2018, a negative correlation between GPR and stocks was observed due to the India–Pakistan military confrontation. In the same frequency band, a small red positively correlated region is noted from the end of 2023 until the end of the sampling timeframe. We believe that this represents the effect of the war in Ukraine, which had a smaller impact on the Pakistani stock market than on the Indian stock market.
A comparative analysis of the scalograms of India and Pakistan leads to the identification of commonalities. The scalograms’ size and the arrows’ orientation reveal that the arrival of GPR news similarly impacts the volatility of both stock markets. We extended the evidence presented by Ahmed and Hussain (2014) to the documented period. Moreover, we agree that Indian stock market volatility is more moderate to the occurrence of GPRs, whereas its effect on Pakistan’s capital markets is more pronounced. Khan et al. (2022) demonstrated that terrorism has a substantial effect on Pakistani stock returns and volatility over the period ranging from October 7, 1999, to May 31, 2016. We believe that the authors’ conclusions are correct and can be extended to 2023. In the same direction, the results presented by Aslam et al. (2021) assessed the effect of terrorism on stock market volatility in Pakistan over 18 years (2000–2018). In this case, our results confirm their conclusions that the GPR index was more comprehensive. Regarding the stock market in Pakistan, our results can be used as hedging or safe-haven possibilities according to the indicated time frequencies. In summary, Pakistani stocks offer opportunities for long-term diversification throughout the sample period, especially between 2014 and 2019, and for medium-term hedging.
5.4 GPR and Sri Lankan Stocks
Sri Lanka’s heat map is marked in red. The link between GPR and Sri Lankan stocks was the strongest. A negative relationship between GPR and stocks is found throughout the analysis period, increasing in intensity from 2019 until the end of the analysis period. We believe this is because Sri Lanka still faces an economic crisis that strongly impacts the stock market (https://www.hrw.org). Our results complement those of Li et al. (2023), who highlight the oil supply risk of Southeast Asian nations and demonstrate that Sri Lanka and Nepal are particularly vulnerable to oil supply disruptions and that the Maldives, Nepal, and Sri Lanka are at low risk. Their results can be extended to the risk of GPRs in Nepal and Sri Lanka. Investors become more careful with their investments, especially during GPR events, and seek safer assets.
5.5 GPR and Nepali Stocks
Another state affected by GPR during the analysis period is Nepal. Although the relationship between the variables is negative, the intensity with which stocks in Nepal react to GPR is much lower but continuous, as indicated by the yellow-red band near the Ox axis. As of 2019, GPR was leading the stocks in Nepal. Considering these aspects, China’s financial market may influence the volatility in the scalograms related to these states. GPRs negatively affect trade (Yang et al., 2021). Therefore, consistent with Adhikary (2017), we support the idea that international trade accentuates the effect of GPR on financial markets. Both negative and positive effects of China’s financial market may be amplified in SAARC states. The effect of GPR is greater in economies with higher investment levels (Khraiche et al., 2023). The stock dynamics in Nepal provide an opportunity for fixed-income investors to hedge GPR risks over the medium term. Additionally, the possibility of long-term hedging is noted throughout the sampling period.
Limited space prevents us from commenting on all the GPR events in the literature synthesis. We consider it appropriate to extract two frequently encountered events in the SAARC area: terrorist attacks and casualties (Aslam et al., 2021; Chaudhry et al., 2018). Graphs were constructed using the data downloaded from The Global Terrorism Database™ (GTD) (https://www.start.umd.edu/gtd). GTD observations include details on the incidents’ date and location, weapons utilized, and the number of casualties. Figure 2 depicts the relationship between the two retained variables and their effects on volatility.
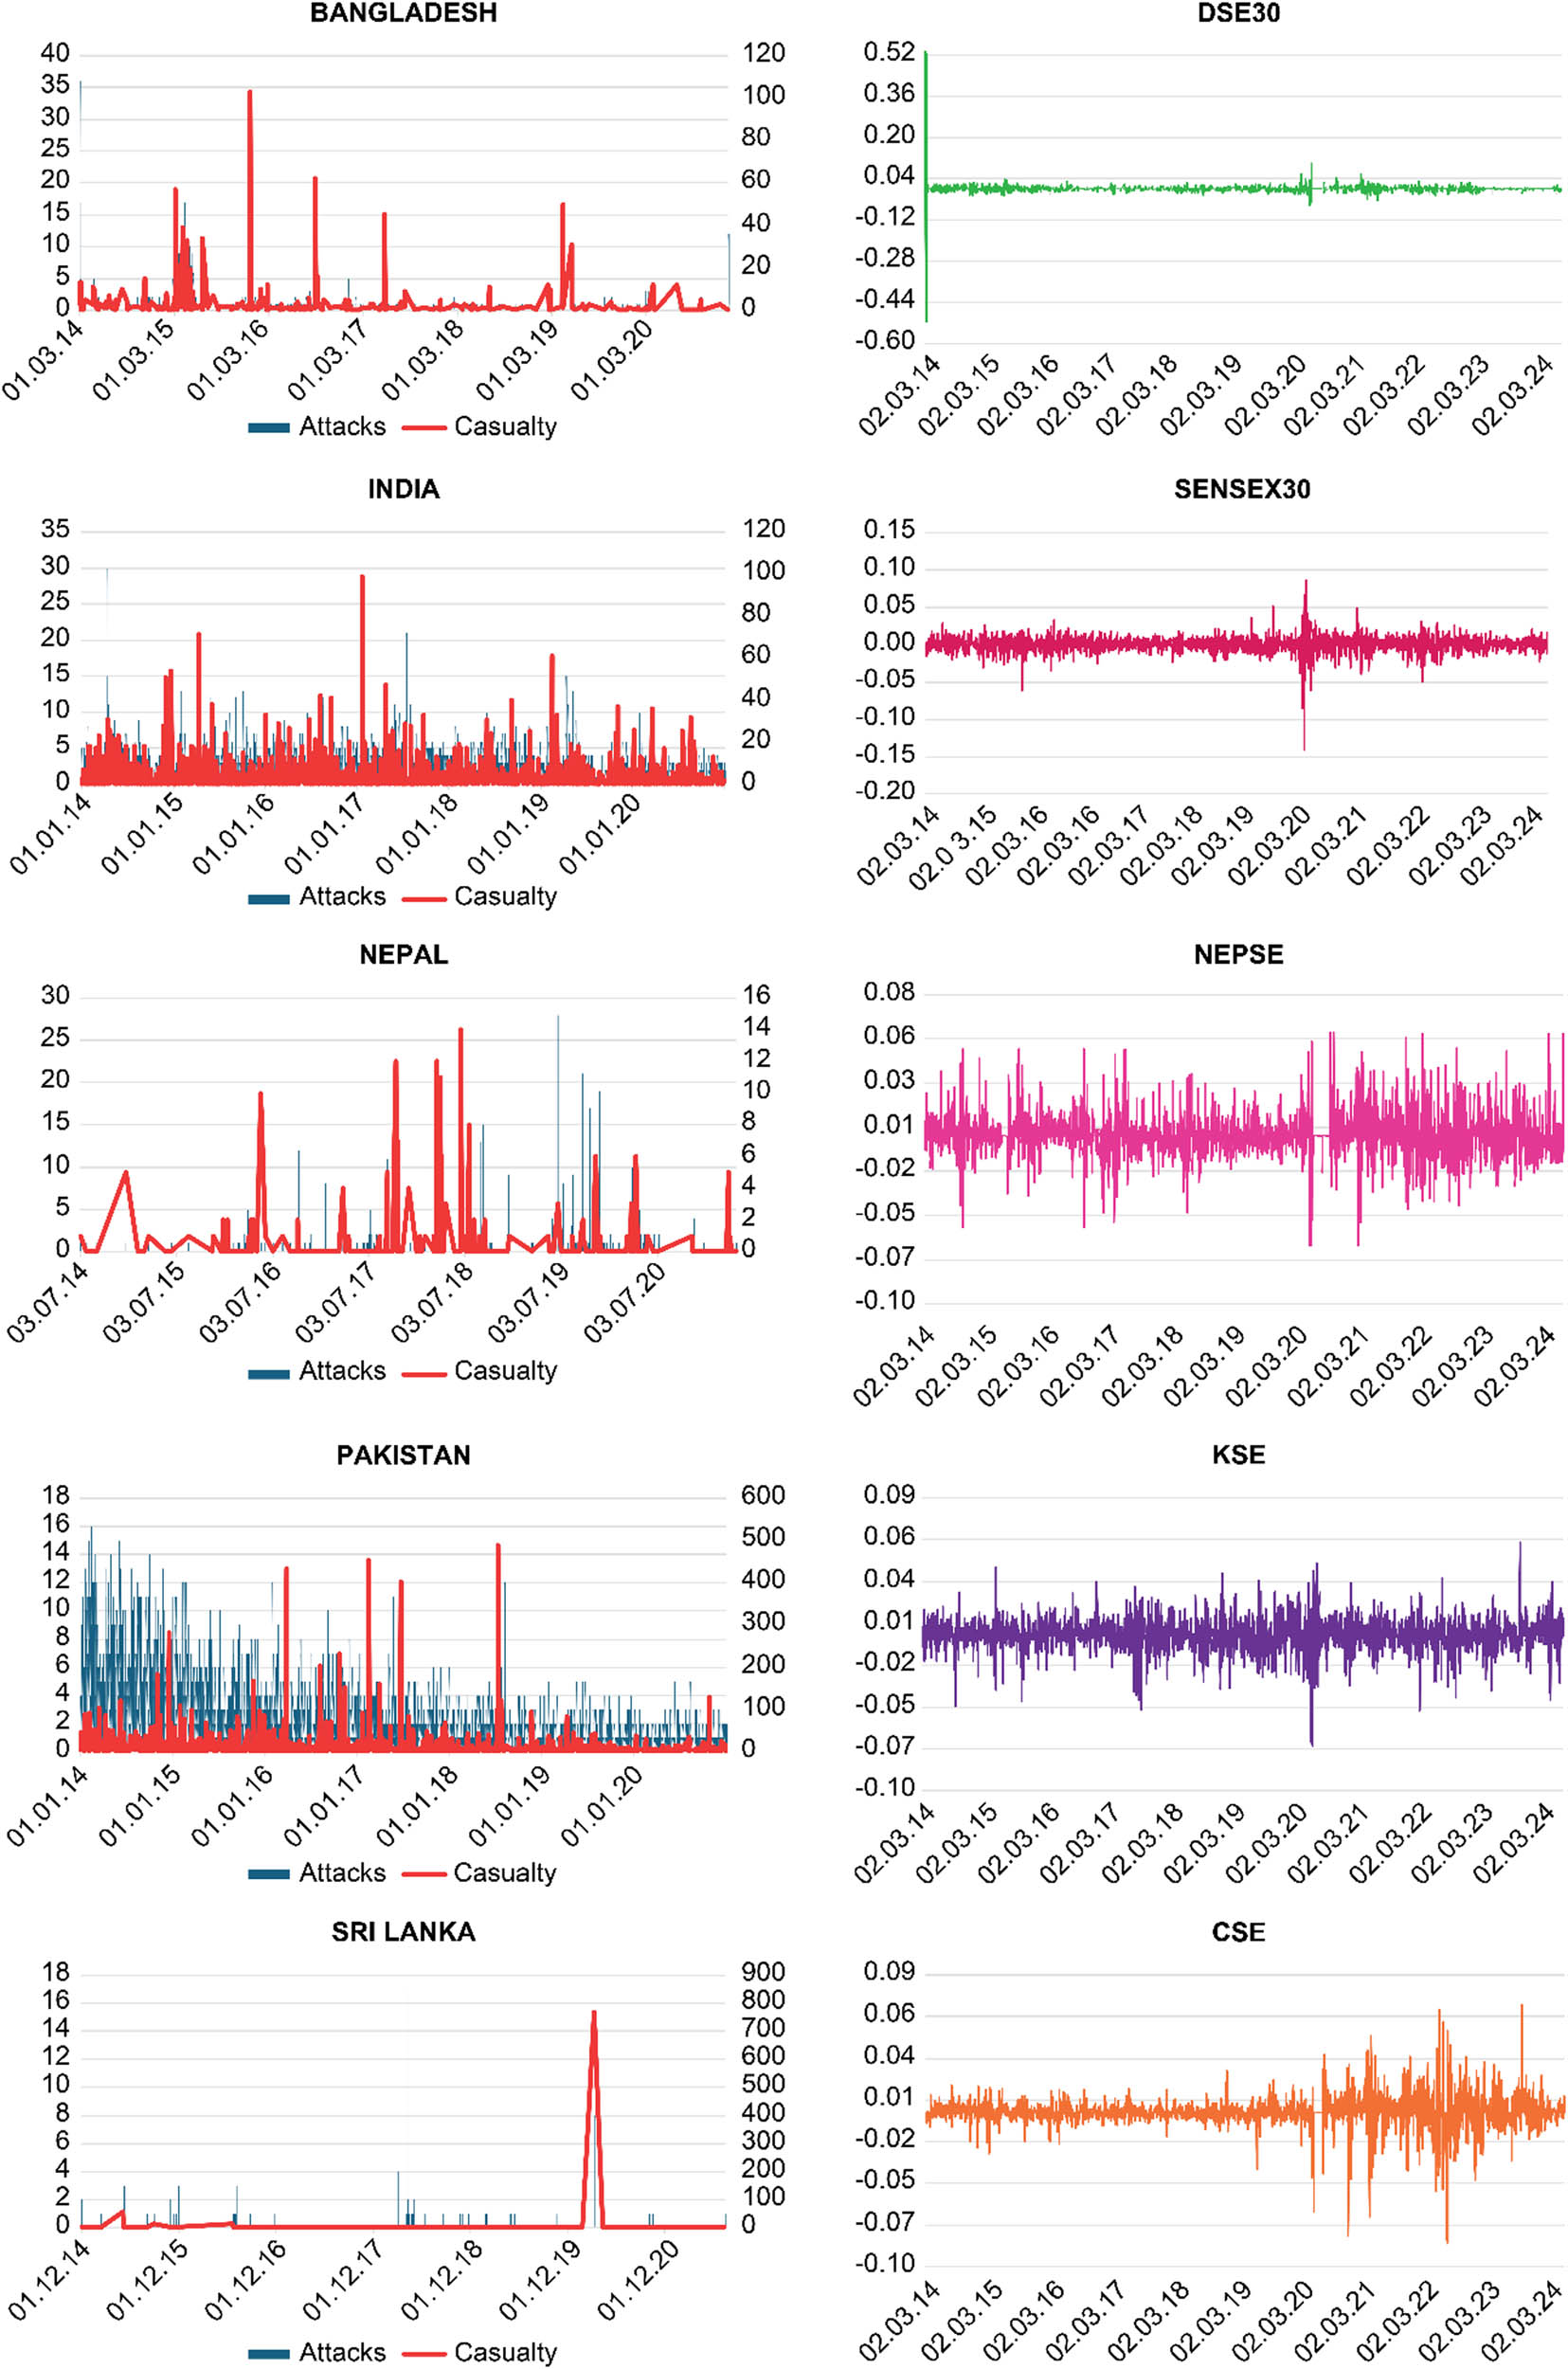
Daily attacks and casualties (left column) and index volatility (right column).
5.6 Robustness Test
We applied robustness tests to ensure that the models used are reliable, accurate, and applicable under various conditions. Table 4 provides the average dynamic connectivity values for selected index volatilities in our sample and GPR using the TVP-VAR-based connectivity approach with 10-step ahead forecasts.
Averaged dynamic connectedness
| Bangladesh | India | Nepal | Pakistan | Sri Lanka | GPR | FROM | |
|---|---|---|---|---|---|---|---|
| Bangladesh | 96.3 | 0.67 | 0.77 | 0.92 | 0.67 | 0.68 | 3.70 |
| India | 1.09 | 94.69 | 0.65 | 2.48 | 0.78 | 0.31 | 5.31 |
| Nepal | 0.76 | 0.31 | 97.18 | 0.41 | 0.43 | 0.91 | 2.82 |
| Pakistan | 1.39 | 2.44 | 0.69 | 93.53 | 1.54 | 0.41 | 6.47 |
| Sri Lanka | 1.05 | 0.78 | 0.66 | 1.55 | 95.30 | 0.66 | 4.70 |
| GPR | 1.07 | 0.25 | 0.85 | 0.31 | 0.50 | 97.02 | 2.98 |
| TO | 5.36 | 4.45 | 3.62 | 5.67 | 3.92 | 2.97 | 25.99 |
| NET | 1.66 | −0.86 | 0.79 | −0.80 | −0.78 | −0.01 | 4.33 |
Notes: FROM is the average total directional connectedness received from other countries; TO is the average total directional connectedness contributed to other countries; and NET is the average total net connectedness.
The results indicated that the connectivity among SAARC markets, represented by the total connectivity index, is 4.33%. Consequently, a small percentage (approximately 4%) of the variation in one of the SAARC markets is outlined by the connection between the GPR and the markets analyzed. This confirmed the conclusion drawn by Sehgal et al. (2018) regarding low connectivity between South Asian states. The NET row in Table 4 shows that Bangladesh (+1.66%) and Nepal (+0.79%) were spillover transmitters, while India (−0.86%), Pakistan (−0.8%), and Sri Lanka (−0.78%) were net recipients. That three out of five markets are net gainers reveals that they provide a possible hedge in providing some opposition to the shocks induced by GPR.
Figure 3 shows the evolution of the dynamic connection of total volatility. We see that the interconnectedness of risks fluctuates over time, considering major events that have substantially impacted the SAARC region. Our findings demonstrate variable features over the sampling period, which were significant only during GPR events. Outside of them, the level of connectivity is reduced. Under these conditions, it is important to understand the dynamics of connections between SAARC markets during periods of turbulence. These results implied that GPR events can reduce diversification benefits among SAARC-area stocks. Without proper hedging strategies, investors are exposed to high risk and vulnerability.

Dynamic total connectedness.
In the continuation of the analysis, we obtained a useful picture to understand the regional interdependencies within SAARC and to identify how attacks, casualties, and GPR affect the capital markets in each SAARC member state. The results of applying the SAR model are presented in Figure 4.
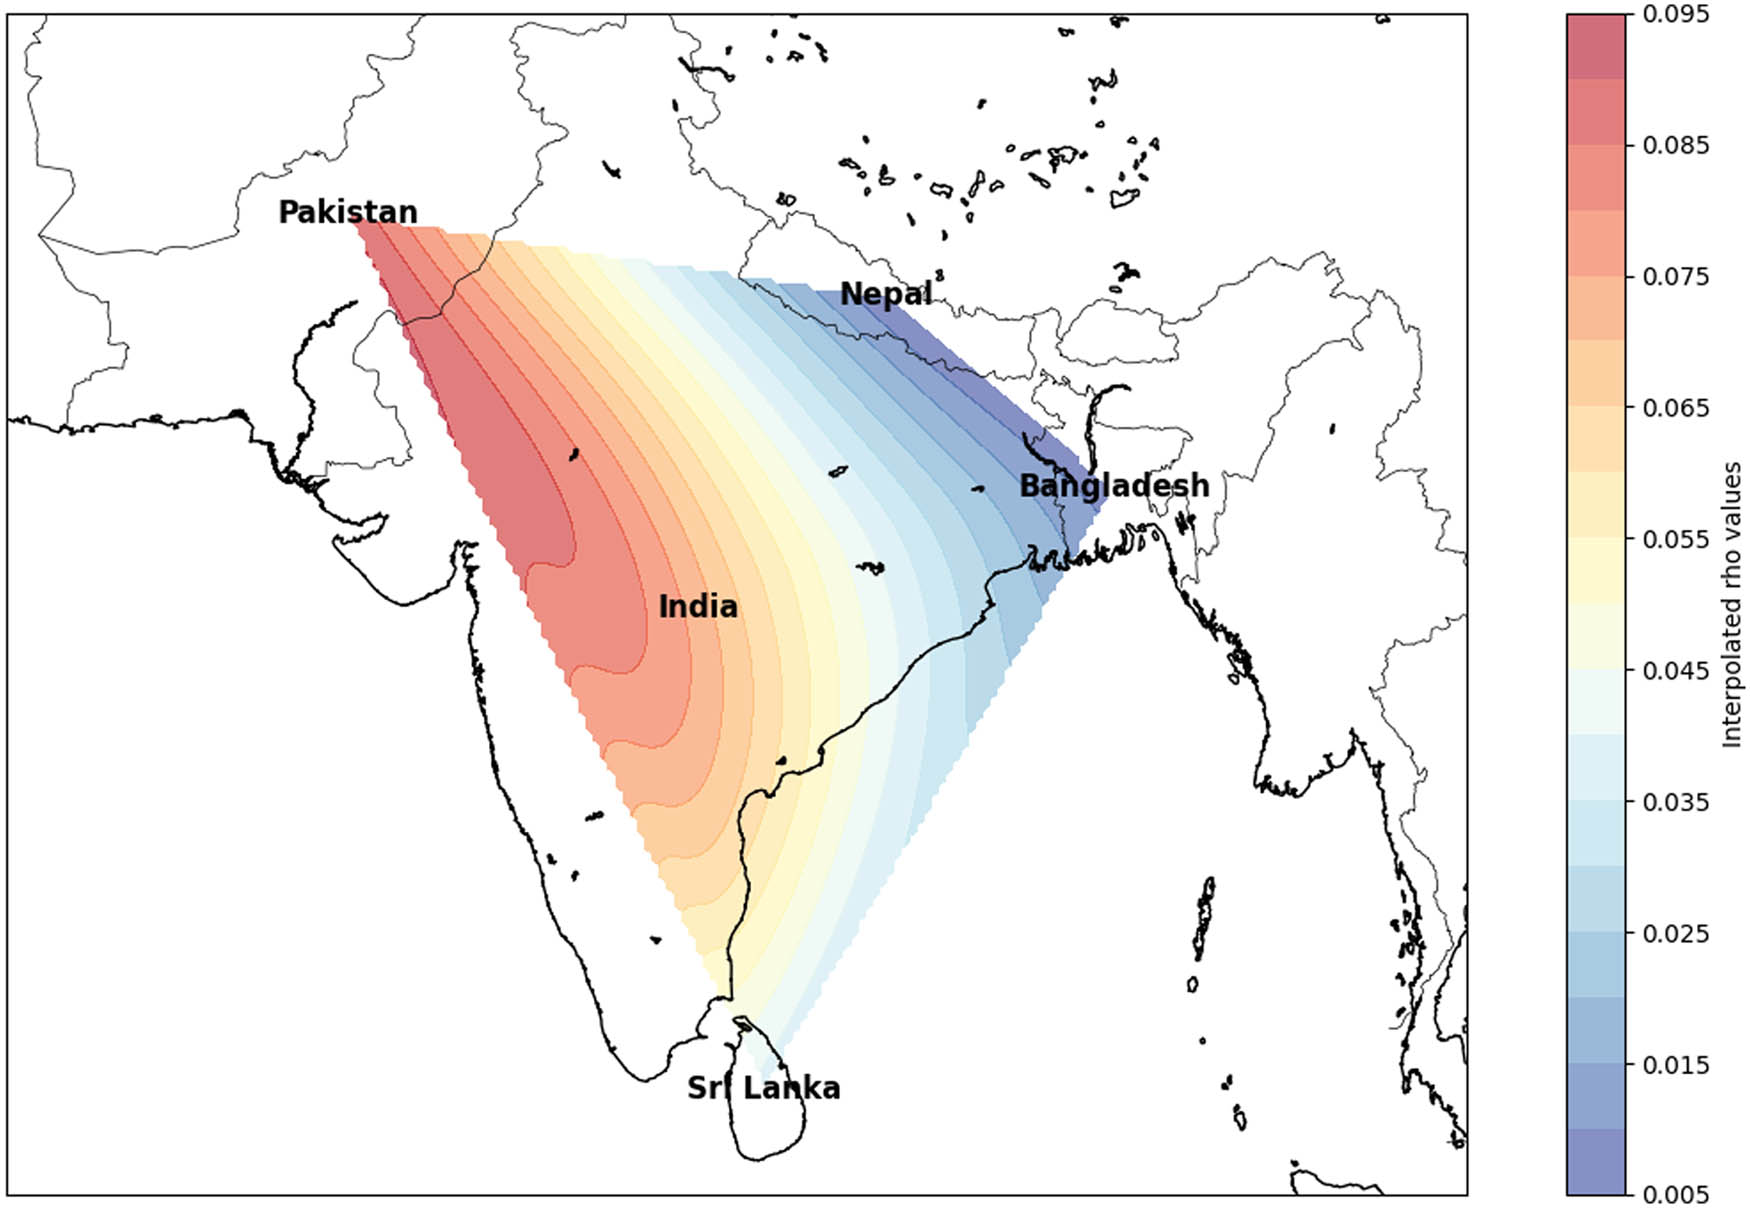
Interpolated spatial SAR results for SAARC countries. Source: Authors own elaboration.
In Figure 4, the areas with red colors and more intense shades indicate a higher volatility of the stocks. Areas colored in blue indicate lower volatility, suggesting that markets in these regions are less affected by GPRs. A clear geographic correlation is observed in the impact of GPR on stock volatility. Regions closer to Pakistan and western India are more affected, probably due to their proximity to areas of greater geopolitical tension.
Through this research, we contribute to the literature in several ways. We provide information related to the impact of GPR on an area scarcely studied in the literature. During the review, we present evidence of GPR events heterogeneously influencing stock markets across SAARC states. The TVP-VAR robustness test, conducted to determine the spread of volatility across SAARC states, indicates that GPR events influence stock returns and volatility. We also reveal the level of interconnections between the analyzed states. This evidence may be useful for SAARC management, national market regulators, portfolio managers, and investors.
6 Conclusions and Implications
Using the wavelet method, this study examined the impact of GPR events on stocks in SAARC states between January 1, 2014, and March 5, 2024. In the second part of the work, we extracted two frequently encountered events in the SAARC area – terrorist attacks and casualties – and presented their effect on stock volatility and employed the TVP-VAR connectedness test and the SAR model to analyze the dynamic connection across GPR events and SAARC stock market volatility. The results can be summarized as follows. First, the GPR events we studied affected the stock markets heterogeneously. We find a similar evolution of the stock markets in Bangladesh and India and discover common elements in the reactions of the Indian and Pakistani markets. However, we can conclude that the effect of GPR on Pakistan’s stock market is more pronounced. Second, the link between GPR and Sri Lankan stocks is the strongest. The relationship between GPR and the Nepali stock market was continuous and low-intensity throughout the sample period. Finally, the level of dynamic connectedness between SAARC states was low during the analysis period.
The implications of this research for SAARC leadership, member-state governments, financial market decision-makers, and investors are as follows. First, this study provides valuable insights into the hedging and diversification decisions of SAARC stock investors against the uncertainty of GPR events. We contribute to the correct substantiation of portfolio modeling decisions and the choice of risk management strategies when GPR events occur. Second, the results are useful to governments in two ways: limiting local GPR events and protecting against global or regional ones. Simultaneously, the results can inform financial market authorities, enabling them to design and develop regulations to prevent capital losses and ensure investor protection. Finally, investors and portfolio managers can use the results to manage funds and protect against GPR. The impact of GPR events on stock markets may enable SAARC governments to bridge political differences so that South Asia becomes a strong partner in the global economy. A controlled volatility can attract more foreign direct investment, which is crucial for the region’s economic development. SAARC countries, being developing, need foreign investment to boost their economic growth.
Our research had certain limitations, given the size and complexity of the SAARC region. Additionally, there was limited prior literature to draw upon, as most research focuses on a single state. The lack of daily information on the Maldives over the entire sampling period affected the complete analysis. The exclusion of Bhutan and particularly Afghanistan due to insufficient stock market data may have significant implications for the representativeness of the results. This can lead to underestimating systemic or idiosyncratic risks and conclusions that do not fully reflect the region’s volatility. To address these limitations, future research should consider using alternative methods, such as analyzing the informal economy or including economic and political indicators. Given the region’s proximity to China, the state stock markets may be significantly influenced, which presents a different direction for future research.
Acknowledgements
The authors are thankful to the chief editor, and the two anonymous reviewers whose constructive suggestions improved the quality of the manuscript.
-
Funding information: Authors state no funding involved.
-
Author contributions: All authors have accepted responsibility for the entire content of this manuscript and consented to its submission to the journal, reviewed all the results and approved the final version of the manuscript. Conceptualization, CG, OP, and EC; methodology, CG, OP, and EC; software, CG, OP, and EC; validation, CG, OP, and EC; formal analysis, CG, OP, and EC; investigation, CG, OP, and EC; resources, CG, OP, and EC; data curation, CG, OP, and EC; writing – original draft preparation, CG, OP, and EC, writing – review and editing, CG, OP, and EC; visualization, CG, OP, and EC; supervision, CG, OP, and EC.
-
Conflict of interest: Authors state no conflicts of interest.
-
Data availability statement: The data presented in this study are available on reasonable request from the corresponding author.
-
Article note: As part of the open assessment, reviews and the original submission are available as supplementary files on our website.
References
Adeosun, O. A., Anagreh, S., Tabash, M. I., & Vo, X. V. (2024). Return and volatility transmission among economic policy uncertainty, geopolitical risk and precious metals. Studies in Economics and Finance. doi: 10.1108/sef-10-2023-0586.Search in Google Scholar
Adhikary, B. K. (2017). Factors influencing foreign direct investment in South Asian economies: A comparative analysis. South Asian Journal of Business Studies, 6(1), 8–37.10.1108/SAJBS-10-2015-0070Search in Google Scholar
Agyei, S. K. (2023) Emerging markets equities’ response to geopolitical risk: Time-frequency evidence from the Russian-Ukrainian conflict era. Heliyon, 9(2), e13319.10.1016/j.heliyon.2023.e13319Search in Google Scholar
Ahmed, Q. N., Rizvi, S. A. A., Naeem, H. A., & Ahmed, S. (2023). Is oil prices volatility taking toll: Sectoral analysis of Pakistan stock exchange. Journal of Organisational Studies & Innovation, 10(3), 1–16.10.51659/josi.22.177Search in Google Scholar
Ahmed, S., & Hussain, S. M. (2014) The financial cost of rivalry: A tale of two South Asia neighbors. Emerging Market Finance and Trade, 50(suppl. 3), 35–60.10.2753/REE1540-496X5003S303Search in Google Scholar
Antonakakis, N., Chatziantoniou, I., & Filis, G. (2014). Dynamic spillovers of oil price shocks and economic policy uncertainty. Energy Economics, 44, 433–447.10.1016/j.eneco.2014.05.007Search in Google Scholar
Antonakakis, N., Chatziantoniou, I., & Gabauer, D. (2020). Refined measures of dynamic connectedness based on time-varying parameter vector autoregressions. Journal of Risk and Financial Management, 13, 84. doi: 10.3390/jrfm13040084.Search in Google Scholar
Antonakakis, N., & Gabauer, D. (2017). Refined measures of dynamic connectedness based on TVP-VAR. University Library of Munich.Search in Google Scholar
Arouri, M., Estay, C., Rault, C., & Roubaud, D. (2016). Economic policy uncertainty and stock markets: Long-run evidence from the US. Finance Research Letters, 18, 136–141.10.1016/j.frl.2016.04.011Search in Google Scholar
Arya, V., & Singh, S. (2022). Dynamics of relationship between stock markets of SAARC countries during COVID-19 pandemic. Journal of Economic and Administrative Sciences. doi: 10.1108/JEAS-10-2021-0213.Search in Google Scholar
Aslam, F., Kang, H. G., Mughal, K. S., Awan, T. M., & Mohmand, Y. T. (2021). Stock market volatility and terrorism: New evidence from the Markov switching model. Peace Economics, Peace Science and Public Policy, 27(2), 263–284.10.1515/peps-2020-0005Search in Google Scholar
Aysan, A. F., Demir, E., Gozgor, G., & Lau, C. K. M. (2019). Effects of the geopolitical risks on Bitcoin returns and volatility. Research in International Business and Finance, 47, 511–518.10.1016/j.ribaf.2018.09.011Search in Google Scholar
Aysan, A. F., Muğaloğlu, E., Polat, A. Y., & Tekin, H. (2023). Whether and when did bitcoin sentiment matter for investors? Before and during the COVID-19 pandemic. Financial Innovation, 9, 124. doi: 10.1186/s40854-023-00536-9.Search in Google Scholar
Aziz, T., Marwat, J., Mustafa, S., Zeeshan, A., & Iqbal, Y. (2021). Linkage between US financial uncertainty and stock markets of SAARC Countries. The Journal of Asian Finance, Economics and Business, 8(2), 747–757.Search in Google Scholar
Bloomfield, D. S., McAteer, R. J., Lites, B. W., Judge, P. G., Mathioudakis, M., & Keenan, F. P. (2004). Wavelet phase coherence analysis: Application to a quiet-sun magnetic element. The Astrophysical Journal, 617, 623–632.10.1086/425300Search in Google Scholar
Bouri, E., Shahzad, S. J. H., Roubaud, D., Kristoufek, L., & Lucey, B. (2020). Bitcoin, gold, and commodities as safe havens for stocks: New insight through wavelet analysis. The Quarterly Review of Economics and Finance, 77, 156–164.10.1016/j.qref.2020.03.004Search in Google Scholar
Böyükaslan, A., Demirer, R., Ergüney, E. B., & Gursoy, S. (2024). Geopolitical risks and the energy-stock market nexus: Evidence from Turkiye. Borsa Istanbul Review, 24(1), 73–83.10.1016/j.bir.2023.10.012Search in Google Scholar
Brogaard, J., & Detzel, A. (2015). The asset-pricing implications of government economic policy uncertainty. Management Science, 61(1), 3–18.10.1287/mnsc.2014.2044Search in Google Scholar
Caldara, D., & Iacoviello, M. (2022). Measuring geopolitical risk. American Economic Review, 112(4), 1194–1225.10.1257/aer.20191823Search in Google Scholar
Chaudhary, P. (2021). Impact of board structure, board activities and institutional investors on the firm risk: Evidence from India. Managerial Finance, 47(4), 506–524.10.1108/MF-05-2020-0281Search in Google Scholar
Chaudhry, N., Roubaud, D., Akhter, W., & Shahbaz, M. (2018). Impact of terrorism on stock markets: Empirical evidence from the SAARC region. Finance Research Letters, 26, 230–234.10.1016/j.frl.2018.02.024Search in Google Scholar
Chen, X. (2023). Are the shocks of EPU, VIX, and GPR indexes on the oil-stock nexus alike? A time-frequency analysis. Applied Economics, 55(48), 5637–5652.10.1080/00036846.2022.2140115Search in Google Scholar
Chien, F., Sadiq, M., Kamran, H. W., Nawaz, M. A., Hussain, M. S., & Raza, M. (2021). Co-movement of energy prices and stock market return: Environmental wavelet nexus of COVID-19 pandemic from the USA, Europe, and China. Environmental Science and Pollution Research, 28(25), 32359–32373.10.1007/s11356-021-12938-2Search in Google Scholar
Chowdhury, E. K. (2020). Is capital market integration among the SAARC countries feasible? An empirical study. Eurasian Journal of Business and Economics, 13(25), 21–36.10.17015/ejbe.2020.025.02Search in Google Scholar
Diebold, F. X., & Yılmaz, K. (2014). On the network topology of variance decompositions: Measuring the connectedness of financial firms. Journal of Econometrics, 182(1), 119–134.10.1016/j.jeconom.2014.04.012Search in Google Scholar
Ellahi, N., Kiani, A. K., Awais, M., Affandi, H., Saghir, R., & Qaim, S. (2021). Investigating the institutional determinants of financial development: Empirical evidence from SAARC countries. Sage Open, 11(2), 1–10.10.1177/21582440211006029Search in Google Scholar
Elsayed, A. H., Gozgor, G., & Lau, C. K. M. (2022). Risk transmissions between bitcoin and traditional financial assets during the COVID-19 era: The role of global uncertainties. International Review of Financial Analysis, 81, 102069.10.1016/j.irfa.2022.102069Search in Google Scholar
Gajurel, D., & Chawla, A. (2022) International information spillovers and asymmetric volatility in South Asian stock markets. Journal of Risk and Financial Management, 15(10), 471.10.3390/jrfm15100471Search in Google Scholar
Gong, X., & Xu, J. (2022). Geopolitical risk and dynamic connectedness between commodity markets. Energy Economics, 110, 106028.10.1016/j.eneco.2022.106028Search in Google Scholar
Habiba, U. E., Peilong, S., Zhang, W., & Hamid, K. (2020). International stock markets integration and dynamics of volatility spillover between the USA and South Asian markets: Evidence from global financial crisis. Journal of Asia Business Studies, 14(5), 779–794.10.1108/JABS-03-2019-0071Search in Google Scholar
He, Z., & Sun, H. (2024). The time-varying and asymmetric impacts of oil price shocks on geopolitical risk. International Review of Economics & Finance, 91, 942–957.10.1016/j.iref.2024.01.036Search in Google Scholar
Jana, S., & Sahu, T. N. (2023). Identifying cryptocurrencies as diversifying assets and safe haven in the Indian stock market. Asia-Pacific Financial Markets, 20(3), 1–20. doi: 10.1007/s10690-023-09436-5.Search in Google Scholar
Jebran, K., & Iqbal, A. (2016). Examining volatility spillover between Asian countries’ stock markets. China Financial and Economic Review, 4(6), 1–13.10.1186/s40589-016-0031-1Search in Google Scholar
Jiang, Z., & Yoon, S. M. (2020). Dynamic co-movement between oil and stock markets in oil-importing and oil-exporting countries: Two types of wavelet analysis. Energy Economics, 90, 104835.10.1016/j.eneco.2020.104835Search in Google Scholar
Johansson, A. C. (2008). Interdependencies among Asian bond markets. Journal of Asian Economics, 19(2), 101–116.10.1016/j.asieco.2007.12.015Search in Google Scholar
Kaur, A., & Mittal, P. (2023). Wavelet based analysis of oil price shocks, exchange rate and stock market behaviour: Evidences from emerging markets. OPEC Energy Review, 47(3), 163–175.10.1111/opec.12277Search in Google Scholar
Khan, D., Ullah, A., Alim, W., & Haq, I-U. (2022). Does terrorism affect the stock market returns and volatility? Evidence from Pakistan’s stock exchange. Journal of Public Affairs, 20, 22, e2304.10.1002/pa.2304Search in Google Scholar
Khraiche, M., Boudreau, J. W., & Chowdhury, M. S. R. (2023). Geopolitical risk and stock market development. Journal of International Financial Markets, Institutions and Money, 88(4), 101847.10.1016/j.intfin.2023.101847Search in Google Scholar
Koop, G., & Korobilis, D. (2014). A new index of financial conditions. European Economic Review, 71, 101–116. doi: 10.1016/j.euroecorev.2014.07.002 Search in Google Scholar
Li, W., Chien, F., Waqas Kamran, H., Aldeehani, T. M., Sadiq, M., Nguyen, V. C., & Taghizadeh-Hesary, F. (2022). The nexus between COVID-19 fear and stock market volatility. Economic Research-Ekonomska istraživanja, 35(1), 1765–1785.10.1080/1331677X.2021.1914125Search in Google Scholar
Li, X., Tong, Y., Zhong, K., Xu, G., & Zhao, W. (2024). Geopolitical risk and foreign subsidiary performance of emerging market multinationals. Journal of Multinational Financial Management, 72, 100836.10.1016/j.mulfin.2024.100836Search in Google Scholar
Li, Z., Hasan, M. M. & Lu, Z. (2023). Assessing financial factors for oil supply disruptions and its impact on oil supply security and transportation risks. Environmental Science and Pollution Research, 30, 33695–33710.10.1007/s11356-022-24541-0Search in Google Scholar
Liaqat, A., Nazir, M. S., Ahmad, I., Mirza, H. H., & Anwar, F. (2020). Do stock price bubbles correlate between China and Pakistan? An inquiry of pre- and post-Chinese investment in Pakistani capital market under China-Pakistan Economic Corridor regime. International Journal of Finance & Economics, 25, 323–335.10.1002/ijfe.1754Search in Google Scholar
Liu, T., & Shigeyuki, H. (2021). Does investor sentiment affect clean energy stock? Evidence from TVP-VAR-Based Connectedness approach. Energies, 14, 3442. doi: 10.3390/en14123442.Search in Google Scholar
Maiti, M. (2019). Is idiosyncratic risk ignored in asset pricing: Sri Lankan evidence? Future Business Journal, 5(5), 1–12.10.1186/s43093-019-0004-6Search in Google Scholar
Mamman, S. O., Iliyasu, J., Ahmed, U. A., & Salami, F. (2020). Global uncertainties, geopolitical risks and price exuberance: Evidence from international energy market. OPEC Energy Review, 48(2), 96–107.10.1111/opec.12297Search in Google Scholar
Mensi, W., Rehman, M. U., Maitra, D., Al-Yahyaee, K. H., & Vo, X. V. (2021). Oil, natural gas and BRICS stock markets: Evidence of systemic risks and co-movements in the time–frequency domain. Resources Policy, 72, 102062.10.1016/j.resourpol.2021.102062Search in Google Scholar
Morawakage, P. S., Nimal, P. D., & Kuruppuarachchi, D. (2019). Equity risk premium puzzle: Evidence from Indonesia and Sri Lanka. Bulletin of Indonesian Economic Studies, 55(2), 239–248.10.1080/00074918.2018.1529406Search in Google Scholar
Nasir, R. M., & He, F. (2023). Do clean energy stocks and sub-sectors hedge China economic policy uncertainty: New evidence from wavelet analysis. Journal of Cleaner Production, 429, 13938510.1016/j.jclepro.2023.139385Search in Google Scholar
Nazir, M. S., Mahmood, J., Abbas, F., & Liaqat, A. (2020). Do rational bubbles exist in emerging markets of SAARC? Journal of Economic and Administrative Sciences, 36(2), 164–183.10.1108/JEAS-09-2018-0102Search in Google Scholar
Pesaran, H. H., & Shin, Y. (1998). Generalized impulse response analysis in linear multivariate models. Economics Letters, 58(1), 17–29. doi: 10.1016/S0165-1765(97)00214-0.Search in Google Scholar
Phillips, P. C., Shi, S., & Yu, J. (2015). Testing for multiple bubbles: Historical episodes of exuberance and collapse in the S&P 500. International Economic Review, 56(4), 1043–1078.10.1111/iere.12132Search in Google Scholar
Prakash, S., & Kumar, S. (2014). Stock market linkages: Examining the case of emerging South Asian markets. Pacific Business Review International, 6(12), 29–36.10.2139/ssrn.2463788Search in Google Scholar
Qu, X., & Lee, L. F. (2015). Estimating a spatial autoregressive model with an endogenous spatial weight matrix. Journal of Econometrics, 184(2), 209–232.10.1016/j.jeconom.2014.08.008Search in Google Scholar
Raheem, I. D., & Le Roux, S. (2023). Geopolitical risks and tourism stocks: New evidence from causality-in- quantile approach. Quarterly Review of Economics and Finance, 88, 1–7.10.1016/j.qref.2023.01.002Search in Google Scholar
Rashid, A., Javed, A., Jehan, Z., & Iqbal, U. (2022). Time-varying impacts of macroeconomic variables on stock market returns and volatility: Evidence from Pakistan. Romanian Journal of Economic Forecasting, 25(3), 144–166.Search in Google Scholar
Sahabuddin, M., Hassan, M. F., Tabash, M. I., Al-Omari, M. A., Alam, M. K., & Islam, F. T. (2021) Co-movement and causality dynamics linkages between conventional and Islamic stock indexes in Bangladesh: A wavelet analysis, Cogent Business & Management, 9(1), 1–16.10.1080/23311975.2022.2034233Search in Google Scholar
Saud, A. S., & Shakya, S. (2020). Analysis of look back period for stock price prediction with RNN variants: A case study on banking sector of NEPSE. Procedia Computer Science, 167, 788–798.10.1016/j.procs.2020.03.419Search in Google Scholar
Sehgal, S., Pandey, P., Deisting, F., & McMillan, D. (2018). Time varying integration amongst the South Asian equity markets: An empirical study. Cogent Economics & Finance, 6(1), 5–26.10.1080/23322039.2018.1452328Search in Google Scholar
Shafiq, S., Qureshi, S. S., & Akbar, M. (2023). Dynamic relationship of volatility of returns across different markets: Evidence from selected next 11 countries. Journal of Economic and Administrative Sciences. doi: 10.1108/JEAS-09-2022-0216.Search in Google Scholar
Shahzad, A., Azeem, M., Nazir, M. S., Vo, X. V., & Linh, N. T. M. (2021). The determinants of capital structure: Evidence from SAARC countries. International Journal of Finance & Economics, 26, 6471–6487.10.1002/ijfe.2132Search in Google Scholar
Singh, S., Bansal, P., & Bhardwaj, N. (2022). Correlation between geopolitical risk, economic policy uncertainty, and Bitcoin using partial and multiple wavelet coherence in P5 + 1 nations. Research in International Business and Finance, 63, 101756.10.1016/j.ribaf.2022.101756Search in Google Scholar
Singh, V. K., Abosedra, S., Fakih, A., Ghosh, S., & Kanjilal, K. (2023). Economic volatility and financial deepening in Sub-Saharan Africa: Evidence from panel cointegration with cross-sectional heterogeneity and endogenous structural breaks. Empirical Economics, 65(5), 2013–2038.10.1007/s00181-023-02415-9Search in Google Scholar
Singh, V. K., & Ahmed, F. (2016). Econometric analysis of financial cointegration of least developed countries (LDCs) of Asia and the Pacific. China Finance Review International, 6(2), 208–227.10.1108/CFRI-06-2015-0056Search in Google Scholar
Sreenu, N. (2023). Effect of exchange rate volatility and inflation on stock market returns dynamics-evidence from India. International Journal of System Assurance Engineering and Management, 14(3), 836–843.10.1007/s13198-023-01914-3Search in Google Scholar
Srinivasan, P., Kalaivani, M. & Ibrahim, P. (2011). An empirical investigation of foreign direct investment and economic growth in SAARC nations. Journal of Asia Business Studies, 5(2), 232–248.10.1108/15587891111152366Search in Google Scholar
Torrence, C., & Compo, G. P. (1998). A practical guide to wavelet analysis. Bulletin of the American Meteorological Society, 79, 61–78.10.1175/1520-0477(1998)079<0061:APGTWA>2.0.CO;2Search in Google Scholar
Tran, T. B. N. (2017). Speculative bubbles in emerging stock markets and macroeconomic factors: A new empirical evidence for Asia and Latin America. Research in International Business and Finance, 42, 454–467.10.1016/j.ribaf.2016.02.004Search in Google Scholar
Tripathi, V., & Seth, R. (2016). Market Efficiency, Inter-linkages and volatility transmission in stock markets of selected SAARC countries. South Asian Journal of Management, 23(4), 149.Search in Google Scholar
Uddin, M. A., Hoque, M. E., & Ali, M. H. (2020). International economic policy uncertainty and stock market returns of Bangladesh: Evidence from linear and nonlinear model. Quantitative Finance and Economics, 4 (2), 236–251.10.3934/QFE.2020011Search in Google Scholar
Umar, M., Mirza, N., Rizvi, S. K. A., & Furqan, M. (2023). Asymmetric volatility structure of equity returns: Evidence from an emerging market. The Quarterly Review of Economics and Finance, 87, 330–336.10.1016/j.qref.2021.04.016Search in Google Scholar
Upadhyaya, K. P., Nag, R., & Mixon Jr, F. G. (2023). Causal relationships between oil prices and key macroeconomic variables in India. International Journal of Financial Studies, 11(4), 143.10.3390/ijfs11040143Search in Google Scholar
Wang, Q., Zhang, C., & Li, R. (2024). Impact of different geopolitical factors on the energy transition: The role of geopolitical threats, geopolitical acts, and geopolitical risks. Journal of Environmental Management, 352, 119962.10.1016/j.jenvman.2023.119962Search in Google Scholar
Yang, M., Zhang, Q., Yi, A., & Peng, P. (2021). Geopolitical risk and stock market volatility in emerging economies: Evidence from GARCH-MIDAS model. Discrete Dynamics in Economic and Business Systems, 1159358, 1–17.10.1155/2021/1159358Search in Google Scholar
Yu, L., Li, J., Tang, L., & Wang, S. (2015). Linear and nonlinear Granger causality investigation between carbon market and crude oil market: A multi-scale approach. Energy Economics, 51, 300–311.10.1016/j.eneco.2015.07.005Search in Google Scholar
Zhao, L., Liu, W., Zhou, M., & Wen, F. (2022). Extreme event shocks and dynamic volatility interactions: The stock, commodity, and carbon markets in China. Finance Research Letters, 47, 102645. doi: 10.1016/j.frl.2021.102645.Search in Google Scholar
Ziadat, S. A., Mensi, W., & Kang, S. H. (2024). Frequency spillovers between oil shocks and stock markets of top oil-producing and -consuming economies. Energy, 291, 130239.10.1016/j.energy.2024.130239Search in Google Scholar
© 2024 the author(s), published by De Gruyter
This work is licensed under the Creative Commons Attribution 4.0 International License.
Articles in the same Issue
- Regular Articles
- Political Turnover and Public Health Provision in Brazilian Municipalities
- Examining the Effects of Trade Liberalisation Using a Gravity Model Approach
- Operating Efficiency in the Capital-Intensive Semiconductor Industry: A Nonparametric Frontier Approach
- Does Health Insurance Boost Subjective Well-being? Examining the Link in China through a National Survey
- An Intelligent Approach for Predicting Stock Market Movements in Emerging Markets Using Optimized Technical Indicators and Neural Networks
- Analysis of the Effect of Digital Financial Inclusion in Promoting Inclusive Growth: Mechanism and Statistical Verification
- Effective Tax Rates and Firm Size under Turnover Tax: Evidence from a Natural Experiment on SMEs
- Re-investigating the Impact of Economic Growth, Energy Consumption, Financial Development, Institutional Quality, and Globalization on Environmental Degradation in OECD Countries
- A Compliance Return Method to Evaluate Different Approaches to Implementing Regulations: The Example of Food Hygiene Standards
- Panel Technical Efficiency of Korean Companies in the Energy Sector based on Digital Capabilities
- Time-varying Investment Dynamics in the USA
- Preferences, Institutions, and Policy Makers: The Case of the New Institutionalization of Science, Technology, and Innovation Governance in Colombia
- The Impact of Geographic Factors on Credit Risk: A Study of Chinese Commercial Banks
- The Heterogeneous Effect and Transmission Paths of Air Pollution on Housing Prices: Evidence from 30 Large- and Medium-Sized Cities in China
- Analysis of Demographic Variables Affecting Digital Citizenship in Turkey
- Green Finance, Environmental Regulations, and Green Technologies in China: Implications for Achieving Green Economic Recovery
- Coupled and Coordinated Development of Economic Growth and Green Sustainability in a Manufacturing Enterprise under the Context of Dual Carbon Goals: Carbon Peaking and Carbon Neutrality
- Revealing the New Nexus in Urban Unemployment Dynamics: The Relationship between Institutional Variables and Long-Term Unemployment in Colombia
- The Roles of the Terms of Trade and the Real Exchange Rate in the Current Account Balance
- Cleaner Production: Analysis of the Role and Path of Green Finance in Controlling Agricultural Nonpoint Source Pollution
- The Research on the Impact of Regional Trade Network Relationships on Value Chain Resilience in China’s Service Industry
- Social Support and Suicidal Ideation among Children of Cross-Border Married Couples
- Asymmetrical Monetary Relations and Involuntary Unemployment in a General Equilibrium Model
- Job Crafting among Airport Security: The Role of Organizational Support, Work Engagement and Social Courage
- Does the Adjustment of Industrial Structure Restrain the Income Gap between Urban and Rural Areas
- Optimizing Emergency Logistics Centre Locations: A Multi-Objective Robust Model
- Geopolitical Risks and Stock Market Volatility in the SAARC Region
- Trade Globalization, Overseas Investment, and Tax Revenue Growth in Sub-Saharan Africa
- Can Government Expenditure Improve the Efficiency of Institutional Elderly-Care Service? – Take Wuhan as an Example
- Media Tone and Earnings Management before the Earnings Announcement: Evidence from China
- Review Articles
- Economic Growth in the Age of Ubiquitous Threats: How Global Risks are Reshaping Growth Theory
- Efficiency Measurement in Healthcare: The Foundations, Variables, and Models – A Narrative Literature Review
- Rethinking the Theoretical Foundation of Economics I: The Multilevel Paradigm
- Financial Literacy as Part of Empowerment Education for Later Life: A Spectrum of Perspectives, Challenges and Implications for Individuals, Educators and Policymakers in the Modern Digital Economy
- Special Issue: Economic Implications of Management and Entrepreneurship - Part II
- Ethnic Entrepreneurship: A Qualitative Study on Entrepreneurial Tendency of Meskhetian Turks Living in the USA in the Context of the Interactive Model
- Bridging Brand Parity with Insights Regarding Consumer Behavior
- The Effect of Green Human Resources Management Practices on Corporate Sustainability from the Perspective of Employees
- Special Issue: Shapes of Performance Evaluation in Economics and Management Decision - Part II
- High-Quality Development of Sports Competition Performance Industry in Chengdu-Chongqing Region Based on Performance Evaluation Theory
- Analysis of Multi-Factor Dynamic Coupling and Government Intervention Level for Urbanization in China: Evidence from the Yangtze River Economic Belt
- The Impact of Environmental Regulation on Technological Innovation of Enterprises: Based on Empirical Evidences of the Implementation of Pollution Charges in China
- Environmental Social Responsibility, Local Environmental Protection Strategy, and Corporate Financial Performance – Empirical Evidence from Heavy Pollution Industry
- The Relationship Between Stock Performance and Money Supply Based on VAR Model in the Context of E-commerce
- A Novel Approach for the Assessment of Logistics Performance Index of EU Countries
- The Decision Behaviour Evaluation of Interrelationships among Personality, Transformational Leadership, Leadership Self-Efficacy, and Commitment for E-Commerce Administrative Managers
- Role of Cultural Factors on Entrepreneurship Across the Diverse Economic Stages: Insights from GEM and GLOBE Data
- Performance Evaluation of Economic Relocation Effect for Environmental Non-Governmental Organizations: Evidence from China
- Functional Analysis of English Carriers and Related Resources of Cultural Communication in Internet Media
- The Influences of Multi-Level Environmental Regulations on Firm Performance in China
- Exploring the Ethnic Cultural Integration Path of Immigrant Communities Based on Ethnic Inter-Embedding
- Analysis of a New Model of Economic Growth in Renewable Energy for Green Computing
- An Empirical Examination of Aging’s Ramifications on Large-scale Agriculture: China’s Perspective
- The Impact of Firm Digital Transformation on Environmental, Social, and Governance Performance: Evidence from China
- Accounting Comparability and Labor Productivity: Evidence from China’s A-Share Listed Firms
- An Empirical Study on the Impact of Tariff Reduction on China’s Textile Industry under the Background of RCEP
- Top Executives’ Overseas Background on Corporate Green Innovation Output: The Mediating Role of Risk Preference
- Neutrosophic Inventory Management: A Cost-Effective Approach
- Mechanism Analysis and Response of Digital Financial Inclusion to Labor Economy based on ANN and Contribution Analysis
- Asset Pricing and Portfolio Investment Management Using Machine Learning: Research Trend Analysis Using Scientometrics
- User-centric Smart City Services for People with Disabilities and the Elderly: A UN SDG Framework Approach
- Research on the Problems and Institutional Optimization Strategies of Rural Collective Economic Organization Governance
- The Impact of the Global Minimum Tax Reform on China and Its Countermeasures
- Sustainable Development of Low-Carbon Supply Chain Economy based on the Internet of Things and Environmental Responsibility
- Measurement of Higher Education Competitiveness Level and Regional Disparities in China from the Perspective of Sustainable Development
- Payment Clearing and Regional Economy Development Based on Panel Data of Sichuan Province
- Coordinated Regional Economic Development: A Study of the Relationship Between Regional Policies and Business Performance
- A Novel Perspective on Prioritizing Investment Projects under Future Uncertainty: Integrating Robustness Analysis with the Net Present Value Model
- Research on Measurement of Manufacturing Industry Chain Resilience Based on Index Contribution Model Driven by Digital Economy
- Special Issue: AEEFI 2023
- Portfolio Allocation, Risk Aversion, and Digital Literacy Among the European Elderly
- Exploring the Heterogeneous Impact of Trade Agreements on Trade: Depth Matters
- Import, Productivity, and Export Performances
- Government Expenditure, Education, and Productivity in the European Union: Effects on Economic Growth
- Replication Study
- Carbon Taxes and CO2 Emissions: A Replication of Andersson (American Economic Journal: Economic Policy, 2019)