Measurement of Higher Education Competitiveness Level and Regional Disparities in China from the Perspective of Sustainable Development
-
Yi Sun
 ,
Jinxin Zhang
,
Jinxin Zhang

Abstract
The competitiveness of higher education is an important symbol to measure the level and potential of economic and social development. Enhancing the competitiveness level of higher education is an important driving force to improve our education system and realize the high quality and sustainable development of higher education. At present, the measurement and multi-dimensional comprehensive analysis of China’s higher education competitiveness are relatively scarce. Higher education system is a complex system composed of multiple factors. This article uses DPSIR model to transform the complex system operation mechanism into a relatively simple description. The TOPSIS method considers the weights and interrelations among the indicators. It is able to fully consider the importance of the indicators. This method can not only avoid the influence of subjectivity and uncertainty but also evaluate the decision scheme more comprehensively. The study uses panel data from 31 provinces in China from 2008 to 2020 and utilizes the DPSIR model to construct a multidimensional evaluation index system for measuring China’s higher education competitiveness level. The entropy weight TOPSIS method is employed to measure the higher education competitiveness level and analyze its spatiotemporal patterns. Traditional and spatial Kernel density estimation methods, as well as Markov chain analysis, are used to explore the dynamic evolution and long-term transfer trends of higher education competitiveness levels. The Dagum Gini coefficient is employed to analyze the differences and sources of higher education competitiveness level. The research findings indicate that China’s overall level of higher education competitiveness shows an increasing trend, with the eastern region having a significantly higher level compared to other regions. This study suggests integrating the concept of sustainable development, facing the gaps between regions, adopting tailored development strategies, and reducing the disparities in higher education competitiveness among regions. These policy insights aim to provide theoretical references and foundations for enhancing China’s higher education competitiveness level as well as promoting high-quality and sustainable development in higher education.
1 Introduction
Education is an important cornerstone for national rejuvenation and social progress. Higher education is an important part of building a new pattern of education development in China. It plays a key role in talent cultivation, scientific research, and social services. Furthermore, higher education is an important engine for national scientific and technological progress and social development. General Secretary Xi Jinping emphasized, “Higher education in our country should closely revolve around the goal of achieving the ‘Two Centenary Goals’ and realizing the Chinese dream of the great rejuvenation of the Chinese nation. Higher education is of vital importance to China for the present and the future, continuously providing high-quality talents for the realization of China’s great rejuvenation.” Lin mentioned that higher education provides a large number of high-quality talents for the rapid development of modern society, serving as a human and technological reserve for promoting development and innovation in various fields of society. Higher education plays an irreplaceable role in enhancing the overall competitiveness of a country or society (Lin, 2020). The level of competitiveness in higher education development is an important indicator of the level and potential of economic and social development (Tang, 2021). Krägeloh et al. (2019) argued that improving the level of higher education competitiveness has an important impact on the overall development of quality students. It also benefits the steady improvement of the overall quality of the entire nation and the optimization of the labor force’s quality structure (Lukwago et al., 2023).
In 2015, the 70th United Nations General Assembly adopted “Transforming Our World: the 2030 Agenda for Sustainable Development,” which highlights that higher education is a fundamental development goal for achieving education equity and sustainable development. It plays a crucial role in the path toward sustainable development in the future (Ritchie-Dunham et al., 2023). At the same time, sustainable development is both an objective requirement for higher education to adapt to high-quality economic and social development and a natural trend in its own development stage (Simina, 2022). The higher education system is a complex system consisting of multiple factors and organizations at various levels and dimensions. It is worth conducting an in-depth analysis and exploration of the development of higher education competitiveness, the existing regional disparities among provinces, and the sources of these disparities in China. To accurately present the current status and competitiveness level of higher education development, the choice of measurement models is of paramount importance. Additionally, it is necessary to analyze the current status and spatiotemporal disparities of China’s higher education competitiveness from multiple perspectives comprehensively. Therefore, based on the framework of the DPSIR model, this article combines the realistic conditions of China’s higher education development environment with the causal relationships related to sustainable development in higher education to select various influencing factors and indicators that reflect China’s higher education competitiveness level. This approach facilitates an accurate understanding of the current state of China’s higher education competitiveness level and provides a research foundation for further exploration of its development disparities.
Compared with previous studies, the existing literature still lacks in-depth research. To fill this gap, this study has three key objectives. First, the evaluation model of China’s higher education competitiveness level under the perspective of sustainable development was constructed by using the framework of “Driving force, Pressure, State, Impact and Response” (DPSIR) and the method of Entropy weight Order by Approximation to Ideal Solution (TOPSIS). Then, this article deeply analyzed the competitiveness level of higher education in China from the dimensions of spatiotemporal patterns and dynamic evolution trends. Third, it analyzes the overall difference, inter-regional difference, intra-regional difference, and the source of difference in higher education competitiveness level in our country. This article not only helped to reveal the spatiotemporal heterogeneity of China’s higher education competitiveness level but also helped to improve the measurement model of China’s higher education competitiveness level. In addition, it provides theoretical reference and policy suggestions for the sustainable development of higher education.
To address these unresolved key issues, the remaining sections of the article are divided into five parts. Part 2 provides a literature review. Part 3 describes the research methodology, data sources, and process of constructing the evaluation index system for the competitiveness level of Chinese higher education. Part 4 analyzes the spatiotemporal patterns and dynamic evolution of the competitiveness level of Chinese higher education. Part 5 discusses the differences in the competitiveness level of Chinese higher education and their sources. Finally, the research conclusions, implications, suggestions, and future research are presented in Part 6.
2 Literature Review
2.1 Competitiveness of Higher Education
The competitiveness of higher education is an important area of research in the sustainable development of higher education. The study of higher education competitiveness initially emerged from research on corporate competitiveness (Kamal and Yesmin, 2022; Peng et al., 2022), industrial competitiveness (Muerza et al., 2023; Yao et al., 2023), and national competitiveness (Fainshmidt et al., 2016; Fang et al., 2018), and as the research progressed, competitiveness theories and research findings were gradually extended to the study of higher education competitiveness. The concept of higher education competitiveness originated from the field of international competitiveness (Adamkiewicz, 2019). In his 1990 book The Competitive Advantage of Nations, Michael Porter from Harvard Business School pointed out that the sole meaning of competitiveness or competitive advantage is productivity. Furthermore, the theory of national competitive advantage attempts to explain and interpret how nations create and maintain sustainable relative advantages (Haj Youssef et al., 2019). In the context of higher education competitiveness, it represents the relative advantages and capabilities that the higher education system possesses in a particular region. Higher education is an important measure for labor force reproduction, as it transforms potential labor into actual labor, thereby further promoting productivity development. At the same time, higher education is also an important initiative for the reproduction and generation of scientific and technological knowledge. The improvement of higher education competitiveness is not only a fundamental requirement for building a strong higher education country but also the fundamental approach to building a high-quality higher education system. As a subsystem within the larger social system, the higher education system plays an increasingly important role in its development process. In order to achieve high-quality and sustainable development in our higher education system, it is necessary to maintain a balance between the internal factors of higher education and the external environment. When measuring the level of higher education competitiveness, it is important to integrate the theories of competitive advantage and sustainable development, fully consider the driving forces and pressures faced by the higher education system, and combine the current status, impact, system feedback, and adjustment conditions. From the multiple perspectives above, the level of competitiveness in Chinese higher education can be effectively presented and analyzed.
The measurement of the level of higher education competitiveness is a crucial issue that lays the foundation for current and future research on higher education competitiveness. This method not only helps us gain a comprehensive understanding of the development status of regional higher education but also provides theoretical guidance for the sustainable development of higher education in our country.
2.2 Construction of the Higher Education Competitiveness Measure
2.2.1 Evaluation Methods for Higher Education Competitiveness
In order to present the current status and competitiveness of higher education in China scientifically and reasonably, the selection of measurement models is crucial. On the one hand, scholars have employed qualitative analysis methods to measure the level of higher education competitiveness (Chang & Liu, 2019; Stoimenova, 2019). Li and Yu (2013) assessed the competitiveness level of universities using the expert rating method. Bileviciute et al. (2019) used Mykolas Romeris University as an example to investigate both the level of higher education competitiveness and modern innovative management methods in universities. Alfaro Bernedo et al. (2021) conducted research showing that the Unified Enterprise Architecture model is a powerful tool for supporting organizational management, which helps improve the functional competitiveness of universities and their overall competitiveness. Yang et al. (2020) analyzed the international sustainable competitiveness of Chinese higher education based on the Diamond Model theory and proposed effective approaches to enhance China’s sustainable competitiveness in the international education service market. However, qualitative analysis methods often rely on the experience and intuition of the analysts, which can be subjective, so the evaluation of the research subject needs to be scientifically assessed from an objective perspective.
Additionally, scholars have conducted quantitative data analysis by constructing evaluation models to explore the development of higher education. Estrada-Real and Cantu-Ortiz (2022) analyzed the competitiveness of higher education institutions using data from the QS World University Rankings. They constructed models using statistical and machine learning algorithms from the library of R Studio software tool to predict the rankings of global universities and forecast the competitiveness level of world universities for the next decade. Moskovkin et al. (2023) identified two indicators: the total number of universities in a country and the average ranking of these universities over a period of time. They normalized and weighted these indicators and used them to analyze the competitiveness level of universities in a country through case studies. Kelly (2016) introduced the Herfindahl index to analyze the competitiveness level of certain disciplines within the UK higher education system. The evaluation indicators mentioned in previous studies may not fully cover multiple factors in the system, neglecting comprehensive indicators and dynamic development. Some scholars have used higher education efficiency as a representation of higher education competitiveness (Sun et al., 2023). For example, using the multi-level frontier analysis, Naderi evaluated the competitiveness of faculties, colleges, and universities by analyzing the efficiency scores of two groups of departments at a university in Iran (Naderi, 2022). Tran et al. calculated the efficiency of 172 higher education institutions in Vietnam during the inclusive period from 2012 to 2016 using the data envelopment analysis method. They examined the competitiveness level of higher education institutions from aspects such as disciplinary distribution, autonomy, and internationalization (Tran et al., 2023). However, higher education efficiency mostly presents the level of competitiveness from the perspectives of input and output, without providing a comprehensive depiction of the development of the higher education system from a sustainable development perspective.
2.2.2 DPSIR Model
The Driving-force–Pressure–State–Impact–Response (DPSIR) framework model is an evaluation model proposed by the European Environment Agency (EEA) in 1993. It organizes relevant indicators based on causal relationships and has been widely used in environmental system assessments, gradually becoming an effective tool for assessing the state of environmental systems and causal relationships regarding environmental issues (Duan et al., 2021). This model evolved from a combination of the Pressure–State–Response (PSR) model and the Driving–State–Response (DSR) model, incorporating their respective advantages (Yousafzai et al., 2022).
The DPSIR model enables a more comprehensive and systematic analysis and evaluation of the continuous feedback mechanisms between indicators. Existing research has predominantly focused on the application of the DPSIR model in environmental assessments (Liu et al., 2022), resource management (Zhao et al., 2023), and other related areas. In the DPSIR model, concerning environmental issues, the driving forces (D) primarily consist of economic and social development, as well as population growth, which exert a series of negative pressures (P) on the ecological environment. These pressures lead to the deterioration of the ecological state (S), resulting in various adverse impacts (I) on human society. In response, corresponding measures (R) are taken to improve the current ecological environment, seeking harmonious development between humans and nature. Despite being an important theoretical framework widely used in environmental governance (Wan et al., 2018; Zhao et al., 2021), there has been limited research applying the DPSIR model to the selection of evaluation indicators for higher education competitiveness. Since the 1930s, scholars have been applying the principles of ecological sustainability from the field of ecology to the domain of education, introducing concepts such as “educational ecology” (Yanli, 2020). In recent years, with the development of higher education in China, many scholars have started examining the current state of higher education from a sustainable development perspective (Wang & Zhou, 2023). However, only a few studies have recognized the DPSIR model as an important guiding framework for exploring sustainable development initiatives (Kelly, 2016), demonstrating the model’s completeness and effectiveness (Zhao et al., 2021). In the field of higher education competitiveness research, the DPSIR model also holds strong applicability. Firstly, the DPSIR model allows for a comprehensive construction of an evaluation indicator system for higher education competitiveness, incorporating the five subsystems of driving forces, pressures, state, impact, and response. This offers a new analytical framework for investigating the competitiveness of Chinese higher education. Second, the higher education system exhibits characteristics of complexity and dynamism. This study introduces the “Driving-force–Pressure–State–Impact–Response” framework, which not only reflects the multi-level nature of the evaluation elements of higher education competitiveness but also captures the cyclical nature of system dynamics.
2.3 Entropy Weight TOPSIS Measurement Method
Through combing the existing research, it is found that there are many methods to evaluate the development of education, mainly reflected in the combination of subjective empowerment and object view methods. Yang Lei used this method to evaluate the development level of higher vocational education in ethnic minority areas in our country. In the comprehensive evaluation, the analytic hierarchy process or Delphi method was used to determine the weight of each index, and then the comprehensive index was calculated for evaluation. In the view of the customer, the comprehensive evaluation is mainly based on the principal component analysis and factor analysis (Yang, 2018). Xu (2014) used this method to calculate the comprehensive evaluation score of regional higher education level indicators. Entropy-weight TOPSIS method is to use more comprehensive evaluation methods. In the comprehensive evaluation, the weight determination of each index is more customer-oriented (Shen et al., 2013). The Entropy-weight TOPSIS method can not only show the importance degree of a certain index in the comprehensive evaluation index system when making decisions but also reflect the changes of the weight of each index over time. Therefore, it is more suitable for the comprehensive evaluation of education development level in the district. Ke and Wang (2020) used the entropy-weight TOPSIS model in the evaluation of urban higher education resources carrying capacity, and achieved good practical application results. TOPSIS method is a comprehensive evaluation method for multi-objective decision analysis. It is sorted by solving the relative distance between the evaluation object and the ideal object. If the evaluation object is close to the optimal solution reflects better performance, whereas the farther it is from the optimal solution the worse the performance. The traditional TOPSIS method is mainly based on expert opinions to determine the weight, which may deviate from the real results. TOPSIS method usually does not require high sample data, it can fully reflect the specific situation of each evaluation index, so as to evaluate the comprehensive competitiveness of the research object. Therefore, TOPSIS is widely used in risk assessment, regional competitiveness, and other related fields. However, when using this method, the weight of each index needs to be determined by expert evaluation, which is subjective to a certain extent and may lead to deviations in the evaluation results. Entropy weight method is an objective weight assignment method, which can calculate the weight of each index according to the variation degree, so as to reduce the error caused by subjective assignment. Therefore, the entropy weight method can be used to improve the accuracy of the evaluation when determining the weights.
Entropy TOPSIS method uses entropy weight method to objectively determine the weight of each evaluation index, which reduces the influence of subjective judgment. This method ensures the scientific and accurate weight of each index in the evaluation process and improves the credibility of the evaluation results. Entropy TOPSIS method can quantitatively evaluate the competitiveness of higher education, and provide an intuitive comparison for the education competitiveness of provinces by measuring the standardized index. In this way, the ranking and differences in the higher education competitiveness of different provinces can be clearly seen.
In general, the DPSIR framework and entropy TOPSIS method contribute to various aspects by providing a systematic evaluation system, objective weight determination, quantitative assessment of higher education competitiveness, dynamic monitoring, and evaluation, promoting higher education equity, improving higher education quality, evaluating scientific and technological innovation ability and supporting decision-making. It is helpful to effectively evaluate the competitiveness level of Chinese higher education. The application of these methods can not only promote the in-depth understanding of the competitiveness of higher education but also provide scientific basis and decision support for improving the quality and equity of education.
According to the above literature analysis, we find that the existing research has the following research limitations: First, previous studies ignore the analysis of higher education competitiveness from the perspective of sustainable development theory. Secondly, the higher education system presents the characteristics of complexity and dynamic. Therefore, it is necessary to use an integrated analysis model that can not only reflect the multi-level characteristics of the evaluation elements of higher education competitiveness but also capture the periodic characteristics of the system. Third, existing studies lack an in-depth analysis of the dynamic evolution dimensions of China’s higher education competitiveness level.
3 Research Methods and Data Sources
3.1 Research Methods
In the following, several research methods related to this study are described in detail. Firstly, the entropy weight TOPSIS method is used to measure the competitiveness level of higher education. Secondly, Kernel Density Estimation and the Markov Chain Analysis Method are used to describe the level of China’s higher education competitiveness, mainly reflecting the regional differences and dynamic evolution processes of the level of higher education competitiveness. Finally, the Gini coefficient is used to describe the inter-regional differences and intra-regional differences in the level of competitiveness of higher education in China.
3.1.1 The Entropy Weight TOPSIS Measurement Method
In this study, the entropy weight TOPSIS method was employed to measure the competitiveness level of higher education in China (Abdel-Basset et al., 2018). This method offers high precision and reliability. It not only effectively avoids the influence of subjective preferences on indicator weights but also overcomes the limitations of principal component analysis, such as susceptibility to outliers (Ren, 2020). The specific steps are as follows:
Step 1: Standardize the indicators using the range method.
In the formula,
Step 2: Calculate the information entropy
Step 3: Calculate the weights for each indicator.
Step 4: Calculate the weighted index for each indicator of higher education competitiveness level.
Step 5: Calculate the distances
In the formula,
Step 6: Calculate the relative closeness degree Ci between each measured object and the ideal object.
The relative closeness degree
3.1.2 Kernel Density Estimation
3.1.2.1 Traditional Kernel Density Estimation
Traditional Kernel Density Estimation is a non-parametric method used primarily to study the unevenness of spatial distributions. This method uses a continuous density curve to describe the distribution pattern of a random variable, thereby reflecting information about the location, shape, and other characteristics of the variable’s distribution (Yang et al., 2017). Kernel density functions can take various forms, such as triangular kernel functions, rectangular kernel functions, Gaussian kernel functions, and Epanechnikov kernel functions. In this study, we selected the Gaussian kernel density function to analyze the dynamic evolution of the distribution of higher education competitiveness. The calculation formula is as follows:
In the formula,
3.1.2.2 Spatial Kernel Density Estimation
The spatial Kernel Density Estimation method incorporates spatial factors into the traditional Kernel Density Estimation, allowing for the estimation of the probability density function of a random variable undergoing spatial transformations during a given period of time. By analyzing dynamic distribution maps, it accurately captures the patterns of change and helps explain the long-term migration trends of provinces (Lu et al., 2018). In this study, the Gaussian kernel density function is still selected for computation in the spatial estimation. The formula for calculation is as follows:
In the formula,
3.1.3 Markov Chain Analysis Method
The Markov chain analysis method is a special stochastic process with discrete time and state. It involves discretizing the data into
In the formula, the sequence
In this study, higher education competitiveness is divided into
In the formula,
3.1.4 Dagum Gini Coefficient
Compared to the traditional Gini coefficient and Theil index, the Dagum Gini coefficient not only handles the issue of cross-overlapping between sample data but also characterizes regional disparities in Higher Education Competitiveness Level and decomposes the sources of overall regional disparities (Mai et al., 2023). Therefore, this study employs the Dagum Gini coefficient to analyze regional disparities in Higher Education Competitiveness Level and their sources (Zeng et al., 2022). The Dagum Gini coefficient and its decomposition formula are as follows:
First, calculate the overall Gini coefficient for all provinces.
In the formula,
Secondly, decompose the Gini coefficient
In the formula,
In the formula,
In the formula,
3.2 Construction of Evaluation Indicator System
The selection of indicators follows principles such as comprehensiveness, scientific rigor, representativeness, and operational feasibility. This process involves three stages: policy document analysis, theoretical construction, and expert consultation.
Phase one is the data collation stage. Collecting relevant policy documents and literature related to the development of higher education in China, and analyzing them to identify theoretical models and relevant indicators associated with higher education competitiveness. Phase two is the theoretical construction stage. Based on the fundamental theoretical viewpoints of the DPSIR model and the operational characteristics of the higher education development environment, and combining the basic connotations of the five aspects of indicators in the model: driving force, pressures, state, impact, and response, the characteristics represented by the indicators identified in the previous stage of policy document analysis are incorporated into these five aspects of indicators. At the same time, some indicators that are less relevant to the study or have conflicting content are excluded. Phase three is the expert consultation stage. Interviews are conducted with seven university teaching administrators and five university faculty members holding the rank of associate professor or higher. The indicator system, which was preliminary screened in the previous stage, is further refined based on the input from the experts. Adjustments are made to the indicators according to the experts’ recommendations. Higher education competitiveness is a complex system influenced by multiple factors. In this study, based on the DPSIR framework, the indicators are ultimately confirmed from the perspectives of driving force, pressures, state, impact, and response (Yussif et al., 2023).
First, the driving force (D), is behind the development of the higher education system and the main factor that helps to improve the competitiveness of higher education. Second, pressure (P), refers to the direct demand placed on the sustainable development of higher education in the context of building an educationally strong nation. Third, state (S), refers to the current development of higher education competitiveness under the dual influences of driving force and pressure. The state is presented through two aspects: student enrollment scale and faculty size. Fourth, impact (I), refers to the effects generated by the changes in higher education competitiveness. It represents the ultimate outcomes and effects resulting from the combined influence of “driving force,” “pressure,” and “state.” Fifth, response (R), refers to the feedback and regulatory conditions within the higher education system. The capacity for such adjustments is also an important manifestation of higher education competitiveness.
Based on the above analysis, this study selects 37 fundamental indicators from the perspectives of “driving force,” “pressure,” “state,” “impact,” and “response” to construct a measurement index system for assessing the competitiveness of higher education in China. The table below (Table 1) presents the constructed index system.
Measurement indicator system for competitiveness of higher education in China
| Goal level | Criterion level | Factor level | Indicator level | Unit |
|---|---|---|---|---|
| Competitiveness of Higher Education Level | Driving force | Economic driving force | Per capita GDP | Per person/Per capita |
| Per capita disposable income | Per person/Per capita | |||
| Financial investment | Government funding for higher education | Ten thousand yuan | ||
| Expenditure on higher education | One thousand yuan | |||
| Expenditure on research and development (R&D) in higher education institutions | Ten thousand yuan | |||
| Infrastructure investment | Fixed capital value | One hundred million yuan | ||
| School building area | Square meter | |||
| Number of print and electronic books | Ten thousand copies | |||
| Scientific research instruments and equipment assets | Ten thousand yuan | |||
| Pressure | Educational equity | Average expenditure on higher education per student. | Yuan | |
| Number of people pursuing higher education | Person | |||
| Contribution to social development | The proportion of employed individuals with undergraduate education among the total employed population in the province | % | ||
| The proportion of employed individuals with graduate education among the total employed population in the province | % | |||
| Labor productivity | % | |||
| State | Enrollment size | The number of undergraduate students and junior college students in higher education institutions | Person | |
| The number of graduate students in higher education institutions | Person | |||
| The number of doctoral students in higher education institutions | Person | |||
| Faculty size | The number of full-time teachers | Ten thousand people | ||
| Student-to-faculty ratio in regular higher education institutions | % | |||
| The proportion of associate senior and above full-time teachers | % | |||
| The proportion of full-time teachers with doctoral degrees | % | |||
| The number of ordinary higher education institutions | Count | |||
| Impact | Education quality | The number of undergraduate degrees awarded | Person | |
| The proportion of the population that receives higher education | % | |||
| Scientific research quality | The number of scientific articles published | Piece | ||
| The number of research papers published abroad | Piece | |||
| The number of scientific publications | Type | |||
| The number of patent applications | Item | |||
| The number of scientific articles indexed in the top three international citation databases | Piece | |||
| The number of patent transfers and licenses in higher education institutions | Item | |||
| The revenue from the transfer and licensing of patent ownership in higher education institutions. | Ten thousand yuan | |||
| The number of national or industrial standards | Item | |||
| Response | Response measures | The growth rate of per-student expenditure on higher education. | % | |
| The growth rate of per-student expenditure on the operation of higher education institutions. | % | |||
| System feedback | The number of newly added teachers compared to the previous year | Ten thousand person |
3.3 Data Sources
This study covers 31 provinces in China from 2008 to 2020, excluding Hong Kong, Macao, and Taiwan. The data were obtained from official publications such as “China Statistical Yearbook,” “China Science and Technology Statistical Yearbook,” “China Urban Statistical Yearbook,” and “China Population and Employment Statistics Yearbook,” and the official website of the Ministry of Education, and the missing data were filled by linear interpolation. That is, the linear relationship of known data points is used to estimate the missing values. A linear function is used to fill in the missing values based on the values before and after the known data points. If we know that the values at
4 The Spatial Pattern and Dynamic Evolution Trend of China’s Higher Education Competitiveness Level
This study aims to measure the level of competitiveness in China’s higher education from 2008 to 2020. By doing so, it not only captures the horizontal variations in higher education competitiveness among different provinces but also provides a clear representation of the dynamic comparability of evaluation results.
4.1 Spatial Pattern of China’s Higher Education Competitiveness Level
In order to provide a more intuitive display of the development trend of China’s higher education competitiveness from 2008 to 2020, this article divides the 31 provinces (autonomous regions and municipalities directly under the Central Government) into eastern, central, and western regions according to the classification method of the National Bureau of Statistics. The average measurement results of higher education competitiveness in the three regions and the country as a whole are shown in Figure 1. As can be seen from Figure 1, the Higher Education Competitiveness Level in the country and the three regions has significantly increased from 2008 to 2020. Specifically, the higher education competitiveness level in the eastern region is far higher than the national average, the higher education competitiveness level in the central region is on par with the national average, and the higher education competitiveness level in the western region is far lower than the national average, only about half of the national average. Moreover, the growth rate of Higher Education Competitiveness Level in the three regions is quite similar, showing a coordinated improvement trend.
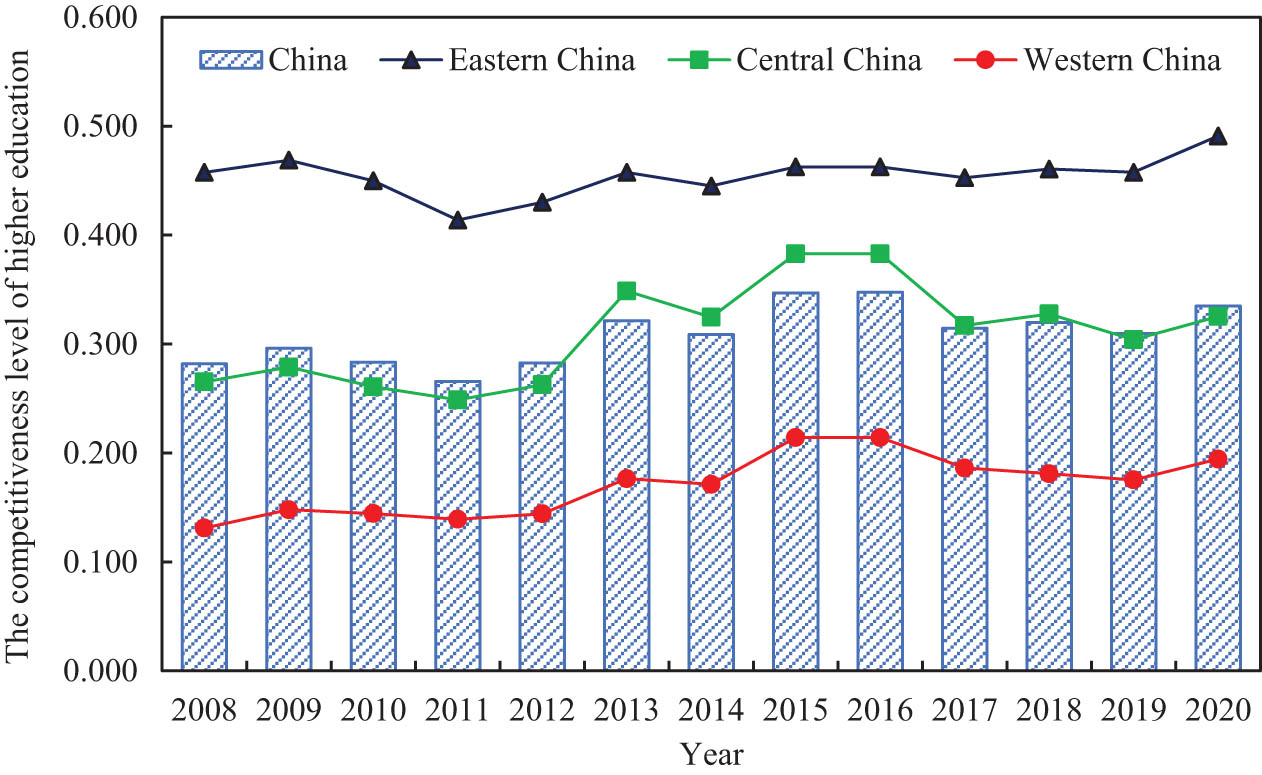
Average higher education competitiveness level and their trends in the country and the three major regions.
This study selects four time points, namely 2008, 2012, 2016, and 2020, and classifies the Higher Education Competitiveness Level of each year into five grades: low level (0.002–0.1222), lower-middle level (0.123–0.263), middle level (0.264–0.423), upper-middle level (0.424–0.631), and high level (0.632–0.990). Using ArcGIS 10.8 software, the spatial distribution of Higher Education Competitiveness Level in various regions of China in 2008, 2012, 2016, and 2020 is plotted, as shown in Figure 2.
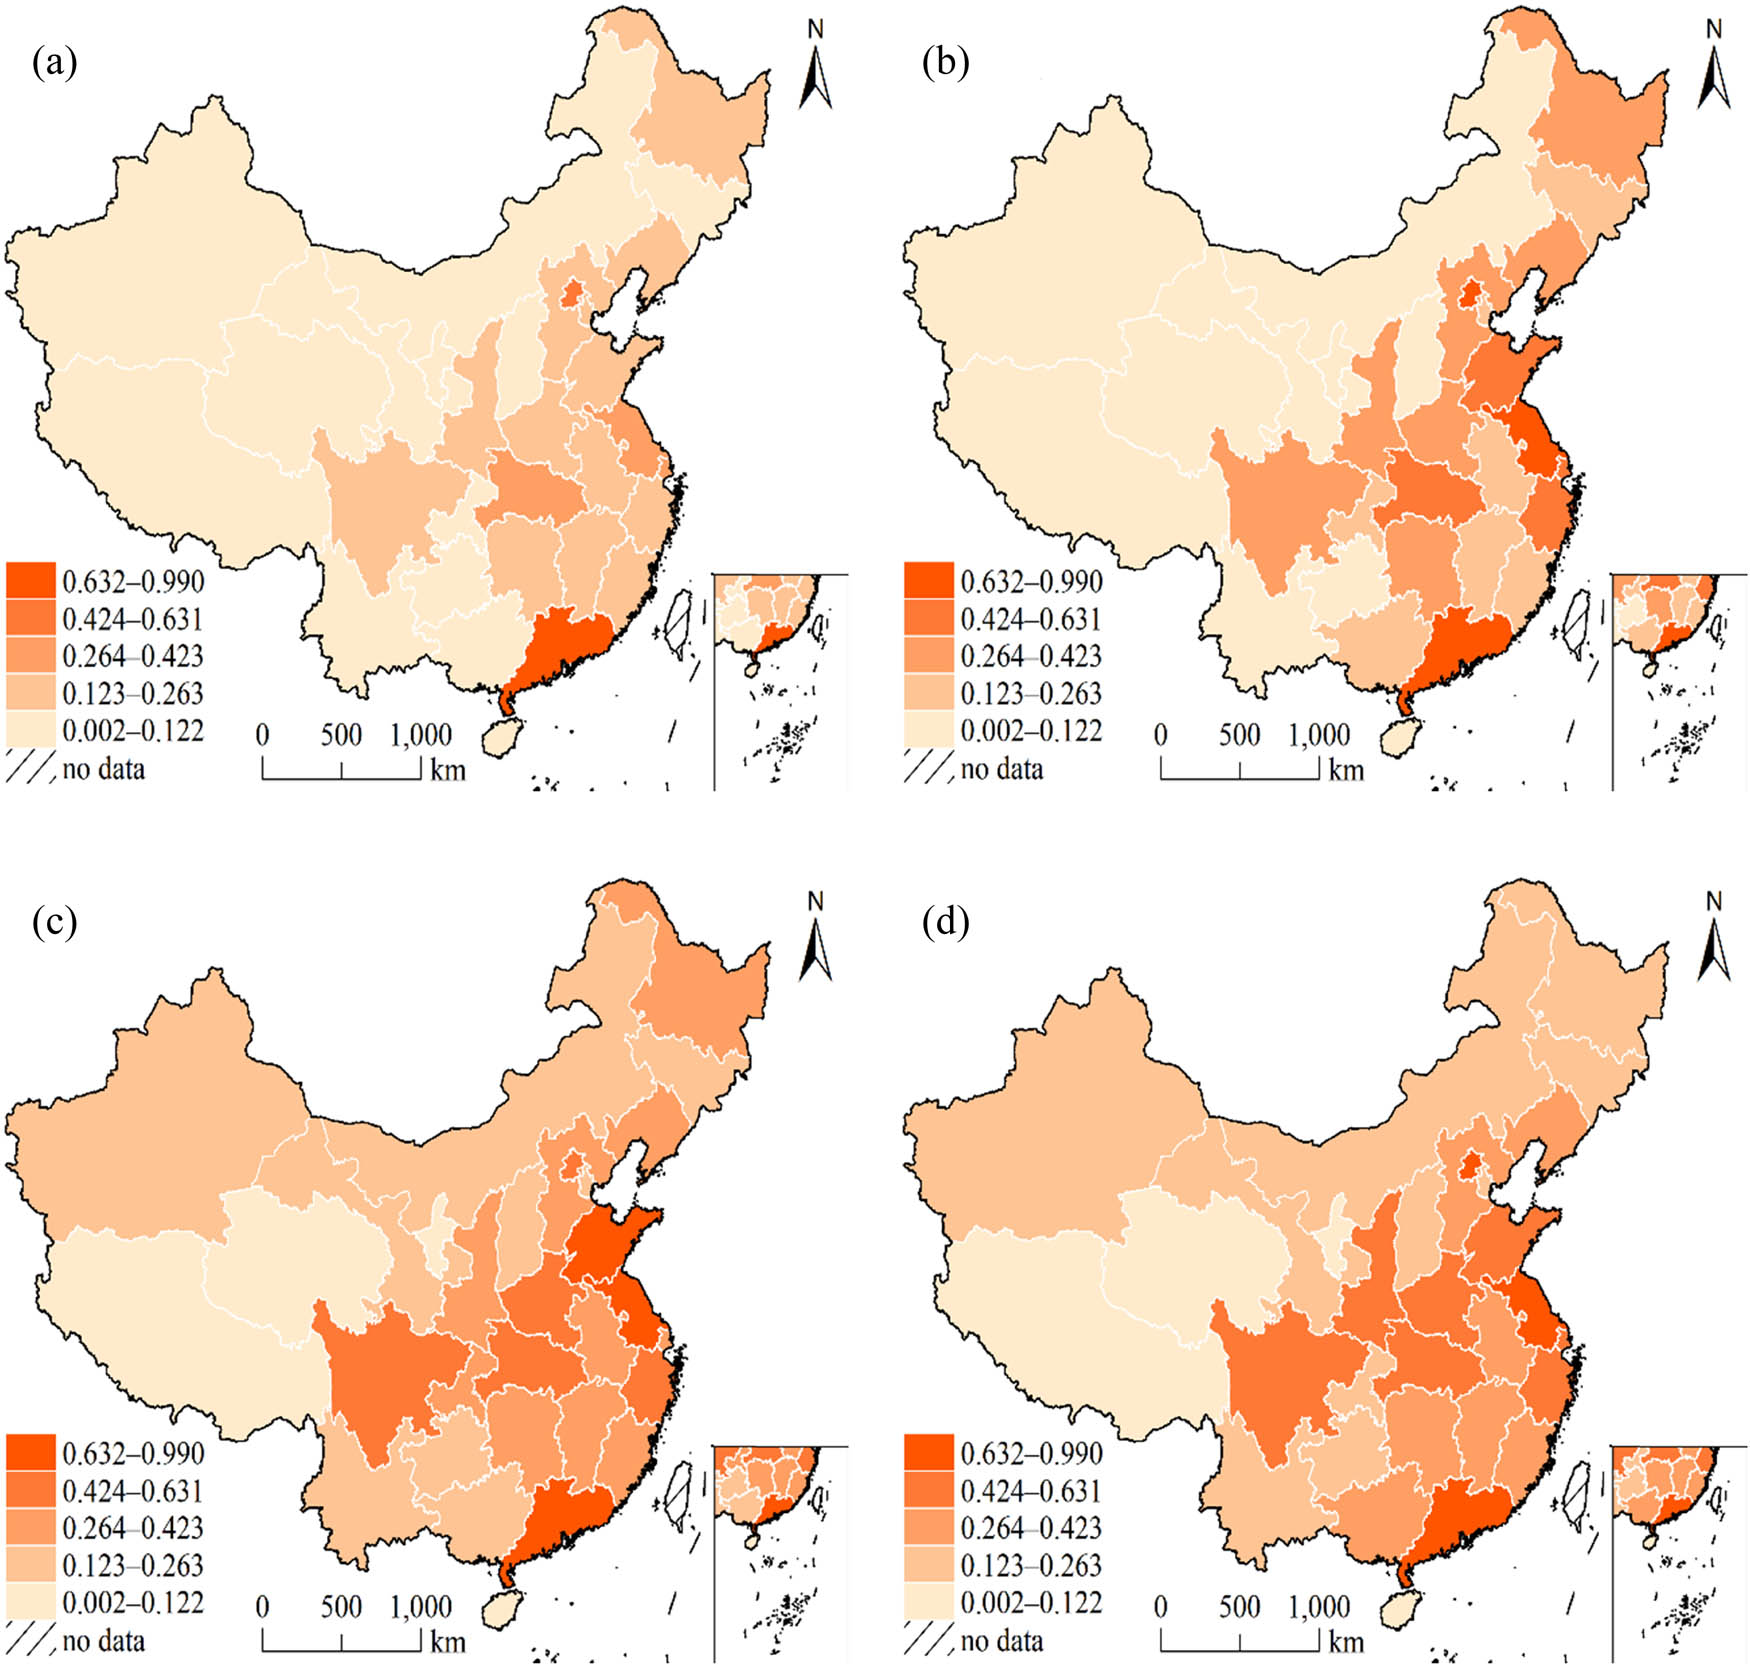
Spatial and temporal pattern of china’s higher education competitiveness level from (a)–(d) 2008 to 2020. Review number: GS (2019) 1822.
As can be seen from Figure 2, with the passage of time, the overall level of higher education competitiveness has generally increased. Initially, high-level higher education competitiveness was scattered in areas such as Beijing, Jiangsu, Guangdong, Shanghai, and Hubei. Later, it concentrated in the eastern coastal areas, with Guangdong, Jiangsu, and Zhejiang becoming the leaders. These areas experienced rapid economic development and abundant job opportunities, resulting in a siphoning effect in the eastern region, attracting a large amount of social resources, promoting the development of higher education in the eastern region, and pushing forward its high-quality development process. Areas with low-level higher education competitiveness were mostly located in remote central and western regions, which were greatly affected by non-man-made factors such as economic development, natural environment, and climate. The development of higher education was relatively slow, and the gap with the developed provinces in the eastern region continued to widen, with no leapfrogging improvement or development achieved among neighboring provinces.
From the perspective of spatial evolution characteristics, there are differences in the level of higher education competitiveness across the country, with most high-level areas concentrated in the eastern coastal regions. The overall pattern shows a gradient differentiation trend of high in the east, low in the west, high in the south, and low in the north. The evolution characteristics over time indicate that the long-term evolution of Higher Education Competitiveness Level in various provinces is based on the pattern, showing a significant path dependency, making it difficult to achieve leapfrogging improvement in the short term. With the passage of time, the spatial imbalance of China’s higher education competitiveness level will continue to exist and the gap will continue to widen, making it more difficult to bridge the gap.
The country’s development has followed a relatively good trend, but the regional development imbalance caused by factors such as resource endowment, location conditions, and national policies has not been effectively alleviated but has gradually expanded. Therefore, both high-level and low-level regions need to identify their weaknesses, focus on breakthroughs, and achieve more comprehensive and coordinated development.
From the perspective of dynamic evolution, under the spatial condition, the results of static Kernel density estimation and dynamic Kernel density estimation are similar but different. When the level of higher education competitiveness of adjacent provinces is at a high level, there is no spatial positive correlation between the static and dynamic estimation results. When the level of higher education competitiveness of neighboring provinces is at a medium or low level, considering the time factor, the spatial positive correlation between provinces is significantly weakened.
4.2 Dynamic Evolution Trend of China’s Higher Education Competitiveness Level
4.2.1 Kernel Density Estimation of China’s Higher Education Competitiveness Level
First, unconditional Kernel density estimation is used to investigate the changing trend of China’s higher education competitiveness level from year t to t + 3; second, the static Kernel density estimation method under spatial conditions is used to reveal the spatial correlation relationship between the higher education competitiveness level of each province and that of its neighboring provinces during the same period; finally, considering the time span on the basis of spatial dynamic Kernel density estimation method, the impact of neighboring provinces’ higher education competitiveness level in year t on the higher education competitiveness level of the province in t + 3 years is analyzed. In the Kernel density estimation under spatial conditions, this article selects the binary adjacency matrix to investigate the spatial correlation between provinces. In the Kernel density graph, the x-axis and y-axis represent the higher education competitiveness level, and the z-axis represents the density of each point in the X–Y plane. In the density contour map, both the x-axis and y-axis represent the higher education competitiveness level, and the density contour lines represent different density values. The closer the contour lines are to the center, the higher the density value, and the more densely packed the contour lines, indicating a larger density change and a steeper corresponding Kernel density graph shape.
4.2.2 Unconditional Kernel Density Estimation of China’s Higher Education Competitiveness Level
In Kernel density graphs and density contour maps, the positive 45° diagonal line is usually used as a marker for changes in the evolution trend of higher education competitiveness level. In unconditional Kernel density estimation, the x-axis represents the higher education competitiveness level of the province in year t, the y-axis represents the higher education competitiveness level of the province in t + 3 years, and the z-axis represents the probability density. If the probability mass tends to be near the positive 45° diagonal line, it indicates that the trend of higher education competitiveness level from t to t + 3 years is relatively stable; if the probability mass tends to be near the negative 45° diagonal line, it indicates a significant change in the higher education competitiveness level from t to t + 3 years; if the probability mass concentrates near a specific scale on the y-axis and parallel to the x-axis, it indicates a converging trend of higher education competitiveness level. According to Figure 3, the unconditional Kernel density estimation probability of the competitiveness level of higher education in China is mainly distributed around the positive 45° diagonal line. This suggests that without considering spatial conditions, the competitiveness level of higher education in each province of China demonstrates strong continuity.
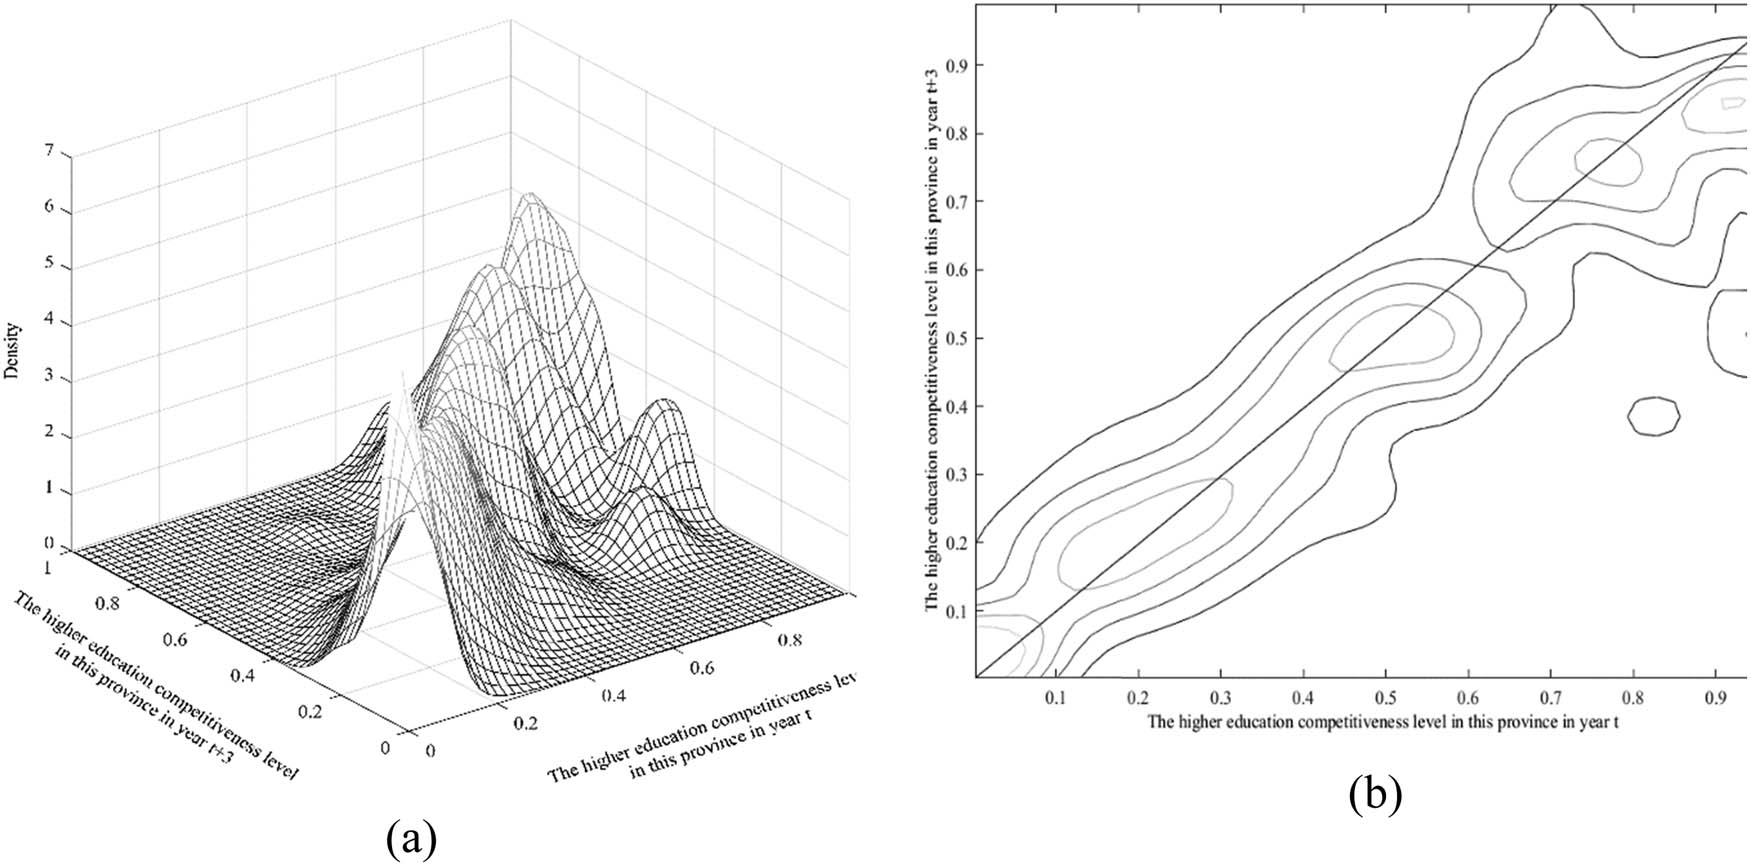
Unconditional Kernel density graph and density contour lines of China’s higher education competitiveness level. (a) Unconditional Kernel density, (b) unconditional Kernel density contour lines.
In addition, there are four peaks in the probability mass, which are distributed near the x-axis at 0.2, 0.5, 0.7, and 0.9. The peak near 0.9 is slightly lower than the 45° diagonal line, indicating that under unconditional assumptions, provinces with a higher education competitiveness level above 0.9 tend to experience a decline in the growth rate of higher education competitiveness level after 3 years.
4.2.3 Spatial Static Kernel Density Estimation of China’s Higher Education Competitiveness Level
Figure 4 reports the results of Kernel density estimation under spatial static conditions, that is, the evolution of the higher education competitiveness level of a province considering the impact of neighboring provinces’ Higher Education Competitiveness Level. In Figure 4, the X-axis represents the higher education competitiveness level of neighboring provinces in year t, the Y-axis represents the higher education competitiveness level of the province in year t, and the Z-axis represents the probability density of Y under X condition. If China’s higher education competitiveness level shows a provincial convergence trend, and there is a positive spatial correlation between neighboring provinces’ Higher Education Competitiveness Level, that is, high-level provinces cluster with high-level provinces, and low-level provinces cluster with low-level provinces, then the probability mass will tend to be near the positive 45° diagonal line.
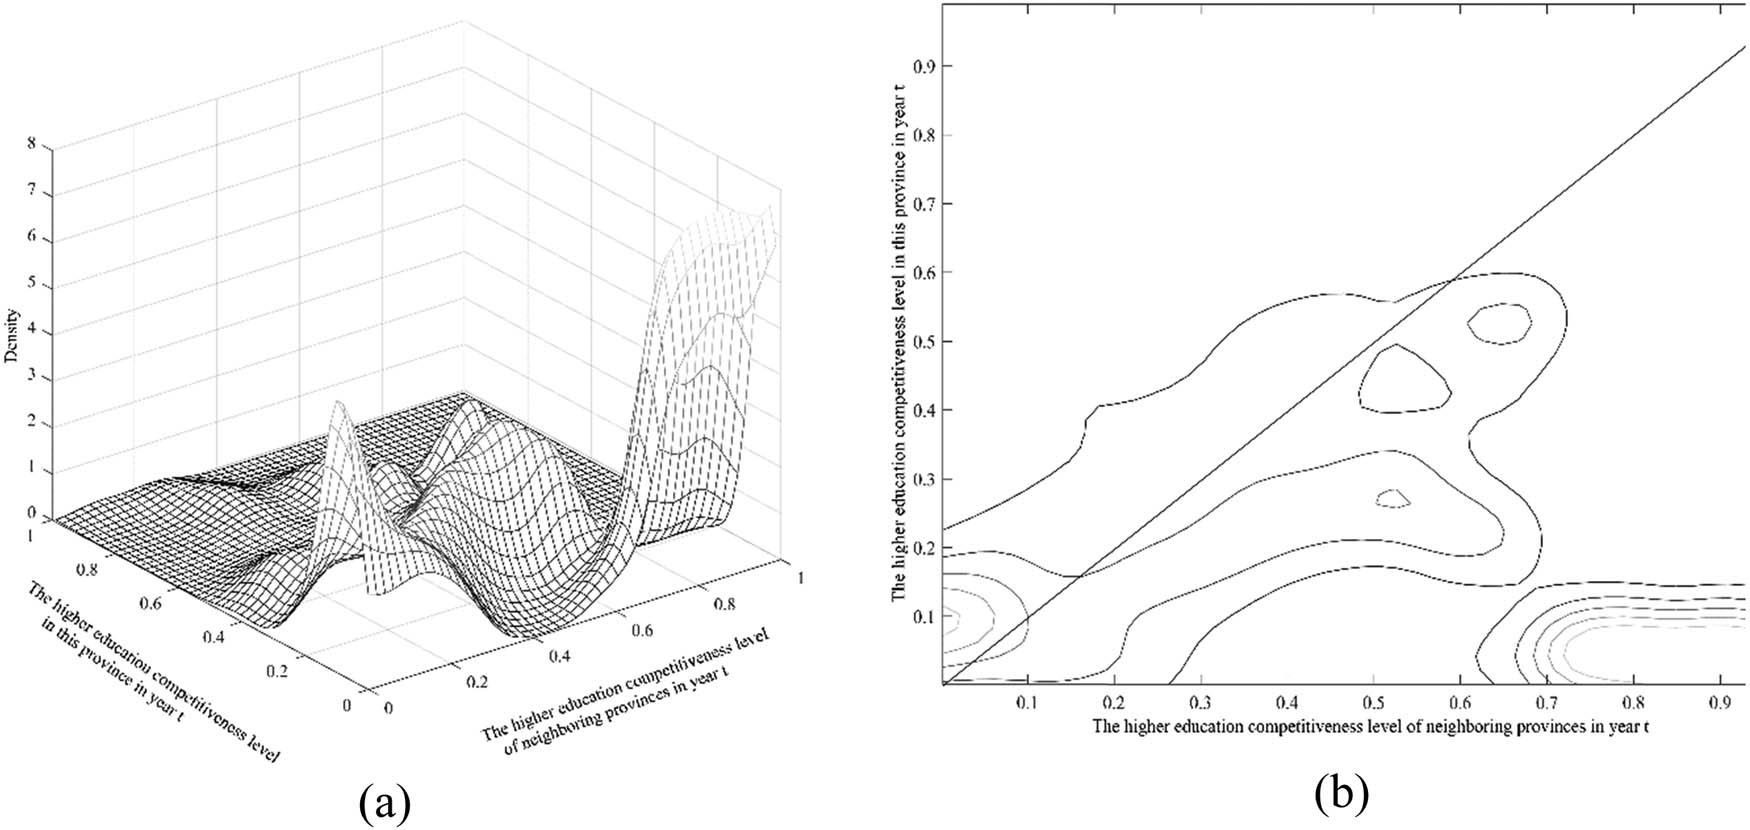
Kernel density map and contour lines of China’s higher education competitiveness level under spatial static conditions; (a) spatial static Kernel density, (b) spatial static Kernel density contour lines.
According to Figure 4, the evolution trend of China’s higher education competitiveness level under spatial static conditions exhibits a “discontinuity” phenomenon. Specifically, with 0.6 as the dividing line for the higher education competitiveness level of neighboring provinces, the evolution trends are quite different. When the higher education competitiveness level of neighboring provinces on the X-axis is below 0.1, the probability body is parallel to the X-axis, indicating that being adjacent to provinces with a level below 0.1 does not significantly improve the higher education competitiveness level of the province. When the higher education competitiveness level of neighboring provinces on the X-axis is between 0.1 and 0.6, the probability body tends to be close to the positive 45° diagonal line, indicating that the spatial positive correlation is more significant at this time. The flow of educational resources, technology, and human capital between neighboring provinces contributes to the coordinated development and mutual improvement of Higher Education Competitiveness Level across provinces. When the higher education competitiveness level of neighboring provinces is above 0.6, the probability body significantly deviates downward, concentrating at 0–0.2 on the Y-axis, indicating that being adjacent to high-level provinces does not significantly affect the improvement of the higher education competitiveness level of the province. When there is a significant gap between the Higher Education Competitiveness Level of neighboring provinces and the province, the flow of elements related to higher education tends to be more concentrated in the more developed provinces, causing a siphoning effect in neighboring provinces.
4.2.4 Kernel Density Estimation of China’s Higher Education Competitiveness Level under Spatial Dynamic Conditions
Figure 5 reports the Kernel density estimation results under spatial dynamic conditions, which consider both spatial factors and the time span, further examining the dynamic changes in the future development level of higher education competitiveness in a province due to its neighboring provinces in the current period. In Figure 5, the X-axis represents the higher education competitiveness level of neighboring provinces in year t, and the Y-axis represents the higher education competitiveness level of the province in year t + 3. Compared with spatial static conditions, the overall probability body distribution under spatial dynamic conditions is similar but with some differences, indicating that the time factor can affect the interaction between provinces in the development of China’s higher education competitiveness. Similar to Figure 4, Figure 5 also uses 0.6 as the dividing line for the higher education competitiveness level of neighboring provinces. When the higher education competitiveness level of neighboring provinces in year t is between 0 and 0.6, the probability body tends to be close to the positive 45° diagonal line, indicating that the higher education competitiveness level between provinces shows a spatial positive correlation. Compared to Figure 4, the probability body distribution in the Y-axis direction in Figure 5 presents a more dispersed trend, indicating that the spatial correlation of Higher Education Competitiveness Level between provinces is weakened under the condition of time lag. When the higher education competitiveness level of neighboring provinces on the X-axis is above 0.6, the 3-year lag period does not show significant differences. Overall, for neighboring provinces with higher Higher Education Competitiveness Level, the time condition has not played a significant role in promoting the upward transfer of the province’s higher education competitiveness level. However, for neighboring provinces with low and medium Higher Education Competitiveness Level, extending the time span can significantly reduce the spatial correlation effect between provinces.

Kernel density map and contour lines of China’s higher education competitiveness level under spatial dynamic conditions: (a) Spatial dynamic Kernel density, (b) contour lines of spatial dynamic Kernel density.
4.2.5 The Markov Chain Analysis method of China’s Higher Education Competitiveness Level
This study uses the Markov chain analysis method to explore the direction and transition probability of Higher Education Competitiveness Level in different regions and further explain the dynamic evolution trend of China’s higher education competitiveness level based on the Kernel density estimation analysis. This article divides China’s provinces’ Higher Education Competitiveness Level (HECL) into four levels using the equal division method: low level (0 < HECL ≤ 25%), medium-low level (25% < HECL ≤ 50%), medium-high level (50% < HECL ≤ 75%)), and high level (75% < HECL). The Markov transition probability matrix of China’s higher education competitiveness level state transition for 2008–2020 is then calculated with a time lag of 1 year, 2 years, 3 years, and 4 years, as shown in Table 2.
Traditional Markov transition probability matrix of higher education competitiveness level in China
| Time span | Type | Ⅰ | Ⅱ | Ⅲ | Ⅳ |
|---|---|---|---|---|---|
| t + 1 | Ⅰ | 0.844 | 0.135 | 0.021 | 0.000 |
| Ⅱ | 0.097 | 0.720 | 0.140 | 0.043 | |
| Ⅲ | 0.000 | 0.174 | 0.750 | 0.076 | |
| Ⅳ | 0.000 | 0.000 | 0.088 | 0.912 | |
| t + 2 | Ⅰ | 0.767 | 0.211 | 0.022 | 0.000 |
| Ⅱ | 0.133 | 0.627 | 0.205 | 0.036 | |
| Ⅲ | 0.000 | 0.209 | 0.651 | 0.140 | |
| Ⅳ | 0.000 | 0.012 | 0.122 | 0.866 | |
| t + 3 | Ⅰ | 0.702 | 0.250 | 0.048 | 0.000 |
| Ⅱ | 0.130 | 0.584 | 0.247 | 0.039 | |
| Ⅲ | 0.013 | 0.197 | 0.618 | 0.171 | |
| Ⅳ | 0.000 | 0.027 | 0.110 | 0.863 | |
| t + 4 | Ⅰ | 0.633 | 0.316 | 0.051 | 0.000 |
| Ⅱ | 0.134 | 0.478 | 0.343 | 0.045 | |
| Ⅲ | 0.000 | 0.246 | 0.551 | 0.203 | |
| Ⅳ | 0.000 | 0.016 | 0.094 | 0.891 |
Table 2 shows that regardless of the time span, the probability values on the diagonal are higher than the probability values in other positions. Except for the medium-low level at t = t + 4, the other diagonal probability values are greater than 0.5, indicating that when not considering the impact of spatial factors, the trend of Higher Education Competitiveness Level in various provinces of China is relatively stable, with low mobility but strong persistence. It is difficult for provinces at different levels to achieve level transitions. This result is consistent with the unconditional Kernel density estimation result. As the time span increases, the probability values on the diagonal decrease, and the convergence trend of Higher Education Competitiveness Level in various provinces weakens with the delay of time, and the stability gradually decreases. Second, the state transition of Higher Education Competitiveness Level in provinces usually occurs at adjacent level intervals. Under different time spans, the transition probabilities of each level are almost zero, indicating that the transition speed of Higher Education Competitiveness Level in various provinces is slow. As the time span increases, the probability of low-level to medium-high level transitions increases year by year, suggesting that provinces with lower Higher Education Competitiveness Level may achieve faster development in a certain period in the future, while other provinces may have difficulty achieving leapfrog development.
Table 3 presents the Markov transition probability matrix considering spatial lag terms. As shown in Table 3, regardless of the time span, the probability values on the diagonal are greater than those in other positions, indicating that when considering both time and space factors, the mobility trend of Higher Education Competitiveness Level in adjacent provinces is significantly enhanced.
Spatial Markov transition probability matrix of higher education competitiveness level in China
| t/t + 1 | Type | Ⅰ | Ⅱ | Ⅲ | Ⅳ | t/t + 2 | Type | Ⅰ | Ⅱ | Ⅲ | Ⅳ |
|---|---|---|---|---|---|---|---|---|---|---|---|
| Ⅰ | Ⅰ | 0.706 | 0.294 | 0.000 | 0.000 | Ⅰ | Ⅰ | 0.625 | 0.375 | 0.000 | 0.000 |
| Ⅱ | 0.167 | 0.333 | 0.167 | 0.333 | Ⅱ | 0.333 | 0.500 | 0.000 | 0.167 | ||
| Ⅲ | 0.000 | 0.333 | 0.333 | 0.333 | Ⅲ | 0.000 | 0.333 | 0.333 | 0.333 | ||
| Ⅳ | 0.000 | 0.000 | 0.000 | 1.000 | Ⅳ | 0.000 | 0.000 | 0.000 | 1.000 | ||
| Ⅱ | Ⅰ | 0.923 | 0.058 | 0.019 | 0.000 | Ⅱ | Ⅰ | 0.833 | 0.146 | 0.021 | 0.000 |
| Ⅱ | 0.125 | 0.667 | 0.125 | 0.083 | Ⅱ | 0.150 | 0.600 | 0.150 | 0.100 | ||
| Ⅲ | 0.000 | 0.192 | 0.692 | 0.115 | Ⅲ | 0.000 | 0.280 | 0.560 | 0.160 | ||
| Ⅳ | 0.000 | 0.000 | 0.045 | 0.955 | Ⅳ | 0.000 | 0.000 | 0.050 | 0.950 | ||
| Ⅲ | Ⅰ | 0.643 | 0.286 | 0.071 | 0.000 | Ⅲ | Ⅰ | 0.771 | 0.157 | 0.071 | 0.000 |
| Ⅱ | 0.091 | 0.741 | 0.168 | 0.000 | Ⅱ | 0.200 | 0.600 | 0.200 | 0.000 | ||
| Ⅲ | 0.000 | 0.136 | 0.718 | 0.145 | Ⅲ | 0.100 | 0.171 | 0.607 | 0.122 | ||
| Ⅳ | 0.000 | 0.000 | 0.122 | 0.878 | Ⅳ | 0.000 | 0.027 | 0.162 | 0.811 | ||
| Ⅳ | Ⅰ | 0.923 | 0.077 | 0.000 | 0.000 | Ⅳ | Ⅰ | 0.917 | 0.083 | 0.000 | 0.000 |
| Ⅱ | 0.053 | 0.684 | 0.263 | 0.000 | Ⅱ | 0.118 | 0.706 | 0.176 | 0.000 | ||
| Ⅲ | 0.000 | 0.211 | 0.737 | 0.053 | Ⅲ | 0.000 | 0.176 | 0.706 | 0.118 | ||
| Ⅳ | 0.000 | 0.000 | 0.074 | 0.926 | Ⅳ | 0.000 | 0.000 | 0.125 | 0.875 | ||
| t/t + 3 | Type | Ⅰ | Ⅱ | Ⅲ | Ⅳ | t/t + 4 | Type | Ⅰ | Ⅱ | Ⅲ | Ⅳ |
| Ⅰ | Ⅰ | 0.833 | 0.100 | 0.067 | 0.000 | Ⅰ | Ⅰ | 0.571 | 0.357 | 0.071 | 0.000 |
| Ⅱ | 0.333 | 0.500 | 0.000 | 0.167 | Ⅱ | 0.167 | 0.500 | 0.167 | 0.167 | ||
| Ⅲ | 0.000 | 0.167 | 0.666 | 0.167 | Ⅲ | 0.000 | 0.333 | 0.667 | 0.000 | ||
| Ⅳ | 0.000 | 0.000 | 0.000 | 1.000 | Ⅳ | 0.000 | 0.000 | 0.000 | 1.000 | ||
| Ⅱ | Ⅰ | 0.795 | 0.182 | 0.023 | 0.000 | Ⅱ | Ⅰ | 0.683 | 0.293 | 0.024 | 0.000 |
| Ⅱ | 0.056 | 0.667 | 0.167 | 0.111 | Ⅱ | 0.143 | 0.429 | 0.286 | 0.143 | ||
| Ⅲ | 0.000 | 0.273 | 0.545 | 0.182 | Ⅲ | 0.000 | 0.250 | 0.550 | 0.200 | ||
| Ⅳ | 0.000 | 0.056 | 0.000 | 0.944 | Ⅳ | 0.000 | 0.000 | 0.000 | 1.000 | ||
| Ⅲ | Ⅰ | 0.700 | 0.229 | 0.071 | 0.000 | Ⅲ | Ⅰ | 0.357 | 0.571 | 0.071 | 0.000 |
| Ⅱ | 0.167 | 0.583 | 0.250 | 0.000 | Ⅱ | 0.125 | 0.500 | 0.375 | 0.000 | ||
| Ⅲ | 0.000 | 0.211 | 0.658 | 0.132 | Ⅲ | 0.000 | 0.257 | 0.571 | 0.171 | ||
| Ⅳ | 0.000 | 0.030 | 0.182 | 0.788 | Ⅳ | 0.000 | 0.034 | 0.138 | 0.828 | ||
| Ⅳ | Ⅰ | 0.909 | 0.000 | 0.091 | 0.000 | Ⅳ | Ⅰ | 0.900 | 0.000 | 0.100 | 0.000 |
| Ⅱ | 0.059 | 0.706 | 0.235 | 0.000 | Ⅱ | 0.133 | 0.600 | 0.267 | 0.000 | ||
| Ⅲ | 0.077 | 0.077 | 0.692 | 0.154 | Ⅲ | 0.000 | 0.182 | 0.636 | 0.182 | ||
| Ⅳ | 0.000 | 0.000 | 0.095 | 0.905 | Ⅳ | 0.000 | 0.000 | 0.111 | 0.889 |
When the higher education competitiveness of adjacent provinces is at medium-low and medium-high levels, the probability values on the diagonal are lower than those when the higher education competitiveness of adjacent provinces is at low and high levels. When the higher education competitiveness of adjacent provinces is at a medium level, the Higher Education Competitiveness Level of various provinces begin to show a significant positive spatial correlation, which is consistent with the conclusions drawn from the Kernel density estimation analysis under the spatial conditions mentioned earlier. Secondly, under various time spans, the probability values not directly adjacent to the diagonal values are also mostly zero or close to zero, indicating that as the time span extends, it becomes challenging for provinces to achieve leapfrog development in higher education competitiveness, regardless of the level of higher education competitiveness of adjacent provinces.
The traditional Markov chain analysis shows that the development trend of higher education in each province of China is relatively stable. With the extension of time span, the stability of each province’s higher education competitiveness level is gradually weakened. Spatial Markov chain analysis shows that after considering the spatial factor, the level of higher education competitiveness of each province remains unchanged. Whether considering the spatial factor or not, the level of higher education competitiveness of each province is difficult to achieve a leap forward improvement.
5 Analysis of Differences and Sources of Higher Education Competitiveness Level in China
To further analyze the regional differences in Higher Education Competitiveness Level across the country and the three major regions of East, Central, and West, this study uses the Dagum Gini coefficient and its subgroup decomposition method to analyze the regional differences and sources of Higher Education Competitiveness Level in China. The results are shown in Table 4.
Differences and decomposition of higher education competitiveness level in China
| Year | Gini coefficient | Intro-regional difference | Inter-regional difference | Contribution rate (%) | ||||||
|---|---|---|---|---|---|---|---|---|---|---|
| Eastern Region | Central Region | Western Region | Eastern-Central Region | Eastern-Western Region | Central-Western Region | Intro-region | Inter-region | Supervariation density | ||
| 2008 | 0.445 | 0.502 | 0.331 | 0.221 | 0.377 | 0.612 | 0.459 | 26.20 | 60.26 | 13.54 |
| 2009 | 0.428 | 0.491 | 0.319 | 0.203 | 0.363 | 0.583 | 0.439 | 26.50 | 58.58 | 14.92 |
| 2010 | 0.421 | 0.467 | 0.321 | 0.190 | 0.364 | 0.573 | 0.415 | 26.60 | 59.17 | 14.23 |
| 2011 | 0.416 | 0.452 | 0.328 | 0.201 | 0.359 | 0.561 | 0.409 | 27.15 | 57.32 | 15.54 |
| 2012 | 0.405 | 0.442 | 0.307 | 0.191 | 0.304 | 0.528 | 0.408 | 27.05 | 56.03 | 16.92 |
| 2013 | 0.367 | 0.432 | 0.279 | 0.182 | 0.278 | 0.509 | 0.403 | 26.99 | 55.26 | 17.75 |
| 2014 | 0.369 | 0.423 | 0.285 | 0.179 | 0.289 | 0.510 | 0.389 | 27.08 | 55.84 | 17.08 |
| 2015 | 0.326 | 0.369 | 0.262 | 0.174 | 0.251 | 0.439 | 0.349 | 28.06 | 51.05 | 20.89 |
| 2016 | 0.323 | 0.360 | 0.262 | 0.174 | 0.251 | 0.435 | 0.344 | 28.05 | 50.94 | 21.01 |
| 2017 | 0.354 | 0.380 | 0.285 | 0.187 | 0.296 | 0.481 | 0.349 | 27.62 | 55.72 | 16.66 |
| 2018 | 0.355 | 0.394 | 0.279 | 0.171 | 0.287 | 0.490 | 0.359 | 27.21 | 56.52 | 16.27 |
| 2019 | 0.388 | 0.419 | 0.316 | 0.209 | 0.334 | 0.518 | 0.374 | 27.97 | 54.25 | 17.78 |
| 2020 | 0.378 | 0.417 | 0.301 | 0.211 | 0.328 | 0.502 | 0.366 | 28.07 | 53.78 | 18.16 |
5.1 Overall Difference Analysis of Higher Education Competitiveness Level in China
According to the results reported in Table 4, the overall difference in Higher Education Competitiveness Level in China shows a downward trend. The overall Gini coefficient of Higher Education Competitiveness Level in China decreased from 0.445 in 2008 to 0.378 in 2020, with an overall decline of 15.1%. During the sample observation period, the overall difference in Higher Education Competitiveness Level in China showed a trend of first decreasing and then increasing. Specifically, from 2008 to 2016, the overall Gini coefficient of Higher Education Competitiveness Level showed a downward trend year by year, reaching a minimum of 0.323 in 2016, and then rebounding slightly. From 2017 to 2020, the higher education competitiveness level in China showed a slight upward trend during this period. Overall, this indicates that the differences in Higher Education Competitiveness Level among provinces in China are gradually decreasing year by year.
5.2 Analysis of Intra-regional Differences in Higher Education Competitiveness Level in China
According to the results reported in Table 4 and Figure 6, the overall Gini coefficient of Higher Education Competitiveness Level in China is similar to the intra-regional Gini coefficient of the eastern, central, and western regions, and there are differences in the evolution of the Gini coefficient within each region. The Gini coefficient within the eastern region is higher than the overall Gini coefficient and the Gini coefficient within the central and western regions. From the perspective of the three major regions, the Gini coefficient within the eastern region decreased from 0.502 in 2008 to 0.417 in 2020, a decrease of 16.9%. Among them, the period from 2008 to 2014 was a stage of slight decline, the period from 2014 to 2016 showed a significant decline, and the period from 2017 to 2020 was a stage of slow growth with limited fluctuations. The Gini coefficient within the central region decreased from 0.331 in 2008 to 0.301 in 2020, a decline of 9%, showing a fluctuating downward trend. The Gini coefficient within the western region decreased from 0.221 in 2008 to 0.211 in 2020, a decline of 5%. The Gini coefficient within the western region is only about half of the overall national level. The western region initially had a lower level of higher education and developed more slowly compared to the eastern and central regions, so the difference in the Gini coefficient within the region is smaller. Overall, the internal differences in Higher Education Competitiveness Level in China’s three major regions show a narrowing trend.

Overall differences and intra-regional differences in higher education competitiveness level in China.
5.3 Analysis of Inter-regional Differences in Higher Education Competitiveness Level in China
According to the results reported in Table 4 and Figure 7, during the sample observation period, the differences between regions showed a decline or fluctuating downward trend, with similar trends. After a slight decline, there was a brief rise. From 2008 to 2020, the average Gini coefficient of inter-regional differences in Higher Education Competitiveness Level decreased in the following order: Eastern Region – Western Region > Central Region – Western Region > Eastern Region – Central Region. This indicates that the difference in Higher Education Competitiveness Level between the eastern and western regions is the largest, while the difference between the eastern and central regions is relatively smaller. The inter-regional differences between the central region and other regions are relatively stable, and the inter-regional differences show a narrowing trend. From 2008 to 2020, the inter-regional difference between the eastern and western regions decreased from 0.612 to 0.502, a decline of 19.97%. Among them, the largest decline occurred from 2008 to 2016, with the inter-regional difference between the eastern and western regions decreasing from 0.612 to 0.435, a decline of 28.9%. From 2008 to 2020, the inter-regional difference between the eastern and central regions decreased from 0.377 to 0.328, a decline of 13%. Among them, the largest decline occurred from 2008 to 2016, with the inter-regional difference between the eastern and central regions decreasing from 0.377 to 0.251, a decline of 33.4%. From 2008 to 2020, the inter-regional difference between the central and western regions decreased from 0.459 to 0.366, a decline of 20.3%, showing a fluctuating downward trend.
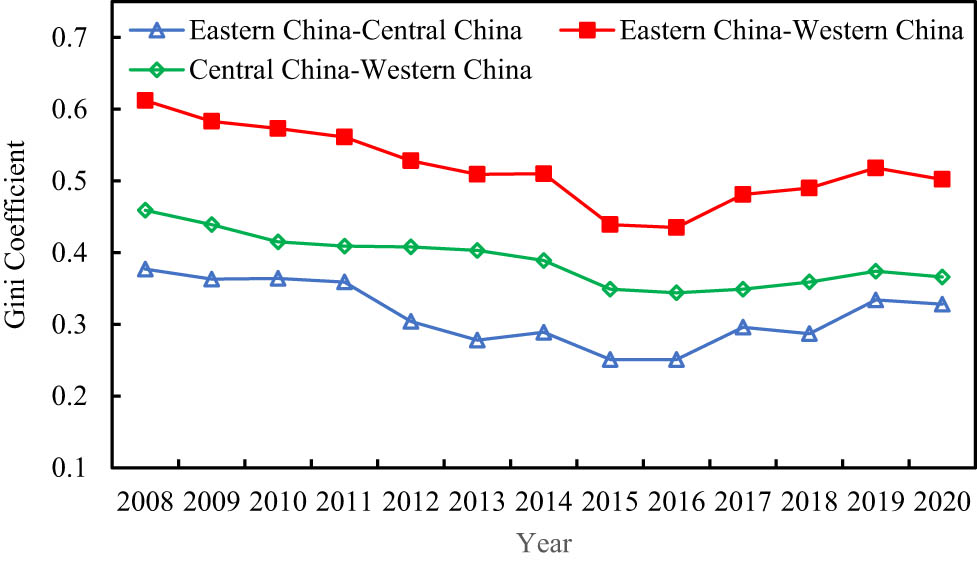
Inter-regional differences in higher education competitiveness level in China.
5.4 Analysis of the Sources of Differences in Higher Education Competitiveness Level in China
From the perspective of spatial sources of regional differences, inter-regional differences, intra-regional differences, and supravariate density are all spatial sources of regional differences in Higher Education Competitiveness Level. Among them, intra-regional differences measure the regional differences in Higher Education Competitiveness Level among provinces within the three major regions; inter-regional differences measure the pure regional differences between regions with high average levels of higher education competitiveness and regions with low levels of higher education competitiveness; and supravariate density measures the degree of cross-group crossover of inter-regional outlier values. As shown in Figure 8, inter-regional differences are the main source of regional differences in higher education competitiveness in China. From 2008 to 2020, the average contribution of inter-regional differences to the overall gap reached 55.75%, the average contribution of intra-regional differences to the overall gap was 27.27%, and the average contribution rate of supravariate density was 16.98%. The contribution rate of inter-regional differences in Higher Education Competitiveness Level in China decreased from 60.26% in 2008 to 53.78% in 2020, a decline of 10.75%; the contribution rate of intra-regional differences in 2020 increased by 7.14% compared to 2008, and the contribution rate of supravariate density in 2020 increased by 34.12% compared to 2008. Therefore, improving the Higher Education Competitiveness Level in the central and western regions, especially narrowing the gap between regions, is key to addressing the imbalance in China’s higher education development.

Spatial sources of regional differences in higher education competitiveness level in China.
6 Conclusions and Implications
6.1 Main Contributions
In this article, using the DPSIR model, the authors constructed an evaluation index system for Higher Education Competitiveness Level from the perspectives of driving force, pressure, state, impact, and response. The authors employed the entropy weight TOPSIS method to measure the Higher Education Competitiveness Level of 31 provinces in China from 2008 to 2020 and further analyzed their spatiotemporal pattern. Based on this, the authors analyzed the dynamic evolution and long-term transition trends of Higher Education Competitiveness Level using traditional spatial Kernel density estimation methods and Markov chain analysis method, and examined the differences and their sources in Higher Education Competitiveness Level using Dagum’s Gini coefficient. The research conclusions are as follows:
From the measurement results, during the sample observation period, China’s higher education competitiveness level showed a steady upward trend, with the average level of higher education competitiveness rising from 0.282 in 2008 to 0.335 in 2020, an overall increase of 18.79%. However, the overall level remains relatively low, with only one-third of provinces reaching the national average level. There are significant regional differences and distinct regional characteristics, presenting an imbalanced spatial pattern of development with stronger performance in the east and weaker performance in the west.
From the perspective of dynamic evolution, under spatial conditions, the results of static Kernel density estimation and dynamic Kernel density estimation are similar but different. When neighboring provinces’ Higher Education Competitiveness Level are at a high level, there is no spatial positive correlation between provinces in both static and dynamic estimation results. When neighboring provinces’ Higher Education Competitiveness Level are at medium or low levels, considering the time factor, the spatial positive correlation between provinces is significantly weakened. Traditional Markov chain analysis shows that the development trends of higher education in various provinces in China are relatively stable, and the stability of Higher Education Competitiveness Level in each province gradually weakens with the extension of time span. Spatial Markov chain analysis shows that, considering spatial factors, the Higher Education Competitiveness Level of each province remains unchanged, and it is difficult for the Higher Education Competitiveness Level of each province to achieve a leapfrogging improvement, regardless of whether spatial factors are considered or not.
In terms of regional differences, the overall differences in Higher Education Competitiveness Level show a downward trend, with inter-regional differences being the main source, with an average contribution rate of 55.75%. The differences mainly come from the differences between the three major regions, and the internal differences within the three major regions also show different degrees of downward trends. Among them, the internal differences in the eastern region have the largest decline, followed by the central region, and the western region has the smallest decline. In addition, the differences between the eastern and western regions are the largest, the differences between the central and western regions are intermediate, and the differences between the eastern and central regions are the smallest.
6.2 Policy Implications
Access to quality higher education can significantly impact social mobility and reduce inequality. Governments and institutions must ensure that education remains accessible to all segments of society, regardless of socio-economic background, ethnicity, or geographic location. To further improve China’s Higher Education Competitiveness Level, reduce regional differences, achieve high-quality and sustainable development of higher education, and promote the construction of China’s modern education system, this article draws the following implications and suggestions based on the above research conclusions:
Thoroughly implement the concept of sustainable development. At present, China’s higher education competitiveness level is still relatively low, and local governments and universities should fully recognize the important role of higher education in promoting economic and social development. In October 2019, six departments, including the National Development and Reform Commission, jointly issued a national pilot program for the integration between industry and education. The program proposed deepening the integration between industry and education to promote the organic connection of education chains, talent chains, industry chains, and innovation chains. This strategic measure aims to facilitate mutual penetration, coordination, and advancement of education-oriented development, talent-led development, industry innovation development, and high-quality economic growth. The 20th National Congress report emphasized the importance of pursuing education-oriented development, self-reliance and self-improvement in science and technology, and talent-driven leadership. It highlighted the need to expedite China’s journey towards becoming a powerhouse in education, science, and talent. The report called for establishing a mechanism for the coordinated development of higher education and industry clusters, aiming to integrate talent cultivation with social needs and scientific research innovation with achievement transformation. Universities were urged to leverage their strengths in areas like enterprises, industries, technologies, and talents to deepen industry-education integration. They should create interdisciplinary platforms for applied technology research and transformation, foster professional ability innovation, support innovation and entrepreneurship incubation, and facilitate the organic connection of industry chains, innovation chains, education chains, and talent chains.
Adopt tailored development strategies to drive the upward leap of higher education competitiveness. The higher education competitiveness level in the eastern region has always maintained a leading advantage, while the higher education competitiveness level in the western region is relatively lagging. The primary task for the western region is to learn from successful development experiences in order to enhance the foundational level of higher education. Continued efforts should be made to increase support in terms of funds, talents, and technology in the central and western regions. It is important to provide the necessary guarantee conditions for the development of higher education in these regions, promoting their continual enhancement of higher education competitiveness and gradually narrowing the gap with the eastern region.
The issue of regional disparities in the development of higher education, particularly between the three major regions, needs to be effectively addressed. In order to achieve a new leap in the level of higher education competitiveness in each province, there should be a focus on the leading and linking roles of developed provinces in the east. This involves promoting the flow of educational and technological resources, enhancing regional relevance, strengthening communication and cooperation among regions, rational resource allocation, and fully utilizing and developing the spatial spillover effects of higher education development. By driving the radiation effect of developed regions on relatively backward regions, we can prevent the further expansion of regional development imbalances and achieve coordinated development of higher education across multiple regions. Central and western regions, based on their own resource advantages, should work in conjunction with relevant government support policies. They should tap into resources and talent, strengthen the construction of the higher education system within the region, and enhance the level of higher education competitiveness.
6.3 Research Limitations
In the era of globalization, countries are increasingly competing in the knowledge economy. Higher education institutions serve as hubs for knowledge creation, dissemination, and innovation, playing a crucial role in driving economic growth and prosperity. Although this study has measured the level of higher education competitiveness in China and explored regional disparities, there are limitations to this research. First, this study was based on panel data from 31 provinces in China, and the research scale is relatively macro. In the future, panel data at the city level could be used for analysis, as there may be some differences in the status of higher education competitiveness at the small scale, and spatial correlation and spillover effects between small-scale regions may be more obvious. Analyzing at the city level would be helpful in a more comprehensive and detailed analysis of China’s higher education competitiveness. Secondly, while this study has conducted an in-depth analysis of the current situation of China’s higher education competitiveness from multiple perspectives, the driving mechanisms behind this phenomenon require further research. In the future, a driving mechanism model could be constructed to effectively reveal the transmission paths and mechanisms of the various elements of the higher education system. In the future, we will conduct a comparative study of higher education systems in different countries or regions, which can provide valuable insights into the factors driving competitiveness and the effectiveness of various policy interventions.
-
Funding information: This research received funding by the Research Project of Education Department of Hubei Province” Research on the Construction of Internal Teaching Quality Evaluation and Guarantee System of Private Applied Colleges” (Grant No.2020737).
-
Author contributions: All authors have accepted responsibility for the entire content of this manuscript and consented to its submission to the journal, reviewed all the results and approved the final version of the manuscript. YS: investigation, writing – original draft preparation, writing – review and editing; TQ: data curation, revised and reviewed the manuscript; JZ: data curation, formal analysis, investigation; KY: methodology, supervision; XZ: investigation.
-
Conflict of interest: Authors state no conflict of interest.
-
Data availability statement: Data can be obtained from the corresponding author on demand.
-
Article note: As part of the open assessment, reviews and the original submission are available as supplementary files on our website.
References
Abdel-Basset, M., Gunasekaran, M., Mohamed, M., & Chilamkurt, N. (2018). A framework for risk assessment, management and evaluation: Economic tool for quantifying risks in supply chain. Future Generation Computer Systems, 2018, 90.10.1016/j.future.2018.08.035Search in Google Scholar
Adamkiewicz, H. G. (2019). The dimensions of national competitiveness: The empirical analysis based on the world economic forum’s data. Economics and Business Review, 5(3): 92–117.10.18559/ebr.2019.3.6Search in Google Scholar
Alfaro Bernedo, O., Esenarro, D., Rodriguez, C., & Rene Alfaro, M. (2021). The Unified Enterprise Architecture (AEU) as a strategic tool organizational modeling for the funtional competitiveness of universities. 3C Empresa. Investigación y pensamiento crítico, 1, 63–79.10.17993/3cemp.2021.specialissue1.63-79Search in Google Scholar
Bileviciute, E., Draksas, R., Nevera, A., & Vainiute, M. (2019). Competitiveness in higher education: The case of university management. Journal of Competitiveness, 11(4), 5–21.10.7441/joc.2019.04.01Search in Google Scholar
Chang, J., & Liu, J. (2019). Methods and practices for institutional benchmarking based on research impact and competitiveness: A case study of Shanghaitech university. Journal of Data and Information Science, 4(3), 55–72.10.2478/jdis-2019-0015Search in Google Scholar
Duan, T., Feng, J., Zhou, Y., Chang, X., & Li, Y. (2021). Systematic evaluation of management measure effects on the water environment based on the DPSIR-Tapio decoupling model: A case study in the Chaohu Lake watershed, China. Science of the Total Environment, 801, 149528.10.1016/j.scitotenv.2021.149528Search in Google Scholar
Estrada-Real, A. C., & Cantu-Ortiz, F. J. (2022). A data analytics approach for university competitiveness: The QS world university rankings. International Journal on Interactive Design and Manufacturing, 16(3), 871–891.10.1007/s12008-022-00966-2Search in Google Scholar
Fainshmidt, S., Smith, A., & Judge, W. Q. (2016). National competitiveness and porter’s diamond model: The role of MNE penetration and governance quality. Global Strategy Journal, 6(2): 81–104.10.1002/gsj.1116Search in Google Scholar
Fang, K., Zhou, Y., Wang, S., Ye, R., & Guo, S. (2018). Assessing national renewable energy competitiveness of the G20: A revised Porter’s Diamond model. Renewable and Sustainable Energy Reviews, 93(6), 719–731.10.1016/j.rser.2018.05.011Search in Google Scholar
Haj Youssef, M. S., Hussein, H. M., & Christodoulou, I. (2019). Competitiveness and managerial discretion: An empirical investigation at the national-level. Competitiveness Review, 29(2): 181–203.10.1108/CR-01-2017-0011Search in Google Scholar
Kamal, Y., & Yesmin, S. (2022). Competitiveness of global apparel industry: A study based on transaction cost theory. Global Business Review, 09721509221124169.10.1177/09721509221124169Search in Google Scholar
Ke, W., & Wang, J. (2020). Evaluation of urban higher education resources carrying capacity based on entropy weight TOPSIS model. Journal of Statistics and Decision Making, 36(18): 50–53.Search in Google Scholar
Kelly, A. (2016). Measuring research competitiveness in UK universities: Introducing the Herfindahl Index to the 2008 and 2014 research assessment exercises. Assessment and Evaluation in Higher Education, 41(8), 1206–1222.10.1080/02602938.2015.1074979Search in Google Scholar
Krägeloh, C. U., Medvedev, O. N., Hill. E. M., Webster, C. S., Booth, R. J., & Henning, M. A. (2019). Improving measurement of trait competitiveness: A rasch analysis of the revised competitiveness index with samples from New Zealand and US university students. Psychological Reports, 122(2): 689–708.10.1177/0033294118762548Search in Google Scholar
Li, H. L., & Yu, Y. T. (2013). Research on the evaluation of expert scoring method in the competitiveness of high colleges and universities of Jiangxi Province. Proceedings of 2013 6th International Conference on Information Management, Innovation Management and Industrial Engineering, (6th International Conference on Information Management, Innovation Management and Industrial Engineering (ICIII)) (pp. 448–450).10.1109/ICIII.2013.6702970Search in Google Scholar
Li, Z., Cai, Y., & Hu, S. (2021). Research on systemic financial risk measurement based on HMM and text mining: A case of China financial market. IEEE Access, 9, 22171–22185.10.1109/ACCESS.2021.3055967Search in Google Scholar
Lin, L. (2020). An evaluation system and its model for educational competitiveness of universities. International Journal of Emerging Technologies in Learning, 15(11), 188–201.10.3991/ijet.v15i11.14521Search in Google Scholar
Liu, L., Li, J., Wang, J., Liu, F., Cole, J., Sha, J., Jiao, Y., & Zhou, J. (2022). The establishment of an eco-environmental evaluation model for southwest China and eastern South Africa based on the DPSIR framework. Ecological Indicators, 145(3): 109687.10.1016/j.ecolind.2022.109687Search in Google Scholar
Lu, X., Kuang, B., & Li, J. (2018). Regional difference decomposition and policy implications of China’s urban land use efficiency under the environmental restriction. Habitat International, 77(7): 32–39.10.1016/j.habitatint.2017.11.016Search in Google Scholar
Lukwago, J., Martins, A. M. D. A., & Tefera, O. (2023). Drivers and barriers in developing sustainability leadership-a case of natural scientists at Ugandan universities. International Journal of Sustainability in Higher Education, 24(4): 895–910.10.1108/IJSHE-08-2021-0327Search in Google Scholar
Mai, Q., Bai, M., & Li, L. (2023). Study on the dynamic evolution and regional differences of the level of high-quality economic and social development in China. Sustainability, 15(1), 382.10.3390/su15010382Search in Google Scholar
Moskovkin, M. V., Saprykina, T. V., & Sizyoongo, M. (2023). Quantitative comparative analysis of country university competitiveness: The case of the near east and south east Asian countries. Journal of Scientometric Research, 11(3): 350–357.10.5530/jscires.11.3.38Search in Google Scholar
Muerza, V., Larrodé, E., Moreno-Jiménez, J. M., & Royo, B. (2023). Multicriteria evaluation of technological competitiveness in diversification processes. An application to the automotive components industry. International Transactions in Operational Research, 1, 1–23.Search in Google Scholar
Naderi, A. (2022). Efficiency measurement of higher education units using multilevel frontier analysis. Journal of Productivity Analysis, 57(1), 79–92.10.1007/s11123-021-00621-0Search in Google Scholar
Peng, T., Jin, Z., & Xiao, L. (2022). Evaluating low-carbon competitiveness under a DPSIR-Game Theory-TOPSIS model – A case study. Environment, Development and Sustainability, 24(4), 5962–5990.10.1007/s10668-021-01680-xSearch in Google Scholar
Ren, Z. (2020). Evaluation method of port enterprise product quality based on entropy weight TOPSIS. Journal of Coastal Research, 103(9), 766.10.2112/SI103-158.1Search in Google Scholar
Ritchie-Dunham, J. L., Gonçalves, A. C., Huerta, M. A., Mataix, C., Lumbreras, J., Moreno-Serna, J., Spengler, J., & Purcell, W. M. (2023). Advancing sustainability leadership by shifting relational ‘agreement structures’: A transformational higher education change program. Journal of Integrative Environmental Sciences, 20(1), 2190385.10.1080/1943815X.2023.2190385Search in Google Scholar
Shen, G. X., Sun, S. G., Zhang, Y. Z., Meng, S., Qi, X., & Luan, L. (2013). Reliability model choice based on AHP and entropy weight-TOPSIS. Applied Mechanics and Materials, 380–384, 1197–1201.10.4028/www.scientific.net/AMM.380-384.1197Search in Google Scholar
Simina, P. R. A. (2022). The importance of sustainability for university competitiveness. Studies in Business and Economics, 17(1), 187–201.10.2478/sbe-2022-0013Search in Google Scholar
Stoimenova, B. B. (2019). Regional innovation systems and university competitiveness. International Journal of Innovation, 7(2), 227–235.10.5585/iji.v7i2.353Search in Google Scholar
Sun, Y., Wang, D., Yang, F., & Ang, S. (2023). Efficiency evaluation of higher education systems in China: A double frontier parallel DEA model. Computers and Industrial Engineering, 176(1), 108979.10.1016/j.cie.2023.108979Search in Google Scholar
Tang, Z. M. (2021). Building a high quality higher education system: Time background, connotation direction and realization strategy. Higher Education Exploration, 2021(11), 19–24, 42.Search in Google Scholar
Tran, T. V., Pham, T. P., Nguyen, M. H., Do, L., & Phan, H. (2023). Economic efficiency of higher education institutions in Vietnam between 2012 and 2016: A DEA analysis. Journal of Applied Research in Higher Education, 15(1), 199–212.10.1108/JARHE-06-2021-0238Search in Google Scholar
Wan, C., Zhang, D., Yan, X., & Yang, Z. (2018). A novel model for the quantitative evaluation of green port development – A case study of major ports in China. Transportation Research Part D: Transport and Environment, 61, 431–443.10.1016/j.trd.2017.06.021Search in Google Scholar
Wang, M., & Zhou, C. (2023). How does graduate training promote sustainable development of higher education: Evidence from China’s “double first-class” universities’ programs. Sustainability, 15(2), 944.10.3390/su15020944Search in Google Scholar
Xu, L. (2014). A Study on the coordination of regional higher education and economic development level: Based on the analysis of cross-sectional data in 2004 and 2011. Educational Development Research, 34(1), 24–29.Search in Google Scholar
Yang, L. (2018). Evaluation of the development level of higher vocational Education in ethnic minority areas of our country: Based on the evidence of higher vocational Education Development Index. Exploration of Higher Vocational Education, 17(5), 15–21.Search in Google Scholar
Yang, M. H., Zhang, H. X., & Sun Y. N. (2017). Regional disparity and distribution of innovation capability in seven urban agglomerations. Journal of Quantitative & Technological Economics, 34(3), 19.Search in Google Scholar
Yang, Y., Fabus, M., Bae, K. H., & Zhang, M. (2020). A diamond model based analysis for improving the sustainable competitiveness in educational exports by Chinese colleges and universities. Entrepreneurship and Sustainability Issues, 7(3): 1858–1871.10.9770/jesi.2020.7.3(28)Search in Google Scholar
Yanli, L. (2020). Exploration on smart classroom construction based on educational ecology. Journal of Education and Culture Studies, 4(4), 112–116.10.22158/jecs.v4n4p112Search in Google Scholar
Yao, L., Maneejuk, P., Yamaka, W., & Liu, J. (2023). Quantifying the competitiveness of cultural industry and its impact on Chinese economic growth. Sustainability, 15(1), 1–19.10.3390/su15010079Search in Google Scholar
Yousafzai, S., Saeed, R., Rahman, G., & Farish, S. (2022). Spatio-temporal assessment of land use dynamics and urbanization: Linking with environmental aspects and DPSIR framework approach. Environmental Science and Pollution Research, 29(54), 81337–81350.10.1007/s11356-022-21393-6Search in Google Scholar
Yussif, K., Dompreh, E. B., & Gasparatos, A. (2023). Sustainability of urban expansion in Africa: A systematic literature review using the Drivers–Pressures–State–Impact–Response (DPSIR) framework. Sustainability Science, 18(3), 1459–1479.10.1007/s11625-022-01260-6Search in Google Scholar
Zeng H. M., Zhang X. M., Ren Q. L., & Wu F. (2022). Research on influencing factors and spatial equilibrium of vocational education resources distribution. Acta Geographica Sinica, 77(12), 14.Search in Google Scholar
Zhao, R., Fang, C., Liu, H., & Liu, X. (2021). Evaluating urban ecosystem resilience using the DPSIR framework and the ENA model: A case study of 35 cities in China. Sustainable Cities and Society, 72(10), 102997.10.1016/j.scs.2021.102997Search in Google Scholar
Zhao, X., Yin, H., Fang, C., & Liu, X. (2021). For the sustainable development of universities: Exploring the external factors impacting returned early career academic’s research performance in China. Sustainability, 13(3), 1–20.10.3390/su13031333Search in Google Scholar
Zhao, Y., Zhao, X., Fan, D., & Qiu, Y. (2023). A comprehensive method for refining essential SDGs variables for land degradation monitoring based on the DPSIR framework. International Journal of Digital Earth, 16(1), 741–761.10.1080/17538947.2023.2182375Search in Google Scholar
© 2024 the author(s), published by De Gruyter
This work is licensed under the Creative Commons Attribution 4.0 International License.
Articles in the same Issue
- Regular Articles
- Political Turnover and Public Health Provision in Brazilian Municipalities
- Examining the Effects of Trade Liberalisation Using a Gravity Model Approach
- Operating Efficiency in the Capital-Intensive Semiconductor Industry: A Nonparametric Frontier Approach
- Does Health Insurance Boost Subjective Well-being? Examining the Link in China through a National Survey
- An Intelligent Approach for Predicting Stock Market Movements in Emerging Markets Using Optimized Technical Indicators and Neural Networks
- Analysis of the Effect of Digital Financial Inclusion in Promoting Inclusive Growth: Mechanism and Statistical Verification
- Effective Tax Rates and Firm Size under Turnover Tax: Evidence from a Natural Experiment on SMEs
- Re-investigating the Impact of Economic Growth, Energy Consumption, Financial Development, Institutional Quality, and Globalization on Environmental Degradation in OECD Countries
- A Compliance Return Method to Evaluate Different Approaches to Implementing Regulations: The Example of Food Hygiene Standards
- Panel Technical Efficiency of Korean Companies in the Energy Sector based on Digital Capabilities
- Time-varying Investment Dynamics in the USA
- Preferences, Institutions, and Policy Makers: The Case of the New Institutionalization of Science, Technology, and Innovation Governance in Colombia
- The Impact of Geographic Factors on Credit Risk: A Study of Chinese Commercial Banks
- The Heterogeneous Effect and Transmission Paths of Air Pollution on Housing Prices: Evidence from 30 Large- and Medium-Sized Cities in China
- Analysis of Demographic Variables Affecting Digital Citizenship in Turkey
- Green Finance, Environmental Regulations, and Green Technologies in China: Implications for Achieving Green Economic Recovery
- Coupled and Coordinated Development of Economic Growth and Green Sustainability in a Manufacturing Enterprise under the Context of Dual Carbon Goals: Carbon Peaking and Carbon Neutrality
- Revealing the New Nexus in Urban Unemployment Dynamics: The Relationship between Institutional Variables and Long-Term Unemployment in Colombia
- The Roles of the Terms of Trade and the Real Exchange Rate in the Current Account Balance
- Cleaner Production: Analysis of the Role and Path of Green Finance in Controlling Agricultural Nonpoint Source Pollution
- The Research on the Impact of Regional Trade Network Relationships on Value Chain Resilience in China’s Service Industry
- Social Support and Suicidal Ideation among Children of Cross-Border Married Couples
- Asymmetrical Monetary Relations and Involuntary Unemployment in a General Equilibrium Model
- Job Crafting among Airport Security: The Role of Organizational Support, Work Engagement and Social Courage
- Does the Adjustment of Industrial Structure Restrain the Income Gap between Urban and Rural Areas
- Optimizing Emergency Logistics Centre Locations: A Multi-Objective Robust Model
- Geopolitical Risks and Stock Market Volatility in the SAARC Region
- Trade Globalization, Overseas Investment, and Tax Revenue Growth in Sub-Saharan Africa
- Can Government Expenditure Improve the Efficiency of Institutional Elderly-Care Service? – Take Wuhan as an Example
- Media Tone and Earnings Management before the Earnings Announcement: Evidence from China
- Review Articles
- Economic Growth in the Age of Ubiquitous Threats: How Global Risks are Reshaping Growth Theory
- Efficiency Measurement in Healthcare: The Foundations, Variables, and Models – A Narrative Literature Review
- Rethinking the Theoretical Foundation of Economics I: The Multilevel Paradigm
- Financial Literacy as Part of Empowerment Education for Later Life: A Spectrum of Perspectives, Challenges and Implications for Individuals, Educators and Policymakers in the Modern Digital Economy
- Special Issue: Economic Implications of Management and Entrepreneurship - Part II
- Ethnic Entrepreneurship: A Qualitative Study on Entrepreneurial Tendency of Meskhetian Turks Living in the USA in the Context of the Interactive Model
- Bridging Brand Parity with Insights Regarding Consumer Behavior
- The Effect of Green Human Resources Management Practices on Corporate Sustainability from the Perspective of Employees
- Special Issue: Shapes of Performance Evaluation in Economics and Management Decision - Part II
- High-Quality Development of Sports Competition Performance Industry in Chengdu-Chongqing Region Based on Performance Evaluation Theory
- Analysis of Multi-Factor Dynamic Coupling and Government Intervention Level for Urbanization in China: Evidence from the Yangtze River Economic Belt
- The Impact of Environmental Regulation on Technological Innovation of Enterprises: Based on Empirical Evidences of the Implementation of Pollution Charges in China
- Environmental Social Responsibility, Local Environmental Protection Strategy, and Corporate Financial Performance – Empirical Evidence from Heavy Pollution Industry
- The Relationship Between Stock Performance and Money Supply Based on VAR Model in the Context of E-commerce
- A Novel Approach for the Assessment of Logistics Performance Index of EU Countries
- The Decision Behaviour Evaluation of Interrelationships among Personality, Transformational Leadership, Leadership Self-Efficacy, and Commitment for E-Commerce Administrative Managers
- Role of Cultural Factors on Entrepreneurship Across the Diverse Economic Stages: Insights from GEM and GLOBE Data
- Performance Evaluation of Economic Relocation Effect for Environmental Non-Governmental Organizations: Evidence from China
- Functional Analysis of English Carriers and Related Resources of Cultural Communication in Internet Media
- The Influences of Multi-Level Environmental Regulations on Firm Performance in China
- Exploring the Ethnic Cultural Integration Path of Immigrant Communities Based on Ethnic Inter-Embedding
- Analysis of a New Model of Economic Growth in Renewable Energy for Green Computing
- An Empirical Examination of Aging’s Ramifications on Large-scale Agriculture: China’s Perspective
- The Impact of Firm Digital Transformation on Environmental, Social, and Governance Performance: Evidence from China
- Accounting Comparability and Labor Productivity: Evidence from China’s A-Share Listed Firms
- An Empirical Study on the Impact of Tariff Reduction on China’s Textile Industry under the Background of RCEP
- Top Executives’ Overseas Background on Corporate Green Innovation Output: The Mediating Role of Risk Preference
- Neutrosophic Inventory Management: A Cost-Effective Approach
- Mechanism Analysis and Response of Digital Financial Inclusion to Labor Economy based on ANN and Contribution Analysis
- Asset Pricing and Portfolio Investment Management Using Machine Learning: Research Trend Analysis Using Scientometrics
- User-centric Smart City Services for People with Disabilities and the Elderly: A UN SDG Framework Approach
- Research on the Problems and Institutional Optimization Strategies of Rural Collective Economic Organization Governance
- The Impact of the Global Minimum Tax Reform on China and Its Countermeasures
- Sustainable Development of Low-Carbon Supply Chain Economy based on the Internet of Things and Environmental Responsibility
- Measurement of Higher Education Competitiveness Level and Regional Disparities in China from the Perspective of Sustainable Development
- Payment Clearing and Regional Economy Development Based on Panel Data of Sichuan Province
- Coordinated Regional Economic Development: A Study of the Relationship Between Regional Policies and Business Performance
- A Novel Perspective on Prioritizing Investment Projects under Future Uncertainty: Integrating Robustness Analysis with the Net Present Value Model
- Research on Measurement of Manufacturing Industry Chain Resilience Based on Index Contribution Model Driven by Digital Economy
- Special Issue: AEEFI 2023
- Portfolio Allocation, Risk Aversion, and Digital Literacy Among the European Elderly
- Exploring the Heterogeneous Impact of Trade Agreements on Trade: Depth Matters
- Import, Productivity, and Export Performances
- Government Expenditure, Education, and Productivity in the European Union: Effects on Economic Growth
- Replication Study
- Carbon Taxes and CO2 Emissions: A Replication of Andersson (American Economic Journal: Economic Policy, 2019)