The Research on the Impact of Regional Trade Network Relationships on Value Chain Resilience in China’s Service Industry
-
Hanmei Zhang


Abstract
Regional trade network relationships are not only a medium for transmitting shocks to value chains, but also an important vehicle for reconfiguring value chains. This article applies social network analysis, combines regional trade agreements, and describes the current status of regional trade network development in North America, the European Union, and “the Belt and Road,” as well as the individual characteristics of China’s service industry in each regional trade network by using the indicators of trade relations to construct the network density, connectedness, and centrality through clustering analysis. The research found that the complexity of regional trade network relationships has increased over the years. Additionally, the developing trend of equalization is accelerating but still exhibits a “Core-Periphery” structure. Additionally, subregional groups within the regional trade network are increasingly obvious. Further study on the impact of industry regional centrality on value chain resilience revealed that the increase of degree centrality and the betweenness centrality of China’s service industry can conspicuously strengthen value chain resilience in regional trade network relationships. Moreover, balanced regional trade network relationships can reinforce this effect. In contrast, the degree of the polarity of regional trade network relationships exacerbates the weakening motivation of centrality for value chain resilience.
1 Introduction
The Global Value Chain (GVC) is a central mechanism for driving the world economy (Antràs & Chor, 2013). Economic globalization has driven countries to take advantage of their comparative advantages to locate their production chains on a global scale, which has resulted in increased production efficiency and lower production costs. According to data published in GVC Development Report 2021: Beyond Production (Xing et al., 2022), GVC participation in the world’s economies has risen from 35.2 to 44.4% between 1995 and 2020, which was even up to 49.3% in 2018. Moreover, the contribution of GVC to GDP rose from 9.6 to 12.1%, peaking at 14.6% in 2018. Looking at specific countries, from 2000 to 2019, GVC participation increased in almost all countries. For instance, GVC participation in Germany has risen from 45.6 to 52.4%. The GVC plays a significant role in promoting global economic growth and development.
However, the vulnerability of the GVC when subjected to adversity events has also had a significant impact on the countries involved in the chain. At the end of 2019, the outbreak of COVID-19 led to repeated dysfunctional operations and even operational disruption crises in the GVC of numerous industries. Additionally, Sino-US trade conflicts, the Ukraine Crisis, the Israel–Palestinian conflict, other great power games, geopolitical conflicts, and other old and new issues are interlaced, which lead to extreme instability in the GVC. In response, governments have introduced various policies to “reverse globalization” or “de-globalization” (Qu & Yang, 2022). According to UNCTAD, by 2022, trade directly related to GVC accounted for 2/3 of global trade. The fact has led many to worry about the risks and future of GVC, especially the service industry value chain. The development of the chain not only reflects the breadth and depth of their specialized division of labor but also affects the synergy and integration with other industries and the overall division of labor. However, due to the high mobility and embeddedness of the service industry, uncertainties can significantly impact the service industry value chain. Therefore, how to enhance the resilience of China’s service industry value chain in the face of the impact of adversity is a challenge of development that needs to be urgently tackled in the critical period of accelerated reconstruction of the GVC.
Adverse event shocks have led to the “short-chain” of the service industry value chain, bringing risks of “decoupling” and “chain-breaking.” Concurrently, these shocks have also facilitated more intraregional trade and the gradual accentuation of the “regionalization” of value chains. For example, the World Trade Organization reports that, by April 2024, the number of bilateral and regional economic and trade agreements in force globally reached 371. Meanwhile, intraregional trade mediated by regional trade agreements (RTAs) is dynamic and growing at a significant rate. In the case of the Regional Comprehensive Economic Partnership (RCEP), for instance, according to data published by the Ministry of Commerce, intraregional trade within the RCEP reached 5.6 trillion dollars in 2023, representing a notable surge from 2021 before the agreement formally entered into force. The RCEP region attracted a total of 234.1 billion dollars of greenfield investment in 2023, an increase of 29.8%, 2.2 times as high as that of 2021. The regional value chain (RVC), as a third chain independent of global and domestic value chains, becomes a more important link in dual circulation (Sun & Gao, 2018). Besides, the high-quality co-construction of the RVC circulation system will help industries get rid of the low-end lock-in of the GVC. It not only provides a new path for the service industry value chain to complete decoupling and restructuring and carry out structural evolution but also reserves core competencies for adapting to shocks, enhancing resilience, and realizing high-quality development (Changhong & Bin, 2021; Zhen & Wang, 2022). However, the net effect of RVC works based on trade relations. Trade relations are not only a vehicle for the release of positive spillover effects, but also have a scaling impact on the effects through transmission (Zhang, 2023). In particular, against the backdrop of increasingly complex trade associations and the dominance of trade relations over the healthy development of the global economy, regional trade network relationships have gradually become a central influence in enhancing the structural value chain resilience, improving the operational value chain resilience and strengthening the technological value chain resilience (Wang et al., 2021).
Therefore, this article aims to take trade relations as the core, and under the framework of RVC, explores how the optimization and upgrading of regional trade network relations affect the resilience of the Chinese service industry value chain. By clarifying the dynamic evolution of regional trade network environment and relationships, the theoretical framework of the spillover effect of regional trade network relationships on value chains is constructed from the perspective of individual centrality. The effect is then precisely quantified through empirical analysis. The study has the potential to enhance the theoretical frameworks of value chain and industrial upgrading. Concurrently, it offers a novel avenue for the enhancement of the value chain of China’s service industry. That is, optimizing and upgrading regional trade networks not only can enhance the ability of China’s service industry value chain to cope with risky shocks, but also be of great significance in accelerating the construction of a strong service trade country, unimpeded dual circulation, and positively and effectively responding to the challenge of “decoupling and chain-breaking.”
2 Literature Review
Concerning the definition of the service industry, China’s statistical classification of the service industry is subservient to the industrial classification for national economic activities, a system of industrial classification. The classification standard is mainly based on the ISIC standard of the United Nations, and industries are classified according to the nature of economic activities (Fang, 2002). In terms of development history, at the beginning of the reform and opening up, the National Bureau of Statistics and the National Bureau of Standards jointly formulated the Industrial classification for national economic activities. The standard is divided into three hierarchical levels: 15 major categories, 62 intermediate categories, and 222 subcategories, based on the International Standard Industrial Classification of All Economic Activities (1965, Revision 2). Industrial classification for national economic activities and codes for national economic activities (GB/T 4754-1984) issued on December 1, 1984, was formally released in the form of national standards, which was based on the International Standard Industrial Classification of All Economic Activities (1979, Revision 3). Subsequently, four revisions have been conducted in 1994, 2002, 2011, and 2017. Revised as of 2017, Wholesale and retail industry, Transportation, warehousing and postal services, Accommodation and Catering Industry, Information transmission, software and information technology services, Financial Industry, Real Estate Industry, Leasing and business services industry, Scientific Research and Technical Services, Water, Environment and Utilities Management Industry, Resident services, repairs and other services, Education, Health and social work, Culture, sports and entertainment industry, Public Administration, Social Security and Social Organization, and International Organization all fall under the category of service industry. With this category of service industry, scholars have explored the developmental profile of service industries in trade networks. In the domestic trade network, the links between the various sectors of China’s service industry are becoming increasingly close, and the influence of its overall structure on the various subsectors is increasing (Zhu & Wang, 2020). The internal network structure of China’s service industry has been continuously optimized and upgraded, transforming into a modern service industry focusing on finance and insurance, leasing, and business services (Zeng, 2020). Meanwhile, the spatial correlation of the service industry significantly contributes to the optimization of the industrial structure, which is further optimized through the promotion of scientific and technological innovation, the enhancement of production efficiency, and the increase in the demand for services (Chen, 2022). In addition, from the perspective of flow space, China’s service industry labor force is in the regional accumulation of positive dynamics and continuity. The government and the market as two types of dominant subjects both have an impact on the spatial distribution of the service industry trade network (Hu & Li, 2024). In the regional trade network, scholars combined with the “the Belt and Road” initiative found that the scale of “the Belt and Road” service trade has been expanding, and the linkage of service trade among the countries along the route has been significantly strengthened. Additionally, China’s service industry belongs to the “net beneficiary” segment, and the ranking of the centrality is showing an upward trend (Niu et al., 2020; Pan & Liu, 2022). In the inter-industry trade network of RCEP, the growth rate of China’s service industry imports and exports is significantly higher than that of Japan and Korea. Furthermore, China’s service industry has demonstrated a notable enhancement in its intermediary capacity within the trade network, thereby assuming a more prominent “bridge role” (Li & Wang, 2023). China’s service industry is undergoing a period of rapid growth within the global trade network, gradually expanding its influence in the global production network and migrating to the center (Zhu & Guan, 2023). Combined with the context of the development of the digital economy, scholars have found that, in the global cross-border backward and forward spillover network of digital service industry technologies, China is even more powerful in terms of direct influence, counter-control, and spillover influence (Zhao & Zhang, 2024).
GVC resilience is the ability of the GVC to forecast, respond to, recover from, and sustain growth when dealing with external shocks or risks, thereby maintaining the stability and security of GVC operations (Ole et al., 2015). In recent years, scholars have focused on in-depth discussions on the destructive structural reconfiguration of GVC triggered by COVID-19. They argue that the innovation inertia of Chinese enterprises and their excessive dependence on the dominant enterprises in the value chains have exacerbated the risk of chain-breaking. Concurrently, enhancing the resilience of the system in coping with the shocks of future emergencies will be the main direction of reconfiguration (Sun & Wei, 2020; Zhen et al., 2022). Based on this, scholars have quantitatively analyzed the value chain resilience from the perspectives of micro-enterprises and the macro-global perspective (Ambulkar et al., 2015; Yang & Zheng, 2023), and in the context of the rapid development of the digital economy, they have concluded that the “snowball effect” of the transmission of the GVC crisis has been amplified in the digital economy, which has aggravated the shocks of the crisis on the security and stability of the value chain (Tang & Veelenturf, 2019; Yang & Zheng, 2023). However, some scholars have argued that digital platforms can enhance the resilience of value chains to systemic risks by collecting and integrating massive amounts of data and anticipating shocks, generating response mechanisms (Gereffi, 2018). To further enhance value chain resilience, scholars have selected agricultural and industrial value chains as their objects of study (Adu et al., 2021; Claudia & Dagmar, 2023; David et al., 2022), enriching the argumentation from the perspective of value chain governance and supply chain construction (Levalle & Nof, 2015; Zhen & Wang, 2022). Zhen et al. (2022) even condensed the dynamic evolutionary process of value chain system resilience spiraling upwards after being hit by adversity events from the path perspective.
With the deepening development of economic globalization, trade associations between countries have become increasingly close, and crisscrossed trade relations have gradually developed into trade networks (Ma et al., 2016). Trade networks originated as social networks in the 1930s and 1940s when the anthropologist Barnes (1954) first used the concept of “social networks” to analyze the social structure of Norwegian fishing villages. Towards the end of the twentieth century, as computer functions and techniques for large-scale data processing continued to develop and mature, the field of systems science saw the gradual emergence of “complex network theory” (Li, 2009). With the introduction of “small-world networks” by Watts and Strogatz (1998) and scale-free networks by Barabási et al. (1999), network theory has evolved from simple to complex. Since then scholars have employed the concept extensively in anthropology, sociology, psychology, and management to describe and explore social phenomena (Fan, 2014; Thomas, 2024). The process of economic globalization has resulted in the emergence of network-based economic and trade exchanges as a major feature of global economic development. It has triggered scholars to examine the relative position of a country within the international trade network and the characteristics of the network from the perspective of the trade network with greater frequency (Chen, 2011; Liang & Wang, 2024; Lyu & Wei, 2020).
Combined with the complex context of trade networks, scholars have argued that trade network relationships are not only the medium through which the above shocks are transmitted to the value chain but also an important vehicle for value chain fragmenting and restructuring (Ren et al., 2023; Zuo et al., 2023). To fully analyze value chains, it is important to incorporate the intricate trade relations between countries into the study (Giorgio et al., 2009). Ma et al. (2016) examined the impact of a country’s agricultural trade network characteristics on its position in the agricultural value chain division of labor from an agricultural trade network perspective. The study found that network centrality, network relation intensity, and network heterogeneity have robust and significant contributions to a country’s position in the global agricultural value chain division of labor. With the proliferation of RTA, the world is increasingly multipolar (Chen, 2011). Zuo et al. (2024) argue that the RTA network is an important national strategy for China to build an open economy and a significant way to promote an effective connection between domestic and international economic circulations. Many scholars have deepened their research from a regional perspective. Shen & Zhang (2023), focusing on East Asian RVC, argued that, it can play a positive role for East Asian countries to realize the leap of industries to the high end of GVC by optimizing regional trade network relationships. On the other hand, Wen & Wen (2023) argue that RCEP’s network centrality and trade intensity significantly positively impact member states’ position of the GVC division of labor, especially in developed countries.
It can be seen that a great deal of existing research has been conducted on value chain resilience, and regional trade networks. This article proposes to achieve the following breakthroughs based on the existing literature: (1) Although the existing literature has quantitatively analyzed value chain resilience from both micro and macro perspectives, due to industry heterogeneity and the fact that the service industry is an important source of intermediate goods, this article will take the service industry as the object of study to quantitatively analyze value chain resilience so as to clearly identify the feedback of the value chain to shocks from the mesoscopic level. (2) The existing literature has analyzed the impact of trade network relationships on the position of GVC. However, in the context of the impact of uncertainties on value chains and the accelerated fragmentation and restructuration of value chains, how to enhance the resilience of value chains is crucial. Therefore, this article focuses on the impact of trade network relationships on enhancing the resilience of industrial value chains to supplement the research perspective of the existing literature. (3) Scholars have already focused on regional trade network relationships under RTAs, but China’s service industry should not only optimize trade network relationships under RTAs but also catalyze diversified trade relations to release more dividends. Therefore, based on the “tripod” structure of RVC in North America, Europe, and East Asia delineated by Ju et al. (2020), this article, in conjunction with “the Belt and Road” Initiative, selects the three regional trade networks of North America, Europe and “the Belt and Road” as the research area, and utilizes the method of comparative analysis to condense the effect of differentiated regional trade network relationships on the value chain resilience.
3 Method
Social network analysis is the most commonly used analytical method in network research, which can map, quantify, and analyze the linkage patterns between actors in networks, as well as describe and analyze the interdependence and social structure of actors. When social network analysis is applied to the field of trade, a collection of points and links between points can be constructed based on the links between the trading parties. In this case, the points represent the economies involved in global trade, and the links between the points represent the trade links constructed between the economies. The method puts forth a multitude of concepts for measuring the structure, community, and point attributes of trade networks based on trade linkages, centered on volume, quality, and so on. These concepts can be used to analyze the trade network environment, as well as the interests, roles, functions, and positions of the various participants in the trade network.
3.1 Method for Environmental Analysis of Regional Trade Networks
3.1.1 Density
Referring to the overall network density approach proposed by Liu (2006) and Wasserman and Faust (1994), density is a measure of the closeness of relationships between nodes in a network. A higher density means that there is a close relationship between the participants in the network. Moreover, changes in the attitude and behavior of one actor in the network will be transmitted to other participants in the network through the dense network. The article uses the overall network density index to measure it, and the specific formula is as follows:
In this formula, m is the actual number of relationships contained in the network, and n is the number of actors.
3.1.2 Connectedness
Referring to the measure of relatedness given by Krackhardt (1994), connectedness describes the network environment from the perspective of stability. That is, if the increase in the density of a relational network is dependent on individual core nodes, then the other nodes in the network are more dependent on the core nodes. The fluctuation of the core nodes will bring a huge shock to the network connectivity, and the structure of the network will face a great deal of instability. Meanwhile, the network’s connectedness will be lower. On the contrary, if the number of independent pathways in the network, i.e., the connecting lines in the network do not revolve around individual points, then the network has a strong degree of relevance. The higher the degree of connectedness, the more decentralized the network rights are, the more equal the participating subjects are, and the less susceptible they are to the influence of individual points. The article uses the network’s relevance index to measure it, and the formula is as follows:
In this formula, V is the number of unreachable pairs of points in the network, and N is the size of the network.
3.1.3 Core-Periphery Analysis
Core-periphery analysis is a method for specifying the structure of a network. Core nodes are subsystems with high innovative change and manipulation capabilities, while edge nodes are dependent on core nodes. Core and edge nodes together form a complete system of network relationships, in which core nodes dominate and determine the form of the network structure. This article applies Coreness to examine the core-periphery structure of network relationships. Referring to the calculation method proposed by Liu (2004), “core-periphery” analysis was performed by applying the UCINET and the input–output tables of the ADB database data. Meanwhile, referring to the research of Chen (2011), countries with a Coreness greater than 0.1 are classified as core regions, countries with a Coreness of 0.01–0.1 are classified as semi-edge regions, and countries with a Coreness less than 0.01 are classified as edge regions.
3.1.4 Cohesive Subgroup Analysis
Referring to the clustering methods constructed by Watts (1999), cohesive subgroup analysis was performed by applying the UCINET and the input–output tables of the ADB database data. Cohesive subgroup analysis is a method of revealing the internal sub-structure of a network by taking the mutuality of the relationships between individual members as an entry point. Through cohesive subgroup analysis, it is possible to examine in-depth the cohesion of each subject in a network relationship and to clarify the potential patterns of relationships among actors in the context of the goals, norms, and cooperation of the cohesive group.
3.2 Individual Characterization Methods Under Regional Trade Networks
Centrality is a quantitative analysis of an individual’s power, which can clarify what kind of power an individual has or what kind of central position it occupies in the network. Therefore, this article combines degree centrality, betweenness centrality, and closeness centrality proposed by (Freeman, 1979) to quantify the individual characteristics of the Chinese service industry in the network.
3.2.1 Degree Centrality
Degree centrality measures the transactional ability of the actors themselves in the network. If an actor is directly connected to many points in the network, the actor has a higher degree centrality, a stronger trading capacity, and is more central and has more power in the international trade network.
3.2.2 Betweenness Centrality
Betweenness centrality indicator measures an actor’s “control ability”; i.e., the extent to which an actor is positioned between two other actors. If a point is on a shortcut to many other pairs of points, it has a high degree of betweenness centrality, and the actor will be more likely to play an important “intermediary” role in the trade network, and thus be more possible at the center of the network. The formula is as follows:
In this formula,
3.2.3 Closeness Centrality
Closeness centrality indicator represents the extent to which an actor is not controlled by other actors. That is, the closer a point is to other points, the easier it is for that point to transmit information, the more likely it is to be at the center of the network, and the less dependent it is on others. A lower degree of closeness centrality means that the sum of the shortcut distances for an industry in a country to trade with other economies is smaller; i.e., the closer the trade “distance” is, the lower the trade costs are, the more reliable the trade information is, and the easier it is to establish a dominant position in the value chain. The formula is as follows:
In this formula,
To make the overall methods and ideas clearer, a flowchart (Figure 1) has been used.
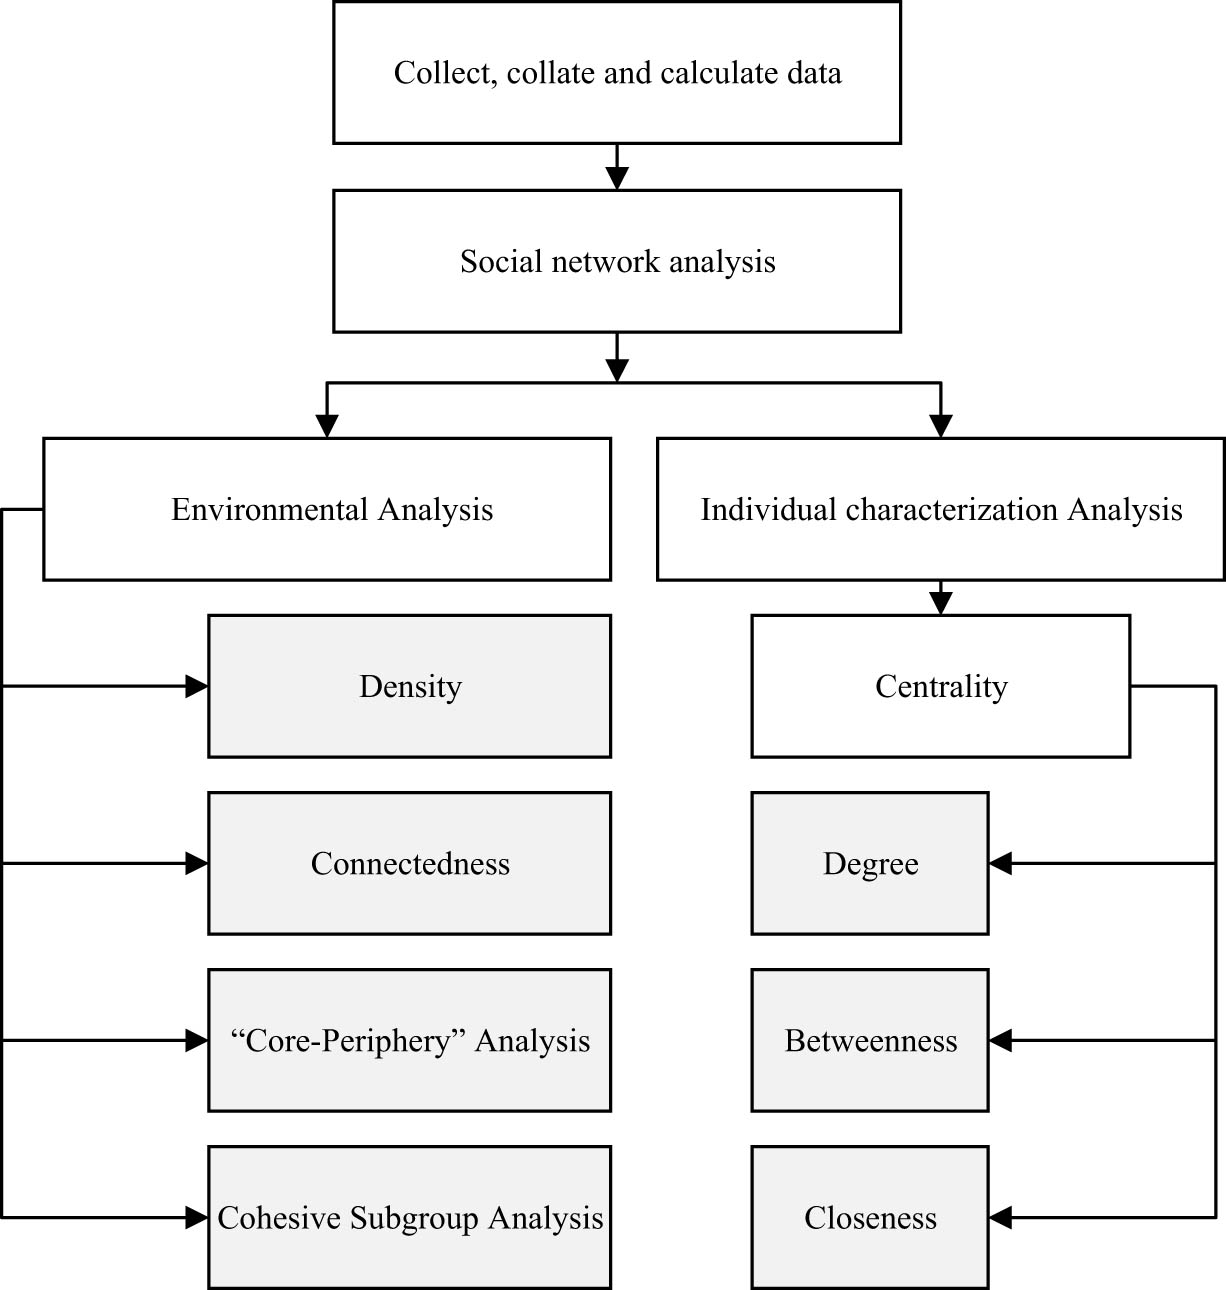
Article application methods and ideas.
4 Development Status of Regional Trade Network Relationships
According to the regional trade network environment analysis method introduced above, the regional trade network environment was first quantitatively analyzed by applying the network density and connectedness indexes. Meanwhile, the regional trade network structure was decomposed through the implementation of core-periphery analysis, and the regional trade network development trend was further condensed through the application of cohesive subgroup analysis.
4.1 North American Regional Trade Network Relationships
Since 2007, the density of the North American regional trade network has shown a trapezoidal fluctuation, and there were obvious inflection points in 2011, 2014, and 2019 (the details are shown in Figure 2). There was a substantial increase in the density of the North American regional trade network relationship in 2011, from 0.583 to 0.667, and the reason for that was the gradual recovery of the economies of the countries after the U.S. subprime crisis in 2007, and the trade relationships between the countries became closer; density fell from 0.667 to 0.583 in 2014 owing to the trade disputes of the countries in the region and the impact of political factors; after the signing of the USMCA, trade between the United States, Mexico and Canada became closer so that the density rebounded to 0.667 in 2019.
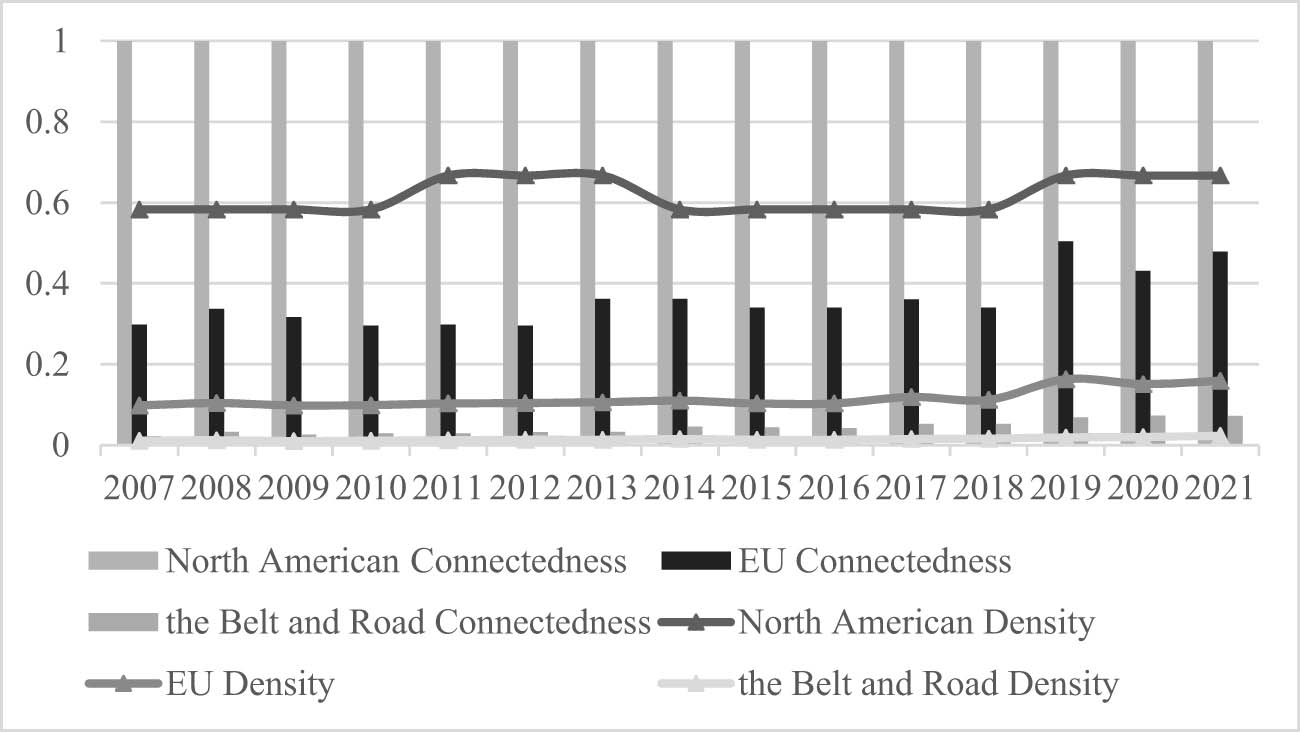
Density and connectedness. Source: Calculated from data in the input–output tables of the ADB database.
The North American regional network connectedness remains perfectly correlated between 2007 and 2021; i.e., the network correlations are all 1 (Figure 2). The main reason for this is that the North American regional trade network contains relatively few countries and maintains a stable trade in services between all countries during the years examined, resulting in a relatively high degree of stability. Under such connectedness, China, the United States, Mexico, and Canada are always the core countries in the whole trade network (Figure 3a), and the strength of countries in the North American regional trade network is relatively balanced.
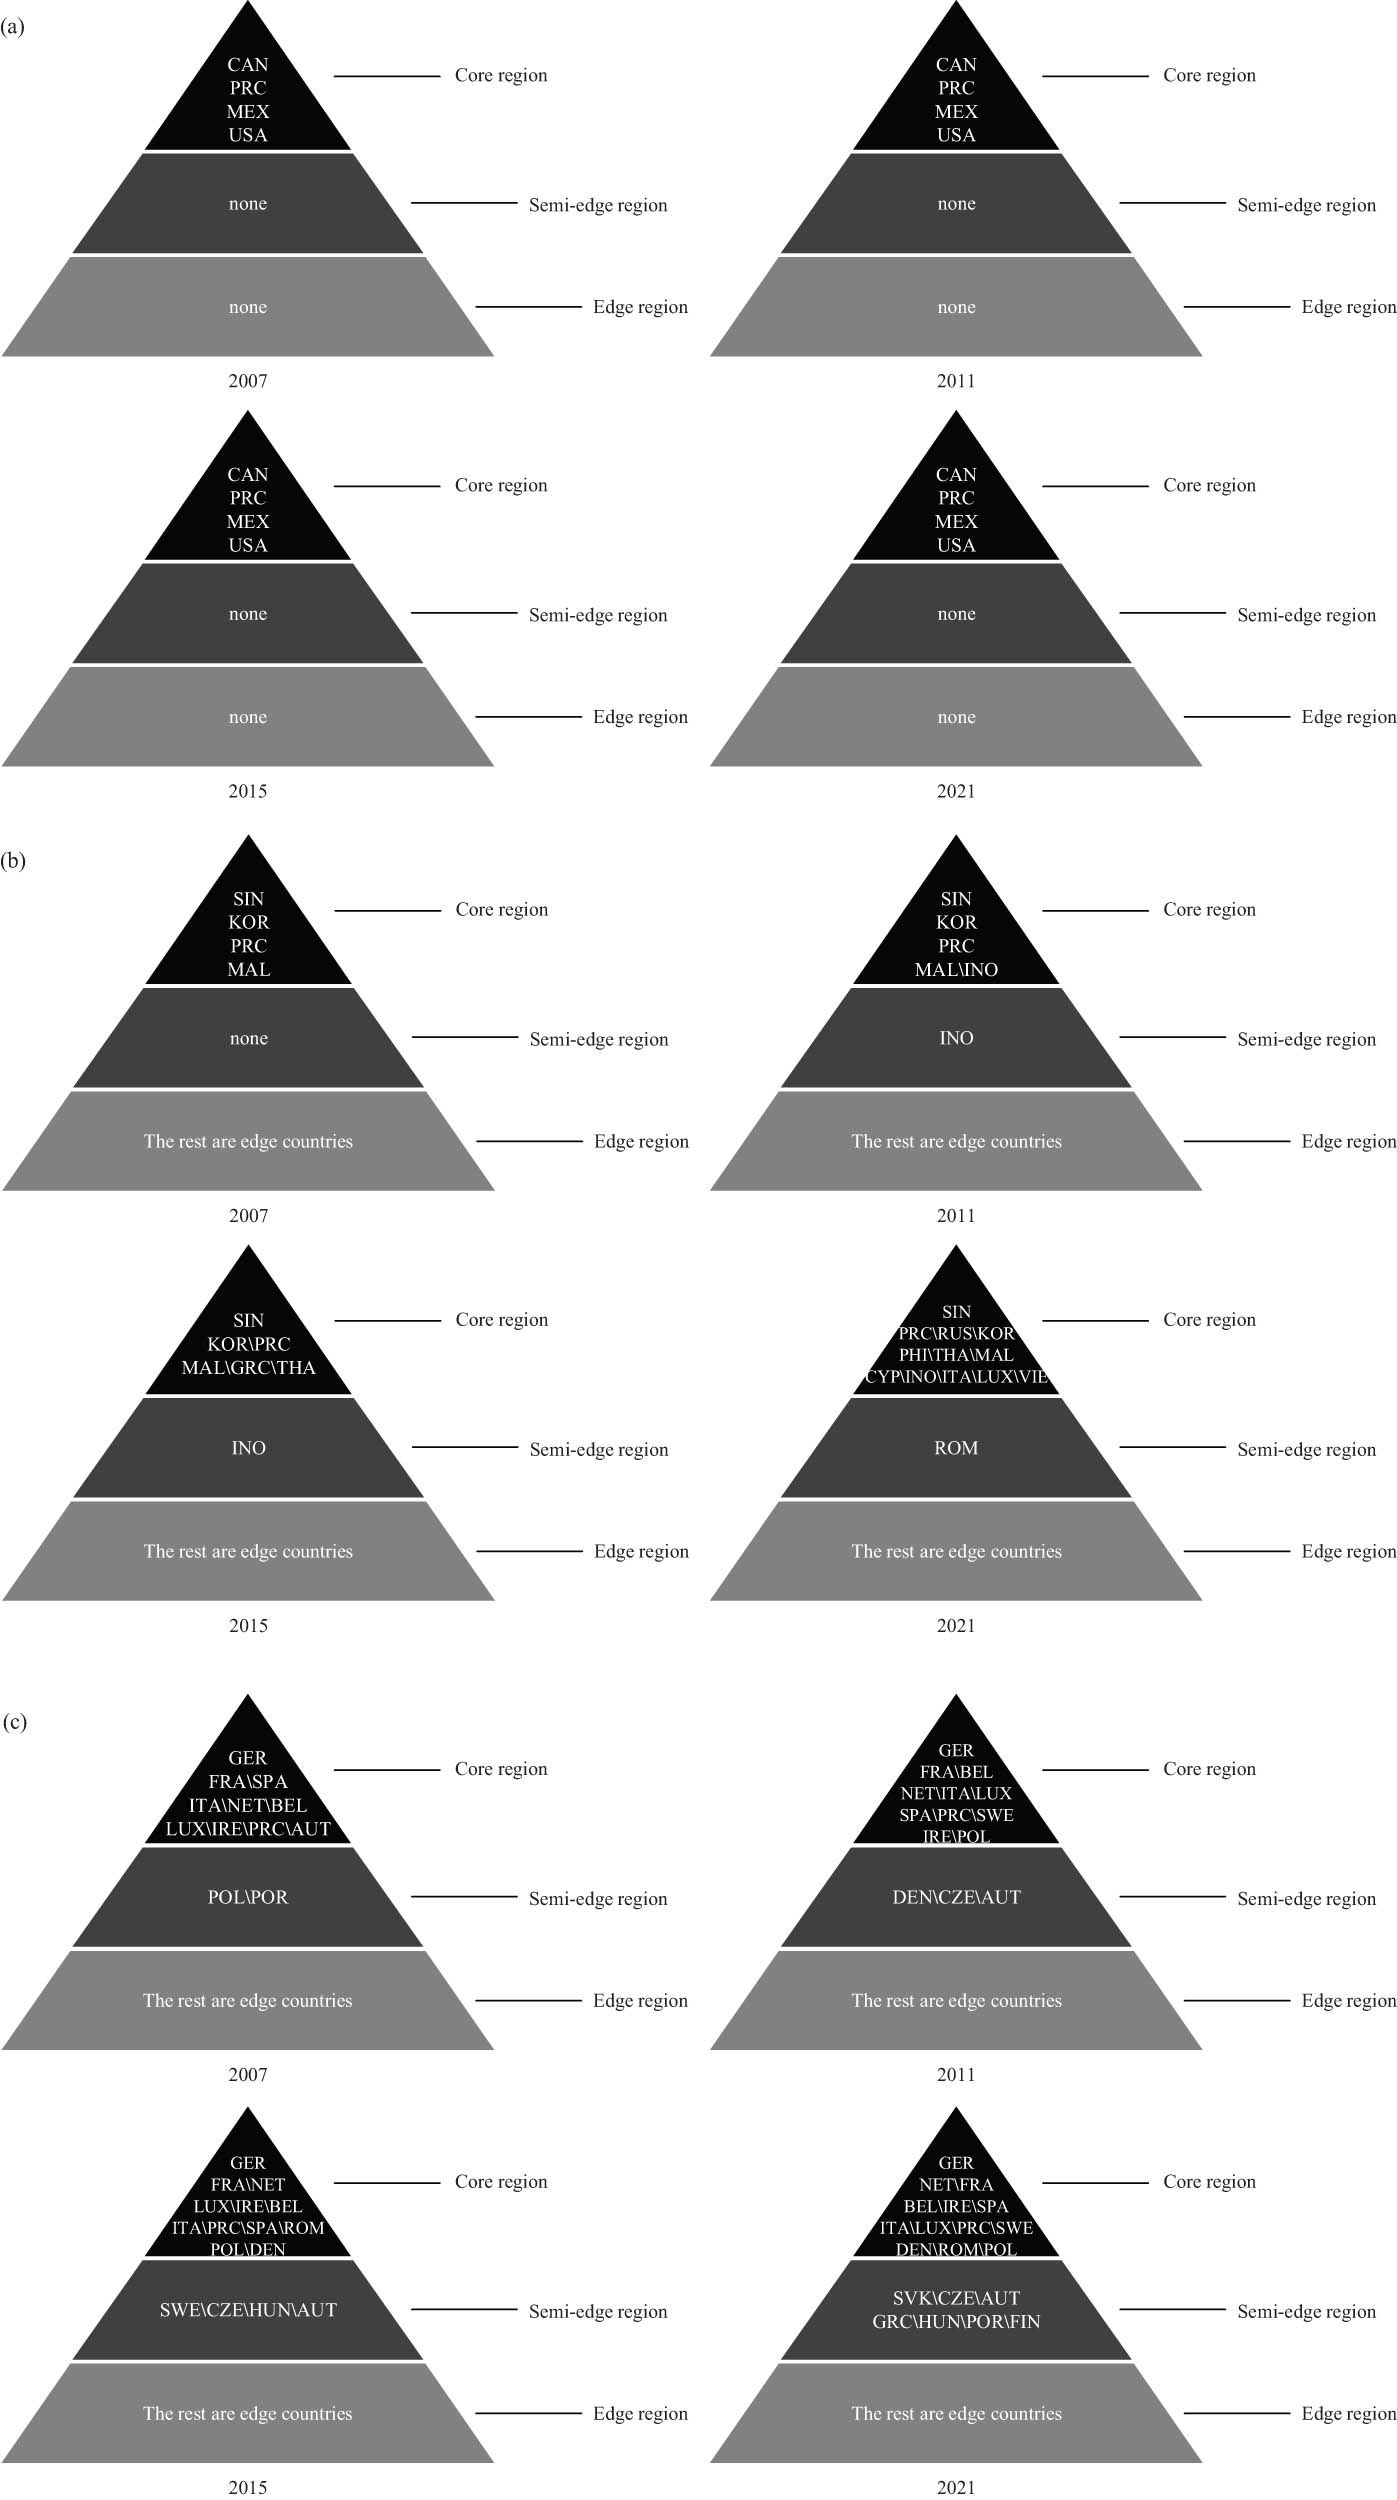
Core-Periphery structure. Source: Calculated from data in the input–output tables of the ADB database: (a) North America, (b) the Belt and Road, and (c) EU.
4.2 European Union (EU) Regional Trade Network Relationships
Both EU regional trade density and connectedness have shown fluctuating upward trends since 2007, and both measures peaked in 2019, but COVID-19 has hampered trade associations between economies to some extent, resulting in a decline in density and connectedness in 2020 (Figure 2).
In terms of the structure of the trade network, the number of countries in the core and semi-edge regions of the EU regional trade network increases between 2007 and 2021 (Figure 3c). In 2007, Germany, France, Spain, Italy, the Netherlands, Belgium, Luxembourg, Ireland, China, and Austria were in the core tier, while Poland and Portugal were in the semi-edge tier. Subsequently, there has been a continuous influx of countries into the core and semi-edge layers. Until 2021, based on the previous network structure, Slovakia, Greece, and Finland were in the semi-edge layer for the first time. It can be seen that not only the more stable developed countries have always been in the core of the trade network, but in recent years developing countries have also gradually entered the core regions, with the number of countries increasing from one to three. Meanwhile, the number of countries in the edge tier has been decreasing year by year, from 16 in 2007 to 8 in 2021.
In terms of the subregional structure of the trade network, the EU’s regional trade network not only has the obvious characteristics of a “small world,” but also consists of subgroups of developed countries with similar levels of economic development, and has strong geographical proximity (Table 1). Germany and France were the most cohesive core countries in 2007, which led to the formation of six cohesive subgroups.
Cohesive subgroups
| Subgroups | 2007 | 2011 | 2015 | 2021 | |
|---|---|---|---|---|---|
| “the Belt and Road” | 1 | PRC KOR SIN | PRC KOR SIN | PRC KOR SIN | PRC KOR SIN |
| 2 | PRC MAL SIN | ||||
| 3 | PRC THA SIN | ||||
| EU | 1 | GER SPA FRA ITA NET | BEL PRC GER FRA NET | BEL PRC GER FRA NET | BEL GER FRA IRE ITA NET |
| 2 | BEL GER SPA FRA NET | BEL GER FRA ITA LUX | BEL GER FRA ITA LUX | BEL GER FRA ITA LUX NET | |
| 3 | PRC GER FRA | GER SPA FRA ITA | GER SPA FRA | BEL GER SPA FRA LUX NET | |
| 4 | GER FRA ITA LUX | GER SPA FRA NET | GER FRA IRE ITA LUX | PRC GER DEN FRA NET | |
| 5 | BEL GER FRA LUX | GER IRE ITA LUX | GER FRA IRE NET | GER DEN FRA NET SWE | |
| 6 | GER IRE ITA NET | GER DEN SWE | PRC GER FRA ITA NET | ||
| 7 | PRC GER SPA FRA NET | ||||
| 8 | GER FRA NET POL |
Source: Calculated from data in the input–output tables of the ADB database.
The number of cohesive subgroups decreased and then increased as a result of the fine-tuning of the subregional structure between 2011 and 2015 due to adjustments in the trade strategies of some countries. However, there is a structural change in the cohesive subgroups’ structure in 2021, where not only did the number grow to eight, but also the Netherlands jumped up to become the third cohesive core country, on top of Germany and France. In addition, developing countries gradually entered the cohesive subgroup of developed countries, where the cohesive subgroup formed by China and EU member states has accounted for almost half of the EU cohesive subgroups; i.e., China’s cohesion in the EU’s regional trade network has become stronger.
4.3 “The Belt and Road” Regional Trade Network Relationships
Although the density of trade networks in “the Belt and Road” region climbed from 0.011 in 2007 to 0.020 in 2021, the overall change was small (Figure 2). The same applied to connectedness, which rose from 0.022 in 2007 to 0.072 in 2021 (Figure 2). Although the stability of the trade network is gradually increasing, the indicator values show that the regional trade network of “the Belt and Road” is still mainly dependent on individual core countries, and when the trade of the core countries fluctuates, the entire network structure will face a huge shock. Therein, the countries at the core of the “the Belt and Road” regional trade network are mainly Singapore, South Korea, Malaysia, and China. With the further implementation of “the Belt and Road” Initiative, countries such as Russia, the Philippines, Cyprus, Italy, Luxembourg, and Vietnam have gradually moved from the edge to the core (as shown in Figure 3b).
The development trend of cohesive subgroups shows that there was only one cohesive subgroup in “the Belt and Road” regional trade network between 2007 and 2015, namely the subregional trade network comprising China, South Korea, and Singapore (Table 1). By 2021, the number of cohesive subgroups increased to three, with China and Singapore as the core cohesive countries. The newly formed cohesive subgroups may be influenced by the signing and deepening implementation of RCEP. Moreover, China and Southeast Asian countries have certain advantages of geographical distance. Frequent exchanges and cooperation in various aspects, such as politics, culture, and economy, also contribute to the formation of subregional networks.
By comparing the forms of the three regional trade networks, it can be seen that the North American regional trade network, both in terms of density and connectedness, outperforms the other two regional trade networks and it has the closest associated countries and is highly stable. The EU regional trade network is the second. Although the advantages of “the Belt and Road” regional trade network are not obvious in terms of density and connectedness, China is a central node country in the core region of the network. Compared with North America and the EU regional trade network, China’s dominant position in “the Belt and Road” regional trade network is more prominent and its cohesive capacity is superior.
5 Overview of the Development of China’s Service Industry from the Perspective of Regional Trade Networks
Based on the centrality index proposed by Freeman (1979), the article applies the original data of input–output tables of the ADB, calculating the degree centrality, betweenness centrality, and closeness centrality of China’s service industry from the perspectives of the North American regional trade network, the EU regional trade network, and “the Belt and Road” regional trade network.
5.1 Degree Centrality
In the North American regional trade network, the degree centrality of China’s service industry has remained stable, ranking second with 0.667 (as shown in Table 2). Only when China and the United States faced a fierce trade conflict in 2018, as well as the North American region renewed the free trade agreement (FTA), signed the USMCA to modify and improve the rules of trade in services, increased restrictions and protective measures for non-member states, suppressed the degree centrality of China’s service industry in that year to a certain extent, down to 0.333. But in 2019, it quickly recovered to the previous level. China’s service industry’s degree centrality has a similar development trend in the EU and “the Belt and Road” regional trade network, both of which show fluctuating growth trends (as shown in Table 2). Herein, the fluctuation is more obvious in the EU regional trade network.
China’s service industry centrality
| North America | EU | The Belt and Road | |||||||
|---|---|---|---|---|---|---|---|---|---|
| Year | Degree | Betweenness | Closeness | Degree | Betweenness | Closeness | Degree | Betweenness | Closeness |
| 2007 | 0.667(2) | 0(2) | 0.833(3) | 0.148(6) | 1(8) | 88(7) | 0.051(2) | — | 109(2) |
| 2008 | 0.667(2) | 0(2) | 0.833(3) | 0.222(5) | 1(10) | 71(7) | 0.051(2) | 0.5(4) | 167(2) |
| 2009 | 0.667(2) | 0(2) | 0.833(3) | 0.222(4) | 1.083(9) | 83(4) | 0.051(2) | — | 169(2) |
| 2010 | 0.667(2) | 0(2) | 0.833(3) | 0.185(5) | 1.333(9) | 73(6) | 0.051(2) | 7.5(3) | 171(2) |
| 2011 | 0.667(2) | 0(2) | 0.833(2) | 0.222(4) | 2(9) | 83(9) | 0.077(2) | 8.5(3) | 170(2) |
| 2012 | 0.667(2) | 0(2) | 0.833(2) | 0.259(4) | 2(8) | 69(4) | 0.051(3) | 1(3) | 138(3) |
| 2013 | 0.667(2) | 0(2) | 0.833(2) | 0.259(3) | 2.667(6) | 69(3) | 0.051(2) | 1(3) | 139(2) |
| 2014 | 0.667(2) | 0(2) | 0.833(3) | 0.222(4) | 2(8) | 82(5) | 0.051(3) | 1(3) | 134(3) |
| 2015 | 0.667(2) | 0(2) | 0.833(3) | 0.222(4) | 3.833(5) | 71(5) | 0.051(2) | 8.5(3) | 168(3) |
| 2016 | 0.667(2) | 0(2) | 0.833(3) | 0.222(4) | 1.417(7) | 71(5) | 0.077(2) | 1(3) | 135(2) |
| 2017 | 0.667(2) | 0(2) | 0.833(3) | 0.222(6) | 3.417(6) | 70(6) | 0.051(2) | 1(3) | 134(3) |
| 2018 | 0.333(3) | 0(2) | 0.833(3) | 0.185(6) | 7.2(5) | 86(6) | 0.077(2) | 6.667(3) | 136(2) |
| 2019 | 0.667(2) | 0(2) | 0.833(2) | 0.259(7) | 3.95(7) | 74(7) | 0.015(3) | 35.25(1) | 213(5) |
| 2020 | 0.667(2) | 0(2) | 0.833(2) | 0.259(5) | 3.045(7) | 67(5) | 0.128(2) | 31.5(2) | 163(3) |
| 2021 | 0.667(2) | 0(2) | 0.833(2) | 0.222(10) | 3.019(6) | 75(7) | 0.128(2) | 37.833(2) | 166(3) |
Source: Calculated from data in the input–output tables of the ADB database.
Note: Figures in () are rankings of the centrality of China’s service industry, and “—” indicates missing data in the database.
5.2 Betweenness Centrality
During the study period, the degree of betweenness centrality of China’s service industry was relatively low in North America and the EU regional trade network. This indicates that in the above regional trade networks, the trading capacity of developed countries is significantly better than that of China, and the role of China’s service industry as a “bridge” in these networks is exiguous. On the contrary, in “the Belt and Road” regional trade network, the betweenness centrality of China’s service industry has obvious advantages, ranking first in 2019 and reaching a peak of 37.833 in 2021. China’s service industry plays an important “intermediary” role in “the Belt and Road” regional trade network and is an important hub for other economies to trade in services.
5.3 Closeness Centrality
In the North American regional trade network, the closeness centrality of China’s service industry is relatively stable, remaining at 0.833. In the EU regional trade network, the closeness centrality of China’s service industry is on a downward trend. This indicates that the trade “distance” where China’s service industry trades with EU economies is gradually decreasing. This is partly due to the China–Europe Railway Express, which has shortened the trade distance between China and the EU, creating a new pattern of international transport. On the contrary, China’s service industry not only shows an increasing trend in closeness centrality in “the Belt and Road” regional trade network but also has a value over 100, much higher than the other two trade networks. On the one hand, this is due to the influence of infrastructure construction. On the other hand, in the context of the rapid development of the digital economy, the digital gap between China and the countries along “the Belt and Road” has also extended the “trade distance.”
6 Theoretical Analysis of the Impact of Regional Trade Network Relationships on Value Chain Resilience
6.1 Spillover Effects of Degree Centrality
Degree centrality reflects a country’s ability to establish close trade relations with other economies in terms of trade breadth. According to the theory of risk diversification put forward by R.E. Caves and G.V. Stevens in the middle of the twentieth century, when investment and trade in the host country do not necessarily yield favorable profit gains, the risk should be diversified according to the geographic location, i.e., the diversified development of trade is the result of risk diversification. A high degree centrality on the one hand increases a country’s responsiveness to shocks and risks. A higher degree centrality means that a country expands its scope of trading partners, at which point the spread of uncertainty shocks will advance sequentially among trading partners, giving a country sufficient time to anticipate the effects of shocks and actively respond to them. Thus, it improves the overall value chain resilience from the perspective of improving operational value chain resilience. On the other hand, degree centrality reflects a country’s ability to establish direct trade relations with other economies. Therefore, when a country’s industrial value chain encounters risky shocks, it can flexibly adjust its trade strategy through direct trade associations under a high degree centrality, and the effect of the change in trade strategy can be quickly realized. That is, a high level of degree centrality enhances the structural value chain resilience through positive response to risky shocks and rapid recovery, thus strengthening the overall industrial value chain resilience.
Hypothesis 1: Degree centrality is positively related to the resilience of China’s service industry value chain.
6.2 Spillover Effects of Betweenness Centrality
Rauch (2001) states that firms can utilize trade relationship networks for information sharing, which in turn reduces the cost of searching for market information and improves the efficiency of information dissemination. The higher the degree of betweenness centrality, the more accurate and timely the crucial country in the value chain will be in grasping the information on the direction of the shock, the strength of the shock, and the effect of the response to the shock. Hence, the country can shorten its response time to the shock and even do sufficient early warning and response before the shock arrives. Moreover, according to the theory of value chain governance (Gereffi et al., 2005), global production networks correspond to different power relations, with dominant subjects having the ability to exercise direct power over subordinate subjects. Concurrently, the theory of social network centrality posits that the centrality of the value-added trade network, as a configuration of trade relations and flows, reflects the host country’s role as a “hub” at a deeper level. It is manifested in the ability to coordinate and control network relations, factor flows, greater access to resources such as knowledge and technology, and more efficient allocation, as well as improvements in institutional quality and the business environment. A high degree of betweenness centrality means that core node countries can dominantly lead the value chain by coordinating upstream and downstream trade activities and allocating resource flows, thus achieving active control over the negative impacts of shocks and enhancing the stability of the value chain.
Finally, according to the dynamic optimization framework of “three circulations” constructed by Wang et al. (2021), China is in the global “upper circulation” led by developed economies, the regional “middle circulation” composed of developing economies, and the domestic value “lower circulation” composed of eastern, middle and western regions. In the “upper circulation,” developed countries export high-quality essential factors of production to China, while China exports intermediate and final consumption products to developed countries. With the implementation of “the Belt and Road” initiative, the signing and implementation of RCEP, etc., relying on the regional trade network relationship in the “upper circulation,” China has the nature of a “chain master,” gradually diverted from the “middle circulation” formed by developing countries. So it can realize the two-way export of resource factors of the countries in the region based on the differences in endowment advantages. The “dual circulation” of value provides useful insights for our country to get rid of the low-end lock of the global value chain. However, only the “upper circulation” and “lower circulation” are not enough to support the upgrading and development of China’s industries. The construction of the “lower circulation” of value division of labor between East, Middle, West, and inland-coastal regions of China is the only way to further improve the value chain system and enhance the endogenous growth momentum of China’s industries. The regional value of the “middle circulation” is the hub that connects the “upper circulation” and the “lower circulation.” Regional cooperation is used as a means of connecting domestic and global value chains in terms of taxation and trade facilitation, to help industries climb up the value and innovation chains based on the efficient operation of the value “three circulations” system.
Therefore, countries with a high degree of betweenness centrality can efficiently connect global and domestic value chains. The smooth flow of the dual circulation can accelerate the developmental process of domestic and foreign trade integration. It is conducive to the formation of a strong domestic market and at the same time helps foreign trade enterprises to improve their ability to resist risks.
Hypothesis 2: Betweenness centrality is positively related to the resilience of China’s service industry value chain.
6.3 Spillover Effects of Closeness Centrality
According to the speculation of the iceberg trade theory, the lower the cost of inter-firm trade, the lower the cost of obtaining intermediate goods. It is conducive to enterprises improving the quality of export products and climbing up the position of the global value chain. From the perspective of technological innovation, closeness centrality reduces trade costs by shortening trade “distance,” and reserves funds for breaking through technological bottlenecks and achieving technological innovation. Technological innovation is the core element that enables industrial value chains to recover quickly from shocks, and low closeness centrality enhances the overall service value chain resilience by strengthening the technological value chain resilience. From the perspective of influence, low closeness centrality makes it easier for products to enter other countries’ markets. It establishes a good reputation among other economies through the diffusion effect of large volume and high quality, forming and strengthening the influence and competitiveness of independent brands. Conversely, the branding effect will once again promote the occupancy rate and competitiveness of products in the international market, thus forming a virtuous circle. Under the guidance of consumer preference theory, the reduction of product substitution rate can fundamentally reduce or eliminate the negative effect of shocks on the value chain resilience.
Hypothesis 3: Closeness centrality is negatively related to the resilience of China’s service industry value chain.
6.4 Stack Effects of Centrality and Density
According to the trade network theory, external factor shocks can have indirect transmission effects on other points through the trade network channel. Therefore, the above spillover effects of centrality on value chain resilience will further produce a scaling effect when superimposed density. On the one hand, network density has a scaling effect. If the trade relationship in the trade network is a virtuous interaction, the higher the density, the bigger the amplification effect. That is, if the countries in the trade network are each other’s core trading partners, and the establishment of trade relations is centered on a “win-win,” then the countries will adjust their trade strategies from a global perspective when uncertainties hit the value chain. Then the negative impacts of the shocks will not only not be spread dramatically because of the high density, but will also be weakened rapidly because of the coordinated and unified countermeasures taken by the countries. Meanwhile, if the relationships between countries in the trade network are established with a long-term interest and have strong inclusiveness, the network of trade relations will be more resilient, and the possibility of external shocks interrupting the trade relations will be sharply reduced. The weakening of the volatility of the trade network relationship will make it possible for it to steadily and consistently transmit the positive spillover effects of the centrality of the network, which will feedback doubly and positively to the value chain resilience. Conversely, density will have a contractionary effect, weakening the spillover of the positive effects of centrality on increasing value chain resilience.
7 Empirical Analysis
7.1 Econometric Modeling and Variable Descriptions
According to the theory of value chain governance (Fernandez-Stark & Gereffi, 2019; Schrage & Gilbert, 2019), we extend the model by incorporating relational factors under regional service trade agreement constraints. To verify the hypotheses presented above, the following econometric model was constructed:
In the model, t means time, and
Global value chain resilience has multiple dimensions. From a life-cycle perspective of value chain resilience, on the one hand, resilience centers on rebounding from shocks. On the other hand, after a shock, the quality of the value chain itself is also an important aspect of resilience as external influences become more normalized. Therefore, this article uses stability and security as entry points, indicating value chain resilience. This article refers to the article drawn by John et al. (2008) to measure the stability of value chains in terms of the magnitude of fluctuations in the length of the value chain, and the formulas are as follows:
In the above formulas,
The security of the value chain is then measured by the gap in the length of the value chain with reference to Yang and Zheng (2023), and the following is the formula:
In the formula,
As evidenced by the calculations (Table 3), the stability of China’s service industry has been relatively stable over the years. When security was hit by the epidemic, the indicator experienced a slight decline. However, it rebounded steadily in the following year. In terms of development trends (Figure 4), there was no significant change or improvement in China’s service industry value chain resilience during the period. Specifically, the less secure industries are “transport services” and “financial intermediation,” which, in contrast, are relatively more stable, and the less stable industries are “hotels and restaurants” and “real estate, renting, and business activities,” respectively.
China’s Service Industry Segments Value Chain Resilience, 2021
| Industry | Security | Stability |
|---|---|---|
| Trade services | 0.4907 | 2.1449 |
| Hotels and restaurants | 0.9057 | 0.1174 |
| Transport services | 0 | 4.0179 |
| Telecommunications | 0.7954 | 0.3560 |
| Financial intermediation | 0.0966 | 4.2546 |
| Real estate, renting, and business activities | 0.9413 | 0.2356 |
| Public administration and defense | 2.0366 | 5.6796 |
| Education, health, and social work | 2.0729 | 5.4374 |
Source: Calculated from data in the input–output tables of the ADB database.
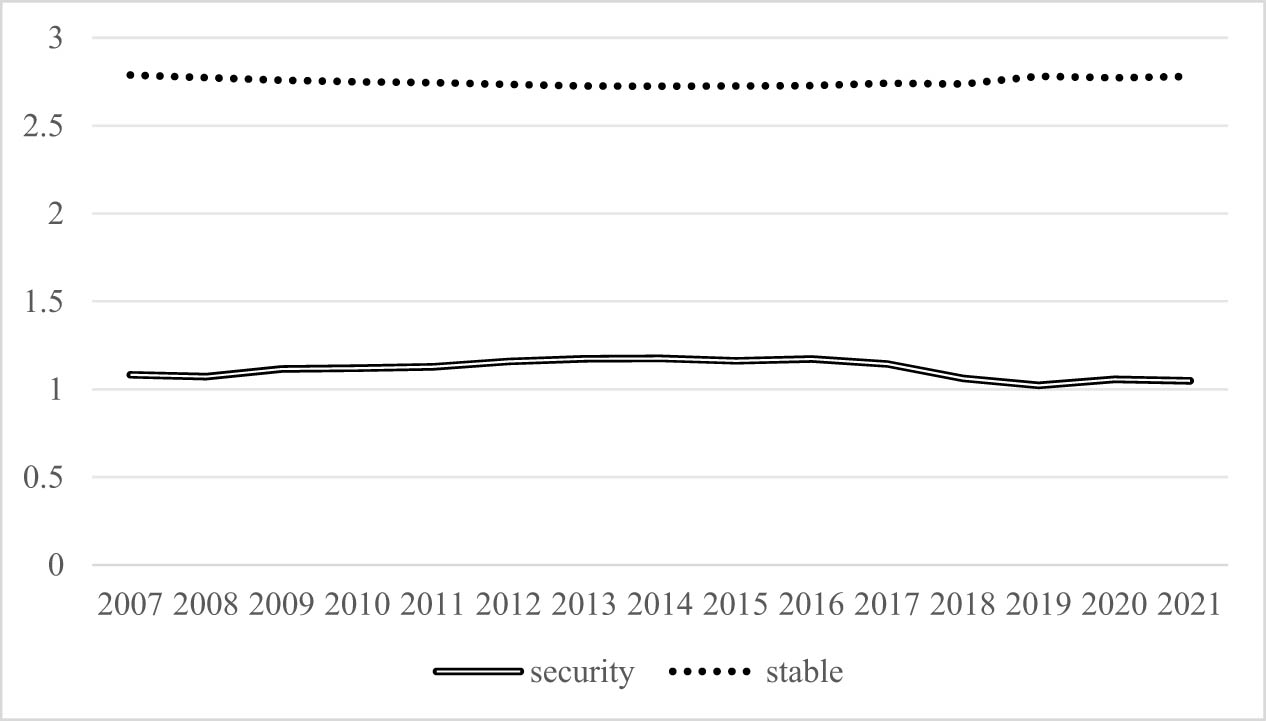
China’s Service Industry Value Chain Resilience over the years. Source: Calculated from data in the input–output tables of the ADB database.
Given that the indicators selected in this article all measure value chain resilience inversely, i.e., the larger the value of the indicator, the less resilient the value chain. Therefore, the hypotheses above are adjusted as follows:
Hypothesis 1: Degree centrality is negatively related to the resilience of China’s service industry value chain.
Hypothesis 2: Betweenness centrality is negatively related to the resilience of China’s service industry value chain.
Hypothesis 3: Closeness centrality is positively related to the resilience of China’s service industry value chain.
Table 4 below shows the selection of variables in the regression equation:
Explanatory notes for the variables
| Variable codes | Variable names | Unit | Data sources |
|---|---|---|---|
| GVC_PL | Global value chain resilience | — | ADB database |
| DE | Degree | — | ADB database |
| IN | Betweenness | — | ADB database |
| CL | Closeness | — | ADB database |
| Ctrol | Added value | Billions | National Bureau of Statistics of China |
| Employment with a bachelor’s degree or higher | Ten thousand | China Population & Employment Statistical Yearbook | |
| Wages | Billions | China Labor Statistical Yearbook | |
| Fixed asset investment | % | China Statistical Yearbook of Tertiary Industry | |
| Foreign investment | Ten thousand dollars | National Bureau of Statistics of China |
7.2 Analysis of Empirical Results
7.2.1 Benchmark Regression Results
Given the high degree of connectedness between the centrality of regional trade networks in North America, the EU, and “the Belt and Road,” to avoid multiple covariances to reduce the regression precision, we will regress the value chain resilience from the perspective of the three regional trade networks, respectively.
The results of the benchmark model regression are shown in Table 5. (1) Benchmark regression model under the North American regional trade network, (2) Benchmark regression model under the EU regional trade network, and (3) Benchmark regression model under “the Belt and Road” regional trade network. The regression results from the benchmark model show that the regression results for degree centrality, betweenness centrality, and closeness centrality are consistent with the hypotheses. Among the networks, the degree centrality of China’s service industry has the greatest effect on enhancing the stability of its value chain in “the Belt and Road” regional trade network relationship, which mainly benefits from the signing and further implementation of “the Belt and Road” Initiative and RCEP. For every 1 unit decrease in the degree centrality of China’s service industry, the stability of the value chain increases by 0.3384 units. FTAs established at a high level not only expand the development space for the improvement of the degree centrality of China’s service industry but also the trade relations established under the guarantee of trade terms will surely contribute to a leap in the resilience of the value chain from the perspective of stability. Besides, from the perspective of value chain security, the degree centrality of China’s service industry in the North American regional trade network has a significant and efficient effect on value chain security. With every 1 unit decrease in the degree centrality of China’s service industry, the security of the value chain increases by 0.6808 units. Second is “the Belt and Road” region, with a regression coefficient of 0.5086, which is mainly due to the Chinese service industry’s high-quality service trade relations releasing more positive spillover effects in the North American regional trade network constructed by developed economies. As a result, the development of the industry in the North American regional trade network will feed back more and more significantly into the value chain, and the balanced development of the economies in the value chain contributes to the level of security in the value chain. However, in “the Belt and Road” regional trade network, there is a big gap between the economic development levels of the economies in the value chain, and polarization is more serious, so the development of China’s service industry has a very limited effect on the overall value chain resilience.
Benchmark regression results
| Explanatory variables | Stability | Security | ||||
|---|---|---|---|---|---|---|
| (1) | (2) | (3) | (1) | (2) | (3) | |
| DE | −0.0903*** | −0.2069** | −0.3384* | −0.6808*** | −0.3939** | −0.5086* |
| (0.1525) | (0.1000) | (0.1881) | (0.2196) | (0.1633) | (0.2661) | |
| IN | −0.1765*** | −0.1970*** | −0.1693*** | −0.1946*** | −0.0292* | −0.0983*** |
| (0.0385) | (0.0298) | (0.0421) | (0.0575) | (0.0594) | (0.0662) | |
| CL | 0.2834 | 0.1245 | 0.6854** | 0.2004 | 0.0809 | 0.1959** |
| (0.2479) | (0.1371) | (0.2701) | (0.3298) | (0.2195) | (0.3747) | |
| C | −6.95206*** | −6.2277** | −7.9840*** | −7.0716*** | −4.5016** | −5.9642*** |
| (0.7725) | (0.7282) | (0.9154) | (1.4472) | (1.9290) | (1.6939) | |
| Time fixed effects | Yes | Yes | Yes | Yes | Yes | Yes |
| Industry fixed effects | Yes | Yes | Yes | Yes | Yes | Yes |
| Control variables | Yes | Yes | Yes | Yes | Yes | Yes |
| Sample size | 120 | 120 | 120 | 120 | 120 | 120 |
| R 2 | 0.7377 | 0.7527 | 0.7086 | 0.2387 | 0.1292 | 0.1492 |
Note: “***,” “**,” and “*” indicate 1, 5, and 10% significance levels, respectively, and Heteroskedasticity-Robustity + Standard + Error within ().
In addition to degree centrality significantly contributing to value chain resilience, betweenness centrality has the same effect. Unlike degree centrality, an increase in the betweenness centrality of China’s service industry has the most significant effect on the improvement of value chain stability in the EU regional trade network. This is mainly because of the relatively high degree of regional trade integration in the EU. Under this trade network, China’s service industry can still be active in the EU region as a “top-down” intermediary, indicating that China’s service industry has stronger control over the upstream and downstream production segments, and is at the core of the pivot position. Therefore, as a key node in the trade network, high-quality development of China’s intermediary status would significantly improve the stability of the value chain. Additionally, the effect of the betweenness centrality indicator on value chain security has the greatest feedback in the North American regional trade network. The number of economies included in the North American regional trade network is relatively small, and acting as an intermediary between upstream and downstream has become the main form of integration. The ability of an industry to communicate and coordinate upstream and downstream determines the depth and quality of integration into the value chain. As a developing country in the North American regional trade network, China’s service industry reinforces the impact of intermediation on the security of the value chain in the presence of a certain technological gap with developed economies.
The effect of closeness centrality on value chain resilience is only found in “the Belt and Road” regional trade network. On the one hand, this is due to the actual trade distance, which is relatively costly between China and North American countries compared to the trade distance between countries along “the Belt and Road.” Although this situation is relatively mitigated across EU countries and there are positive spillover effects from the China-Europe Railway Express, the cohesion of China’s service industry in the EU regional trade network is relatively low, and there are fewer instances of subregional trade networks formed with China at their core. The main reason for China’s service industry in the core region is its large trade-in service with individual countries. However, China’s service industry still has a long trade distance from the generalized economies in the EU regional trade network. On the other hand, it is due to the existence of a digital gap. With the deep integration of the digital economy and the real economy, the application of digital technology in trade in service is becoming more and more widespread. However, in North America and the EU regional trade networks, there is a huge data gap between China and developed countries. The spillover effect of digital technology to enhance value chain resilience by shortening the “distance” of trade has still not been stimulated. On the contrary, in “the Belt and Road” regional trade network, most of the countries are developing and underdeveloped, and China’s service industry is relatively advanced in the application of digital technology. Therefore, the positive feedback of closeness centrality on value chain resilience is more evident in “the Belt and Road” regional trade network.
Particularly, when measuring value chain resilience from a security perspective, the index constructed represents the gap between the value chain length and its maximum value. However, the influencing factors discussed in the article reflect the actual development status of China’s service industry. Therefore, the scatter distribution between the gap, which is a standard measurement, and the influencing factors is not as good as the stability of the value chain, which is dispersed around the regression line. Nevertheless, despite the low R², the relationship between the independent and dependent variables is real.
7.2.2 Robustness Test
The robustness of the model is tested by replacing the core variables, i.e., replacing the explanatory variables with backward linkage-based indicators of the average GVC length of China’s service industry. The backward linkage-based value chain length indicator measures the distance from the final consumer goods to the initial inputs, which continues to measure value chain resilience in terms of extensibility and the degree of embeddedness. The results are shown in Table 6, given that the value chain length indicator based on backward linkage is positively related to the value chain resilience, i.e., the larger the value of the value chain length based on backward linkage, the stronger the ability to extend the industrial value chain, the deeper the degree of embeddedness, and the better the security and stability of the value chain. Therefore, the hypotheses revert to the origin, i.e.:
Robustness test regression results
| Explanatory variables | (1) | (2) | (3) |
|---|---|---|---|
| DE | 0.1659*** | 0.0762* | 0.1550** |
| (0.0581) | (0.0420) | (0.1881) | |
| IN | 0.0356** | 0.0000* | 0.0455*** |
| (0.0152) | (0.0153) | (0.0165) | |
| CL | −0.1242 | −0.0215 | −0.1605* |
| (0.0873) | (0.0565) | (0.0933) | |
| C | 1.3781*** | 1.0155** | 1.3342*** |
| (0.3832) | (0.4967) | (0.4216) | |
| Time fixed effects | Yes | Yes | Yes |
| Industry fixed effects | Yes | Yes | Yes |
| Control variables | Yes | Yes | Yes |
| Sample size | 120 | 120 | 120 |
| R 2 | 0.7328 | 0.7110 | 0.7361 |
Note: “***,” “**,” and “*” indicate 1, 5, and 10% significance levels, respectively, and Heteroskedasticity-Robustity + Standard + Error within ().
Hypothesis 1: Degree centrality is positively related to the resilience of China’s service industry value chain;
Hypothesis 2: Betweenness centrality is positively related to the resilience of China’s service industry value chain;
Hypothesis 3: Closeness centrality is negatively related to the resilience of China’s service industry value chain.
It can be observed that the regression results are the same as the regression results of the benchmark model, indicating that the model set up in the article is robust and reliable. Degree centrality and betweenness centrality still significantly and positively affect value chain resilience; i.e., the improvement of degree centrality and betweenness centrality of China’s service industry will promote value chain resilience. Particularly, under “the Belt and Road” regional trade network, the reduction in the closeness centrality of China’s service industry, i.e., the shortening of the trade distance between economies, will lead to an increase in the value chain resilience.
7.2.3 Stacked Effects Regression Results
To verify the existence of a certain scaling effect of centrality on value chain resilience under the transmission of social network relations, construct the following econometric model:
In the above model, NET denotes the regional relationship network attributes, which are respectively represented by density and connectedness.
The regression results for the stacked effects are shown in Table 7. First, the optimization of China’s service industry centrality still contributes significantly to value chain stability through the transmission of trade relations. Second, owe to the small number of economies in North America, the transmission of positive spillovers from trade relations on industry centrality feeds back quickly and directly to value chain stability. Thus, the centrality of China’s service industry in the North American regional trade network significantly enhances the stability of the value chain through the transmission of trade relations. Moreover, with the rapid development of China’s service industry, the gap between service trade and that of developed countries has gradually narrowed. In the North American regional trade network with a relatively balanced power, trade network relationships have more of an amplifying effect on centrality spillovers. What’s more, closeness centrality reinforces the impact of trade “distance” on the stability of the value chain over the stacked effect of trade network relationships. The establishment of direct and indirect trade associations not only directly enhances the stability of the value chain, but also, the complexity and equalization of trade network relationships will strengthen the trade exchanges among the economies in the region through multiple channels. Coupled with technological empowerment, the trade relations not only come from scratch but also, with the shortening of the distance of the intermediate segments, the trade “distance” is further pulled forward. Therefore, under “the Belt and Road” regional trade network, the closeness centrality of China’s service industry not only significantly affects the enhancement of the stability of the value chain, but also shows a significant positive impact in North America and the EU regional trade network. Finally, relatively balanced regional trade network relationships further catalyze the positive effects of centrality on value chain stability, and otherwise the opposite. There is a balance of power in the North American regional trade network. As a result, the optimization of the centrality of China’s service industry has substantially increased the stability of the value chain through the transmission of trade network relationships. On the contrary, the EU and “the Belt and Road” regional trade network have not only failed to further strengthen the positive effect of centrality but also weakened their positive impact on value chain stability to a certain extent, due to the obvious “core-periphery” structure and the strong dependence of the development of trade network structure on the core node countries.
Stacked effects regression results
| Explanatory variables | Density | Connectedness | ||||
|---|---|---|---|---|---|---|
| (1) | (2) | (3) | (1) | (2) | (3) | |
| Stability | ||||||
| NET*DE | −0.1337*** | −0.0269*** | −0.0490*** | −0.1634*** | −0.1317*** | −0.1903*** |
| (0.1641) | (0.1031) | (0.1950) | (0.1609) | (0.0953) | (0.1815) | |
| NET*IN | −0.2061*** | −0.1891*** | −0.1399*** | −0.2107*** | −0.1713*** | −0.0822* |
| (0.0398) | (0.0342) | (0.0449) | (0.0392) | (0.0304) | (0.0458) | |
| NET*CL | 0.2886 | 0.2923** | 0.2407* | 0.4199* | 0.5366*** | 0.4666** |
| (0.2270) | (0.1150) | (0.2239) | (0.2184) | (0.1162) | (0.2022) | |
| C | −5.6601*** | −4.2085** | −5.1472*** | −5.2130*** | −3.4146*** | −3.7102*** |
| (0.8074) | (0.7792) | (0.9145) | (0.8514) | (0.7935) | (0.8885) | |
| Time Fixed Effects | Yes | Yes | Yes | Yes | Yes | Yes |
| Industry Fixed Effects | Yes | Yes | Yes | Yes | Yes | Yes |
| Control variables | Yes | Yes | Yes | Yes | Yes | Yes |
| Sample size | 120 | 120 | 120 | 120 | 120 | 120 |
| R 2 | 0.7102 | 0.7445 | 0.6695 | 0.7100 | 0.7640 | 0.7019 |
| Security | ||||||
| NET*DE | −0.4809** | −0.0374*** | −0.3576*** | −0.5274*** | −0.3130** | −0.5258** |
| (0.2023) | (0.1433) | (0.1881) | (0.1843) | (0.1551) | (0.2533) | |
| NET*IN | −0.1914*** | −0.0601* | −0.1072* | −0.1930*** | −0.0003* | −0.1126* |
| (0.0520) | (0.0593) | (0.0165) | (0.0479) | (0.0592) | (0.0658) | |
| NET*CL | 0.0666 | 0.5033*** | 0.1582*** | 0.2652 | 0.0389 | 0.4351*** |
| (0.2719) | (0.1659) | (0.2831) | (0.2502) | (0.1972) | (0.2854) | |
| C | −8.5579*** | −5.8751*** | −7.3267*** | −10.1979*** | −7.0084*** | −6.6033*** |
| (1.3424) | (2.0786) | (1.5492) | (1.2871) | (2.1492) | (1.7033) | |
| Time Fixed Effects | Yes | Yes | Yes | Yes | Yes | Yes |
| Industry Fixed Effects | Yes | Yes | Yes | Yes | Yes | Yes |
| Control variables | Yes | Yes | Yes | Yes | Yes | Yes |
| Sample size | 120 | 120 | 120 | 120 | 120 | 120 |
| R 2 | 0.3769 | 0.2355 | 0.2417 | 0.4708 | 0.1639 | 0.1693 |
Note: “***,” “**,” and “*” indicate 1, 5, and 10% significance levels, respectively, and Heteroskedasticity-Robustity + Standard + Error within ().
From the perspective of value chain security, although the centrality of China’s service industry still maintains a positive relationship with value chain resilience, its effect on value chain resilience is weakened by the transmission of trade network relationships. This is because the value chain security indicator focuses on measuring from the perspective of the gap between developed economies or large service countries. However, the transmission of trade network relationships not only fails to close the gap but also further amplifies the gap space as a transmission medium.
Moreover, whether it is value chain stability or value chain security, the stacked effect of trade relations under the North American regional trade network is extremely ineffective in catalyzing closeness centrality to act efficiently on value chain resilience. This is mainly because of the relatively high degree of construction of the North American regional trade network, and the optimization and upgrading of the service industry value chain have gradually escaped the influence of trade “distance.” Therefore, even after adding the stacked effect of trade network relationships, the effect of China’s service industry closeness centrality on value chain resilience is still not apparent.
8 Conclusions and Countermeasures Suggestions
8.1 Conclusions
To clarify the development of regional trade networks in the service industry, this article conducts detailed research on the three major regional trade networks of North America, the EU, and “the Belt and Road,” as well as individual characteristics of China’s service industry therein, based on RTAs. The findings indicate that the cohesion of China’s service industry within the regional trade networks has been increasingly intensifying on an annual basis, and regional trade subgroups with China as the core have emerged increasingly. This underscores the centrality of China’s service industry in the regional trade network. Thereby, this article further explores the impact of industry centrality on value chain resilience. The results indicate that an increase in the degree and betweenness of China’s service industry significantly enhances value chain resilience. Conversely, the positive impact of closeness on value chain resilience is only evident in “the Belt and Road” regional trade network.
This article builds on existing literature in several ways. It expands the research perspective, combining the development background of the times and establishing the influence framework between the regional trade network relationship and the value chain resilience. It also accurately measures China’s service industry resilience from the meso perspective. The study finds that although external shocks negatively affect the service industry value chain resilience, the impact is relatively small. The outstanding challenge of China’s service industry value chain resilience is the low degree, which has no significant improvement over the years. On this basis, from the perspective of optimizing trade network relations, we conclude that the construction of high-quality centrality in China’s service industry will further strengthen the optimization effect on value chain resilience through balanced regional trade network relationships. On the contrary, the degree of polarization in trade network relationships will exacerbate the weakening motivation of centrality for value chain resilience.
8.2 Countermeasures Suggestions
To improve the resilience of China’s service industry value chain, it is essential to optimize the regional trade network relationships based on RTAs. China’s service industry should, on the one hand, continue to optimize its trade relations with developed economies, guiding and encouraging Chinese service industry enterprises to actively participate in the regional trade networks formed by developed countries. Cultivate their core competitiveness and narrow the gap with developed countries while fully enjoying the technology spillover effect. China’s service industry needs to take the initiative to form influence, cohesion, and voice in high-level regional trade networks, dispersing the impact of uncertainties on the value chain. At the same time, it should actively cultivate the ability to stabilize the value chain and control the negative impacts on the value chain.
On the other hand, “the Belt and Road” initiative, RCEP and other carriers, the signing of FTAs, and the continuous deepening of development offer the potential for China’s service industry to further improve the trade “distance” between China’s service industry and other economies. It can achieved by lowering trade barriers and building a mutually beneficial and “win-win” trade environment, to intensify the closeness of China’s service industry to the value chain, and to build high-quality trade platforms for shaping the resilience of the value chain. Meanwhile, the government should continue to promote the opening up of the system. As a core node country in “the Belt and Road” regional trade network, China’s service industry should make full use of its core position to coordinate the trans-regional cooperation mechanism, and actively explore docking of international high-standard economic and trade rules, such as CPTPP, DEPA, etc. In this way, it can strengthen the diversified intra-regional trade associations, enhance the degree centrality of China’s service industry in the value chain, and create a stable trade environment for cultivating the value chain resilience from the perspective of strengthening the overall intensity of trade network relations. In addition, implementing policies to promote the cultivation of leading enterprises, and then strengthen the betweenness centrality of China’s services industry in the value chain through leading enterprises, thereby properly guiding capital into medium and high technology industries, optimizing trade network relationships, making full use of the effects of technological spillovers and industrial transfers, activating research and innovation activities, and fostering core technological capabilities for optimizing the value chain resilience.
8.3 Future Studies
While the strengthening of regional trade network relations serves to reinforce China’s service industry value chain resilience, it is also important to consider the potential negative effects that may arise from the deepening development of the digital economy. In the absence of harmonized multilateral trading system regulations to address the unique challenges posed by digital trade, there is a risk of adverse consequences, including market fragmentation, increased trade costs, and a reduction in trade efficiency. These factors could impede the further upgrading of the industry’s value chain. Furthermore, from a long-term perspective, core countries that maintain a high centrality sustainably tend to occupy the middle and high end of the value chain, where they are in a dominant position, thereby creating long-term trade surpluses. The persistence of trade gains will inevitably trigger tensions in trade relations, which in turn will precipitate significant trade frictions and increased protectionist momentum. This will ultimately result in the weakening of the relatively resilient value chains that have been established. Once a negative effect is observed in trade network relationships, it will be further diffused through the transmission effect of trade network relationships, which will exacerbate the extent of undermining the value chain resilience. Therefore, future research on the impact of trade network relationships on value chain resilience should focus on the impact relationship curve between the two. To this end, it is crucial to find and clarify the inflection point of the curve and provide countermeasure suggestions for the sustainable upgrading of China’s service industry value chain resilience based on the inflection point, i.e., how to sustainably release the positive effects and delay or reduce the negative impacts.
Acknowledgements
The authors thank the anonymous reviewers for their valuable comments and suggestions.
-
Funding information: This article is a preliminary result of the 2021 Jiangsu Provincial Social Science Fund Project (21EYD004).
-
Author contributions: All authors have accepted responsibility for the entire content of this manuscript and consented to its submission to the journal, reviewed all the results and approved the final version of the manuscript. Both HZ and TD wrote the paper. HZ designed the study, developed the methodology, and critically reviewed the manuscript. TD collected, organized, and analyzed the data.
-
Conflict of interest: Authors state no conflict of interest.
-
Data availability statement: The data that support the findings of this study are available from the corresponding author upon reasonable request.
-
Article note: As part of the open assessment, reviews and the original submission are available as supplementary files on our website.
References
Adu, A. D., Andrew, A. H., & Asuming, B. A. (2021). Ghana’s rice value chain resilience in the context of COVID-19. Social Sciences & Humanities Open, 4(1), 100210.10.1016/j.ssaho.2021.100210Search in Google Scholar
Ambulkar, S., Blackhurst, J., & Grawe, S. (2015). Firm’s resilience to supply chain disruptions: Scale development and empirical examination. Journal of Operations Management, 33–34(1), 111–122.10.1016/j.jom.2014.11.002Search in Google Scholar
Antràs, P., & Chor, D. (2013). Organizing the global value chain. Econometrica, 81(6), 2127–2204.10.3982/ECTA10813Search in Google Scholar
Barabási, A. L., Albert, R., & Jeong, H. (1999). Mean-field theory for scale-free random networks. Physica A: Statistical Mechanics and its Applications, 272(1–2), 173–187.10.1016/S0378-4371(99)00291-5Search in Google Scholar
Barnes, J. A. (1954). Class and committees in a Norwegian island parish. Human Relations, 7(1), 39–58.10.1177/001872675400700102Search in Google Scholar
Changhong, P., & Bin, L. (2021). The economics of China’s opening up: Developing an economic theory that explains China’s achievement. Social Sciences in China, 42(1), 53–76.10.1080/02529203.2021.1895500Search in Google Scholar
Chen, Y. F. (2011). Analysis on social network of world trade situation in 2000–2009. Journal of International Trade, 11, 31–42.Search in Google Scholar
Chen, L. X. (2022). The spatial correlation of producer services and industrial structure optimization: From the perspective of social network analysis. Economic Review, 5, 147–164.Search in Google Scholar
Claudia, C., & Dagmar, M. (2023). The backbone of agrifood value chain resilience: Innovation in the Ecuadorian banana value chain from a historical perspective. World Development Perspectives, 29, 100476.10.1016/j.wdp.2022.100476Search in Google Scholar
David, B., Antonella, S., & Gudrun, O. (2022). Dynamics of food value chains: Resilience, fairness and sustainability. Agriculture, 12(5), 720.10.3390/agriculture12050720Search in Google Scholar
Fan, R. G. (2014). Collaborative innovation in social governance in a complex network structural paradigm. Social Sciences in China, 4, 98–120+206.Search in Google Scholar
Fang, K. (2002). The development of industrial classification standards of China and its comparison with international standards. Statistical Research, 7, 27–31.Search in Google Scholar
Fernandez-Stark, K., & Gereffi, G. (2019). Global value chain analysis: A primer. In Handbook on global value chains (pp. 54–76). Edward Elgar Publishing.10.4337/9781788113779.00008Search in Google Scholar
Freeman, L. C. (1979). Centrality in social networks: Conceptual clarification. Social Networks, 1, 215–239.10.1016/0378-8733(78)90021-7Search in Google Scholar
Geng, W., Wu, X. J., & YE, P. L. (2022). The impact of digital service trade network on the domestic value added in exports – Evidence from cross-country data. Journal of International Trade, 12, 90–110.Search in Google Scholar
Gereffi, G. (2018). Global value chains and development: Redefining the contours of 21st century capitalism. Cambridge University Press.10.1017/9781108559423Search in Google Scholar
Gereffi, G., Humphrey, J., & Sturgeon, T. (2005). The governance of global value chains. Review of International Political Economy, 12(1), 78–104.10.1080/09692290500049805Search in Google Scholar
Giorgio, F., Javier, R., & Stefano, S. (2009). World-trade web: Topological properties, dynamics, and evolution. Physical Review E – Statistical, Nonlinear, and Soft Matter Physics, 79(3), 036115.10.1103/PhysRevE.79.036115Search in Google Scholar
Hu, X. H., & Li, X. (2024). Spatial distribution effect of advanced produce service labor and its network structure characteristics from flow space perspective. Soft Science, 38(2), 18–26.Search in Google Scholar
John, K., Litov, L., & Yeung, B. (2008). Corporate governance and risk‐taking. The Journal of Finance, 63(4), 1679–1728.10.1111/j.1540-6261.2008.01372.xSearch in Google Scholar
Ju, J. D., Yu, X. D., Lu, B., & Li, X. (2020). Analysis of the “Tripod” structure in the global value chain network. China Journal of Economics, 7(4), 1–20.Search in Google Scholar
Krackhardt, D. (1994). Graph Theoretical Dimensions of Informal Organizations. In K. M. Carley & M. J. Prietula (Eds.), Computational Organization Theory (pp. 89–111). New York: Taylor & Francis Group.Search in Google Scholar
Levalle, R. R., & Nof, S. Y. (2015). Resilience by teaming in supply network formation and re-configuration. International Journal of Production Economics, 160, 80–93.10.1016/j.ijpe.2014.09.036Search in Google Scholar
Li, J. H. (2009). Network research Trilogy: Graph theory, social network analysis and complex network theory. Journal of South China Normal University: Social Science Edition, 2, 136–138.Search in Google Scholar
Li, Q. R., & Wang, B. X. (2023). The research on services trade within the RCEP region involving China, Japan, and South Korea. Japanese Studies, 4, 101–129+154–155.Search in Google Scholar
Liang, R. B., & Wang, Y. J. (2024). Impact of trade liberalization and regional trade propagation from the perspective of production Network – Based on the Empirical Study of China(FuJian)Pilot Free Trade Zone. China Economic Quarterly, 24(2), 677–691.Search in Google Scholar
Liu, J. (2004). An introduction to social network analysis. Social Sciences Academic Press.Search in Google Scholar
Liu, J. (2006). Social support networks of Fa Village: A whole network approach. Social Sciences Academic Press.Search in Google Scholar
Lyu, Y., & Wei, Y. N. (2020). Firm’s trade network and domestic value added of exports in global value chains. The Journal of World Economy, 43(12), 50–75.Search in Google Scholar
Ma, S. Z., Ren, W. W., & Wu, G. J. (2016). The characteristics of agricultural trade network and its effects on the global value chain division: A study based on social network analysis. Management World, 3, 60–72.Search in Google Scholar
Niu, H., Lan, S., & Ma, Y. X. (2020). The dynamic evolution and influence mechanism of services trade network structure along“the Belt and Road”. International Business, 5, 78–93.Search in Google Scholar
Ole, H. N., Edda, F., Evi, H., & Larry, G. (2015). Research on the phenomenon of supply chain resilience:A systematic review and paths for further investigation. International Journal of Physical Distribution & Logistics Management, 45(1/2), 90–117.10.1108/IJPDLM-05-2013-0128Search in Google Scholar
Pan, A., & Liu, H. (2022). Structural characteristics and determinants of the belt & road service trade network. Journal of Anhui University(Philosophy and Social Sciences Edition), 46(2), 124–135.Search in Google Scholar
Qu, S. N., & Yang, D. H. (2022). Manufacturing localization,technology backfire and economic deglobalization. China Industrial Economics, 6, 42–60.Search in Google Scholar
Rauch, J. E. (2001). Business and social networks in international trade. Journal of Economic Literature, 39(4), 1177–1203.10.1257/jel.39.4.1177Search in Google Scholar
Ren, Y. W., Yang, Y., Wang, Y., & Liu, Y. (2023). Evolution of the global semiconductor trade geography and its dependencies. Acta Geographica Sinica, 78(2), 371–385.Search in Google Scholar
Schrage, S., & Gilbert, D. U. (2019). Addressing governance gaps in global value chains: Introducing a systematic typology. Journal of Business Ethics, 170(prepublish), 1–16.10.1007/s10551-019-04388-1Search in Google Scholar
Shen, M. H., & Zhang, Z. Y. (2023). New progress and response strategies in the reconstruction of the East Asian regional value chain. Intertrade, 9, 21–34.Search in Google Scholar
Sun, H. P., & Wei, W. (2020). The resilience and operation risk of China’s embeddedness into the global value chain under the background of the COVID-19 pandemic. Review of Economic Research, 6, 91–98.Search in Google Scholar
Sun, J., & Gao, Y. Y. (2018). Three-loop value chain construction and promotion path of China under the “Belt and Road Initiative.” Journal of Nanjing Party Institute of CPC, 5, 82–87+35.Search in Google Scholar
Tang, C. S., & Veelenturf, L. P. (2019). The strategic role of logistics in the industry 4.0 era. Transportation Research Part E, 129, 1–11.10.1016/j.tre.2019.06.004Search in Google Scholar
Thomas, D. R. (2024). The effects of exposure to violence on social network composition and formation. World Development, 180, 106620.10.1016/j.worlddev.2024.106620Search in Google Scholar
Wang, X. P., Hu, F., & Zhang, Y. Y. (2021). Upgrading of China’s manufacturing industry under the framework of dynamic optimization of global value chain – The perspective of value “Three Circulations” collaborative drive. Economist, 2, 43–51.Search in Google Scholar
Wasserman, S., & Faust, K. (1994). Social network analysis: Methods and applications. Cambridge University Press.10.1017/CBO9780511815478Search in Google Scholar
Watts, D. J. (1999). Networks, dynamics, and the small-world phenomenon. American Journal of sociology, 105(2), 493–527.10.1086/210318Search in Google Scholar
Watts, D. J., & Strogatz, S. H. (1998). Collective dynamics of “small-world” networks. Nature, 393(6684), 440–442.10.1038/30918Search in Google Scholar
Wen, Y., & Wen, S. H. (2023). Impact of RCEP trade network evolution on member countries’ global value chains position. Economist, 10, 43–52.Search in Google Scholar
Xing, Y. Q., Gentile, E., & Dollar, D. (2022). Global value chain development report 2021: Beyond production. University of International Business and Economics Press.Search in Google Scholar
Xu, H. L., Hong, C. L., & Sun, T. Y. (2018). Offshore services outsourcing network and upgrading in global value chain of service industry. The Journal of World Economy, 41(6), 77–101.Search in Google Scholar
Yang, R. F., & Zheng, Y. Y. (2023). Research on the impact of digital economy development on the labor division evolution and resilience of global value chain. Journal of Quantitative & Technological Economics, 40(8), 69–89.Search in Google Scholar
Zeng, Y. P. (2020). The structure of economic networks within China’s service industry and its evolution – based on input-output table and social network analysis. Enterprise Economy, 39(9), 128–135.Search in Google Scholar
Zhao, L. B., & Zhang, M. X. (2024). Global digital service technology cross-border spillover network patterns study on spatial-temporal evolution. International Business Research, 45(4), 83–97.Search in Google Scholar
Zhang, H. M. (2023). The optimized development of China’s service industry in the “Belt and Road” regional value chain: A social network analysis. American Journal of Economics and Sociology, 293–323.10.1111/ajes.12548Search in Google Scholar
Zhen, Z., & Wang, F. B. (2022). Evolution of GVC system resilience in response to the impact of adverse events – A longitudinal study based on embedded multi-cases. China Industrial Economics, 10, 174–192.Search in Google Scholar
Zhen, Z., Wang, F. B., & Yang, W. (2022). Reconfiguration of global value chain in response to the impact of COVID-19 pandemic: The emergence of a more resilient business ecosystem. Economic Theory and Business Management, 42(7), 66–81.Search in Google Scholar
Zhu, W. J., & Wang, P. (2020). The structure of economic network within China’s service industry and its evolution–Based on input-output table and social network analysis. Journal of Commercial Economics, 4, 170–173.Search in Google Scholar
Zhu, X. Y., & Guan, B. Y. (2023). Research on the participation of China’s technology service industry in global production network under a new development pattern of “Dual Circulation”. Science Technology and Industry, 23(16), 1–10.Search in Google Scholar
Zuo, B., Wu, G., Zhang, C., Nurbeke, S., Lin, R. J., Yin, J. Y., Dai, H. W., & Wu, J. (2024). Research on the impacts of trade agreements on global trade flows: Based on complex network perspective. World Regional Studies, 33(1), 1–17.Search in Google Scholar
Zuo, Z. W., Jin, Y. P., & Feng, D. L. (2023). The structural evolution and influencing factors of ICT products trade dependent networks. Intertrade, 3, 76–86.Search in Google Scholar
© 2024 the author(s), published by De Gruyter
This work is licensed under the Creative Commons Attribution 4.0 International License.
Articles in the same Issue
- Regular Articles
- Political Turnover and Public Health Provision in Brazilian Municipalities
- Examining the Effects of Trade Liberalisation Using a Gravity Model Approach
- Operating Efficiency in the Capital-Intensive Semiconductor Industry: A Nonparametric Frontier Approach
- Does Health Insurance Boost Subjective Well-being? Examining the Link in China through a National Survey
- An Intelligent Approach for Predicting Stock Market Movements in Emerging Markets Using Optimized Technical Indicators and Neural Networks
- Analysis of the Effect of Digital Financial Inclusion in Promoting Inclusive Growth: Mechanism and Statistical Verification
- Effective Tax Rates and Firm Size under Turnover Tax: Evidence from a Natural Experiment on SMEs
- Re-investigating the Impact of Economic Growth, Energy Consumption, Financial Development, Institutional Quality, and Globalization on Environmental Degradation in OECD Countries
- A Compliance Return Method to Evaluate Different Approaches to Implementing Regulations: The Example of Food Hygiene Standards
- Panel Technical Efficiency of Korean Companies in the Energy Sector based on Digital Capabilities
- Time-varying Investment Dynamics in the USA
- Preferences, Institutions, and Policy Makers: The Case of the New Institutionalization of Science, Technology, and Innovation Governance in Colombia
- The Impact of Geographic Factors on Credit Risk: A Study of Chinese Commercial Banks
- The Heterogeneous Effect and Transmission Paths of Air Pollution on Housing Prices: Evidence from 30 Large- and Medium-Sized Cities in China
- Analysis of Demographic Variables Affecting Digital Citizenship in Turkey
- Green Finance, Environmental Regulations, and Green Technologies in China: Implications for Achieving Green Economic Recovery
- Coupled and Coordinated Development of Economic Growth and Green Sustainability in a Manufacturing Enterprise under the Context of Dual Carbon Goals: Carbon Peaking and Carbon Neutrality
- Revealing the New Nexus in Urban Unemployment Dynamics: The Relationship between Institutional Variables and Long-Term Unemployment in Colombia
- The Roles of the Terms of Trade and the Real Exchange Rate in the Current Account Balance
- Cleaner Production: Analysis of the Role and Path of Green Finance in Controlling Agricultural Nonpoint Source Pollution
- The Research on the Impact of Regional Trade Network Relationships on Value Chain Resilience in China’s Service Industry
- Social Support and Suicidal Ideation among Children of Cross-Border Married Couples
- Asymmetrical Monetary Relations and Involuntary Unemployment in a General Equilibrium Model
- Job Crafting among Airport Security: The Role of Organizational Support, Work Engagement and Social Courage
- Does the Adjustment of Industrial Structure Restrain the Income Gap between Urban and Rural Areas
- Optimizing Emergency Logistics Centre Locations: A Multi-Objective Robust Model
- Geopolitical Risks and Stock Market Volatility in the SAARC Region
- Trade Globalization, Overseas Investment, and Tax Revenue Growth in Sub-Saharan Africa
- Can Government Expenditure Improve the Efficiency of Institutional Elderly-Care Service? – Take Wuhan as an Example
- Media Tone and Earnings Management before the Earnings Announcement: Evidence from China
- Review Articles
- Economic Growth in the Age of Ubiquitous Threats: How Global Risks are Reshaping Growth Theory
- Efficiency Measurement in Healthcare: The Foundations, Variables, and Models – A Narrative Literature Review
- Rethinking the Theoretical Foundation of Economics I: The Multilevel Paradigm
- Financial Literacy as Part of Empowerment Education for Later Life: A Spectrum of Perspectives, Challenges and Implications for Individuals, Educators and Policymakers in the Modern Digital Economy
- Special Issue: Economic Implications of Management and Entrepreneurship - Part II
- Ethnic Entrepreneurship: A Qualitative Study on Entrepreneurial Tendency of Meskhetian Turks Living in the USA in the Context of the Interactive Model
- Bridging Brand Parity with Insights Regarding Consumer Behavior
- The Effect of Green Human Resources Management Practices on Corporate Sustainability from the Perspective of Employees
- Special Issue: Shapes of Performance Evaluation in Economics and Management Decision - Part II
- High-Quality Development of Sports Competition Performance Industry in Chengdu-Chongqing Region Based on Performance Evaluation Theory
- Analysis of Multi-Factor Dynamic Coupling and Government Intervention Level for Urbanization in China: Evidence from the Yangtze River Economic Belt
- The Impact of Environmental Regulation on Technological Innovation of Enterprises: Based on Empirical Evidences of the Implementation of Pollution Charges in China
- Environmental Social Responsibility, Local Environmental Protection Strategy, and Corporate Financial Performance – Empirical Evidence from Heavy Pollution Industry
- The Relationship Between Stock Performance and Money Supply Based on VAR Model in the Context of E-commerce
- A Novel Approach for the Assessment of Logistics Performance Index of EU Countries
- The Decision Behaviour Evaluation of Interrelationships among Personality, Transformational Leadership, Leadership Self-Efficacy, and Commitment for E-Commerce Administrative Managers
- Role of Cultural Factors on Entrepreneurship Across the Diverse Economic Stages: Insights from GEM and GLOBE Data
- Performance Evaluation of Economic Relocation Effect for Environmental Non-Governmental Organizations: Evidence from China
- Functional Analysis of English Carriers and Related Resources of Cultural Communication in Internet Media
- The Influences of Multi-Level Environmental Regulations on Firm Performance in China
- Exploring the Ethnic Cultural Integration Path of Immigrant Communities Based on Ethnic Inter-Embedding
- Analysis of a New Model of Economic Growth in Renewable Energy for Green Computing
- An Empirical Examination of Aging’s Ramifications on Large-scale Agriculture: China’s Perspective
- The Impact of Firm Digital Transformation on Environmental, Social, and Governance Performance: Evidence from China
- Accounting Comparability and Labor Productivity: Evidence from China’s A-Share Listed Firms
- An Empirical Study on the Impact of Tariff Reduction on China’s Textile Industry under the Background of RCEP
- Top Executives’ Overseas Background on Corporate Green Innovation Output: The Mediating Role of Risk Preference
- Neutrosophic Inventory Management: A Cost-Effective Approach
- Mechanism Analysis and Response of Digital Financial Inclusion to Labor Economy based on ANN and Contribution Analysis
- Asset Pricing and Portfolio Investment Management Using Machine Learning: Research Trend Analysis Using Scientometrics
- User-centric Smart City Services for People with Disabilities and the Elderly: A UN SDG Framework Approach
- Research on the Problems and Institutional Optimization Strategies of Rural Collective Economic Organization Governance
- The Impact of the Global Minimum Tax Reform on China and Its Countermeasures
- Sustainable Development of Low-Carbon Supply Chain Economy based on the Internet of Things and Environmental Responsibility
- Measurement of Higher Education Competitiveness Level and Regional Disparities in China from the Perspective of Sustainable Development
- Payment Clearing and Regional Economy Development Based on Panel Data of Sichuan Province
- Coordinated Regional Economic Development: A Study of the Relationship Between Regional Policies and Business Performance
- A Novel Perspective on Prioritizing Investment Projects under Future Uncertainty: Integrating Robustness Analysis with the Net Present Value Model
- Research on Measurement of Manufacturing Industry Chain Resilience Based on Index Contribution Model Driven by Digital Economy
- Special Issue: AEEFI 2023
- Portfolio Allocation, Risk Aversion, and Digital Literacy Among the European Elderly
- Exploring the Heterogeneous Impact of Trade Agreements on Trade: Depth Matters
- Import, Productivity, and Export Performances
- Government Expenditure, Education, and Productivity in the European Union: Effects on Economic Growth
- Replication Study
- Carbon Taxes and CO2 Emissions: A Replication of Andersson (American Economic Journal: Economic Policy, 2019)