A Novel Approach for the Assessment of Logistics Performance Index of EU Countries
-
Mali Ju


Abstract
The impact of logistics performance in the era of sustainable mobility on the overall economic development of a country is inevitable. It can even be said to represent an extremely important component in identifying economic conditions and provides the possibility of defining adequate strategies. In this article, the evaluation of the member countries of the European Union was carried out on the basis of the logistics performance index (LPI) according to the latest report of the World Bank (WB). A unique and original Multiple-Criteria Decision Making (MCDM) approach has been created, and it involves the application of four methods: Criteria Importance Through Intercriteria Correlation, Method based on the Removal Effects of Criteria, and Entropy and Fuzzy ROV (Range of Value). The weighting coefficients of six factors were obtained with the first three methods in crisp form, so they were converted into Triangular Fuzzy Number. The Fuzzy ROV method has been created for the first time in the literature and represents a great contribution from the methodological aspect. The results of the developed model and the applied steps show that there are certain differences in the rankings compared to the World Bank report, with a note that the best-ranked countries have maintained their positions. In addition, verification tests of the originally obtained results were created, with an emphasis on the importance of evaluation parameter values and their impact on the LPI ranking.
1 Introduction
In modern business conditions, a competitive and efficient logistics system has become imperative in the development and creation of advantages on the regional, and especially on the global market. An adequate level of competitiveness in logistics performance has a positive effect on both the business results of an individual company and the overall logistics efficiency of the country in which the company operates. The developed countries of the world are aware of the positive trend of development and investment in logistics, and through a large number of strategies and policies, they strive to improve this area as much as possible. High-quality logistics performance has a positive impact on the volume of international trade. On the other hand, countries with poor logistics infrastructure, as well as low-quality logistics service, can represent an obstacle in the international supply chain. As a result, such countries are often, to a greater or lesser extent, excluded from certain international flows, and thus, their economic and financial growth and development stagnate. For this very reason, it is crucial for countries to constantly monitor, measure, and compare their logistics performance with the logistics performance of other countries in order to find solutions for their own growth and progress in the field of logistics, supply chain (Kouchaki Tajani et al., 2022; Sahoo & Goswami, 2024), and logistics services (Adabavzeh & Nikbakht, 2022). For the adoption of any action plan or policy, such as infrastructure investments or changes in national regulations and laws, an in-depth assessment of the country’s logistics performance is necessary, resulting in a clear and comprehensive set of parameters that evaluate the quality of logistics performance. To achieve a more efficient logistics system, particular attention should be paid to the logistics performance index (LPI), which facilitates the identification of the state in the field of logistics in all countries in the world. The LPI is a set of qualitative and quantitative indicators that help build a country’s logistics profile. It is calculated by the WB and is an indicator of the quality of the country’s logistics environment. The LPI results can be used to compare countries, but also at the level of research within one country, making it a comprehensive international tool for comparison, measuring logistics performance, and achieving facilitation in international transport cooperation.
Due to many advantages of fuzzy set theory (Kabgani, 2023) and the wider application of fuzzy Multiple-Criteria Decision Making (MCDM) methods (Barati & Fanati Rashidi, 2022; Wang et al., 2023) in this article, a novel F-ROV algorithm was developed for the evaluation of potential solutions and, in this specific case, for ranking the LPI of EU countries.
The subject of the research in this article is the analysis of the state of logistics in countries of the European Union from the aspect of LPI scores. The focus and main analysis are based on the 2023 results, which are available in the World Bank reports.
The aims of the research are the development and application of a subjective–objective MCDM model for determining the values of weighting criterion coefficients, and the evaluation of EU countries based on LPI scores. In the article, three methods for determining the weights of the criteria were applied: Entropy, Criteria Importance Through Intercriteria Correlation (CRITIC), and Method based on the Removal Effects of Criteria (MEREC). According to the classification, these methods belong to objective methods to define the weights of criteria, while F-ROV is a method of a subjective nature in this article because it is based on a certain evaluation of the decision maker.
One of the most important problems of LPI evaluation is the equal treatment of influential factors, which can lead to insufficiently precise rankings. At the core, solving this problem is one of the main motivations for creating such a model in this article.
Special emphasis is on the importance of sensitivity analysis. The results obtained can help in understanding and improving logistics performance, which can ultimately lead to improvements in international trade and cooperation between countries.
In addition to the introductory considerations, the article consists of the following sections. Section 2 shows the importance of measuring and monitoring the LPI, and the application of different MCDM approaches for their ranking. Section 3 includes a detailed description of the F-ROV algorithm with an emphasis on the normalization procedure. Also, it is emphasized that three objective methods were used to determine factor weights and that they were converted into TFN. Section 4 presents the results, which include a detailed description of the application of the novel fuzzy approach. In Section 5, verification tests are performed, including testing the influence of the change in factor weights, analysis with other approaches, changing the size of a decision matrix, and calculating the correlation of the ranks of alternative solutions. Finally, concluding considerations are given with a clear direction for improving the LPI assessment methodology.
2 Literature Review
In this section, we present a review of previous research related to the logistics performance of countries, their monitoring and measurement, as well as their importance and impact on the economy. In addition, the importance of the application of methods and models of multi-criteria decision-making in the evaluation of alternatives, i.e., the ranking of the results of the logistics performance quality of countries, was pointed out. Logistics includes a large number of processes, activities, functions, as well as participants, which must be coordinated in a way that allows all parties participating in the implementation of logistics services to fulfill their requirements. According to that many various models have been created and used for optimization logistics problems, to increase efficiency in any stage of the supply chain or logistics network, solve internal activities in logistics companies in literature etc. (Baharisaravi & Hasan Zadeh, 2020; Dabić-Miletić & Raković, 2023; Saeedi et al., 2023; Stević et al., 2023; Stanimirović et al., 2023; Pajić & Andrejić, 2023). The conditions prevailing in the global market require companies to constantly improve in order to maintain their competitive position. In order for companies to be able to work on improving their performance, it is necessary to monitor and record the results of the processes, activities, and functions they implement. In addition to individual performance indicators for each company, the results at the level of the country in which the company operates are also extremely important.
The LPIs of countries can be found in the data calculated and published by the WB since 2007. World Bank data on LPI values represent the most comprehensive international tool for measuring and comparing logistics performance (Aytekin et al., 2023; Üre et al. 2023). Measuring logistics performance and understanding its indicators are more important today than ever before in the context of major changes in the global market that have occurred since 2018, mainly due to the COVID-19 pandemic, which has caused major disruptions in the receipt and shipment of goods. In order for countries to be able to cope adequately with new changes in the market, it is necessary to understand, measure, and monitor logistics performance, both their own and the logistics performance of countries in the region and throughout the world (Arvis et al., 2023). Poor logistics performance is an obstacle to trade and foreign direct investment and, therefore, an obstacle to economic growth and development. To develop a logistics competitive advantage, governments must assess the current logistics system at the country level and identify which subsystems need to be optimized, developed, created, or completely eliminated through policies and initiatives (Jhawar et al., 2017). Adequate analysis of logistics performance can help countries improve the efficiency of freight transport, and help identify those countries that can be helpful in overcoming their own obstacles and shortcomings through cooperation (Ojala & Çelebi, 2015).
As already pointed out, to achieve high-quality logistics performance, it is necessary to constantly monitor and measure it. Measurement and evaluation of logistics performance is successfully implemented using various methods and integrated models of multicriteria decision-making (MCDM). Thus, for example, in their research, Isik et al. (2020) apply SV and MABAC methods within an integrated MCDM model for the analysis and evaluation of logistics performance in 11 selected countries of Central and Eastern Europe. The fact that the ranking results obtained by applying the model are the same as the ranking results of the World Bank suggests that the applied model is consistent and reliable to use. Biswas and Anand (2020) compare the LPI results of BRICS countries (Brazil, Russia, India, China, South Africa) and G7 countries (Canada, France, Germany, Italy, Japan, United Kingdom and USA) using an integrated PSI and PIV model. Based on the research results, the authors came to the conclusion that the developed G7 countries are more competitive than the BRICS countries in terms of quality of logistics performance. The new methodology for measuring the logistics performance of OECD countries (The Organization for Economic Cooperation and Development) involves the integration of CRITIC, SAW, and Peters’ fuzzy regression method, and was applied in the article by Çakır (2016) and is proved to be a suitable alternative approach in assessing logistics performance of the countries. Yildirim and Mercangoz (2020) also considered the assessment of the LPI results of OECD countries in their research. Ulutaş and Karaköy (2021) integrate the grey SWARA and grey MOORA methods in evaluating the logistics performance of countries in transition. Infrastructure was determined as the most important criterion, and the best-ranked country in transition was Serbia. Özceylan et al. (2016) analyzed and assessed logistics performance in the provinces of Turkey using the AHP-TOPSIS and ANP-TOPSIS models, in which a total of 16 geographic and economic indicators were observed. The authors came to the conclusion that the methodology used provides the possibility of analyzing the impact that the observed indicators have on the quality of the country’s logistics performance, as well as the possibility of creating a map of the country’s logistics performance using a GIS system. In the research by Mercangoz et al. (2020), the authors try to eliminate the uncertainty that inevitably occurs due to the nature of problems that require multi-criteria decision-making. In this sense, they use grey system theory in combination with multi-criteria decision-making methods, i.e., form an integrated grey numbers-COPRAS (COmplex Proportional Assessment) model, and conclude that it can be effectively used to assess the LPI scores of countries.
The study by Yu and Hsiao (2016) presented an alternative Meta-DEA–AR approach intended to assess the efficiency of the logistics performance index of certain countries, which also takes into account differences in the level of income of these countries. The results of the study indicate that the final ranking of the LPI results of the countries obtained by the proposed alternative model is largely comparable to the results of the World Bank ranking. Mešić et al. (2022) apply an integrated CRITIC-MARCOS MCDM model to evaluate the LPI results of the Western Balkan countries. Rezaei et al. (2018) evaluated the importance of each of the six criteria used in the calculation of the final LPI scores, using the BWM (Best Worst Method). They came to the conclusion that although weights have only a slight influence on ranking due to the correlation between LPI indicators, they can influence the formation of different policy priorities in the calculation of LPI values. In the study by Çalık et al. (2022), a large number of MCDM methods were integrated: AHP (Analytic Hierarchy Process), FAHP (Fuzzy AHP), PFAHP (Pythagorean fuzzy AHP), TOPSIS (Technique for Order Preference by Similarity to Ideal Solution), VIKOR (Višekriterijumska Optimizacija i Kompromisno Rešenje, in Serbian), CODAS (Combinative Distance-based Assessment), and BCM (Base Criterion Method), with the aim of pointing out the importance of precise determination of criterion weights, and that changes in criterion weight values significantly affect the final evaluation results. Ulutaş and Karaköy (2019) obtained the weighting coefficient values by integrating the subjective method – SWARA, and the objective method – CRITIC, while they used the PIV method to evaluate EU countries. In that way, they tried to balance the differences in the final ranking of the alternatives that occur in relation to the different values of the weighting coefficients of the criteria. The research by Stević et al. (2022) is another research in which the integrated CRITIC-MARCOS model confirmed the significant influence of the values of the weighting coefficients of criteria on the final ranking of solutions. Namely, in the research, the Balkan countries were evaluated, and then, 36 new scenarios were formed as part of the sensitivity analysis with changed values of the weighting coefficients of the criteria. The results obtained showed that the final ranking of the solutions changed depending on the extent of the change in the values of individual criteria.
Regarding the review analysis of many different studies related to evaluation countries according to LPI score, it can be concluded that no universal model can help decision-makers make precise decisions involving influencing factors from the economic system. It should be emphasized that a novel approach related to the extension of the ROV method with TFN, which facilitates the precise evaluation of a larger set of alternative solutions, has been developed as the solution to solve research gaps.
3 Methods
The flow diagram of research and development is shown in Figure 1. Research flow has been divided into four main stages that are represented separately. The first stage consists of four activities, while the second and third have three. The last stage has five steps and two substeps for sensitivity analysis.

Diagram flow of developed methodology.
In the first stage, recognizing the need for performing such research, we have processed the World Bank report for the 2023 year. After that, we selected 27 countries of the EU for mutual comparison regarding LPI and processed their LPI score. The second stage represented the development of the MCDM model for the assessment of EU countries according to the LPI score. Three steps are to form the MCDM model, developing an algorithm for the fuzzy ROV method, and transform data from the World Bank report into TFN. In the next phase, the first criteria weights were obtained using three objective MCDM methods, and after that converted to TFN to apply the developed F-ROV method in a precise way. The last represents performing verification tests.
3.1 Methods for Determining Criteria Weights
For the purpose of determining the weighting coefficients of the six factors based on which the LPI ranking was performed, three methods were applied: CRITIC (Huskanović et al., 2023), MEREC (Keshavarz-Ghorabaee et al., 2021), and Entropy (Chatterjee & Chakraborty, 2023; Puška et al., 2023). Because it is very difficult to consult proper experts from this field, who should cover the territory of the EU, we have used three different objective methods for determining criteria weights. In such cases, this is the only adequate way to obtain weight coefficients. Furthermore, three objective methods have been applied due to the possibility of having TFN and a better base for developing the F-ROV method. It is important to note that the obtained weighting coefficients are converted to TFN in the following way:
3.2 A Novel Fuzzy Range of Value Method
Since the three methods have already been exploited many times in various studies, in this section of the article, only a novel algorithm of the F-ROV method is presented, and it consists of the steps shown below. In general, the ROV method has not been often applied to solve MCDM problems, despite its advantages shown in the article (Zavadskas et al., 2018) when a rough extension of this method was performed.
Step 1. Determining the set of elements of the MCDM model.
Step 2. Defining a fuzzy initial decision matrix
Step 3. Carrying out the procedure of normalization, which implies a multi-phase procedure. First, it is necessary to define the elements
After that, it is required to determine the difference between the values in the initial matrix and the minimum value
Then, the final normalized fuzzy values are obtained by applying the following expression:
In the final fuzzy normalized matrix, in rare cases, it may arise when the basic concept of TFN is not satisfied, and then, it is necessary to apply the following:
Equations (4)–(6) are applied for the criteria with a desirable maximum value, while for the criteria with a desirable minimum value, the following procedure (8) is carried out:
Step 4. Multiplication of the matrix
Step 5. Determining the sum of the previous matrix in accordance with the orientation of the criteria, where the values for the max criteria
Step 6. The alternatives are sorted in descending order and according to the defuzzified value:
4 Results
To evaluate the LPI, the latest report of the World Bank report has been used, and its ratings for all EU countries are presented in Table 1. Although it is already a well-known fact, it should be noted that the LPI is evaluated based on six criteria (Hadžikadunić et al., 2023): customs (C1), infrastructure (C2), ease of arranging shipments (C3), quality of logistics services (C4), tracking and tracing of consignments (C5), and timeliness, i.e., delivery of shipments within scheduled time (C6).
LPI score of EU countries for 2023
| Alternative | C1 | C2 | C3 | C4 | C5 | C6 | |
|---|---|---|---|---|---|---|---|
| A1 | Austria | 3.7 | 3.9 | 3.8 | 4.0 | 4.2 | 4.3 |
| A2 | Belgium | 3.9 | 4.1 | 3.8 | 4.2 | 4.0 | 4.2 |
| A3 | Bulgaria | 3.1 | 3.1 | 3.0 | 3.3 | 3.3 | 3.5 |
| A4 | Czech Republic | 3.0 | 3.0 | 3.4 | 3.6 | 3.2 | 3.7 |
| A5 | Denmark | 4.1 | 4.1 | 3.6 | 4.1 | 4.3 | 4.1 |
| A6 | Estonia | 3.2 | 3.5 | 3.4 | 3.7 | 3.8 | 4.1 |
| A7 | Finland | 4.0 | 4.2 | 4.1 | 4.2 | 4.2 | 4.3 |
| A8 | France | 3.7 | 3.8 | 3.7 | 3.8 | 4.0 | 4.1 |
| A9 | Greece | 3.2 | 3.7 | 3.8 | 3.8 | 3.9 | 3.9 |
| A10 | Croatia | 3.0 | 3.0 | 3.6 | 3.4 | 3.4 | 3.2 |
| A11 | Ireland | 3.4 | 3.5 | 3.6 | 3.6 | 3.7 | 3.7 |
| A12 | Italy | 3.4 | 3.8 | 3.4 | 3.8 | 3.9 | 3.9 |
| A13 | Cyprus | 2.9 | 2.8 | 3.1 | 3.2 | 3.4 | 3.5 |
| A14 | Latvia | 3.3 | 3.3 | 3.2 | 3.7 | 3.6 | 4.0 |
| A15 | Lithuania | 3.2 | 3.5 | 3.4 | 3.6 | 3.1 | 3.6 |
| A16 | Luxembourg | 3.6 | 3.6 | 3.6 | 3.9 | 3.5 | 3.5 |
| A17 | Hungary | 2.7 | 3.1 | 3.4 | 3.1 | 3.4 | 3.6 |
| A18 | Malta | 3.4 | 3.7 | 3.0 | 3.4 | 3.4 | 3.2 |
| A19 | Netherlands | 3.9 | 4.2 | 3.7 | 4.2 | 4.2 | 4.0 |
| A20 | Germany | 3.9 | 4.3 | 3.7 | 4.2 | 4.2 | 4.1 |
| A21 | Poland | 3.4 | 3.5 | 3.3 | 3.6 | 3.8 | 3.9 |
| A22 | Portugal | 3.2 | 3.6 | 3.1 | 3.6 | 3.2 | 3.6 |
| A23 | Romania | 2.7 | 2.9 | 3.4 | 3.3 | 3.5 | 3.6 |
| A24 | Slovakia | 3.2 | 3.3 | 3.0 | 3.4 | 3.3 | 3.5 |
| A25 | Slovenia | 3.4 | 3.6 | 3.4 | 3.3 | 3.0 | 3.3 |
| A26 | Spain | 3.6 | 3.8 | 3.7 | 3.9 | 4.1 | 4.2 |
| A27 | Sweden | 4.0 | 4.2 | 3.4 | 4.2 | 4.1 | 4.2 |
It should be emphasized that for the purpose of determining the weighting coefficients of the six factors on the basis of which the LPI ranking was performed, three methods were applied. CRITIC, MEREC, and Entropy, and the results given in Table 2 were obtained.
Values of w j calculated with three methods
| CRITIC | 0.153 | 0.154 | 0.219 | 0.127 | 0.155 | 0.192 |
| MEREC | 0.198 | 0.211 | 0.123 | 0.150 | 0.173 | 0.145 |
| Entropy | 0.215 | 0.233 | 0.106 | 0.135 | 0.184 | 0.126 |
Using equation (1), the fuzzy weights of the criteria are obtained, and then, they are used in the F-ROV method, obtaining the following values:
After that, it is necessary to form a fuzzy initial matrix, which is shown in Table 3. The LPI score from the World Bank report was converted using a linguistic scale with 9 variations that are transformed into TFN. Linguistic scale is as follows: Extremely poor (EP) – (1, 1, 1); Very poor (VP) – (1, 1, 3); Poor (P) – (1, 3, 3); Medium poor (MP) – (3, 3, 5); Medium (M) – (3, 5, 5); Medium good (MG) – (5, 5, 7), Good (G) – (5, 7, 7), Very good (VG) – (7, 7, 9); Extremely good (EG) – (7, 9, 9).
Initial F-ROV matrix
| C1 | C2 | C3 | C4 | C5 | C6 | |||||||||||||
|---|---|---|---|---|---|---|---|---|---|---|---|---|---|---|---|---|---|---|
| A1 | 5 | 5 | 7 | 5 | 7 | 7 | 5 | 5 | 7 | 5 | 7 | 7 | 7 | 7 | 9 | 7 | 9 | 9 |
| A2 | 5 | 7 | 7 | 7 | 7 | 9 | 5 | 5 | 7 | 7 | 7 | 9 | 5 | 7 | 7 | 7 | 7 | 9 |
| A3 | 1 | 3 | 3 | 1 | 3 | 3 | 1 | 1 | 3 | 3 | 3 | 5 | 3 | 3 | 5 | 3 | 5 | 5 |
| A4 | 1 | 1 | 3 | 1 | 1 | 3 | 3 | 3 | 5 | 3 | 5 | 5 | 1 | 3 | 3 | 5 | 5 | 7 |
| A5 | 7 | 7 | 9 | 7 | 7 | 9 | 3 | 5 | 5 | 7 | 7 | 9 | 7 | 9 | 9 | 7 | 7 | 9 |
| A6 | 1 | 3 | 3 | 3 | 5 | 5 | 3 | 3 | 5 | 5 | 5 | 7 | 5 | 5 | 7 | 7 | 7 | 9 |
| A7 | 5 | 7 | 7 | 7 | 7 | 9 | 7 | 7 | 9 | 7 | 7 | 9 | 7 | 7 | 8 | 7 | 9 | 9 |
| A8 | 5 | 5 | 7 | 5 | 5 | 7 | 5 | 5 | 7 | 5 | 5 | 7 | 5 | 7 | 7 | 7 | 7 | 9 |
| A9 | 1 | 3 | 3 | 5 | 5 | 7 | 5 | 5 | 7 | 5 | 5 | 7 | 5 | 7 | 7 | 5 | 7 | 7 |
| A10 | 1 | 1 | 3 | 1 | 1 | 3 | 3 | 5 | 5 | 3 | 3 | 5 | 3 | 3 | 5 | 1 | 3 | 3 |
| A11 | 3 | 3 | 5 | 3 | 5 | 5 | 3 | 5 | 5 | 3 | 5 | 5 | 5 | 5 | 7 | 5 | 5 | 7 |
| A12 | 3 | 3 | 5 | 5 | 5 | 7 | 3 | 3 | 5 | 5 | 5 | 7 | 5 | 7 | 7 | 5 | 7 | 7 |
| A13 | 1 | 1 | 3 | 1 | 1 | 1 | 1 | 3 | 3 | 1 | 3 | 3 | 3 | 3 | 5 | 3 | 5 | 5 |
| A14 | 3 | 3 | 5 | 3 | 3 | 5 | 1 | 3 | 3 | 5 | 5 | 7 | 3 | 5 | 5 | 5 | 7 | 7 |
| A15 | 1 | 3 | 3 | 3 | 5 | 5 | 3 | 3 | 5 | 3 | 5 | 5 | 1 | 3 | 3 | 3 | 5 | 5 |
| A16 | 3 | 5 | 5 | 3 | 5 | 5 | 3 | 5 | 5 | 5 | 7 | 7 | 3 | 5 | 5 | 3 | 5 | 5 |
| A17 | 1 | 1 | 1 | 1 | 3 | 3 | 3 | 3 | 5 | 1 | 3 | 3 | 3 | 3 | 5 | 3 | 5 | 5 |
| A18 | 3 | 3 | 5 | 5 | 5 | 7 | 1 | 1 | 3 | 3 | 3 | 5 | 3 | 3 | 5 | 1 | 3 | 3 |
| A19 | 5 | 7 | 7 | 7 | 7 | 9 | 5 | 5 | 7 | 7 | 7 | 9 | 7 | 7 | 9 | 5 | 7 | 7 |
| A20 | 5 | 7 | 7 | 7 | 9 | 9 | 5 | 5 | 7 | 7 | 7 | 9 | 7 | 7 | 9 | 7 | 7 | 9 |
| A21 | 3 | 3 | 5 | 3 | 5 | 5 | 3 | 3 | 5 | 3 | 5 | 5 | 5 | 5 | 7 | 5 | 7 | 7 |
| A22 | 1 | 3 | 3 | 3 | 5 | 5 | 1 | 3 | 3 | 3 | 5 | 5 | 1 | 3 | 3 | 3 | 5 | 5 |
| A23 | 1 | 1 | 1 | 1 | 1 | 3 | 3 | 3 | 5 | 3 | 3 | 5 | 3 | 5 | 5 | 3 | 5 | 5 |
| A24 | 1 | 3 | 3 | 3 | 3 | 5 | 1 | 1 | 3 | 3 | 3 | 5 | 3 | 3 | 5 | 3 | 5 | 5 |
| A25 | 3 | 3 | 5 | 3 | 5 | 5 | 3 | 3 | 5 | 3 | 3 | 5 | 1 | 1 | 3 | 3 | 3 | 5 |
| A26 | 3 | 5 | 5 | 5 | 5 | 7 | 5 | 5 | 7 | 5 | 7 | 7 | 7 | 7 | 9 | 7 | 7 | 9 |
| A27 | 5 | 7 | 7 | 7 | 7 | 9 | 3 | 3 | 5 | 7 | 7 | 9 | 7 | 7 | 9 | 7 | 7 | 9 |
EU countries have an LPI score interval of 2.7–4.3 (because the lowest score from the World Bank report is 2.7, and the highest is 4.3), and when we take into account a scale of nine levels, we get intervals of 0.2. The initial matrix for the F-ROV method is defined by transforming the values of Table 1 as follows: LPI score values 2.7–2.8 = (1, 1, 1); 2.9–3.0 = (1, 1, 3); 3.1–3.2 = (1, 3, 3); 3.3–3.4 = (3, 3, 5); 3.5–3.6 = (3, 5, 5); 3.7–3.8 = (5, 5, 7), 3.9–4.0 = (5, 7, 7), 4.1–4.2 = (7, 7, 9) and 4.3 = (7, 9, 9).
The normalized F-ROV matrix (Table 4) is obtained by applying equations (2)–(7), and all criteria are modeled with the desired maximum value.
Normalized F-ROV matrix
| C1 | C2 | C3 | C4 | C5 | C6 | ||||||||||||||
|---|---|---|---|---|---|---|---|---|---|---|---|---|---|---|---|---|---|---|---|
| A1 | 1.50 | 1.67 | 2.00 | 1.50 | 1.75 | 2.00 | 1.25 | 1.67 | 2.50 | 1.25 | 2.00 | 2.50 | 1.50 | 1.75 | 3.00 | 1.50 | 2.00 | 3.00 | |
| A2 | 1.50 | 2.00 | 2.00 | 1.75 | 1.75 | 2.33 | 1.25 | 1.67 | 2.50 | 1.50 | 2.00 | 3.00 | 1.25 | 1.75 | 2.50 | 1.50 | 1.67 | 3.00 | |
| A3 | 1.00 | 1.33 | 1.33 | 1.00 | 1.25 | 1.33 | 0.75 | 1.00 | 1.50 | 1.00 | 1.00 | 2.00 | 1.00 | 1.25 | 2.00 | 1.00 | 1.33 | 2.00 | |
| A4 | 1.00 | 1.00 | 1.33 | 1.00 | 1.00 | 1.33 | 1.00 | 1.33 | 2.00 | 1.00 | 1.50 | 2.00 | 0.75 | 1.25 | 1.50 | 1.25 | 1.33 | 2.50 | |
| A5 | 1.75 | 2.00 | 2.33 | 1.75 | 1.75 | 2.33 | 1.00 | 1.67 | 2.00 | 1.50 | 2.00 | 3.00 | 1.50 | 2.00 | 3.00 | 1.50 | 1.67 | 3.00 | |
| A6 | 1.00 | 1.33 | 1.33 | 1.25 | 1.50 | 1.67 | 1.00 | 1.33 | 2.00 | 1.25 | 1.50 | 2.50 | 1.25 | 1.50 | 2.50 | 1.50 | 1.67 | 3.00 | |
| A7 | 1.50 | 2.00 | 2.00 | 1.75 | 1.75 | 2.33 | 1.50 | 2.00 | 3.00 | 1.50 | 2.00 | 3.00 | 1.50 | 1.75 | 2.75 | 1.50 | 2.00 | 3.00 | |
| A8 | 1.50 | 1.67 | 2.00 | 1.50 | 1.50 | 2.00 | 1.25 | 1.67 | 2.50 | 1.25 | 1.50 | 2.50 | 1.25 | 1.75 | 2.50 | 1.50 | 1.67 | 3.00 | |
| A9 | 1.00 | 1.33 | 1.33 | 1.50 | 1.50 | 2.00 | 1.25 | 1.67 | 2.50 | 1.25 | 1.50 | 2.50 | 1.25 | 1.75 | 2.50 | 1.25 | 1.67 | 2.50 | |
| A10 | 1.00 | 1.00 | 1.33 | 1.00 | 1.00 | 1.33 | 1.00 | 1.67 | 2.00 | 1.00 | 1.00 | 2.00 | 1.00 | 1.25 | 2.00 | 0.75 | 1.00 | 1.50 | |
| A11 | 1.25 | 1.33 | 1.67 | 1.25 | 1.50 | 1.67 | 1.00 | 1.67 | 2.00 | 1.00 | 1.50 | 2.00 | 1.25 | 1.50 | 2.50 | 1.25 | 1.33 | 2.50 | |
| A12 | 1.25 | 1.33 | 1.67 | 1.50 | 1.50 | 2.00 | 1.00 | 1.33 | 2.00 | 1.25 | 1.50 | 2.50 | 1.25 | 1.75 | 2.50 | 1.25 | 1.67 | 2.50 | |
| A13 | 1.00 | 1.00 | 1.33 | 1.00 | 1.00 | 1.00 | 0.75 | 1.33 | 1.50 | 0.75 | 1.00 | 1.50 | 1.00 | 1.25 | 2.00 | 1.00 | 1.33 | 2.00 | |
| A14 | 1.25 | 1.33 | 1.67 | 1.25 | 1.25 | 1.67 | 0.75 | 1.33 | 1.50 | 1.25 | 1.50 | 2.50 | 1.00 | 1.50 | 2.00 | 1.25 | 1.67 | 2.50 | |
| A15 | 1.00 | 1.33 | 1.33 | 1.25 | 1.50 | 1.67 | 1.00 | 1.33 | 2.00 | 1.00 | 1.50 | 2.00 | 0.75 | 1.25 | 1.50 | 1.00 | 1.33 | 2.00 | |
| A16 | 1.25 | 1.67 | 1.67 | 1.25 | 1.50 | 1.67 | 1.00 | 1.67 | 2.00 | 1.25 | 2.00 | 2.50 | 1.00 | 1.50 | 2.00 | 1.00 | 1.33 | 2.00 | |
| A17 | 1.00 | 1.00 | 1.00 | 1.00 | 1.25 | 1.33 | 1.00 | 1.33 | 2.00 | 0.75 | 1.00 | 1.50 | 1.00 | 1.25 | 2.00 | 1.00 | 1.33 | 2.00 | |
| A18 | 1.25 | 1.33 | 1.67 | 1.50 | 1.50 | 2.00 | 0.75 | 1.00 | 1.50 | 1.00 | 1.00 | 2.00 | 1.00 | 1.25 | 2.00 | 0.75 | 1.00 | 1.50 | |
| A19 | 1.50 | 2.00 | 2.00 | 1.75 | 1.75 | 2.33 | 1.25 | 1.67 | 2.50 | 1.50 | 2.00 | 3.00 | 1.50 | 1.75 | 3.00 | 1.25 | 1.67 | 2.50 | |
| A20 | 1.50 | 2.00 | 2.00 | 1.75 | 2.00 | 2.33 | 1.25 | 1.67 | 2.50 | 1.50 | 2.00 | 3.00 | 1.50 | 1.75 | 3.00 | 1.50 | 1.67 | 3.00 | |
| A21 | 1.25 | 1.33 | 1.67 | 1.25 | 1.50 | 1.67 | 1.00 | 1.33 | 2.00 | 1.00 | 1.50 | 2.00 | 1.25 | 1.50 | 2.50 | 1.25 | 1.67 | 2.50 | |
| A22 | 1.00 | 1.33 | 1.33 | 1.25 | 1.50 | 1.67 | 0.75 | 1.33 | 1.50 | 1.00 | 1.50 | 2.00 | 0.75 | 1.25 | 1.50 | 1.00 | 1.33 | 2.00 | |
| A23 | 1.00 | 1.00 | 1.00 | 1.00 | 1.00 | 1.33 | 1.00 | 1.33 | 2.00 | 1.00 | 1.00 | 2.00 | 1.00 | 1.50 | 2.00 | 1.00 | 1.33 | 2.00 | |
| A24 | 1.00 | 1.33 | 1.33 | 1.25 | 1.25 | 1.67 | 0.75 | 1.00 | 1.50 | 1.00 | 1.00 | 2.00 | 1.00 | 1.25 | 2.00 | 1.00 | 1.33 | 2.00 | |
| A25 | 1.25 | 1.33 | 1.67 | 1.25 | 1.50 | 1.67 | 1.00 | 1.33 | 2.00 | 1.00 | 1.00 | 2.00 | 0.75 | 1.00 | 1.50 | 1.00 | 1.00 | 2.00 | |
| A26 | 1.25 | 1.67 | 1.67 | 1.50 | 1.50 | 2.00 | 1.25 | 1.67 | 2.50 | 1.25 | 2.00 | 2.50 | 1.50 | 1.75 | 3.00 | 1.50 | 1.67 | 3.00 | |
| A27 | 1.50 | 2.00 | 2.00 | 1.75 | 1.75 | 2.33 | 1.00 | 1.33 | 2.00 | 1.50 | 2.00 | 3.00 | 1.50 | 1.75 | 3.00 | 1.50 | 1.67 | 3.00 | |
In the normalized matrix, the values
It should be noted that for equal values in the initial fuzzy decision matrix, it is not mandatory to have equal values in a normalized fuzzy matrix. The example for this case is alternative A25 according to the C1 and C4 criteria. This depends from
The formation of the weighted normalized F-ROV matrix is performed using equation (9), and the values are given in Table 5.
Weighted normalized F-ROV matrix
| C1 | C2 | … | C5 | C6 | |||||||||
|---|---|---|---|---|---|---|---|---|---|---|---|---|---|
| A1 | 0.230 | 0.329 | 0.430 | 0.231 | 0.370 | 0.466 | … | 0.232 | 0.303 | 0.553 | 0.189 | 0.290 | 0.575 |
| A2 | 0.230 | 0.395 | 0.430 | 0.270 | 0.370 | 0.544 | … | 0.194 | 0.303 | 0.461 | 0.189 | 0.242 | 0.575 |
| A3 | 0.153 | 0.263 | 0.287 | 0.154 | 0.264 | 0.311 | … | 0.155 | 0.216 | 0.369 | 0.126 | 0.193 | 0.384 |
| A4 | 0.153 | 0.198 | 0.287 | 0.154 | 0.211 | 0.311 | … | 0.116 | 0.216 | 0.276 | 0.158 | 0.193 | 0.479 |
| A5 | 0.269 | 0.395 | 0.502 | 0.270 | 0.370 | 0.544 | … | 0.232 | 0.346 | 0.553 | 0.189 | 0.242 | 0.575 |
| A6 | 0.153 | 0.263 | 0.287 | 0.193 | 0.317 | 0.389 | … | 0.194 | 0.260 | 0.461 | 0.189 | 0.242 | 0.575 |
| A7 | 0.230 | 0.395 | 0.430 | 0.270 | 0.370 | 0.544 | … | 0.232 | 0.303 | 0.507 | 0.189 | 0.290 | 0.575 |
| A8 | 0.230 | 0.329 | 0.430 | 0.231 | 0.317 | 0.466 | … | 0.194 | 0.303 | 0.461 | 0.189 | 0.242 | 0.575 |
| A9 | 0.153 | 0.263 | 0.287 | 0.231 | 0.317 | 0.466 | … | 0.194 | 0.303 | 0.461 | 0.158 | 0.242 | 0.479 |
| A10 | 0.153 | 0.198 | 0.287 | 0.154 | 0.211 | 0.311 | … | 0.155 | 0.216 | 0.369 | 0.095 | 0.145 | 0.288 |
| A11 | 0.192 | 0.263 | 0.358 | 0.193 | 0.317 | 0.389 | … | 0.194 | 0.260 | 0.461 | 0.158 | 0.193 | 0.479 |
| A12 | 0.192 | 0.263 | 0.358 | 0.231 | 0.317 | 0.466 | … | 0.194 | 0.303 | 0.461 | 0.158 | 0.242 | 0.479 |
| A13 | 0.153 | 0.198 | 0.287 | 0.154 | 0.211 | 0.233 | … | 0.155 | 0.216 | 0.369 | 0.126 | 0.193 | 0.384 |
| A14 | 0.192 | 0.263 | 0.358 | 0.193 | 0.264 | 0.389 | … | 0.155 | 0.260 | 0.369 | 0.158 | 0.242 | 0.479 |
| A15 | 0.153 | 0.263 | 0.287 | 0.193 | 0.317 | 0.389 | … | 0.116 | 0.216 | 0.276 | 0.126 | 0.193 | 0.384 |
| A16 | 0.192 | 0.329 | 0.358 | 0.193 | 0.317 | 0.389 | … | 0.155 | 0.260 | 0.369 | 0.126 | 0.193 | 0.384 |
| A17 | 0.153 | 0.198 | 0.215 | 0.154 | 0.264 | 0.311 | … | 0.155 | 0.216 | 0.369 | 0.126 | 0.193 | 0.384 |
| A18 | 0.192 | 0.263 | 0.358 | 0.231 | 0.317 | 0.466 | … | 0.155 | 0.216 | 0.369 | 0.095 | 0.145 | 0.288 |
| A19 | 0.230 | 0.395 | 0.430 | 0.270 | 0.370 | 0.544 | … | 0.232 | 0.303 | 0.553 | 0.158 | 0.242 | 0.479 |
| A20 | 0.230 | 0.395 | 0.430 | 0.270 | 0.423 | 0.544 | … | 0.232 | 0.303 | 0.553 | 0.189 | 0.242 | 0.575 |
| A21 | 0.192 | 0.263 | 0.358 | 0.193 | 0.317 | 0.389 | … | 0.194 | 0.260 | 0.461 | 0.158 | 0.242 | 0.479 |
| A22 | 0.153 | 0.263 | 0.287 | 0.193 | 0.317 | 0.389 | … | 0.116 | 0.216 | 0.276 | 0.126 | 0.193 | 0.384 |
| A23 | 0.153 | 0.198 | 0.215 | 0.154 | 0.211 | 0.311 | … | 0.155 | 0.260 | 0.369 | 0.126 | 0.193 | 0.384 |
| A24 | 0.153 | 0.263 | 0.287 | 0.193 | 0.264 | 0.389 | … | 0.155 | 0.216 | 0.369 | 0.126 | 0.193 | 0.384 |
| A25 | 0.192 | 0.263 | 0.358 | 0.193 | 0.317 | 0.389 | … | 0.116 | 0.173 | 0.276 | 0.126 | 0.145 | 0.384 |
| A26 | 0.192 | 0.329 | 0.358 | 0.231 | 0.317 | 0.466 | … | 0.232 | 0.303 | 0.553 | 0.189 | 0.242 | 0.575 |
| A27 | 0.230 | 0.395 | 0.430 | 0.270 | 0.370 | 0.544 | … | 0.232 | 0.303 | 0.553 | 0.189 | 0.242 | 0.575 |
By completing the F-ROV algorithm, the final results presented in Table 6 are obtained. It is important to emphasize that equations (11) and (12) are not applied in this case since all criteria are benefit.
Results obtained by the F-ROV method
|
|
Crisp value | EU country | Sorting | |||
|---|---|---|---|---|---|---|
| A1 | 1.175 | 1.767 | 2.947 | 1.865 | Austria | 6 |
| A2 | 1.206 | 1.784 | 3.008 | 1.892 | Belgium | 5 |
| A3 | 0.795 | 1.195 | 1.978 | 1.259 | Bulgaria | 23 |
| A4 | 0.815 | 1.185 | 2.092 | 1.274 | Czech Republic | 22 |
| A5 | 1.257 | 1.827 | 3.062 | 1.938 | Denmark | 3 |
| A6 | 0.994 | 1.448 | 2.525 | 1.552 | Estonia | 13 |
| A7 | 1.271 | 1.873 | 3.163 | 1.988 | Finland | 1 |
| A8 | 1.136 | 1.598 | 2.855 | 1.730 | France | 9 |
| A9 | 1.028 | 1.532 | 2.616 | 1.629 | Greece | 10 |
| A10 | 0.790 | 1.110 | 1.992 | 1.204 | Croatia | 26 |
| A11 | 0.969 | 1.441 | 2.425 | 1.526 | Ireland | 15 |
| A12 | 1.039 | 1.491 | 2.578 | 1.597 | Italy | 11 |
| A13 | 0.764 | 1.117 | 1.826 | 1.176 | Cyprus | 27 |
| A14 | 0.935 | 1.395 | 2.299 | 1.469 | Latvia | 16 |
| A15 | 0.822 | 1.356 | 2.073 | 1.387 | Lithuania | 17 |
| A16 | 0.931 | 1.574 | 2.312 | 1.590 | Luxembourg | 12 |
| A17 | 0.790 | 1.170 | 1.941 | 1.235 | Hungary | 25 |
| A18 | 0.879 | 1.200 | 2.110 | 1.298 | Malta | 20 |
| A19 | 1.213 | 1.784 | 3.004 | 1.892 | Netherlands | 4 |
| A20 | 1.245 | 1.837 | 3.100 | 1.949 | Germany | 2 |
| A21 | 0.969 | 1.448 | 2.425 | 1.531 | Poland | 14 |
| A22 | 0.795 | 1.356 | 1.964 | 1.364 | Portugal | 18 |
| A23 | 0.822 | 1.161 | 2.016 | 1.247 | Romania | 24 |
| A24 | 0.834 | 1.195 | 2.056 | 1.278 | Slovakia | 21 |
| A25 | 0.860 | 1.197 | 2.145 | 1.299 | Slovenia | 19 |
| A26 | 1.136 | 1.665 | 2.876 | 1.779 | Spain | 8 |
| A27 | 1.218 | 1.743 | 2.991 | 1.864 | Sweden | 7 |
By completing the calculation procedure of the F-ROV method, which is shown in detail above, the final results are obtained. In general, compared to the World Bank report, there is some conformity, but there is no situation where several countries share the same position, which is the contribution of the research. Finland, Germany, Denmark, The Netherlands, and Belgium represent the top five countries among the 27 observed within the EU network. In comparison to World Bank report results, Finland kept the first position while applying the F-ROV method Germany, Denmark, and the Netherlands are not in the same position; then, Germany is in the second place, Denmark in third, and the Netherlands in fourth, while in WB report all are in the second position (considering only EU countries). Also, Belgium, Austria, and Sweden are in third position in the WB report, while in the MCDM model, they are in the fifth, sixth, and seventh positions, respectively.
5 Verification Tests
5.1 Sensitivity Analysis
In a large number of studies (Švadlenka et al., 2023; Wiȩckowski & Sałabun, 2023), it has been proven that changing the initial values of input parameters plays an important role in the final ranking of alternative solutions. Consequently, in this section, 60 scenarios were created that define new values of input indicators. This specifically means that the reduced values of all six parameters are in the range of 5–95%, depending on the scenario. The values of the first factor were modeled in S1–S10, the second in S11–S20, and so on until the last factor in S51–S60. The newly defined values of the input parameters are shown in Figure 2. This practically means that the first criterion in S10 has been reduced by 95%, and its value is only (0.008, 0.010, 0.011) compared to its initial value (0.153, 0.198, 0.215). The values of other parameters increase proportionally.

Newly defined factor weights.
In accordance with the previously defined new values of the input indicators, it is necessary to reapply the F-ROV method in all 60 scenarios in order to obtain new rankings of the EU countries on the basis of the LPI assessment. As expected, the results are sensitive to changes in the initial values of the criteria, which is particularly expressed by a large set of potential solutions, as shown in Figure 3.

The influence of changing the initial criterion values on the ranking of alternative solutions.
As can be noticed, there is a large number of scenarios (55) in which there is a change in the ranking of the alternatives, at least to the smallest possible extent. In only five scenarios, there is no change in ranks (S1, S11, S31, S32, and S33) since the smallest value reductions (5–25%) occur in them. It is important to emphasize that there are countries that do not change their original ranking in any scenario, which confirms that the weights of the criteria in their ranking do not play any role, namely A8, A14, A15, A22, and A26, which are in ninth, 16th, 17th, 18th, and eighth places, respectively. When it comes to the best-ranked EU countries, depending on the decrease in the importance of the criteria, there are changes in the ranks. Finland maintains the first position in a total of 56 scenarios, which is about 93%. The only negative impact on its ranking is the ease of arranging shipments as the third criterion. By drastically reducing the value of this criterion, Denmark takes the first position, because according to this criterion, it has the lowest score, and if the importance of this criterion is reduced to a minimum, the importance of this country, i.e., the rank, is increasing. In general, regardless of any changes in factor values, it can be found that Finland, Denmark, and Germany are at the top of the list.
Additionally, we have performed a sensitivity analysis with averaging criteria weights using the Bonferroni operator (Radovanović et al., 2023; Tešić et al., 2023).
As can be seen in Table 7 there is no change (absolute values of difference between the original values obtained here) in the ranks of countries, but slight changes have been made in the final values for all countries. The difference between the original values and those obtained here are presented as absolute values, respectively: 0.034, 0.038, 0.026, 0.021, 0.034, 0.031, 0.035, 0.033, 0.029, 0.016, 0.025, 0.029, 0.013, 0.021, 0.026, 0.025, 0.020, 0.028, 0.036, 0.040, 0.028, 0.022, 0.020, 0.025, 0.028, 0.033, 0.039.
Results obtained by the F-ROV method and Bonferroni operator for w j
|
|
Crisp value | EU country | Sorting | |||
|---|---|---|---|---|---|---|
| A1 | 1.417 | 1.781 | 2.449 | 1.831 | Austria | 6 |
| A2 | 1.458 | 1.792 | 2.498 | 1.854 | Belgium | 5 |
| A3 | 0.956 | 1.198 | 1.654 | 1.233 | Bulgaria | 23 |
| A4 | 0.988 | 1.203 | 1.718 | 1.253 | Czech Republic | 22 |
| A5 | 1.512 | 1.835 | 2.573 | 1.904 | Denmark | 3 |
| A6 | 1.195 | 1.458 | 2.099 | 1.521 | Estonia | 13 |
| A7 | 1.537 | 1.892 | 2.613 | 1.953 | Finland | 1 |
| A8 | 1.375 | 1.612 | 2.363 | 1.697 | France | 9 |
| A9 | 1.243 | 1.549 | 2.162 | 1.600 | Greece | 10 |
| A10 | 0.954 | 1.131 | 1.650 | 1.188 | Croatia | 26 |
| A11 | 1.169 | 1.455 | 2.017 | 1.501 | Ireland | 15 |
| A12 | 1.253 | 1.501 | 2.152 | 1.568 | Italy | 11 |
| A13 | 0.921 | 1.134 | 1.519 | 1.163 | Cyprus | 27 |
| A14 | 1.125 | 1.408 | 1.928 | 1.448 | Latvia | 16 |
| A15 | 0.999 | 1.364 | 1.707 | 1.361 | Lithuania | 17 |
| A16 | 1.123 | 1.586 | 1.924 | 1.565 | Luxembourg | 12 |
| A17 | 0.958 | 1.184 | 1.595 | 1.215 | Hungary | 25 |
| A18 | 1.063 | 1.196 | 1.772 | 1.270 | Malta | 20 |
| A19 | 1.463 | 1.792 | 2.507 | 1.856 | Netherlands | 4 |
| A20 | 1.501 | 1.842 | 2.583 | 1.909 | Germany | 2 |
| A21 | 1.169 | 1.458 | 2.017 | 1.503 | Poland | 14 |
| A22 | 0.963 | 1.364 | 1.635 | 1.342 | Portugal | 18 |
| A23 | 0.992 | 1.177 | 1.664 | 1.227 | Romania | 24 |
| A24 | 1.005 | 1.198 | 1.720 | 1.253 | Slovakia | 21 |
| A25 | 1.046 | 1.202 | 1.770 | 1.271 | Slovenia | 19 |
| A26 | 1.370 | 1.680 | 2.386 | 1.746 | Spain | 8 |
| A27 | 1.465 | 1.744 | 2.511 | 1.825 | Sweden | 7 |
5.2 Comparison with Other Approaches
In this section of the article, as recommended by a large number of researchers (Biswas et al., 2023; Ranjan et al., 2023), a comparison analysis with other methods is performed in fuzzy form. F-MARCOS, F-SAW, and F-WASPAS are applied to verify the results obtained, which is shown in Figure 4.

Comparison with other approaches.
The results obtained with the F-ROV method provide excellent results, which is confirmed in this comparison analysis with three other MCDM methods in fuzzy form. This statement is manifested through the change of only six ranks out of a total of 27, which is negligible because it is a change of only one or two positions. Those are the alternatives: A1 (F-MARCOS and F-SAW,), A3 (F-MARCOS, F-SAW, and F-WASPAS), A4 (F-MARCOS, F-SAW, and F-WASPAS), A18 (F-MARCOS, F-SAW, and F-WASPAS), A25 (F-MARCOS, F-SAW, and F-WASPAS) and A27 (F-MARCOS and F-SAW). It is also necessary to state that the top five countries do not change their position.
5.3 Matrix Resizing
In these studies that involve a large set of potential solutions for evaluation, the stability of the proposed model is often tested with a reduction in the size of the initial matrix. A total of 25 were formed, whereby the weakest component or alternative was eliminated and the procedure was repeated. Figure 5 shows the results of the EU countries based on the LPI assessment when reducing the size of the initial fuzzy matrix.

Influence of matrix size change on values and ranks.
In general, a conclusion can be drawn about the variability of the developed F-ROV method, since it is necessary to emphasize that there are changes in the final results when the size of the matrix is changed. In particular, most alternative solutions do not change position, but, e.g., Germany and Denmark change their positions in some sets, while Finland is always ranked best. For example, Germany is in second place in the original set, while in some sets (S11, S16–S24), it is in third position. A similar situation exists with Denmark, which changed its position in the same sets, but Denmark grew from third to second places. Other changes refer to the rise or fall of some alternatives for a single position, which may be negligible in relation to the total number of countries representing alternative solutions.
5.4 Calculation of Correlation
Since there are changes in the ranks when the values of input factors change, and in the comparative analysis, the correlation of the ranks with the SCC (Božanić et al., 2023) and WS (Więckowski et al., 2023) coefficients was tested, which is shown in Figures 6 and 7, respectively.

Correlation in sensitivity analysis.
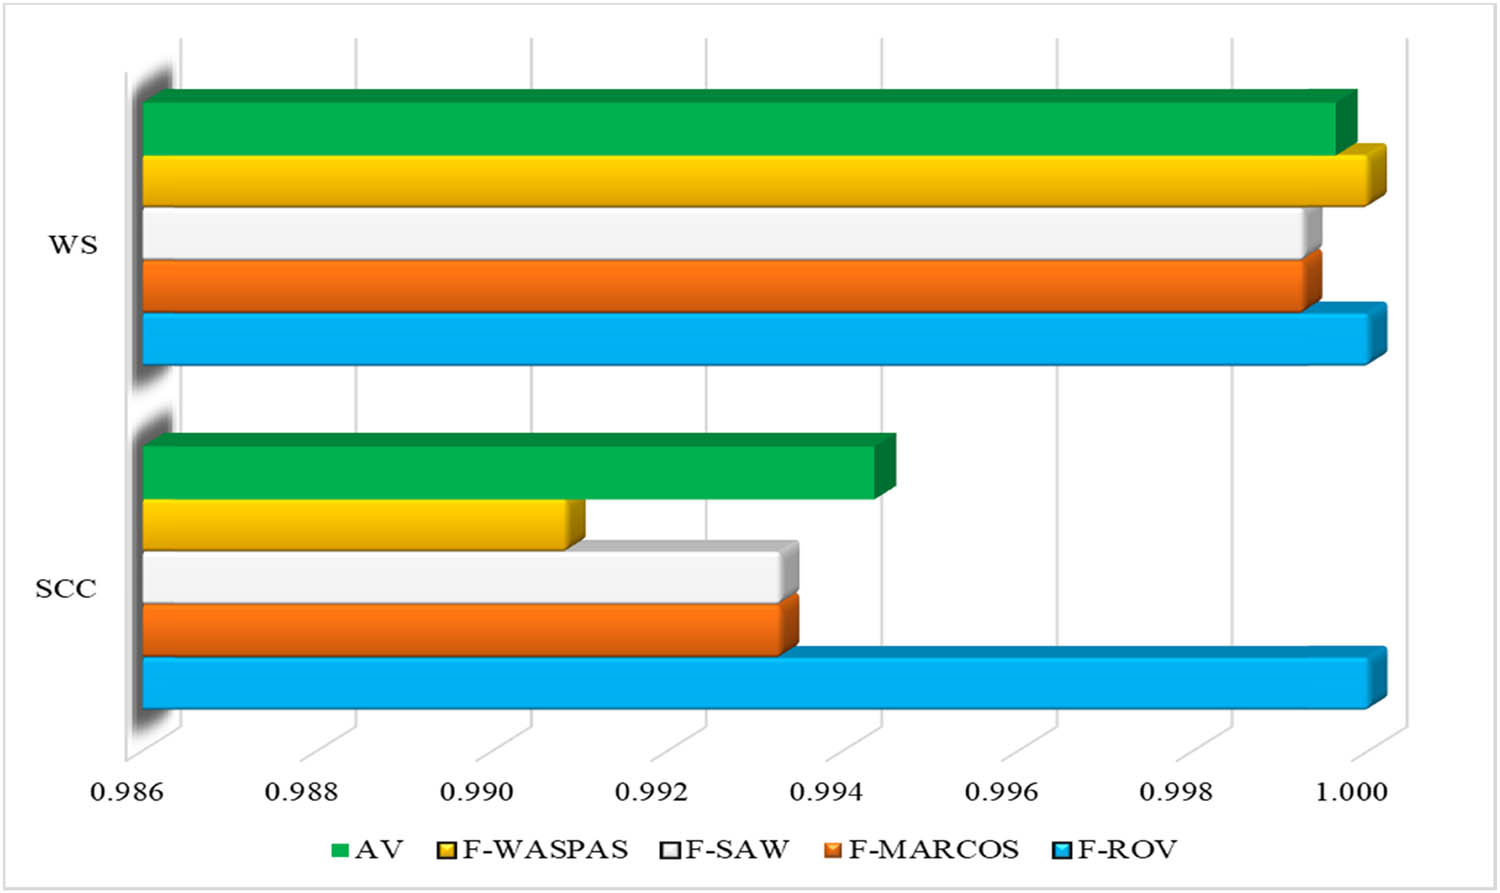
Correlation in comparative analysis.
Previously, we have stated that there is variability in the ranks of alternatives when the weights of input indicators are changed. Taking this into account, it is necessary to determine to what extent there is a correlation compared to the initial solution. Both calculated coefficients show an extremely high degree of correlation since the average values are almost identical, SCC = 0.994 and WS = 0.993, while the minimum correlations are the following: SCC = 0.974 and WS = 0.946. Such coefficients show an almost complete correlation.
The correlation of the initial results and the comparative analysis show an almost complete correlation on average. The complete correlation is as follows: F-ROV with F-MARCOS and F-SAW: SCC = 0.993, WS = 0.999, F-ROV with F-WASPAS: SCC = 0.991 and WS = 1. The lowest SCC is with F-WASPAS due to the changes for alternatives A4 and A17 for two positions.
6 Conclusion
To create an original fuzzy ROV algorithm, data from the latest World Bank report published in 2023 for EU countries and their LPI scores according to six influential factors were used. The last report underwent certain changes in the aspect of methodology, since domestic performance was eliminated, which is a novelty. One of the most important problems of LPI evaluation is the equal treatment of influential factors, which can lead to insufficiently precise rankings. The greatest contribution of this article can be seen through the creation of a unique F-ROV approach to evaluate the logistics performance index of EU countries. From the social aspect, the contribution is manifested by indicating the need to define a methodology for treating the six factors on the basis of which the LPI is assessed and the World Bank report is formed. It is necessary to implement different weights that can be changed in real time and depending on different reports. The results show consistency with the current report when it comes to the top three countries, while other analyses show that there is a variation in the ranks and a deviation from the initial rank. The contribution of this research and the implementation of the defined model is reflected in a comparison with the World Bank report in which many countries share the same position, which is not the case in this article. Due to the applied model, precise rankings are defined for each country, and there is no division of the same position. Apart from contributing to determining criteria weights from the current aspect of the WB report, one of the limitations is not including experts from EU territory to assess criteria because it is a very difficult task. The second limitation has been related to considering only one year of LPI score.
Future research is related to the estimation of LPI by applying one of the MCDM models in different forms, such as integration with plithogenic numbers (Martin et al., 2022), pentagonal neutrosophic numbers (Mohanta & Toragay, 2023), neutrosophic trapezoidal numbers (Bhat, 2023), single-valued neutrosophic sets (Qiu et al., 2023), and single-valued neutrosophic uncertain linguistic variables (Ahmed Mohammed Zubair, 2023) for different regions and areas. Additionally, it is proposed to introduce the weights of LPI evaluation criteria, and this should be achieved through extensive research that would involve surveying all experts who evaluate LPI and apply some of the averaging operators to determine the final weights.
-
Conflict of interest: Authors state no conflict of interest.
-
Article note: As part of the open assessment, reviews and the original submission are available as supplementary files on our website.
References
Adabavzeh, N., & Nikbakht, M. (2022). Developed reverse logistic airline service quality (RL AIRQUAL) model for reverse support service quality gaps analysis in air industry. Journal of Applied Research on Industrial Engineering, 9(1), 95–107.Search in Google Scholar
Ahmed Mohammed Zubair, S. (2023). Single-valued neutrosophic uncertain linguistic set based on multi-input relationship and semantic transformation. Journal of Fuzzy Extension and Applications, 4(4), 257–270.Search in Google Scholar
Arvis, J. F., Ojala, L., Shepherd, B., Ulybina, D., & Wiederer, C. (2023). Connecting to Compete 2023: Trade Logistics in the Global Economy: The Logistics Performance Index and Its Indicators (p. 2023). The World Bank.10.1596/39760Search in Google Scholar
Aytekin, A., Korucuk, S., & Karamaşa, Ç. (2023). Ranking countries according to logistics and international trade efficiencies via REF-III. Journal of Intelligent Management Decision, 2, 74–84.10.56578/jimd020204Search in Google Scholar
Baharisaravi, S., & Hasan Zadeh, R. (2020). Modeling of logistic problem solving of crisis relief in dam breakage: A case study of Shahid Rajaee dam in Sari. Journal of Decisions and Operations Research, 5(1), 1–12.Search in Google Scholar
Barati, R., & Fanati Rashidi, S. (2022). Fuzzy AHP and fuzzy TOPSIS synergy for ranking the factor influencing employee turnover intention in the Iran hotel industry. Journal of Applied Research on Industrial Engineering.Search in Google Scholar
Bhat, S. A. (2023). An enhanced AHP group decision-making model employing neutrosophic trapezoidal numbers. Journal of Operational and Strategic Analytics, 1(2), 81–89. doi: 10.56578/josa010205.Search in Google Scholar
Biswas, S., & Anand, O. P. (2020). Logistics competitiveness index-based comparison of BRICS and G7 Countries: An integrated PSI-PIV approach. IUP Journal of Supply Chain Management, 17(2), 32–57.Search in Google Scholar
Biswas, S., Božanić, D., Pamučar, D., & Marinković, D. (2023). A spherical fuzzy based decision making framework with einstein aggregation for comparing preparedness of smes in quality 4.0. Facta Universitatis, Series: Mechanical Engineering, 21(3), 453–478.10.22190/FUME230831037BSearch in Google Scholar
Božanić, D., Epler, I., Puška, A., Biswas, S., Marinković, D., & Koprivica, S. (2023). Application of the dibr ii–rough mabac decision-making model for ranking methods and techniques of lean organization systems management in the process of technical maintenance. Facta Universitatis, Series: Mechanical Engineering.Search in Google Scholar
Çakır, S. (2016). Measuring logistics performance of OECD countries via fuzzy linear regression. Journal of Multi‐Criteria Decision Analysis, 24(3–4), 177–186.10.1002/mcda.1601Search in Google Scholar
Çalık, A., Erdebilli, B., & Özdemir, Y. S. (2022). Novel Integrated Hybrid Multi-Criteria Decision-Making Approach for Logistics Performance Index. Transportation Research Record, 2677(2), 1392–1400.10.1177/03611981221113314Search in Google Scholar
Chatterjee, S., & Chakraborty, S. (2023). A Multi-criteria decision making approach for 3D printer nozzle material selection. Reports in Mechanical Engineering, 4(1), 62–79.10.31181/rme040121042023cSearch in Google Scholar
Dabić-Miletić, S., & Raković, K. (2023). Ranking of autonomous alternatives for the realization of intralogistics activities in sustainable warehouse systems using the TOPSIS method. Spectrum of Engineering and Management Sciences, 1(1), 48–57.10.31181/sems1120234mSearch in Google Scholar
Hadžikadunić, A., Stević, Ž., Yazdani, M., & Hernandez, V. D. (2023). Comparative analysis of the logistics performance index of European Union Countries: 2007–2023. Journal of Organizations, Technology and Entrepreneurship, 1(1), 1–11. doi: 10.56578/jote010101.Search in Google Scholar
Huskanović, E., Stević, Ž., & Simić, S. (2023). Objective-subjective CRITIC-MARCOS model for selection forklift in internal transport technology processes. Mechatronics and Intelligent Transportation Systems, 2(1), 20–31.10.56578/mits020103Search in Google Scholar
Isik, O., Aydin, Y. & Korasoglu, S. M. (2020). The assessment of the logistics performance index of CEE countries with the new combination of SV and MABAC methods. LogForum, 16(4), 549–559.10.17270/J.LOG.2020.504Search in Google Scholar
Jhawar, A., Garg, S. K., & Khera S. N. (2017). Improving logistics performance through investments and policy intervention: A casual loop model. International Journal of Productivity and Quality Management, 20(3), 363–391.10.1504/IJPQM.2017.10003289Search in Google Scholar
Kabgani, M. H. (2023). Measuring effective indicators for waste disposal in order to assess the sustainable environment: Application of fuzzy approach. International Journal of Research in Industrial Engineering, 12(3), 287–305.Search in Google Scholar
Keshavarz-Ghorabaee, M., Amiri, M., Zavadskas, E. K., Turskis, Z., & Antucheviciene, J. (2021). Determination of objective weights using a new method based on the removal effects of criteria (MEREC). Symmetry, 13(4), 525.10.3390/sym13040525Search in Google Scholar
Kouchaki Tajani, E., Ghane Kanafi, A., Daneshmand-Mehr, M., & HoseinZadeh, A. A. (2022). Robust design of an agile sustainable closed-loop supply chain network with different sales channels. Journal of Decisions and Operations Research, 7(1), 160–210.Search in Google Scholar
Martin, N., Smarandache, F., & Priya, R. (2022). Introduction to plithogenic sociogram with preference representations by plithogenic number. Journal of Fuzzy Extension and Applications, 3(1), 96–108.Search in Google Scholar
Mercangoz, B. A., Yildirim, B., & Yildirim, S. K. (2020). Time period based COPRAS-G method: Application on the logistics performance index. LogForum, 16(2), 239–250.10.17270/J.LOG.2020.432Search in Google Scholar
Mešić, A., Miškić, S., Stević, Ž, & Mastilo, Z. (2022). Hybrid MCDM solutions for evaluation of the logistics performance index of the Western Balkan countries. Economics, 10(1), 13–34.10.2478/eoik-2022-0004Search in Google Scholar
Mohanta, K. K., & Toragay, O. (2023). Enhanced performance evaluation through neutrosophic data envelopment analysis leveraging pentagonal neutrosophic numbers. Journal of Operational and Strategic Analytics, 1(2), 70–80. doi: 10.56578/josa010204.Search in Google Scholar
Ojala, L., & Çelebi, D. (2015). The World Bank’s Logistics Performance Index (LPI) and drivers of logistics performance. Proceeding of MAC-EMM OECD, 3–30.Search in Google Scholar
Özceylan, E., Çetinkaya, C., Erbaş, M., & Kabak, M. (2016). Logistic performance evaluation of provinces in Turkey: A GIS-based multi-criteria decision analysis. Transportation Research Part A: Policy and Practice, 94, 323–337.10.1016/j.tra.2016.09.020Search in Google Scholar
Pajić, V., & Andrejić, M. (2023). Risk analysis in internal transport: An evaluation of occupational health and safety using the Fine-Kinney method. Journal of Operational and Strategic Analytics, 1(4), 147–159. doi: 10.56578/josa010401.Search in Google Scholar
Puška, A., Stojanović, I., & Štilić, A. (2023). The influence of objective weight determination methods on electric vehicle selection in urban logistics. Journal of Intelligent Management Decision, 2(3), 117–129.10.56578/jimd020302Search in Google Scholar
Qiu, P., Sorourkhah, A., Kausar, N., Cagin, T., & Edalatpanah, S. A. (2023). Simplifying the complexity in the problem of choosing the best private-sector partner. Systems, 11(2), 80.10.3390/systems11020080Search in Google Scholar
Radovanović, M., Božanić, D., Tešić, D., Puška, A., Hezam, I. M., & Jana, C. (2023). Application of hybrid DIBR-FUCOM-LMAW-Bonferroni-grey-EDAS model in multicriteria decision-making. Facta Universitatis, Series: Mechanical Engineering, 21(3), 387–403.10.22190/FUME230824036RSearch in Google Scholar
Ranjan, R., Rajak, S., & Chatterjee, P. (2023). Material selection for sintered pulley in automobile: An integrated CRITIC-MARCOS model. Reports in Mechanical Engineering, 4(1), 225–240.10.31181/rme040105102023rSearch in Google Scholar
Rezaei, J., van Roekel, W. S. & Tavasszy, L. (2018). Measuring the relative importance of the logistics performance index indicators using Best Worst Method. Transport Policy, 68, 158–169.10.1016/j.tranpol.2018.05.007Search in Google Scholar
Saeedi, S., Poursabzi, O., Ardalan, Z., & Karimi, S. (2023). A variable service rate queue model for hub median problem. Journal of Applied Research on Industrial Engineering, 10(2), 155–166.Search in Google Scholar
Sahoo, S. K., & Goswami, S. S. (2024). Green supplier selection using MCDM: A comprehensive review of recent studies. Spectrum of Engineering and Management Sciences, 2(1), 1–16.10.31181/dma21202420Search in Google Scholar
Stanimirović, D., Bjelošević, R., Gatarić, D., Đukić, A., & Aleksić, B. (2023). Selection of the location of a goods transportation center using the moora method. Journal TTTP-Traffic and Transport Theory and Practice, 8(1–2), 13–22.Search in Google Scholar
Stević, Ž., Bašić, A., Moslem, S., & Zhong, K. (2023). An integrated ABC-FUCOM model for product classification. Spectrum of Engineering and Management Sciences, 1(1), 83–91.10.31181/sems1120239kSearch in Google Scholar
Stević, Ž., Erceg, Ž., & Kovačević, B. (2022). The impact of sensitivity analysis on the evaluation of the logistics performance index. Novi Ekonomist, 16(1), 41–48.10.7251/NOEEN2231041SSearch in Google Scholar
Švadlenka, L., Bošković, S., Jovčić, S., Simic, V., Kumar, S., & Zanne, M. (2023). Third-party logistics provider selection for sustainable last-mile delivery: A case study of E-shop in Belgrade. J. Urban Dev. Manag, 2(1), 1–13.10.56578/judm020101Search in Google Scholar
Tešić, D., Božanić, D., & Milić, A. (2023). A multi-criteria decision-making model for pontoon bridge selection: An application of the DIBR II-NWBM-FF MAIRCA approach. Journal of Engineering Management and Systems Engineering, 2(4), 212–223.10.56578/jemse020403Search in Google Scholar
Ulutaş, A., & Karaköy, Ç. (2019). An analysis of logistics performance index of EU countries with an integrated MCDM model. Economics and Business Review, 5(4), 49–69.10.18559/ebr.2019.4.3Search in Google Scholar
Ulutaş, A., & Karaköy, Ç. (2021). Evaluation of LPI values of transition economies countries with a grey MCDM model. Handbook of Research on Applied AI for International Business and Marketing Applications. IGI Global. pp. 499–511.10.4018/978-1-7998-5077-9.ch024Search in Google Scholar
Üre, S., Demir, O., Karaköy, C., & Ulutaş, A. (2023). Relationship between international trade and logistics: An evaluation on countries of Shanghai Pact and the Belt and Road Initiative. Journal of Intelligent Management Decision, 2(1), 30–37.10.56578/jimd020104Search in Google Scholar
Wang, P., Zhu, B., Yu, Y., Ali, Z., & Almohsen, B. (2023). Complex intuitionistic fuzzy DOMBI prioritized aggregation operators and their application for resilient green supplier selection. Facta Universitatis, Series: Mechanical Engineering, 21(3), 339–357.10.22190/FUME230805029WSearch in Google Scholar
Wiȩckowski, J., & Sałabun, W. (2023). Sensitivity analysis approaches in multi-criteria decision analysis: A systematic review. Applied Soft Computing, 148, 110915.10.1016/j.asoc.2023.110915Search in Google Scholar
Więckowski, J., Kizielewicz, B., Shekhovtsov, A., & Sałabun, W. (2023). How do the criteria affect sustainable supplier evaluation? – A case study using multi-criteria decision analysis methods in a fuzzy environment. Journal of Engineering Management and Systems Engineering, 2(1), 37–52.10.56578/jemse020102Search in Google Scholar
Yildirim, B. F., & Mercangoz, B. A. (2020). Evaluating the logistics performance of OECD countries by using fuzzy AHP and ARAS-G. Eurasian Economic Review, 10(1), 27–45.10.1007/s40822-019-00131-3Search in Google Scholar
Yu, M. M., & Hsiao, B. (2016). Measuring the technology gap and logistics performance of individual countries by using a meta-DEA–AR model. Maritime Policy & Management, 43(1), 98–120.10.1080/03088839.2015.1037372Search in Google Scholar
Zavadskas, E. K., Nunić, Z., Stjepanović, Ž., & Prentkovskis, O. (2018). A novel rough range of value method (R-ROV) for selecting automatically guided vehicles (AGVs). Studies in Informatics and Control, 27(4), 385–394.10.24846/v27i4y201802Search in Google Scholar
© 2024 the author(s), published by De Gruyter
This work is licensed under the Creative Commons Attribution 4.0 International License.
Articles in the same Issue
- Regular Articles
- Political Turnover and Public Health Provision in Brazilian Municipalities
- Examining the Effects of Trade Liberalisation Using a Gravity Model Approach
- Operating Efficiency in the Capital-Intensive Semiconductor Industry: A Nonparametric Frontier Approach
- Does Health Insurance Boost Subjective Well-being? Examining the Link in China through a National Survey
- An Intelligent Approach for Predicting Stock Market Movements in Emerging Markets Using Optimized Technical Indicators and Neural Networks
- Analysis of the Effect of Digital Financial Inclusion in Promoting Inclusive Growth: Mechanism and Statistical Verification
- Effective Tax Rates and Firm Size under Turnover Tax: Evidence from a Natural Experiment on SMEs
- Re-investigating the Impact of Economic Growth, Energy Consumption, Financial Development, Institutional Quality, and Globalization on Environmental Degradation in OECD Countries
- A Compliance Return Method to Evaluate Different Approaches to Implementing Regulations: The Example of Food Hygiene Standards
- Panel Technical Efficiency of Korean Companies in the Energy Sector based on Digital Capabilities
- Time-varying Investment Dynamics in the USA
- Preferences, Institutions, and Policy Makers: The Case of the New Institutionalization of Science, Technology, and Innovation Governance in Colombia
- The Impact of Geographic Factors on Credit Risk: A Study of Chinese Commercial Banks
- The Heterogeneous Effect and Transmission Paths of Air Pollution on Housing Prices: Evidence from 30 Large- and Medium-Sized Cities in China
- Analysis of Demographic Variables Affecting Digital Citizenship in Turkey
- Green Finance, Environmental Regulations, and Green Technologies in China: Implications for Achieving Green Economic Recovery
- Coupled and Coordinated Development of Economic Growth and Green Sustainability in a Manufacturing Enterprise under the Context of Dual Carbon Goals: Carbon Peaking and Carbon Neutrality
- Revealing the New Nexus in Urban Unemployment Dynamics: The Relationship between Institutional Variables and Long-Term Unemployment in Colombia
- The Roles of the Terms of Trade and the Real Exchange Rate in the Current Account Balance
- Cleaner Production: Analysis of the Role and Path of Green Finance in Controlling Agricultural Nonpoint Source Pollution
- The Research on the Impact of Regional Trade Network Relationships on Value Chain Resilience in China’s Service Industry
- Social Support and Suicidal Ideation among Children of Cross-Border Married Couples
- Asymmetrical Monetary Relations and Involuntary Unemployment in a General Equilibrium Model
- Job Crafting among Airport Security: The Role of Organizational Support, Work Engagement and Social Courage
- Does the Adjustment of Industrial Structure Restrain the Income Gap between Urban and Rural Areas
- Optimizing Emergency Logistics Centre Locations: A Multi-Objective Robust Model
- Geopolitical Risks and Stock Market Volatility in the SAARC Region
- Trade Globalization, Overseas Investment, and Tax Revenue Growth in Sub-Saharan Africa
- Can Government Expenditure Improve the Efficiency of Institutional Elderly-Care Service? – Take Wuhan as an Example
- Media Tone and Earnings Management before the Earnings Announcement: Evidence from China
- Review Articles
- Economic Growth in the Age of Ubiquitous Threats: How Global Risks are Reshaping Growth Theory
- Efficiency Measurement in Healthcare: The Foundations, Variables, and Models – A Narrative Literature Review
- Rethinking the Theoretical Foundation of Economics I: The Multilevel Paradigm
- Financial Literacy as Part of Empowerment Education for Later Life: A Spectrum of Perspectives, Challenges and Implications for Individuals, Educators and Policymakers in the Modern Digital Economy
- Special Issue: Economic Implications of Management and Entrepreneurship - Part II
- Ethnic Entrepreneurship: A Qualitative Study on Entrepreneurial Tendency of Meskhetian Turks Living in the USA in the Context of the Interactive Model
- Bridging Brand Parity with Insights Regarding Consumer Behavior
- The Effect of Green Human Resources Management Practices on Corporate Sustainability from the Perspective of Employees
- Special Issue: Shapes of Performance Evaluation in Economics and Management Decision - Part II
- High-Quality Development of Sports Competition Performance Industry in Chengdu-Chongqing Region Based on Performance Evaluation Theory
- Analysis of Multi-Factor Dynamic Coupling and Government Intervention Level for Urbanization in China: Evidence from the Yangtze River Economic Belt
- The Impact of Environmental Regulation on Technological Innovation of Enterprises: Based on Empirical Evidences of the Implementation of Pollution Charges in China
- Environmental Social Responsibility, Local Environmental Protection Strategy, and Corporate Financial Performance – Empirical Evidence from Heavy Pollution Industry
- The Relationship Between Stock Performance and Money Supply Based on VAR Model in the Context of E-commerce
- A Novel Approach for the Assessment of Logistics Performance Index of EU Countries
- The Decision Behaviour Evaluation of Interrelationships among Personality, Transformational Leadership, Leadership Self-Efficacy, and Commitment for E-Commerce Administrative Managers
- Role of Cultural Factors on Entrepreneurship Across the Diverse Economic Stages: Insights from GEM and GLOBE Data
- Performance Evaluation of Economic Relocation Effect for Environmental Non-Governmental Organizations: Evidence from China
- Functional Analysis of English Carriers and Related Resources of Cultural Communication in Internet Media
- The Influences of Multi-Level Environmental Regulations on Firm Performance in China
- Exploring the Ethnic Cultural Integration Path of Immigrant Communities Based on Ethnic Inter-Embedding
- Analysis of a New Model of Economic Growth in Renewable Energy for Green Computing
- An Empirical Examination of Aging’s Ramifications on Large-scale Agriculture: China’s Perspective
- The Impact of Firm Digital Transformation on Environmental, Social, and Governance Performance: Evidence from China
- Accounting Comparability and Labor Productivity: Evidence from China’s A-Share Listed Firms
- An Empirical Study on the Impact of Tariff Reduction on China’s Textile Industry under the Background of RCEP
- Top Executives’ Overseas Background on Corporate Green Innovation Output: The Mediating Role of Risk Preference
- Neutrosophic Inventory Management: A Cost-Effective Approach
- Mechanism Analysis and Response of Digital Financial Inclusion to Labor Economy based on ANN and Contribution Analysis
- Asset Pricing and Portfolio Investment Management Using Machine Learning: Research Trend Analysis Using Scientometrics
- User-centric Smart City Services for People with Disabilities and the Elderly: A UN SDG Framework Approach
- Research on the Problems and Institutional Optimization Strategies of Rural Collective Economic Organization Governance
- The Impact of the Global Minimum Tax Reform on China and Its Countermeasures
- Sustainable Development of Low-Carbon Supply Chain Economy based on the Internet of Things and Environmental Responsibility
- Measurement of Higher Education Competitiveness Level and Regional Disparities in China from the Perspective of Sustainable Development
- Payment Clearing and Regional Economy Development Based on Panel Data of Sichuan Province
- Coordinated Regional Economic Development: A Study of the Relationship Between Regional Policies and Business Performance
- A Novel Perspective on Prioritizing Investment Projects under Future Uncertainty: Integrating Robustness Analysis with the Net Present Value Model
- Research on Measurement of Manufacturing Industry Chain Resilience Based on Index Contribution Model Driven by Digital Economy
- Special Issue: AEEFI 2023
- Portfolio Allocation, Risk Aversion, and Digital Literacy Among the European Elderly
- Exploring the Heterogeneous Impact of Trade Agreements on Trade: Depth Matters
- Import, Productivity, and Export Performances
- Government Expenditure, Education, and Productivity in the European Union: Effects on Economic Growth
- Replication Study
- Carbon Taxes and CO2 Emissions: A Replication of Andersson (American Economic Journal: Economic Policy, 2019)