Evaluation of AUTION EYE AI-4510 flow cell morphology analyzer for counting particles in urine
-
Matthijs Oyaert

 ,
Timo Kouri
,
Eva Carton
,
Timo Kouri
,
Eva Carton

Abstract
Objectives
We evaluated the performance of a novel flow cell morphology analyzer AUTION EYE AI-4510 for counting particles in urine.
Methods
Analytical performance was assessed according to the EFLM European Urinalysis Guideline 2023. Trueness was compared by analyzing 1.012 fresh urine samples with the AUTION EYE AI-4510 (ARKRAY, Inc., Kyoto, Japan) against phase-contrast visual microscopy. Poisson statistics were utilized in assessment of imprecision of particle counts both with quality control material and patient specimens.
Results
Relative imprecision against theoretical Poisson imprecision, R(CV), was estimated to be 1.1 for red blood cells (RBC), 1.0 for white blood cells (WBC), 0.9 for squamous epithelial cells (SEC) and 1.1 for bacteria. The agreement with visual microscopy (Cohen’s weighted kappa) was 0.93 for RBC, 0.95 for WBC, 0.90 for SEC, 0.79 for non-squamous epithelial cells (NSEC), 0.67 for combined casts, 0.90 for crystals and 0.88 for bacteria. No clinically significant bias was observed. Limits of quantitation at CV=30 % reached 4 × 10⁶/L for RBC and 5 × 10⁶/L for WBC. Differentiation of urinary crystals was improved as compared to previous data on digital cuvette imaging.
Conclusions
The ARKRAY AUTION EYE AI-4510 provided a desirable imprecision, met the criteria for linearity, LoQ and carry-over, and showed an optimum comparison to visual microscopy for RBC, WBC, SEC and crystals as defined in the EFLM European Urinalysis Guideline 2023. The identification of kidney damage is recommended to be improved by using user-defined review rules. Performance of bacteria counting needs to be confirmed against urine bacterial cultures.
Introduction
Urinalysis is essential for the diagnosis or treatment of diseases in the kidneys and in the urinary tract. Automation has significantly reduced human workload and improved accuracy of the results obtained [1], [2], [3], [4]. An accurate count of particles in urine allows efficient differentiation of patients with abnormalities in urine particles from those with health-related concentrations. In patients with symptomatic acute infections, accurate WBC or bacteria counts may either confirm or exclude an infection in the urinary tract. In patients suspected of chronic hematuria, persistence of RBC excretion is confirmed faster with accurate examinations. In kidney diseases, low concentrations of urine particles (casts and renal tubular epithelial cells, RTEC) tend to be missed with inaccurate counts. Urine particles add in the detection of kidney diseases after sensitive proteinuria markers, because they alert kidney damage more specifically than proteinuria [5].
Recently, ARKRAY launched a novel urine particle analyzer, the AUTION EYE AI-4510 (ARKRAY Inc., Kyoto, Japan) that employs digital imaging of uncentrifuged urine specimens in a laminar flow. Urine particle identification and counting are obtained with complementary metal oxide semiconductor (CMOS) cameras and specific software. In contrast to its predecessors [6], [7], [8], [9], images of urine particles are captured by three cameras and identified by an algorithm based on neural network technology.
We investigated the performance of the AUTION EYE AI-4510 particle analyzer in detection and classification of urinary particles as compared with reference visual microscopy using phase-contrast optics, as suggested in the recently published EFLM European Urinalysis Guideline 2023 [10].
Materials and methods
Urine specimens
One-thousand and twelve mid-stream urine specimens were selected from the specimens sent to the Clinical Laboratory of the Ghent University Hospital between February and May 2024. The specimens were collected in sterile containers (Container with screw cap™, Sarstedt AG&Co, Nümbrecht, Germany), aspirated in Monovette™ collection tubes without preservatives (Sarstedt AG&Co), and analyzed within 4 h after arrival in the laboratory. After routine analysis, each sample was counted by visual microscopy (see below) and then analyzed by using first the AUTION MAX AX-4060 automated urine test strip analyzer (ARKRAY) and AUTION EYE AI-4510 (ARKRAY).
Exclusion criteria were slimy or viscous specimens, insufficient volume of urine and a delay exceeding 1 h from visual microscopy to AUTION EYE AI-4510 analysis. Our study was performed by protecting privacy of patients throughout. The study was approved by the Ethical Committee of the Ghent University Hospital (ONZ-2024-0098).
Automated particle analysis with the AUTION EYE AI-4510
The automated ARKRAY Urinalysis system (ARKRAY, Inc., Kyoto, Japan) is composed of an AUTION EYE AI-4510 automated Urine particle analyzer (AUTION EYE AI-4510, software version 01.20), connected physically and electronically to the AUTION MAX AX-4060 automated Urine Chemistry analyzer. The sample volume required for urine particle analysis is 2 mL both in manual (STAT) and automated (sampler) presentation. After automated mixing of the specimen, 900 µL of urine is aspirated by the instrument. The final counting volume is approximately 3 µL. Both quality control suspensions and patient specimens were analyzed by using the sampler of the AI-4510 instrument.
The AUTION EYE AI-4510 utilizes laminar flow technology combined with digital bright-field images. The three CMOS digital cameras capture images at different focus depths. The size, shape, contrast, and texture features are analyzed by auto-particle recognition (APR), which uses neural network technology. After instrumental autoclassification, a trained operator may visually confirm or reclassify particles on the screen. The AUTION EYE AI-4510 categorizes urine particles into one of 12 categories: red blood cells (RBC), suggestions for dysmorphic RBC, white blood cells (WBC), WBC clumps, squamous epithelial cells (SEC), non-squamous epithelial cells (NSEC), hyalin and non-hyalin casts, bacteria, crystals, yeasts, mucus and spermatozoa. The category NSEC is used as a screening category for RTEC, not easily separated from transitional epithelial cells (TEC) from the lower urinary tract. In this study, dysmorphic RBC, WBC clumps, yeast, mucus and sperms were not quantitated. Particle counts reported by the analyzer were not reclassified by the operator.
The middleware of the ARKRAY Urinalysis system integrates results from multiple test strips and particle counting. The middleware includes an autoverification system for flagging samples for visual review based on individual particle concentrations, and on cross-checking against test strip results. Primary settings designed by the manufacturer can be modified by the end-user based on national practice or local decisions. Local configuration of these flags was not investigated in this study.
Visual microscopy
Urine particle results obtained by the AUTION EYE AI-4510 were compared against counts obtained by visual phase contrast microscopy at the reference Level 3 [10], performed blindly by one of the two experienced technicians in the laboratory. The uniformity of classification between the evaluators was considered to result from repeated inter-personnel comparisons in the internal quality control program at the laboratory. An adapted International Society of Laboratory Hematology (ISLH) reference method was employed [11], counting 1 µL of uncentrifuged, unstained sample of a mixed specimen in a disposable Bürker counting chamber (Uriglass™ counting chambers, A. Menarini, Florence, Italy). The reference procedure was modified by allowing the technologist to stop counting at 200 particles for RBC and WBC, or at 50 for SEC, NSEC, casts and crystals, or when the 1 µL chamber was counted completely even if the recommended maximum count was not reached [11]. Phase-contrast optics allowed correct identification of NSEC, non-hyalin casts and crystals without any staining.
A phase-contrast microscope (Leica DM 2000 LED Microscope, Leica, Wetzlar, Germany) was used with a 400× magnification. The following particles were quantitated by visual microscopy: RBC, WBC, SEC, NSEC, hyalin, and non-hyalin casts and crystals. Bacteria count of patient specimens was classified by visual microscopy using the following ordinal scale categories: negative, ±, +, ++, and +++. No parallel urine cultures were available for this study. Mucus and WBC clumps were also recorded on an ordinal scale to be used for evaluation of obtained counts.
Performance evaluation
Precision
Precision of the AUTION EYE AI-4510 was measured with two commercial quality control (QC) solutions: the manufacturer provided two levels (Low and High) of the AUTION EYE Control suspensions, lot# 3C12 (ARKRAY), with resin beads mimicking urine particles. These were measured once over 26 days during the evaluation (1 × 1 × 26 protocol). In addition, Bio-Rad control Liquichek™ Urinalysis Control Level 2, lot# 98002 (Bio-Rad Laboratories, CA, USA) with stabilized RBC, WBC, crystals, and bacteria, was used to determine imprecision of these defined particles, although concentrations of RBC and crystals in the Bio-Rad controls were not all at the diagnostic low-positive concentration range, following the CLSI EP15-A3 protocol [12], with five measurements in a single run during five non-consecutive days (5 × 1 × 5 protocol).
The precision was further estimated by duplicate counts of 33 patient samples, applying Dahlberg’s procedure to estimate imprecision for RBC, WBC, SEC and bacteria [10], 13]. The samples covered the clinical range of counts for each particle.
Linearity, limit of quantitation and carry-over
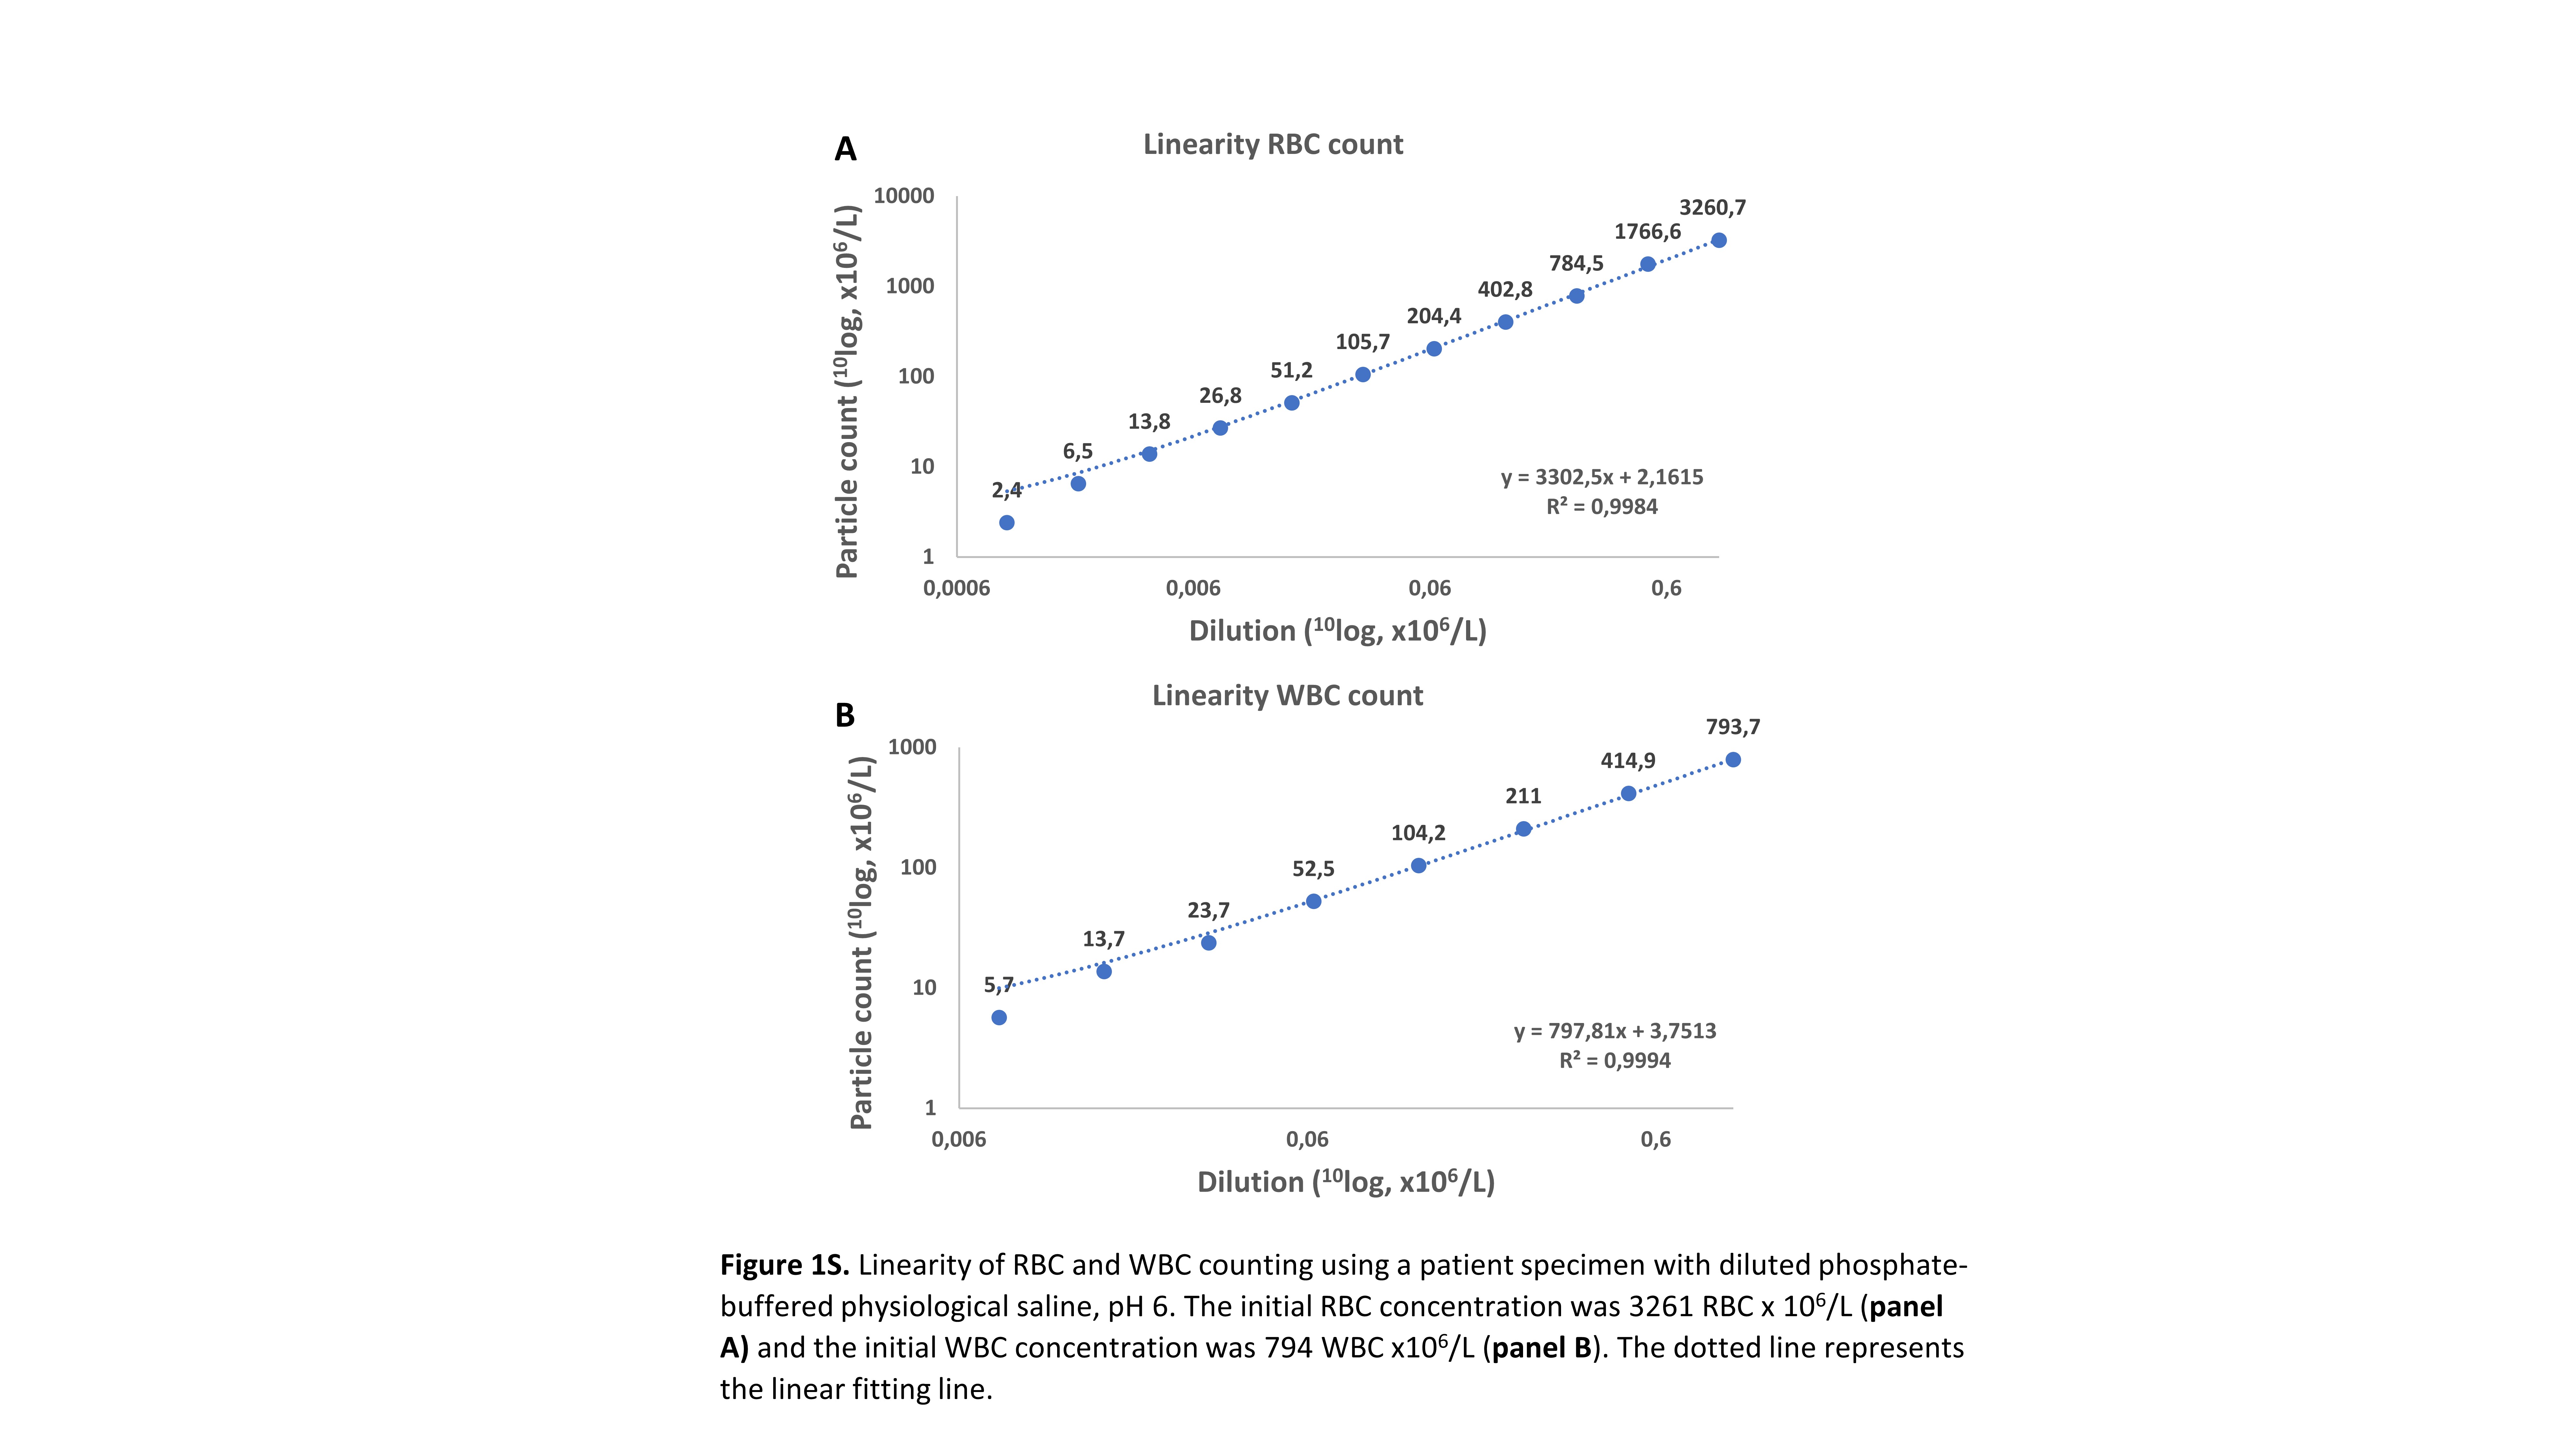
Linearity was measured with the two most quantitative particles, RBC and WBC, diluting a sample containing a high RBC count (3.261 RBC × 106/L) and another with a high WBC count (794 WBC × 106/L) with phosphate-buffered saline (pH=6). Each dilution was determined in triplicate, and the mean value was considered the correct result [14].
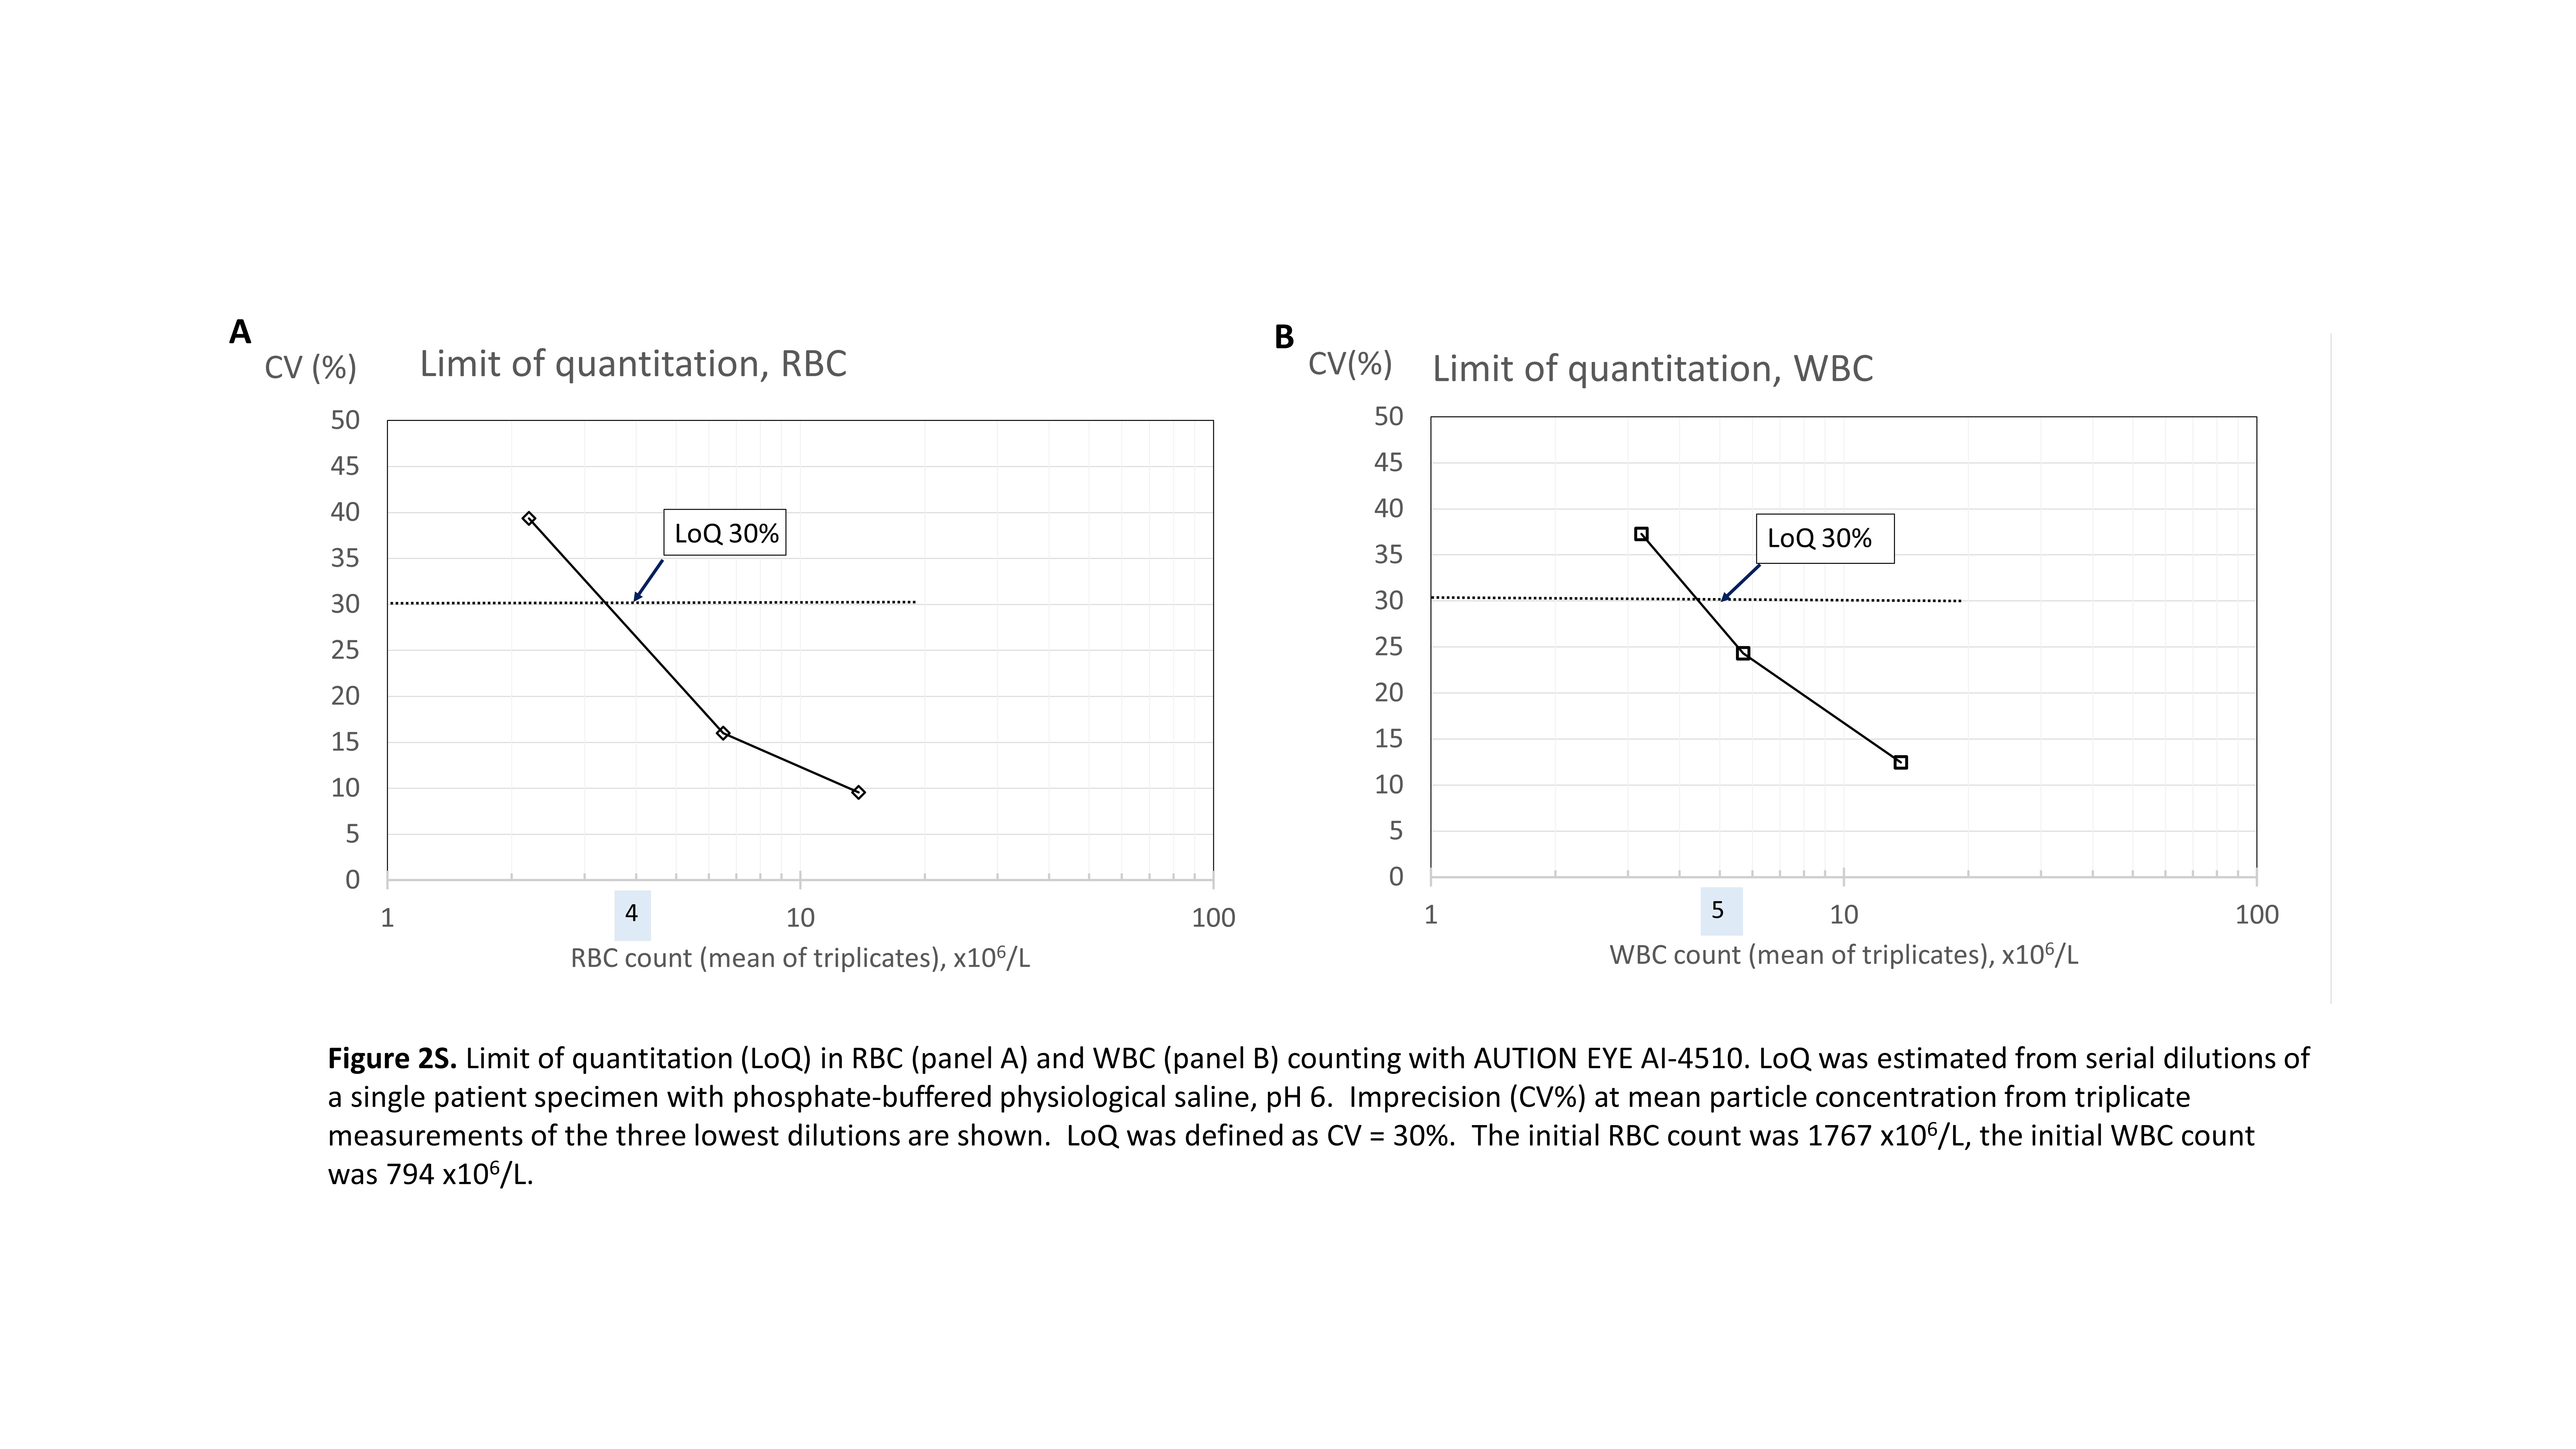
The limit of quantitation, LoQ, was determined using a predefined CV specification of 30 % [10]. Three different concentration levels, with theoretical RBC concentrations of 2.2, 6.5 and 13.8 × 10⁶/L and WBC concentrations of 3.2, 5.7 and 13.7 × 10⁶/L, were prepared by serial dilution of one patient sample for each with phosphate-buffered saline. Each dilution was measured in triplicate. Carry-over was assessed by measuring a sample with a high RBC, WBC or bacteria count three times (designated as A1, A2 and A3), using specimens at 2.447 × 10⁶/L, 3.798 × 10⁶/L and 10.279 × 10⁶/L, respectively. Subsequently, a triplicate measurement of an almost blank sample was conducted (designated as B1, B2 and B3). The carry-over (%) was calculated using the following formula: ((B1–B3)/(A3–A1)) × 100 % [14].
Data analysis
Statistical analysis was performed using MedCalc software (version 15.6.1., Mariakerke, Belgium).
Because of the concentration-dependent dispersion of low counts, imprecision of particle counts was calculated as relative imprecision, R(CV), i.e., as an imprecision ratio of observed CV against the theoretical CV of the mean count derived from Poisson statistics [10], 15]. A desirable specification of R(CV) ≤2 was applied [10].
Accuracy of RBC, WBC and SEC counts against visual microscopy was estimated from Passing–Bablok regressions and non-parametric Spearman’s correlation coefficients. The obtained counts were logarithmically transformed for regression analysis [10]. Also, Bland–Altman plots were drawn to estimate uncertainty between the instrumental and visual measurement procedures. To assess diagnostic agreement of counts, results from RBC, WBC, SEC, NSEC, combined casts, crystals and bacteria were organized into ordinal scale cross-tables and assessed by weighted Cohen’s kappa coefficient.
The results were evaluated using the analytical performance specifications suggested in the EFLM European urinalysis guideline 2023 [10].
Results
Precision as relative imprecision R(CV)
Imprecisions with the AUTION EYE Low and High Particle Controls were within the desirable limit, R(CV) 0.5 and 1.4, respectively. A desirable relative coefficient of variation, R(CV) <2 was obtained for fixed WBC, RBC, and crystals, and a R(CV)=2 was noted for bacteria (Supplemental Table 1S). R(CV) estimates below one are explained by the counting volume of 3 µL in AUTION EYE AI-4510.
The imprecision ratios R(CV) were also estimated with native patient specimens exhibiting variable degeneration (RBC and WBC), and adhesion (WBC, epithelial cells) in often non-uniform matrix of patients’ urine. For RBC counts, 84.8 % of the patient specimens (28/33) fulfilled the desirable requirement of R(CV) ≤2, with an average R(CV) of 1.1 (Figure 1). Increased R(CV) >2 was associated with abundant mucus (n=3), with crowded urinary sample, or with RBC concentration above the measuring range (Figure 1A). For WBC counts, 3/33 samples exceeded the desirable R(CV) ≤2 with an average R(CV)=1.0, related to mucus interference or presence of WBC clumps (n=2) (Figure 1B). For SEC, a desirable R(CV) was R(CV)=0.9, with one exception in a crowded sample (Figure 1C). Finally, 8/33 samples had an increased R(CV) in their bacteria counts, related to crowded specimen (n=5), mucus interference (n=2), or excessive bacteria concentration (n=1) (Figure 1D).
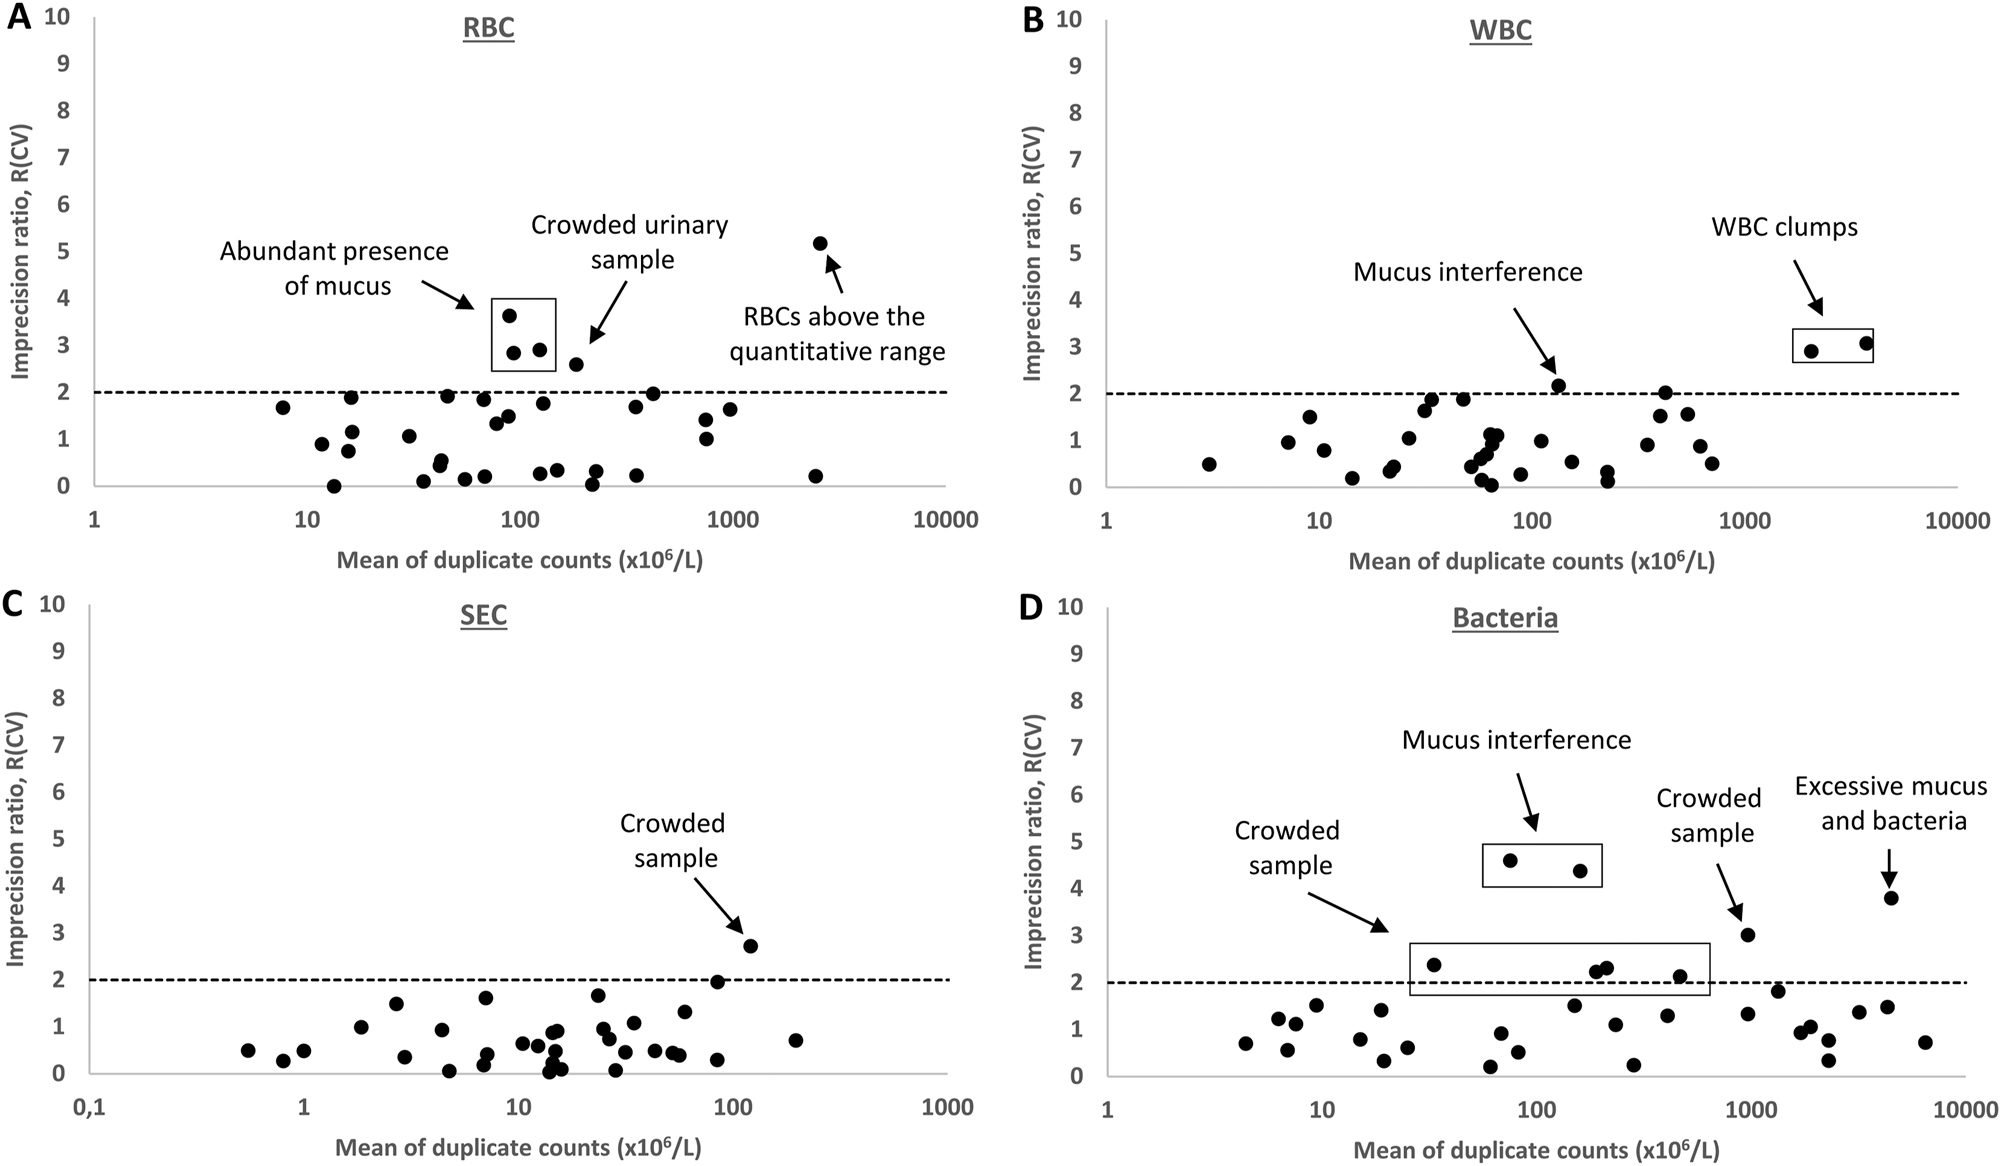
Repeatability of RBC, WBC, SEC and bacteria counts from duplicate measurements of 33 patient samples, expressed as imprecision ratios R(CV)=observed CV/theoretical Poisson CV. The limit of desirable performance R(CV)=2 is marked with a dashed line. The causes for deviating cases are explained. RBC, red blood cells; WBC, white blood cells; SEC, squamous epithelial cells; BACT, bacteria.
Linearity, limit of quantitation and carry-over
Linearity went down to 7 RBC × 106/L and 6 WBC × 106/L, respectively (Supplemental Figure 1S). The estimates of LoQ were 4 × 10⁶/L for RBC and 5 × 10⁶/L for WBC (Supplementary Figure 2S). The carry-over was negligible with 0.12 % for RBC, 0.01 % for WBC and 0.08 % for bacteria counts.
Accuracy of counting and diagnostic classification against phase contrast microscopy
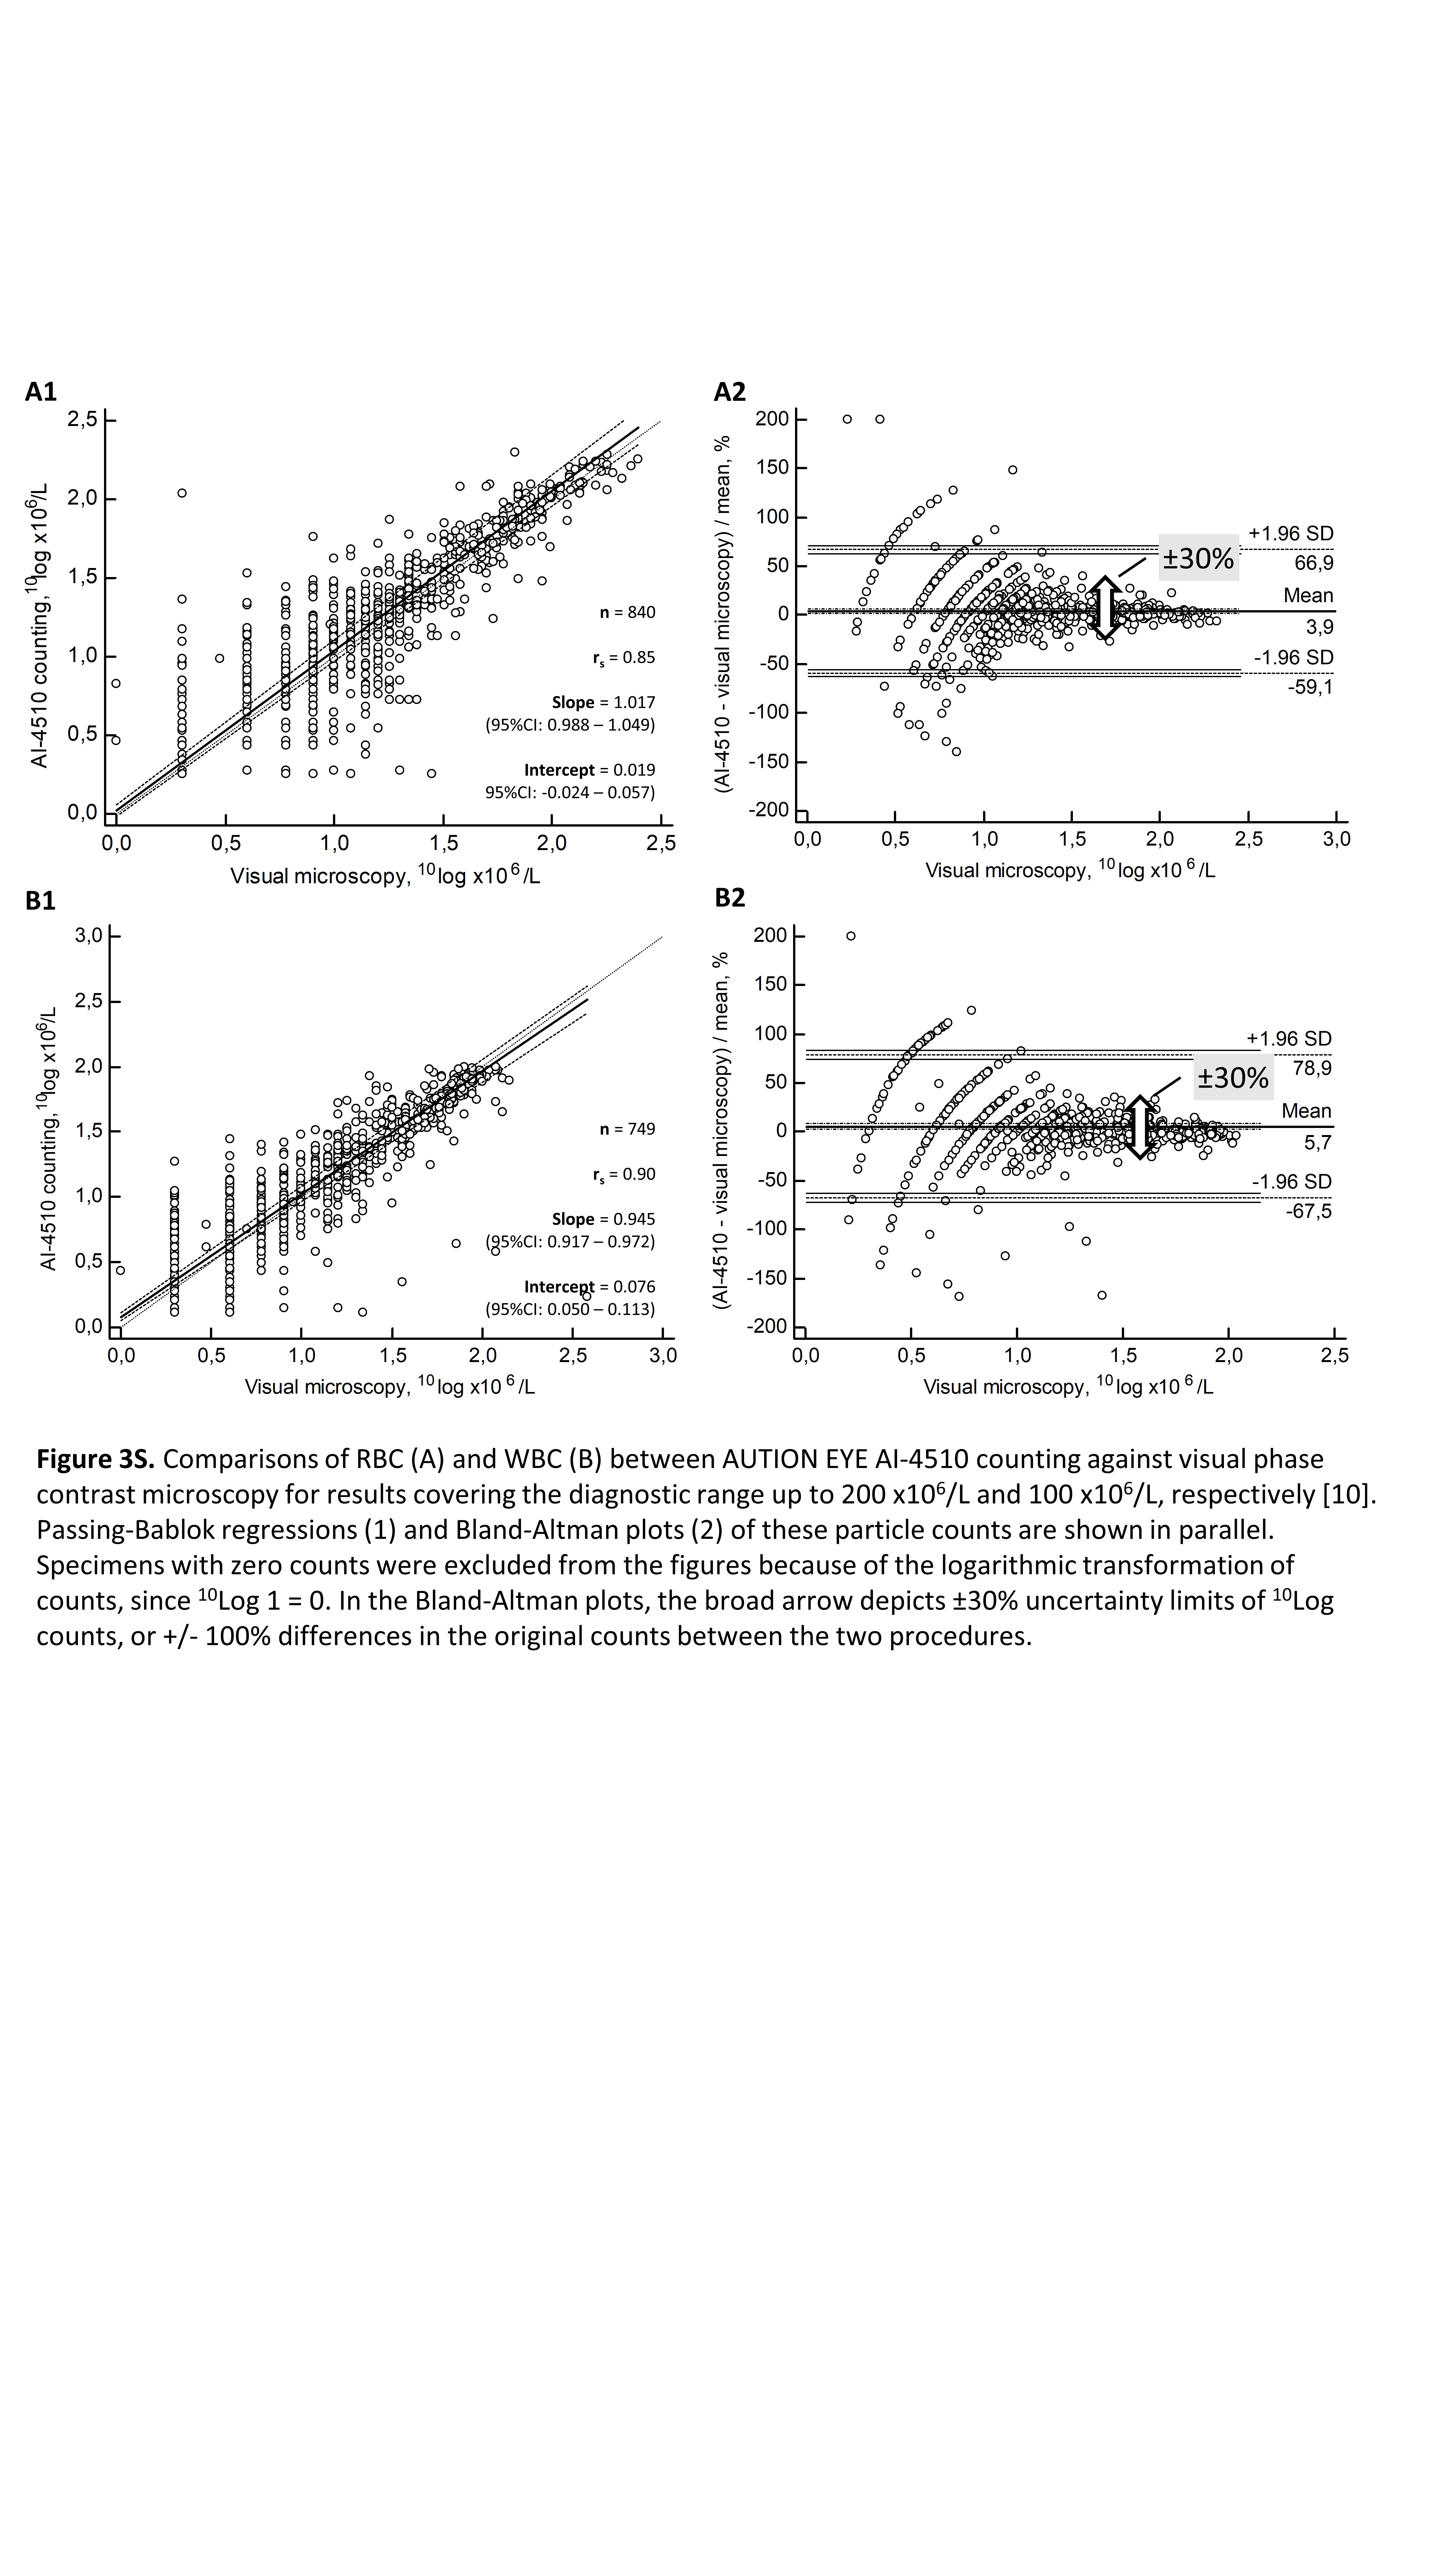
Passing–Bablok regressions of the comparisons for RBC, WBC and SEC counts are shown in Figure 2 (A1, and C1, respectively). Spearman’s correlation against visual microscopy was r S =0.89 (95 % confidence interval, CI: 0.88–0.91) for RBC counts, r S =0.93 (95 % CI: 0.92–0.95) for WBC counts, and r S =0.90 (95 % CI: 0.88–0.91) for SEC counts. The diagnostic range of 1–200 RBC × 106/L [10] was calculated separately, obtaining a comparable Spearman’s correlation against visual microscopy with r S =0.85 (95 % CI: 0.83–0.86) (Supplementary Figure 3S, A1). Similarly, a diagnostic range of 1–100 WBC × 106/L provided Spearman’s correlation coefficient of r S =0.92 (95 % CI: 0.91–0.93) corresponding to that of the full range of WBC concentrations (Supplementary Figure 3S, B1).
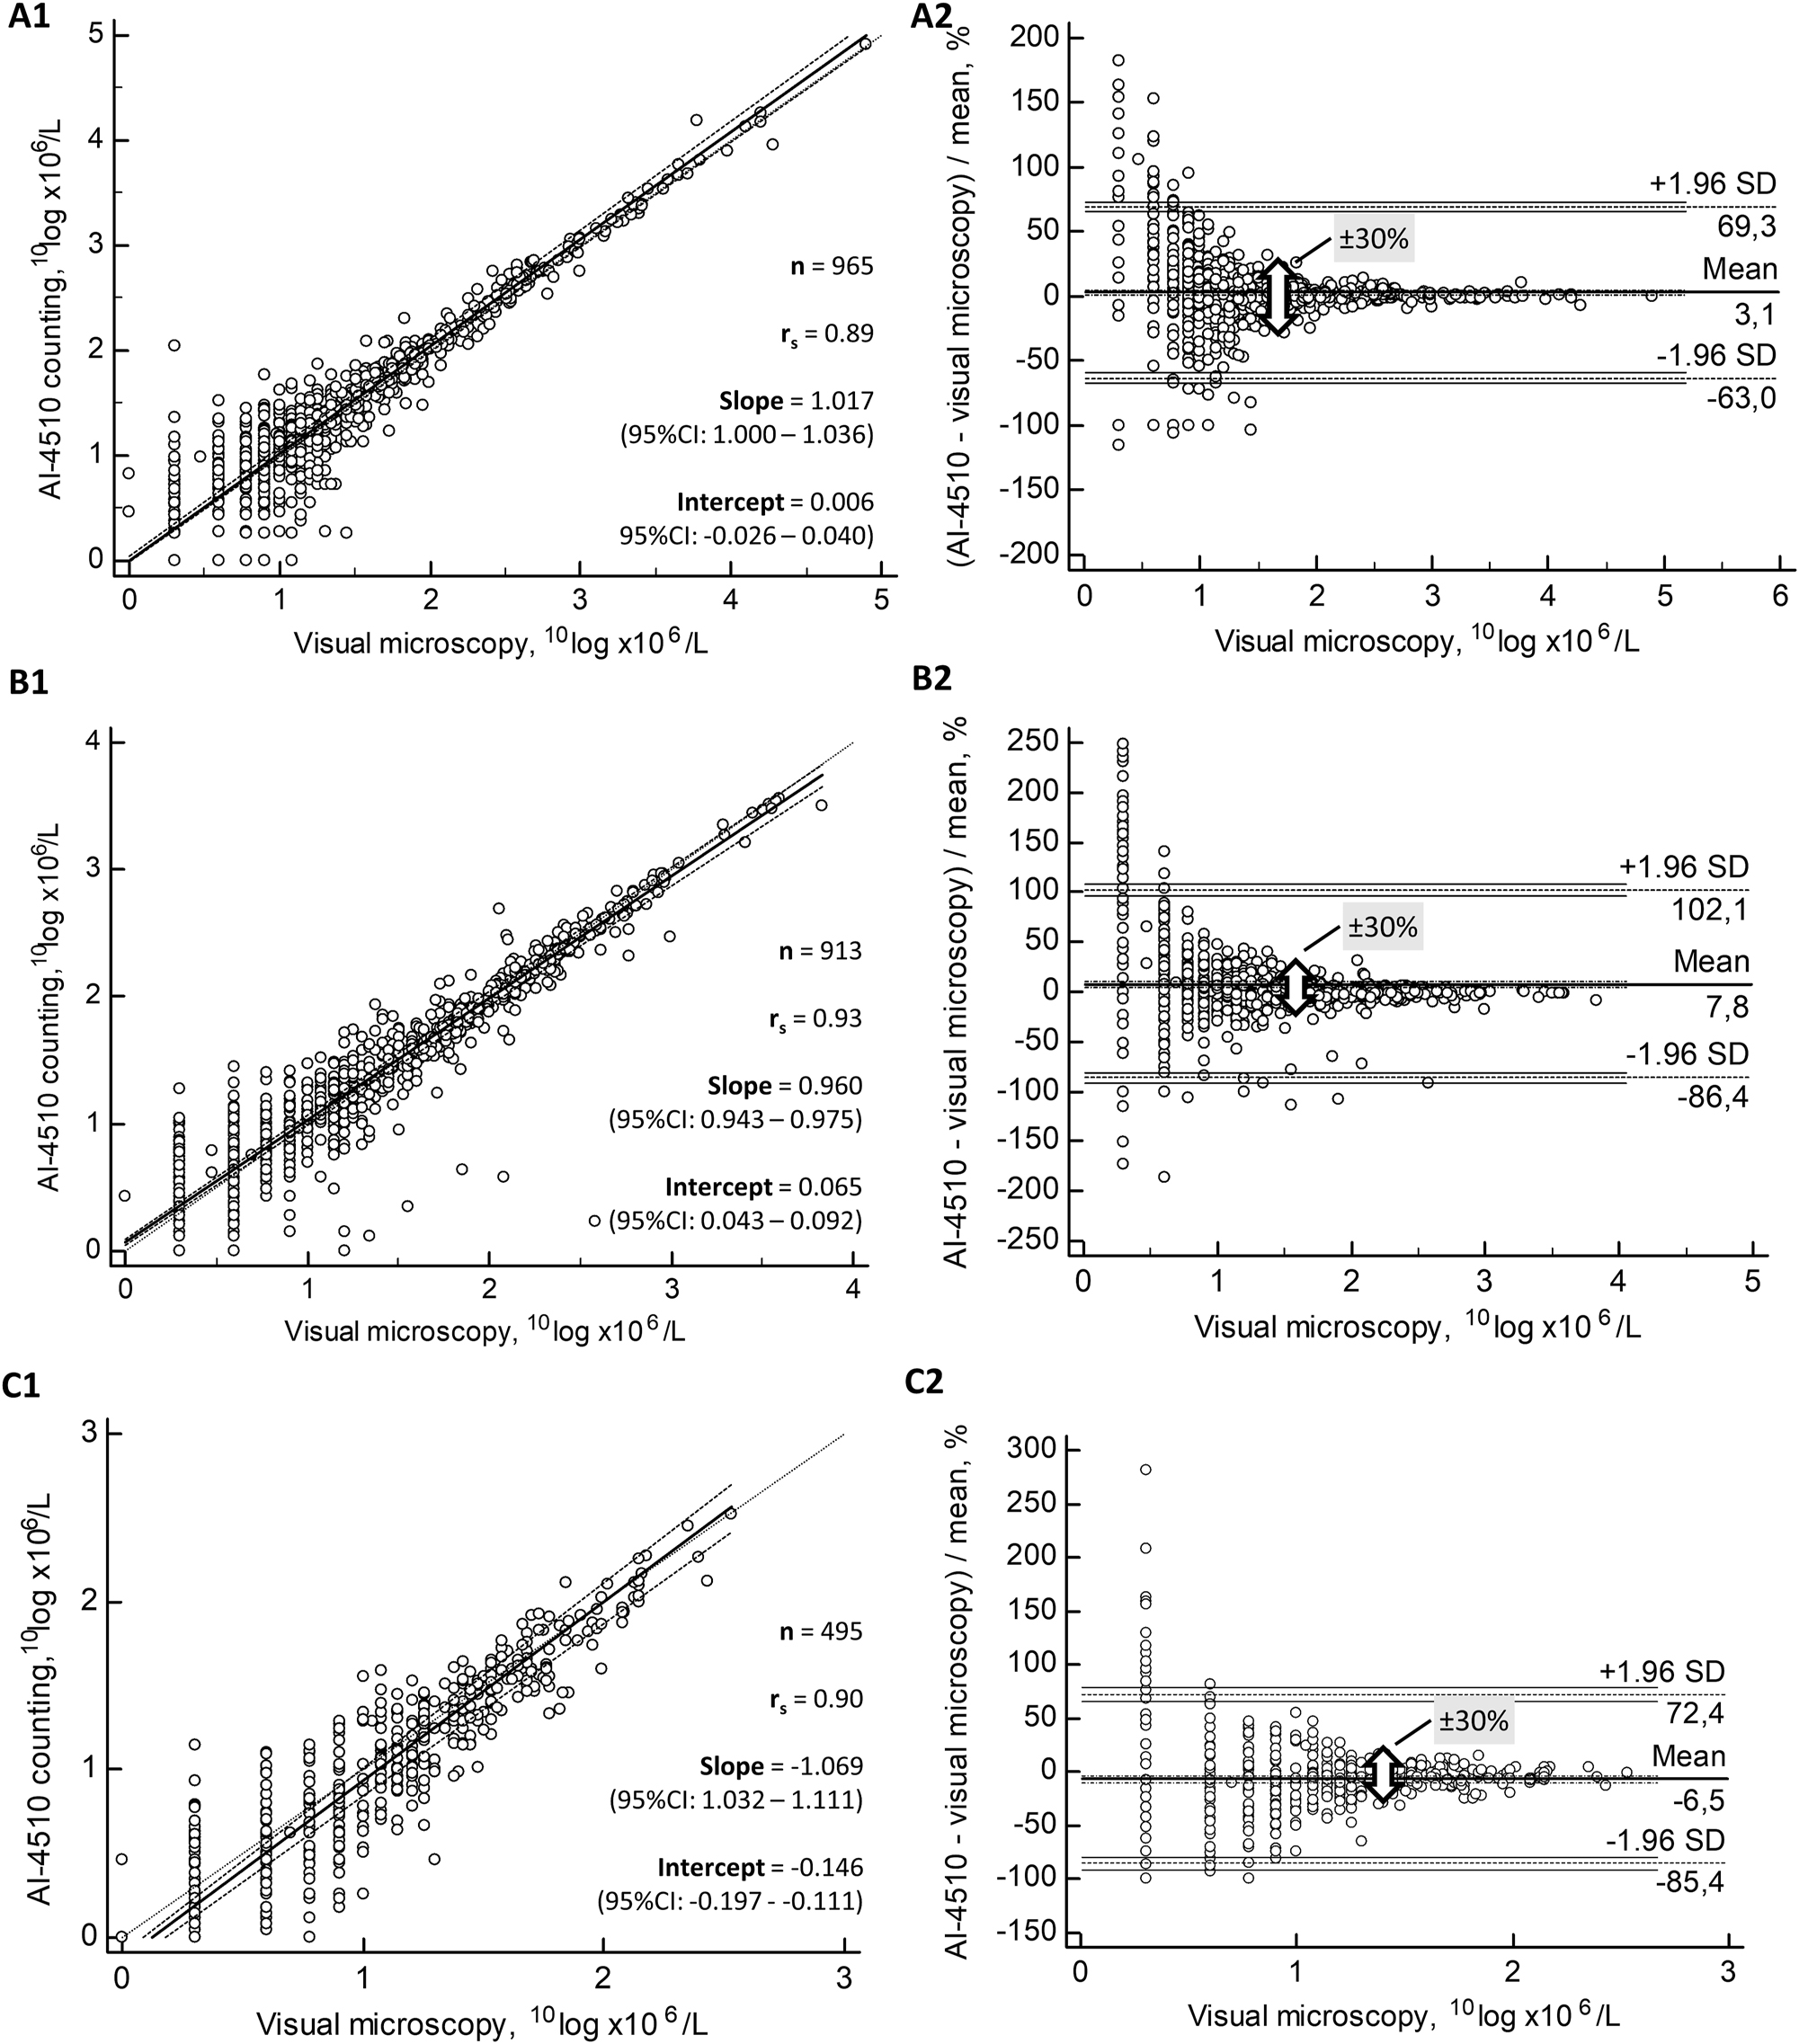
Comparisons of RBC (A), WBC (B) and SEC counts (C) between AUTION EYE AI-4510 counting against visual reference phase contrast microscopy. Passing–Bablok regressions (1) and Bland–Altman plots (2) of these particle counts are shown in parallel. Specimens with zero counts were excluded from the figures because of the logarithmic transformation of counts, since 10Log 1=0. In the Bland–Altman plots (2), the broad arrow depicts ±30 % uncertainty limits of 10Log counts, or ±100 % differences in the original counts between the two procedures.
The accuracy of particle counts with the AUTION EYE AI-4510 was estimated by Bland–Altman plots as compared to visual microscopy. The mean bias of RBC counts was 3.1 % against visual microscopy (Figure 2). A similar bias of 3.9 % was seen within the 1–200 RBC × 106/L (Supplementary Figure 3S, A2). The maximum allowable analytical uncertainty between the two counts of urine particles was chosen to be ±100 % difference between the results [15]. This range arbitrarily corresponds to ±2 standard uncertainties (u) of a modelled Gaussian distribution. After logarithmic transformation, a difference of ±30 % (±0.30) in 10Log counts corresponds to the ±100 % difference in the actual counts, since 10Log 2=0.30=30 %. The maximum uncertainty between the two methods was reduced to the limit of ±30 % at 1.8 10Log RBC × 106/L, corresponding to ±100 % at 63 RBC × 106/L (Figure 2).
In counting WBC with the AUTION EYE AI-4510, a mean bias of 7.8 % was noted as compared to visual microscopy. A similar positive bias of 5.7 % was also seen within 1–100 WBC × 106/L range (Supplementary Figure 3S, B2). The uncertainty of WBC counts within ±30 % was reached at 1.5 10Log WBC × 106/L, corresponding to 31 WBC × 106/L (Figure 2). A mean bias of −6.5 % with a maximum uncertainty of ±30 % was reached for SEC at 1.3 10Log SEC × 106/L, corresponding to 20 SEC × 106/L (Figure 2, C2). Comparisons for RBC, WBC and SEC counts (Supplementary Tables 2S, 3S and 4S, respectively) were also organized into ordinal scale categories to calculate diagnostic accuracy obtained for these particles.
Due to the lower concentrations in urine, other particles (NSEC, casts and crystals) were evaluated by ordinal scale comparisons only. Seventy-six out of 1.012 specimens (7.5 %) were positive for NSEC at a cut-off of >10 × 106/L. By decreasing the cut-off of positivity to >3 × 10⁶/L, the sensitivity increased to 84.6 % in 267 (26.4 %) NSEC-positive specimens, but the specificity was reduced to 89.3 % because of low particle counts (Table 1). The occurrence of positive specimens for casts at concentrations >10 × 106/L was 2 % (20/1.012). Therefore, counts of hyaline and non-hyaline casts were combined. The low frequency of positive cases also affected the weighted kappa coefficient of 0.67 obtained for casts (Table 2).
Agreement of non-squamous epithelial cell (NSEC) counts by AUTION EYE AI-4510 against visual microscopy.
| Visual | AUTION EYE AI-4510 | ||||
|---|---|---|---|---|---|
| Categories (particles × 106/L) | |||||
| Categories (particles × 106/L) | 0–3 | 4–10 | 11–30 | ≥30 | Total |
| 0–3 | 665 | 76 | 4 | 0 | 745 |
| 4–10 | 38 | 138 | 13 | 2 | 191 |
| 11–30 | 2 | 10 | 50 | 2 | 64 |
| ≥30 | 1 | 1 | 0 | 10 | 12 |
| Total | 706 | 225 | 67 | 14 | 1.012 |
| Agreement at diagonal | 85.3 % | ||||
| Agreement, diagonal ±1 category | 99.0 % | ||||
| Cohen’s kappa (weighted) | 0.79 | ||||
| Accuracy of diagnostic classification | |||||
| Limit of positivity, × 10 6 /L | 3 | 10 | |||
| Sensitivity (95 % CI) | 84.6 % (95 % CI: 79.8–88.8 %) | 81.6 % (95 % CI: 71.0–89.6 %) | |||
| Specificity (95 % CI) | 89.3 % (95 % CI: 86.8–91.4 %) | 98.0 % (95 % CI: 96.9–98.8 %) | |||
-
Statistical uncertainty zone (4–30 × 106/L) is marked with bold face.
Agreement of cast counts (including hyaline and pathological casts) by AUTION EYE AI-4510 against visual microscopy.
| Visual | AUTION EYE AI-4510 | ||||
|---|---|---|---|---|---|
| Categories (particles × 106/L) | |||||
| Categories (particles × 106/L) | 0–3 | 4–10 | 11–30 | ≥30 | Total |
| 0–3 | 879 | 22 | 5 | 0 | 906 |
| 4–10 | 53 | 28 | 5 | 0 | 86 |
| 11–30 | 0 | 6 | 6 | 2 | 14 |
| ≥30 | 0 | 0 | 4 | 2 | 6 |
| Total | 932 | 56 | 20 | 4 | 1.012 |
| Agreement at diagonal | 90.4 % | ||||
| Agreement, diagonal±1 category | 99.5 % | ||||
| Cohen’s kappa (weighted) | 0.67 | ||||
| Accuracy of diagnostic classification | |||||
| Limit of positivity, × 10 6 /L | 3 | 10 | |||
| Sensitivity (95 % CI) | 50.0 % (95 % CI: 40.1–59.9 %) | 70.0 % (95 % CI: 45.7–88.1 %) | |||
| Specificity (95 % CI) | 97.0 % (95 % CI: 95.7–98.0 %) | 99.0 % (95 % CI: 98.2–99.5 %) | |||
-
Statistical uncertainty zone (4–30 × 106/L) is marked with bold face.
Sixty-one patient specimens (6.0 %) contained a variety of urinary crystals at the limit of >3 × 10⁶/L for a positive result. The detailed types of crystals are shown in Supplementary Table 5S. A high agreement between AUTION EYE AI-4510 and visual microscopy was obtained, with a weighted kappa coefficient of 0.90 (Table 3). The sensitivity at >10 × 106/L was affected by two specimens with calcium oxalate (CaOx) monohydrate crystals classified as RBC. At the cut-off of >3 × 10⁶/L, six additional specimens were not detected by AUTION EYE AI-4510 as compared to visual microscopy, out of which two contained CaOx monohydrate, two CaOx dihydrate and two cholesterol crystals.
Agreement of crystal counts by AUTION EYE AI-4510 against visual microscopy.
| Visual | AUTION EYE AI-4510 | ||||
|---|---|---|---|---|---|
| Categories (particles × 106/L) | |||||
| Categories (particles × 106/L) | 0–3 | 4–10 | 11–30 | ≥30 | Total |
| 0–3 | 926 | 19 | 4 | 2 | 952 |
| 4–10 | 6 | 4 | 2 | 1 | 13 |
| 11–30 | 2 | 2 | 3 | 1 | 8 |
| ≥30 | 0 | 1 | 3 | 36 | 40 |
| Total | 935 | 26 | 12 | 40 | 1.012 |
| Agreement at diagonal | 95.7 % | ||||
| Agreement, diagonal±1 category | 98.9 % | ||||
| Cohen’s kappa (weighted) | 0.90 | ||||
| Accuracy of diagnostic classification | |||||
| Limit of positivity, × 10 6 /L | 3 | 10 | |||
| Sensitivity (95 % CI) | 86.9 % (95 % CI: 75.8–94.2 %) | 89.6 % (95 % CI: 77.3–96.5 %) | |||
| Specificity (95 % CI) | 97.4 % (95 % CI: 96.2–98.3 %) | 99.1 % (95 % CI: 98.2–99.6 %) | |||
-
Statistical uncertainty zone (4–30 × 106/L) is marked with bold face.
Bacteriuria was detected in 58 % (590/1.012) or 33 % (337/1.012) of the patient specimens by visual microscopy using the borderline “±” or first positive “+” results, respectively (Table 4). A remarkably high agreement between AUTION EYE AI-4510 and visual microscopy was obtained, resulting in a weighted kappa correlation coefficient of 0.88. With a cut-off at 10 × 106/L for a positive result by AUTION EYE AI-4510, a sensitivity of 98.3 % with a specificity of 62.6 % was obtained against the borderline “±” category in visual microscopy. A cut-off of >100 × 106/L by AUTION EYE AI-4510 increased the specificity to 95.0 %, reducing the sensitivity to 59.5 % (Table 4).
Agreement of bacteria counts by AUTION EYE AI-4510 against visual microscopy.
| Visual | AUTION EYE AI-4510 | |||||
|---|---|---|---|---|---|---|
| Categories (particles × 106/L) | ||||||
| Categories (ordinal scale) | 0–10 | 11–100 | 101–1.000 | 1.001–10.000 | >10.000 | Total |
| Negative | 264 | 137 | 21 | 0 | 0 | 422 |
| ± | 10 | 223 | 20 | 0 | 0 | 253 |
| + | 0 | 6 | 158 | 31 | 1 | 196 |
| ++ | 0 | 0 | 2 | 125 | 1 | 128 |
| +++ | 0 | 0 | 0 | 7 | 6 | 13 |
| Total | 274 | 366 | 201 | 163 | 8 | 1.012 |
| Agreement at diagonal | 76.8 % | |||||
| Agreement, diagonal±1 category | 97.8 % | |||||
| Cohen’s kappa (weighted) | 0.88 | |||||
| Accuracy of diagnostic classification | Limit of positivity, ordinal scale (visual microscopy) | |||||
| + (590 specimens) | + (337 specimens) | |||||
| Limit of positivity, 10 × 10 6 /L (AUTION EYE) | ||||||
| Sensitivity (95 % CI) | 98.3 % (95 % CI: 96.9–99.2 %) | 100 % (95 % CI: 98.9–100 %) | ||||
| Specificity (95 % CI) | 62.6 % (95 % CI: 57.8–67.2 %) | 40.6 % (95 % CI: 36.9–44.1 %) | ||||
| Limit of positivity, 100 × 10 6 /L (AUTION EYE) | ||||||
| Sensitivity (95 % CI) | 59.5 % (95 % CI: 55.4–63.5 %) | 98.2 % (95 % CI: 96.2–99.3 %) | ||||
| Specificity (95 % CI) | 95.0 % (95 % CI: 92.5–96.9 %) | 93.9 % (95 % CI: 91.9–95.6 %) | ||||
-
Diagnostic uncertainty zone of the visual “±” category is shown bold face.
Combined detection of all classified particles with the AUTION EYE AI-4510 against visual microscopy was compiled into Table 5.
Summary of the diagnostic performance of the AUTION EYE AI-4510 against visual microscopy using 1.012 clinical urine specimens.
| Particle | Limit of positivity, × 106/L | Number of positive cases | Sensitivity | Specificity | Agreement of classificationa |
|---|---|---|---|---|---|
| RBC | 10 | 588 | 90.7 % (95 % CI: 88.0–92.9 %) | 77.1 % (95 % CI: 72.8–81.0 %) | 0.93 |
| 30 | 311 | 95.2 % (95 % CI: 92.2–97.3 %) | 94.3 % (95 % CI: (92.3–95.9 %) | ||
| WBC | 10 | 518 | 93.8 % (95 % CI: 91.4–95.7 %) | 89.3 % (95 % CI: 86.2–91.9 %) | 0.95 |
| 30 | 329 | 93.3 % (95 % CI: 90.1–95.8 %) | 95.5 % (95 % CI: 93.6–96.9 %) | ||
| SEC | 3 | 436 | 80.5 % (95 % CI: 76.4–84.1 %) | 95.5 % (95 % CI: 93.5–97.0 %) | 0.90 |
| 10 | 251 | 83.3 % (95 % CI: 78.1–87.7 %) | 96.6 % (95 % CI: 95.0–97.8 %) | ||
| NSEC | 3 | 267 | 84.6 % (95 % CI: 79.8–88.8 %) | 89.3 % (95 % CI: 71.0–89.6 %) | 0.79 |
| 10 | 76 | 89.3 % (95 % CI: 86.8–94.4 %) | 98.0 % (95 % CI: 96.9–98.8 %) | ||
| Casts b | 3 | 106 | 50 % (95 % CI: 40.1–59.9 %) | 97.0 % (95 % CI: 95.7–98.0 %) | 0.67 |
| 10 | 20 | 70.0 % (95 % CI: 45.7–88.1 %) | 99.0 % (95 % CI: 98.2–99.5 %) | ||
| Crystals | 3 | 61 | 86.9 % (95 % CI: 75.8–94.2 %) | 97.4 % (95 % CI: 96.2–98.3 %) | 0.90 |
| 10 | 48 | 89.6 % (95 % CI: 77.3–96.5 %) | 99.1 % (95 % CI: 98.2–99.6 %) | ||
| Bacteria c | ± | 590 | 98.3 % (95 % CI: 96.9–99.2 %) | 62.6 % (95 % CI: 57.8–67.2 %) | 0.88 |
| + | 337 | 100 % (95 % CI: 98.9–100 %) | 40.6 % (95 % CI: 36.9–44.1 %) |
-
RBC, red blood cells; WBC, white blood cells; SEC, squamous epithelial cells; NSEC, non-squamous epithelial cells; CI, confidence interval. a Weighted Cohen’s kappa coefficient from the ordinal scale cross-tables; b Including hyaline and pathological casts; c Visual microscopy of bacteria counts was reported in ordinal scale, performance of AUTION EYE Bacteria detection at 10 × 106/L is shown.
Discussion
The new flow cell morphology instrument AUTION EYE AI-4510 by ARKRAY Inc. was investigated for its performance in counting urine particles.
Precision, linearity and quantitation
Counts of ARKRAY Low and High Particle Controls satisfied the desirable limit of R(CV) <2, but R(CV)=1.4 of the ARKRAY High Control was wider than R(CV)=0.5 of the Low Control, possibly due to the particle count 1.535 × 10⁶/L that exceeded the quantitative range (about 1.000 particles × 106/L). R(CV) obtained for Bio-Rad Level 2 control with fixed RBC, WBC, crystals and bacteria suggest that AUTION EYE AI-4510 was capable of reproducible differentiation of urine particles. The limiting R(CV) of Bio-Rad bacteria counts is explainable by the combined suspension of both Gram positive cocci and Gram negative rods. Precision with 33 patient specimens reached a desirable R(CV) ≤2 with Dahlberg’s procedure, except for specimens containing mucus, amorphous precipitates or crowds of particles (Figure 1). The precision of AUTION EYE AI-4510 is better than that obtained with the previous iQ200 analyzer using flow cell morphology [7].
Linearity of RBC and WBC counting reached the health-related concentrations of these particles [10]. The LoQ also achieved these health-related concentrations with the chosen specimens. The AUTION EYE AI-4510 reached lower limits of quantitation for urine RBC and WBC concentrations than the previous instrument Iris iQ200 [7]. No carry-over was detected. Consequently, detection of microscopic hematuria at >3 RBC/high power field as defined by the American Urological Association was achieved [16], corresponding to about 30 RBC × 106/L in uncentrifuged specimen [10].
Accuracy of diagnostic classifications
The counting of RBC, WBC and SEC by AUTION EYE AI-4510 correlated with visual microscopy at the desirable level of the EFLM European urinalysis guideline 2023 [10], as also obtained for UF-5000 [3], UriSed 3 PRO [15], and the earlier iQ200 [7].
Diagnostic classification of RBC counting by AUTION EYE AI-4510 reached a sensitivity of 95 % with a specificity of 94 % at a cut-off of >30 RBC × 106/L (Table 5). Using a lower cut-off of 10 RBC × 106/L, the sensitivity of 91 % and the specificity of 77 % were like those obtained with UF-5000 (88 and 74 %, respectively) [3] and UriSed 3 PRO (82 and 84 %, respectively) [15]. A lower specificity at a cut-off of >10 × 106/L was explained by CaOx monohydrate crystals that were misclassified as RBCs, in addition to Poisson statistical uncertainty. In WBC counting, the sensitivity of 94 % with a specificity of 89 % at a cut-off of >10 WBC × 106/L is comparable to that seen in UF-5000 [3]. In SEC counting, the sensitivity of 83 % with a specificity of 97 % was seen at >10 SEC × 106/L like those with UriSed 3 PRO (81 and 96 %, respectively) [15], but not as good as those obtained with UF-5000 (91 and 96 %, respectively) [3]. With these figures, AUTION EYE AI-4510 provided desirable quantitative counts for these particles.
Performance of bacteria counting was assessed against ordinal scale categories obtained with visual phase contrast microscopy, suggesting a promising identity of bacteria detection (Table 4). These results are like those obtained with UriSed 3 PRO against urine bacterial culture at 104 colony-forming units/mL or more [15]. Bacteria counting capability was also supported by reproducible counts with Bio-Rad quality control solution. Since bacteria counts are required for ruling out of bacteriuria with automated urine particle analysis [10], 17], the performance of bacteria counting needs to be confirmed against bacterial culture.
Detection of kidney disease by automated particle counting
Non-hyaline and often also hyaline casts in urine suggest presence of a kidney disease [5]. The AUTION EYE AI-4510 detected 50 % of casts at >3 × 10⁶/L, and 70 % of them at >10 casts × 106/L with remarkable specificities of 97–99 % (Table 2), comparable to the sensitivity of 49 % UriSed 3 PRO with a specificity of 98 % at 3 × 10⁶/L [15]. It showed an improvement against the previous iQ200 analyzer with a sensitivity of 11 % and a specificity of 99 % at the same concentration of casts [7].
Sensitive detection and correct classification of casts is not easy because of the morphology of casts and other material in urine that mimics them. The sensitivity of detection may be improved by cross-checking with albumin in urine [18]. The presence of casts can be confirmed on the screen of the AUTION EYE AI-4510 by the operator, like in instruments using digital cuvette imaging [18].
RTEC indicate the presence of kidney damage typically after acute ischemic, inflammatory or toxic kidney injuries [5], even without changes in glomerular filtration rate [19]. RTEC has been shown to differentiate upper and lower urinary tract infections by using UF-5000 [20] that detects RTEC with a sensitivity of 95 % and a specificity of 75 % [3]. Since AUTION EYE AI-4510 was unable to differentiate RTEC and TEC, the performance of the combined NSEC was assessed. Detection of NSEC with a sensitivity of 85 % and a specificity of 89 % at >3 × 10⁶/L allows establishment of a review flag for visual confirmation of RTEC in a specimen [18].
Detection of crystalluria
Abundant amounts of urinary crystals created by stone-forming metabolites may be significant in patients with recurrent urinary stones [21], [22], [23], [24], although the diagnosis is based on the identified urinary stone [10], 24]. Most common urinary stones consist of CaOx and calcium phosphate (carbapatite and brushite), or uric acid [24]. Rare diseases, nephrotoxic drugs, or urinary tract infections may also cause precipitation of crystals [25]. Numerous CaOx monohydrate crystals in urine may indicate primary hyperoxaluria or ethylene glycol poisoning [26], 27]. Due to the high prevalence of physiological crystals, identification of crystals in urine is indicated on specific requests only, rather than a part of routine report on particles in urine [10].
The AUTION EYE AI-4510 had a high sensitivity of 87 % with a specificity of 97 % to detect urinary crystals already at >3 crystals × 106/L (Table 3). The performance was better than that of sediMAX conTRUST that provided a sensitivity of 29 , 42, 43 and 50 % in detection of CaOx monohydrate, CaOx dihydrate, triple phosphate and uric acid crystals, respectively [28]. Because of similar size and shape, CaOx monohydrate crystals and RBC are mixed easily, indicating a review flag for analyzers to confirm the RBC count in case crystals are detected [18]. Crystal images captured by the AUTION EYE AI-4510 can be stored and reviewed for a repeated analysis if needed. AUTION EYE AI-4510 may be used for screening crystals in urine if the laboratory receives a remarkable number of specimens suspected of urine crystals, justifying an automated analysis.
Flagging rules
Implementation of intelligent flagging rules is suggested to improve the performance of automated urinalysis [10], [29], [30], [31]. The AUTION EYE AI-4510 is linked to the AUTION MAX AX-4060 automated urine test strip analyzer, allowing application of cross-checking rules in addition to single particle concentrations from the particle analyzer, like the sediMAX conTRUST PRO analyzer [18]. This evaluation suggests possibilities to improve detection of kidney damage by review rules associated with casts and NSEC. Moreover, flags for crystals should be considered to confirm the presence of RBC. Since the middleware can be adjusted, the end-user laboratory needs to verify its own flagging rules based on local variety of urine specimens and clinical practices, in addition to the primary technical assessment by the manufacturer [10].
Conclusions
The AUTION EYE AI-4510 automated urine particle analyzer satisfied the analytical performance for the basic urine particles at the desirable specification level of the EFLM European Urinalysis Guideline 2023. Performance characteristics suggest additional flagging for at least NSEC (to detect RTEC) and casts to detect kidney disease, and for crystals to confirm RBC counts, as locally needed. The performance of bacteria counts by the AUTION EYE AI-4510 needs further assessment against bacterial cultures.
Acknowledgments
The authors wish to thank the lab technicians of the Ghent University Hospital for their assistance in the study. ARKRAY provided financial and technical assistance for this evaluation, in addition to an encouragement of true scientific evaluation of the performance data.
-
Research ethics: The study was conducted in accordance with the Declaration of Helsinki (as revised in 2013). The study was approved by the Ethical Committee of the Ghent university Hospital (ONZ-2024-0098).
-
Informed consent: Not applicable.
-
Author contributions: All authors have accepted responsibility for the entire content of this manuscript and approved its submission.
-
Use of Large Language Models, AI and Machine Learning Tools: None declared.
-
Conflict of interest: The authors state no conflict of interest.
-
Research funding: None declared.
-
Data availability: The raw data can be obtained on request from the corresponding author.
References
1. Oyaert, M, Delanghe, J. Progress in automated urinalysis. Ann Lab Med 2019;39:15–22. https://doi.org/10.3343/alm.2019.39.1.15.Suche in Google Scholar PubMed PubMed Central
2. Fogazzi, GB, Garigali, G. The different ways to obtain digital images of urine microscopy findings: their advantages and limitations. Clin Chim Acta 2017;466:160–1. https://doi.org/10.1016/j.cca.2017.01.024.Suche in Google Scholar PubMed
3. Previtali, G, Ravasio, R, Seghezzi, M, Buoro, S, Alessio, MG. Performance evaluation of the new fully automated urine particle analyser UF-5000 compared to the reference method of the Fuchs-Rosenthal chamber. Clin Chim Acta 2017;472:123–30. https://doi.org/10.1016/j.cca.2017.07.028.Suche in Google Scholar PubMed
4. Falbo, R, Sala, MR, Bussetti, M, Cappellini, F, Giacobone, C, Fania, C, et al.. Performance evaluation of a new and improved cuvette-based automated urinalysis analyzer with phase contrast microscopy. Clin Chim Acta 2019;491:126–31. https://doi.org/10.1016/j.cca.2019.01.025.Suche in Google Scholar PubMed
5. Perazella, MA. The urine sediment as a biomarker of kidney disease. Am J Kidney Dis 2015;66:748–55. https://doi.org/10.1053/j.ajkd.2015.02.342.Suche in Google Scholar PubMed
6. Deindoerfer, FH, Gangwer, JR, Laird, CW, Ringold, RR. The “Yellow IRIS” urinalysis workstation – the first commercial application of “automated intelligent microscopy”. Clin Chem 1985;31:1491–9. https://doi.org/10.1093/clinchem/31.9.1491.Suche in Google Scholar
7. Linko, S, Kouri, TT, Toivonen, E, Ranta, PH, Chapoulaud, E, Lalla, M. Analytical performance of the Iris iQ200 automated urine microscopy analyzer. Clin Chim Acta 2006;372:54–64. https://doi.org/10.1016/j.cca.2006.03.015.Suche in Google Scholar PubMed
8. Benovska, M, Wiewiorka, O, Pinkavova, J. Evaluation of FUS-2000 urine analyzer: analytical properties and particle recognition. Scand J Clin Lab Invest 2018;78:143–8. https://doi.org/10.1080/00365513.2017.1423108.Suche in Google Scholar PubMed
9. Kucukgergin, C, Ademoglu, E, Omer, B, Genc, S. Performance of automated urine analyzers using flow cytometric and digital image-based technology in routine urinalysis. Scand J Clin Lab Invest 2019;79:468–74. https://doi.org/10.1080/00365513.2019.1658894.Suche in Google Scholar PubMed
10. Kouri, T, Hofmann, W, Falbo, R, Oyaert, M, Schubert, S, Gertsen, J, et al., on behalf of the Task and Finish Group for Urinalysis (TFG-U), European Federation of Clinical Chemistry and Laboratory Medicine (EFLM). The EFLM European urinalysis guideline 2023. Clin Chem Lab Med 2024;62:1653–786. https://doi.org/10.1515/cclm-2024-0070.Suche in Google Scholar PubMed
11. Kouri, T, Gyory, A, Rowan, RM, the ISLH Urinalysis Task Force. ISLH recommended reference procedure for the enumeration of particles in urine. Lab Hematol 2003;9:58–63.Suche in Google Scholar
12. CLSI. User verification of precision and estimation of bias; approved guideline, 3rd ed. CLSI document EP15-A3. Wayne, OA: Clinical Laboratory Standards Institute; 2017.Suche in Google Scholar
13. Dahlberg, G. Statistical methods for medical and biological students. London: G: Allen & Unwin Ltd; 1940.Suche in Google Scholar
14. Bourner, G, de la Salle, B, George, T, Tabe, Y, Baum, H, Culp, N, et al., on behalf of the International Committee for Standardisation in Hematology (ICSH). ICSH guidelines for the verification and performance of automated cell counters for body fluids. Int J Lab Hem 2014;36:598–612. https://doi.org/10.1111/ijlh.12196.Suche in Google Scholar PubMed
15. Kouri, T, Alagrund, K, Lehtonen, M, Tohmola, N, Pihlajamaa, T, Kouri, VP, et al.. Verification of UriSed 3 PRO automated urine microscope in regional laboratory environment. Clin Chim Acta 2021;515:96–103. https://doi.org/10.1016/j.cca.2021.01.005.Suche in Google Scholar PubMed
16. Barocas, DA, Boorjian, SA, Alvarez, RD, Downs, TM, Gross, CP, Hamilton, BD, et al.. Microhematuria: AUA/SUFU guideline. J Urol 2020;204:778–86. https://doi.org/10.1097/ju.0000000000001297.Suche in Google Scholar
17. Monsen, T, Ryden, P. A new concept and a comprehensive evaluation of SYSMEX UF-1000i flow cytometer to identify culture-negative urine specimens in patients with UTI. Eur J Clin Microbiol Infect Dis 2017;36:1691–703. https://doi.org/10.1007/s10096-017-2964-1.Suche in Google Scholar PubMed PubMed Central
18. Palmieri, R, Falbo, R, Cappellini, F, Soldi, C, Limonta, G, Brambilla, P, et al.. The development of autoverification rules applied to urinalysis performed on the AutionMAX-sediMAX platform. Clin Chim Acta 2018;485:275–81. https://doi.org/10.1016/j.cca.2018.07.001.Suche in Google Scholar PubMed
19. Perazella, MA, G Coca, S. Traditional urinary biomarkers in the assessment of hospital-acquired AKI. Clin J Am Soc Nephrol 2012;7:167–74. https://doi.org/10.2215/cjn.09490911.Suche in Google Scholar PubMed
20. Oyaert, M, Speeckaert, M, Boelens, J, Delanghe, JR. Renal tubular epithelial cells add value in the diagnosis of upper urinary tract pathology. Clin Chem Lab Med 2020;58:597–604. https://doi.org/10.1515/cclm-2019-1068.Suche in Google Scholar PubMed
21. Daudon, M, Frochot, V. Crystalluria. Clin Chem Lab Med 2015;53:S1479–87. https://doi.org/10.1515/cclm-2015-0860.Suche in Google Scholar PubMed
22. Wong, KA, Pardy, C, Pillay, S, Athanasiou, T, Rottenberg, G, Bultitude, M, et al.. Can the presence of crystalluria predict stone formation in patients with cystinuria? J Endourol 2016;30:609–14. https://doi.org/10.1089/end.2015.0692.Suche in Google Scholar PubMed
23. Šálek, T, Musil, P, Vermeersch, P, Marrington, R, Dikmen, ZG, Poláchová, R, et al.. Preservation of urine specimens for metabolic evaluation of recurrent urinary stone formers. Clin Chem Lab Med 2024;30:129–38. https://doi.org/10.1515/cclm-2024-0773.Suche in Google Scholar PubMed
24. Skolarikos, A, Neisius, A, Petřík, A, Somani, B, Thomas, K, Gambaro, G, et al.. EAU guideline on urolithiasis. Edition presented at the EAU Annual Congress Amsterdam. Arnhem, the Netherlands: EAU Guidelines Office; 2024. https://uroweb.org/guideline/urolithiasis/ [Accessed 3 Dec 2024].Suche in Google Scholar
25. Fogazzi, GB, Garigali, G, Croci, MD, Verdesca, S. The formed elements of the urinary sediment. In: Fogazzi, GB, editor. The urinary sediment. An integrated view, 3 ed. Milan: Elsevier; 2010:41–158 pp.Suche in Google Scholar
26. Poloni, JA, Garcia, CD, Rotta, LN, Perazella, MA. Calcium oxalate crystalluria points to primary hyperoxaluria type 1. Kidney Int 2016;89:250. https://doi.org/10.1016/j.kint.2015.11.001.Suche in Google Scholar PubMed
27. Luqman, A, Stanifer, J, Asif Siddiqui, OM, Naseer, A, Wall, BM. Calcium oxalate monohydrate crystals: a clue to ethylene glycol poisoning. Am J Med Sci 2011;341:38. https://doi.org/10.1097/maj.0b013e3181e15dbd.Suche in Google Scholar PubMed
28. Castiglione, V, Cavalier, E, Diopt, C, Gadisseur, R. Distinction between urine crystals by automated urine analyser sediMAX conTRUST is specific but lacks sensitivity. Clin Chem Lab Med 2017;55:e288–90. https://doi.org/10.1515/cclm-2017-0228.Suche in Google Scholar PubMed
29. Aydin, O, Ellidag, HY, Eren, E, Yilmaz, N. High false positives and false negatives in yeast parameter in an automated urine sediment analyzer. J Med Biochem 2015;34:332–7. https://doi.org/10.2478/jomb-2014-0052.Suche in Google Scholar PubMed PubMed Central
30. Delanghe, J, Speeckaert, M, Delanghe, S, Oyaert, M. Pitfalls in the diagnosis of hematuria. Clin Chem Lab Med 2023;61:1382–7. https://doi.org/10.1515/cclm-2023-0260.Suche in Google Scholar PubMed
31. Oyaert, M, Maghari, S, Speeckaert, M, Delanghe, J. Improving clinical performance of urine sediment analysis by implementation of intelligent verification criteria. Clin Chem Lab Med 2022;60:1772–9. https://doi.org/10.1515/cclm-2022-0617.Suche in Google Scholar PubMed
Supplementary Material
This article contains supplementary material (https://doi.org/10.1515/cclm-2024-1163).
© 2025 the author(s), published by De Gruyter, Berlin/Boston
This work is licensed under the Creative Commons Attribution 4.0 International License.
Artikel in diesem Heft
- Frontmatter
- Editorials
- The Friedewald formula strikes back
- Liquid biopsy in oncology: navigating technical hurdles and future transition for precision medicine
- The neglected issue of pyridoxal- 5′ phosphate
- Reviews
- Health literacy: a new challenge for laboratory medicine
- Clinical applications of circulating tumor cell detection: challenges and strategies
- Opinion Papers
- Pleural effusion as a sample matrix for laboratory analyses in cancer management: a perspective
- Interest of hair tests to discriminate a tail end of a doping regimen from a possible unpredictable source of a prohibited substance in case of challenging an anti-doping rule violation
- Perspectives
- Sigma Metrics misconceptions and limitations
- EN ISO 15189 revision: EFLM Committee Accreditation and ISO/CEN standards (C: A/ISO) analysis and general remarks on the changes
- General Clinical Chemistry and Laboratory Medicine
- Evaluation of current indirect methods for measuring LDL-cholesterol
- Verification of automated review, release and reporting of results with assessment of the risk of harm for patients: the procedure algorithm proposal for clinical laboratories
- Progranulin measurement with a new automated method: a step forward in the diagnostic approach to neurodegenerative disorders
- A comparative analysis of current С-peptide assays compared to a reference method: can we overcome inertia to standardization?
- Blood samples for ammonia analysis do not require transport to the laboratory on ice: a study of ammonia stability and cause of in vitro ammonia increase in samples from patients with hyperammonaemia
- A physio-chemical mathematical model of the effects of blood analysis delay on acid-base, metabolite and electrolyte status: evaluation in blood from critical care patients
- Evolution of autoimmune diagnostics over the past 10 years: lessons learned from the UK NEQAS external quality assessment EQA programs
- Comparison between monotest and traditional batch-based ELISA assays for therapeutic drug monitoring of infliximab and adalimumab levels and anti-drug antibodies
- Evaluation of pre-analytical factors impacting urine test strip and chemistry results
- Evaluation of AUTION EYE AI-4510 flow cell morphology analyzer for counting particles in urine
- Reference Values and Biological Variations
- Estimation of the allowable total error of the absolute CD34+ cell count by flow cytometry using data from UK NEQAS exercises 2004–2024
- Establishment of gender– and age–related reference intervals for serum uric acid in adults based on big data from Zhejiang Province in China
- Cancer Diagnostics
- Tumor specific protein 70 targeted tumor cell isolation technology can improve the accuracy of cytopathological examination
- Cardiovascular Diseases
- Diagnostic performance of Mindray CL1200i high sensitivity cardiac troponin I assay compared to Abbott Alinity cardiac troponin I assay for the diagnosis of type 1 and 2 acute myocardial infarction in females and males: MERITnI study
- Infectious Diseases
- Evidence-based assessment of the application of Six Sigma to infectious disease serology quality control
- Letters to the Editor
- Evaluating the accuracy of ChatGPT in classifying normal and abnormal blood cell morphology
- Refining within-subject biological variation estimation using routine laboratory data: practical applications of the refineR algorithm
- Early rule-out high-sensitivity troponin protocols require continuous analytical robustness: a caution regarding the potential for troponin assay down-calibration
- Biochemical evidence of vitamin B12 deficiency: a crucial issue to address supplementation in pregnant women
- Plasmacytoid dendritic cell proliferation and acute myeloid leukemia with minimal differentiation (AML-M0)
- Failing methemoglobin blood gas analyses in a sodium nitrite intoxication