Evidence-based assessment of the application of Six Sigma to infectious disease serology quality control
-
Wayne Dimech

 and
Giuseppe Vincini
and
Giuseppe Vincini

Abstract
Objectives
Recently, four publications have applied Sigma metrics to infectious disease serology testing. Three studies applied Sigma metrics to assays in a blood bank setting, whereas one used anti-toxoplasma testing in a diagnostic laboratory. One of the four studies applied the approach to microtitre plate enzyme immunoassays, whereas the other three were on fully automated chemiluminescent assay. The approaches used by each study differed in the approach used to calculate imprecision, measured as a percentage coefficient of variation, and bias. All four studies used the difference between the mean of the quality control result and the assay cut-off to describe the total allowable error.
Methods
This paper compares and critically reviews the methods used to calculate the Sigma value for each assay in the four studies and provides an evidence-based assessment of these approaches using real-world quality control data obtained from the National Serology Reference Laboratory, Australia (NRL) QConnect™ quality control program.
Results
The assessment found that there was a lack of standardisation in the application of Sigma metrics for infectious disease testing, including examples of inappropriate assumptions being used. Westgard Sigma Rules suggest that assays found to have a Sigma value of six or greater can be monitored using two quality control measures and applying a single mean ± three standard deviation rule.
Conclusions
Although this approach will significantly reduce the number of false rejections generated by using the full range of Westgard rules, we provide evidence that even this approach can potentially cause true errors to be missed.
Introduction
Numerous papers have addressed the concept of Six Sigma applied to medical laboratory testing [1], [2], [3], [4], [5]. The Six Sigma concept was first implemented by the Motorola Corporation in 1986 [6]. In the manufacturing industry, the number of defects of a particular process can be counted or estimated and then converted to a defects-per-million (DPM) ratio [3]. A process that reports 3.4 DPM episodes is defined as a Six Sigma process. This approach has been applied to many industries including the health industry and is used to improve quality, as practitioners implement practices to drive down the numbers of defects [7]. In medical laboratory testing, rather than counting defects, the Sigma metric (SM) of a testing process is estimated by using measured imprecision and bias of quality control (QC) results, and an estimated or defined allowable total error (TEa) [2], 3], 8]. Using these parameters, SM can be calculated as:
where CV% is the percentage coefficient of variation of the population.
Recently, several authors have described the application of the Sigma metric concept to QC processes for infectious disease serology [9], [10], [11], [12]. Each author of these recent studies has applied different assumptions relating to the determination of imprecision, bias and TEa. Some of these assumptions are not evidence-based, in particular the assumption that bias can be ignored and that TEa can be defined as the difference between the mean of QC sample test results over time and the assay cut-off value. This paper critically reviews and compares the approaches used by each of the four studies, and uses real, comprehensive QC data to demonstrate how these assumptions can impact the estimation of Sigma metrics of an assay.
Methods
Four studies [9], [10], [11], [12] that applied Sigma metrics to infectious disease serology were reviewed and the methods of determining bias, CV% and TEa were critically assessed. To highlight the impact of each assumption in relation to the estimation of bias, CV% and TEa, real laboratory-derived quality control data were obtained from the National Serology Reference Laboratory, Australia (NRL) QConnect™ infectious disease QC program (https://www.nrlquality.org.au/products-services/qconnect/). Laboratories participating in the QConnect™ QC program used Optitrol™ QC samples (DiaMex GmbH, Heidelberg, Germany) which is optimised for each test platform. The QConnect program currently covers all major serology and molecular platforms used across well-resourced countries including those in Europe, North and South America and Oceania, including but not limited to those assays manufactured by Abbott Diagnostics, DiaSorin, Grifols, Roche, and Siemens. The Optitrol QC samples are manufactured to ensure minimal QC lot-to-lot variation. All participating laboratories enter results into NRL’s internet-based software (EDCNet™). For each of the papers reviewed, the assumptions used to define the three elements used to estimate Six Sigma (bias, imprecision and TEa) were tested using QC data extracted from EDCNet™. Unless identified otherwise, QC test results were obtained from a single QC lot number. The period of time the QC were extracted are specified for each example.
The assumptions used to the estimate bias in the studies under review were tabulated and compared. To assess real-world bias experienced by laboratories using the same Abbott Alinity i and ARCHITECT assays used in three of the four Six Sigma studies, QConnect™ data was extracted over a 10-month period from 1st March to 31 December 2023. The bias experienced by laboratories using three different QC lots tested in the Abbott assays was calculated (peer group mean divided by the laboratory mean expressed as a percentage).
The estimated imprecision was calculated from results of testing a single QC lot tested on the same Abbott Alinity i and ARCHITECT assays from data entered into EDCNet™. Data were collected over 10-, 3- and 1-month periods starting from 1st March, 1st October and 1st December 2023, respectively, until 31st December 2023. The CV% was calculated using SD/mean of results reported for the time period.
The methods used by each of the four papers reviewed to estimate TEa was compared and tabulated. The selection of the QC samples used to define TEa, and their suitability for TEa estimation, was critically assessed.
Results
A summary of the key elements used to calculate Sigma metrics by each of the four reviewed papers is presented in Table 1. All four studies used data derived from commercial infectious disease assays. Three of the four studies used data from blood bank screening of donors for blood-borne infections [9], 11], 12]. The other study reviewed data from toxoplasma IgG and IgM testing in a clinical setting [10]. Three of the four studies used automated chemiluminescent assays (CMIA) [9], [10], [11] and one used microtitre plate enzyme immunoassays (MTP-EIAs) [12], which typically have greater imprecision.
Details of four peer-review publications on the implementation of sigma metric on infectious disease testing.
| Paper reference | 12] | 10] | 11] | 9] |
|---|---|---|---|---|
| Lead author | Moya-Salazar | Khelil | Scheurich | Bhatnagar |
| Year of publication | 2019 | 2023 | 2024 | 2024 |
| Analytes | Biokit Anti-HCV Biokit Chagas Bio-Rad Anti-HIV Bio-Rad Syphilis Bio-Rad HBsAg Bio-Rad HBcAb |
Abbott ARCHITECT Toxo IgM Abbott ARCHITECT Toxo IgG |
Abbott ARCHITECT Anti-HIV Abbott ARCHITECT Anti-HCV Abbott ARCHITECT Anti-HTLV Abbott ARCHITECT HBsAg Abbott ARCHITECT Syphilis |
Abbott Alinity i anti-HIV Abbott Alinity i anti-HCV Abbott Alinity i HBsAg |
| Technology | Microtitre-plate EIA | Chemiluminescence | Chemiluminescence | Chemiluminescence |
| Bias estimate | Not included | Not included | Not included | EQA results (Δ between laboratory result and mean of peer-group |
| Controls | Kit positive controls | In-house plasma samples optimised for each test Kit positive controls |
Kit controls BioRad Virotrol I BioRad Virotrol Syphilis LR-A |
Kit control In house |
| Total allowable error | Δ between mean absorbance of control and the cut-off | Δ between mean of control result and the cut-off | Δ between mean of control result and the cut-off | Δ between mean of control result and the cut-off |
| Population for estimation of precision | Not defined | 10-month period | 1-month period | 3-month period |
| Calculation of precision | Not defined | Pooled CV% (CLSI C24) | SD/mean (%CV) | SD/mean (%CV) |
Estimation of bias
Three of the four studies did not include an estimation of bias in the calculation of SM [10], [11], [12]. One of those studies did not reference the requirement for including bias. Two other studies noted that bias may be present but chose not to include it in the calculations (Table 1), with one of those authors stating that “bias was not explicitly calculated for the controls. Instead, it was tacitly assumed to be zero” [11]. The study that did include bias in the calculation [9] used data obtained from the NRL external quality assessment scheme (EQAS) for blood banks, using “Bias (%) = [(mean of all laboratories using same instrument and method − laboratory mean)/mean of all laboratories using same instrument and method] × 100. This bias was then used for comparison between Sigma values with and without bias.” The estimated bias for this study was not presented. It is noted that the NRL EQAS includes 10 samples, three times per year. Of the 30 samples provided each year, there is usually multiple samples that are reactive for each of the analytes included in the study’s Sigma metric calculations. The reactive EQA samples are true positive donor samples with high reactivity. It is not clear which, or how many, of these EQA samples were used to calculate bias and if the estimation of bias at a high level of reactivity is comparable to a similar calculation at levels closer to the cut-off, as seen in QC.
To determine the extent of bias experienced by laboratories using the same Abbott Alinity i and ARCHITECT assays, data obtained from laboratories using QConnect testing three different QC lots in the Abbott assays over a 10-month period were used to calculated bias (peer group mean divided by the laboratory mean expressed as a percentage) (Table 2). The peer-group sizes ranged from 25 to 50 participating laboratories, with number of results reported for each assay/QC lot combination ranging from 3,143 to 7,039. Within each peer-group a significant spread of reported biases were identified. For example, the bias within the peer-group using the Abbott Alinity i T. pallidum assay ranged from −3.22 to 3.51 %; −5.50 to 5.74 % and −21.15 to 12.34 % for Optitrol Blue lot numbers DM23017, DM22121 and DM22009, respectively. Abbott Alinity i HBsAg assay bias ranged from −14.87 to 21.27 % for antigen detection, demonstrating that bias may be significant and should not be excluded when estimating the Sigma metric of an assay unless found to be insignificant.
The number of laboratories and the number and mean of quality control (QC) results obtained from three QC lots submitted to EDCNet™ QC monitoring software for four Abbott Alinity i assays over a 10-month period, along with the range of bias calculated for results from each participating laboratory.
| Assay | Analyte | Quality control lot number | No. of laboratories | Total no of results | Mean reactivity (S/Co) | Range of bias, % |
|---|---|---|---|---|---|---|
| Abbott Alinity i HBsAg qualitative II | HBsAg | DM22009 | 25 | 3,143 | 1.84 | −21.27 to +14.87 |
| DM22121 | 34 | 5,112 | 1.80 | −16.11 to +9.06 | ||
| DM23017 | 35 | 4,493 | 1.83 | −15.01 to +17.69 | ||
| Abbott Alinity i HCV II | Anti-HCV | DM22009 | 44 | 5,878 | 4.33 | −8.39 to +4.60 |
| DM22121 | 43 | 6,856 | 4.32 | −6.51 to +3.66 | ||
| DM23017 | 50 | 6,967 | 4.32 | −4.63 to +5.44 | ||
| Abbott Alinity i HIV Ag/Ab Combo | Anti-HIV | DM22009 | 37 | 5,632 | 6.26 | −12.82 to +32.42 |
| DM22121 | 43 | 6,649 | 6.60 | −11.26 to +17.18 | ||
| DM23017 | 48 | 7,039 | 5.90 | −22.44 to +16.14 | ||
| Abbott Alinity i Syphilis TP | Anti-T. pallidum | DM22009 | 28 | 3,165 | 2.78 | −21.15 to +12.34 |
| DM22121 | 32 | 4,085 | 2.87 | −5.50 to +5.74 | ||
| DM23017 | 35 | 4,505 | 3.44 | −3.22 to +3.51 |
Estimation of imprecision
Each study calculated imprecision differently. Three studies used a simple calculation of CV% by dividing the standard deviation (SD) of QC results by the mean of the QC sample reactivity [9], 11], 12], whereas the other study [10] used a pooled CV% incorporating the variation introduced by reagent lot changes (Table 1). The study using the pooled CV% calculation [10] used data collected over a 10-month period, therefore included multiple reagent lot changes. Two of the studies using a simple SD/mean calculation used data from 1- or 3-month periods, where reagent lot-to-lot change was limited. The fourth study did not specify the number of reagent lots or time period of data collection [12].
The CV% of an assay can differ considerably depending on the time period of data collection and the calculation method. The CV% from a single QC lot tested on the same Abbott assays over a period of 10-, 3- and 1-month period was calculated (Table 3). The CV% of QC sample results reported by each laboratory varied significantly, ranging from less than 2 % to greater than 20 %. However, the differences in CV% is not a reflection of the assay performance, but an anomaly caused by the time period of data collection. If the QC data are collected from a single reagent lot, the CV% is generally smaller than if collected over a longer period of time using multiple reagent lots.
Range of coefficient of variation (CV%) reported to EDCNet by laboratories testing relevant OptiTrol™ quality control over a 1-, 3- and 10-month period ending 31st December 2023. The number of laboratories and total number of results and calculated CV% range for individual laboratories and the peer-group are presented.
| Assay | 1 month | 3 months | 10 months | ||||||
|---|---|---|---|---|---|---|---|---|---|
| CV% range | No. of laboratoriesa (no. of total results) | Peer-group CV% | CV% range | No. of laboratoriesa (no. of total results) | Peer-group CV% | CV% range | No. of laboratoriesa (no. of total results) | Peer-group CV% | |
| Abbott Alinity i HIV Ag/Ab Combo (anti-HIV-1) | 2.66–16.15 | 22 (644) | 13.99 | 2.80–17.42 | 38 (2,784) | 13.84 | 4.28–18.96 | 43 (6,645) | 12.94 |
| Abbott Alinity i HIV Ag/Ab Combo (HIV p24 ag) | 8.93–24.40 | 7 (245) | 14.57 | 6.78–24.81 | 9 (755) | 16.12 | 6.63–21.23 | 9 (1,642) | 15.27 |
| Abbott Alinity i Anti-HCV II | 2.11–11.84 | 23 (667) | 5.60 | 2.36–7.89 | 38 (2,876) | 5.66 | 2.97–9.07 | 43 (6,856) | 5.77 |
| Abbott Alinity i HBsAg Qual II | 2.24–5.66 | 15 (459) | 7.05 | 2.62–9.73 | 28 (1,814) | 6.11 | 2.75–14.93 | 34 (5,112) | 9.50 |
| Abbott Alinity i Syphilis TP | 1.67–3.56 | 12 (314) | 3.36 | 1.93–4.97 | 26 (1,425) | 3.88 | 2.14–5.26 | 32 (4,085) | 4.11 |
| Abbott Alinity i Toxo IgG | 3.43–3.56 | 2 (90) | 4.60 | 3.17–4.82 | 4 (322) | 5.15 | 4.27–5.30 | 5 (812) | 5.17 |
| Abbott Alinity i Toxo IgM | 3.58–7.50 | 3 (90) | 8.94 | 4.26–9.48 | 3 (250) | 10.75 | 5.13–9.48 | 3 (392) | 8.73 |
| Abbott ARCHITECT Ag/Ab Combo (anti-HIV-1) | 3.58–11.75 | 6 (128) | 9.43 | 4.32–18.18 | 13 (620) | 11.09 | 3.39–15.78 | 20 (1,728) | 12.95 |
| Abbott ARCHITECT Ag/Ab Combo (HIV p24 ag) | 5.41–20.96 | 10 (305) | 14.94 | 5.86–19.69 | 12 (954) | 14.66 | 8.17–17.96 | 12 (2,009) | 13.84 |
| Abbott ARCHITECT Anti-HCV II | 2.73–11.33 | 4 (81) | 6.53 | 2.98–12.08 | 12 (580) | 6.64 | 3.29–11.95 | 20 (1,705) | 6.48 |
| Abbott ARCHITECT HBsAg II | 3.17–10.17 | 4 (82) | 11.79 | 3.24–12.99 | 12 (493) | 9.97 | 2.75–12.75 | 20 (1,499) | 10.98 |
| Abbott ARCHITECT Syphilis TP | 2.51–2.62 | 2 (49) | 5.97 | 2.35–11.97 | 10 (497) | 5.34 | 1.90–11.97 | 15 (1,428) | 4.73 |
| Abbott ARCHITECT Toxo IgG | 3.63–3.63 | 1 (22) | 3.77 | 4.22–5.27 | 3 (109) | 5.05 | 4.15–5.27 | 3 (184) | 5.03 |
| Abbott ARCHITECT Toxo IgM | 3.10–3.10 | 1 (19) | 3.10 | 3.71–6.13 | 2 (79) | 6.19 | 5.30–10.64 | 2 (260) | 9.92 |
-
aThe number of laboratories does not include laboratories that reported less than 10 data points in the given time period.
In the calculation of Sigma metrics, the TEa, with or without bias, is divided by the estimated CV%. Therefore, as the CV% decreases, the Sigma value increases. Figure 1 presents representative data sets from two laboratories testing the Abbott Alinity i HIV Ag/Ab combo assay, demonstrating how CV% change over time as new reagent lots are introduced. Each laboratory tested the same QC sample in the same assay (but different reagent lots) over the same time period. As new reagent lots with differing performance are introduced, the QC reactivity changes, as does the CV%. Where the new reagent lots have similar performance, the CV% of the QC sample results remains low for the same time period.

Two Levey-Jennings charts from two separate laboratories testing the same lot number of quality control material (OptiTrol™ Blue lot DM22121) on the same assay (Abbott Alinity i anti-HIV combi assay) over the same time period. One laboratory (left) displays reagent lot-to-lot variation whereas the other laboratory (right) has minimal reagent lot-to-lot variation. The percentage coefficient of variation (CV%) of each reagent lot and the overall CV% for the time period are presented. The grey horizontal lines indicate the mean plus and minus 3 standard deviations calculated on the QC results obtained by that laboratory over the specified time period.
Definition of TEa
The definition of TEa is critical in the application of Sigma metrics. All four studies used the difference between the mean reactivity of the control and the cut-off of the assay as previously proposed by other authors [13], 14]. Results were reported in different units of measure such as absorbance, signal to cut-off (S/Co), units per millilitre (U/mL) and an index. In the study by Khelil, the reactivity of the in-house QC samples was chosen by performing a serial dilution of the stock material and selecting a level of reactivity that was both on the linear portion of the dose response curve and at a level approaching the cut-off. The paper by Moya-Salazar and Díaz-Rosado indicated that kit control results were used to estimate the TEa but no raw data were presented. However, using the paper’s reported summary of kit control absorbance and the respective assay cut-off, the S/Co could be calculated and was found to range from 1.3 S/Co for the chagas assay to 13.7 S/Co for the anti-HBc assay. The approach reported by Bhatnagar et al. used the results of kit controls which ranged from 2.9 to 4.8 S/Co, whereas Scheurich et al. used results from both kit controls and third-party controls Virotrol I and Virotrol Syphilis LR-A (Bio-Rad Laboratories, USA). The mean S/Co results for the kit controls ranged from 1.63 for HIV p24 antigen to 5.05 for anti-HCV. However, the mean S/Co for the third-party controls ranged from 1.69 for Virotrol Syphilis LR-A tested on the ARCHITECT Syphilis TP assay to 9.74 for the Virotrol I tested on the ARCHITECT HIV Ag/Ab assay. Other high mean S/Co values were 7.74 and 6.86 for the Virotrol I tested on the ARCHITECT anti-HCV and anti-HTLV assays, respectively. Implying that it is acceptable (i.e. allowable error) that a QC reactivity can fall from 9.74 to 1.0 S/Co (a drop of 8.74 S/Co values) is not appropriate. Using data submitted to EDCNet, the mode of the SD reported by 22 laboratories testing on the ARCHITECT HIV Ag/Ab assay was approximately 0.4 S/Co (range 0.24–1.03 S/Co). A decrease of 8.74 S/Co represents a change of more than 21 SDs. Indeed, most if not all laboratories, in particular blood screening laboratories, would find a reduction of greater than 2.0 S/Co values (i.e. 5 SDs) a concern. The use of the Virotrol I QC sample for the purpose of estimating TEa is not acceptable. Conversely, the use of the Virotrol Syphilis LR-A QC sample only allows a change of 0.69 S/Co. This amount of change is often normal in many assays and could be argued as being too small for TEa estimations.
Six Sigma estimation
Each of the four studies estimated different Sigma values for the assays under investigation. None of the four studies investigated the same assay, so no direct comparison of study methodology was possible. Moya-Salaza et al. investigated seven MTP-EIAs used in a blood screening setting and estimated four as having a Sigma value of four, one assay at Sigma value of five and two assays at a Sigma value of >6. Khelil reviewed two assays using both an in-house control and kit controls and found that each QC and assay combination estimated the Sigma value to be >6, except for the low positive QC tested on the ARCHITECT Toxo IgM assay. Scheurich et al. reviewed five Abbott ARCHITECT assays at two different laboratories using a combination of kit controls and commercial external controls and estimated the Sigma value of >6 for all assays at one site, but found two of the same assays had a Sigma value of 3.97 (HBsAg using the kit positive control) and 5.46 (anti-HCV using the Virotrol I control) at the second site. Finally, Bhatnagar et al. reviewed three assays using the kit controls and estimated the Sigma value of each at >6 (the total Sigma value estimates ranging from 10.7 to 29.0). Bhatnagar et al. also reported that there was an in-house positive control in use at the laboratory, but these data were not reported.
Discussion
Six Sigma estimation is not a statistical process control methodology for monitoring QC results but informs decision as to the application of QC rules [2], 3], 15]. It has been demonstrated previously that the use of all Westgard rules in infectious disease testing introduces an unacceptable level of false rejections, leading to wasted time and resources in unnecessary investigations [16], 17]. If an assay was deemed Six Sigma or greater, then according to Westgard Sigma Rules, only the 13S rule for two control measurements is required to monitor Six Sigma assays [2], 3], 15].
However, the literature is unclear as to the meaning of what constitutes “two control measurements”. It may be interpreted as testing the same QC in duplicate, using two different levels of positive control or employing a positive and negative control. As indicated in one of the studies reviewed, there was an 87 % reduction in “out-of-control” events during the 3-month study period when replacing classic Westgard rules with Westgard Sigma rules, reducing the number of “out-of-control” events from 111 to 15 [9]. Note that, extrapolating these data, the application of classical Westgard rules over a full year would have caused almost 400 false rejections and associated investigations in this laboratory. The authors concluded that this reduction “reduces false rejections but also saves cost and time spent in re-runs and troubleshooting” indicating that the rejections arising from the other Westgard rules were not clinically important. This finding aligns with previously reported comparison of different QC monitoring approaches [16], and highlights that laboratories using classical Westgard rules for infectious disease testing should reconsider their approach to QC processes.
Yet, the use of a single 13S rule poses new questions. There is no advice given as to the data set used to establish the mean and SD If the first 20 data points are used as specified in the CLSI Guidelines [18], then the acceptance range will depend on whether the results are obtained using the same or multiple reagent lots, and the performance of those lots. As demonstrated in Figure 1, the CV% can vary considerably. If the CV% is small, then it is more likely that the introduction of a new reagent lot will trigger 13S rule rejections forcing more unnecessary investigations. Many laboratories, when faced with a change in reagent lot performance which triggers a QC rejection chose to reset the limits using a new set of data points. However, this approach ignores the root cause of the change, which is a change in bias [17].
NRL previously reported a significant change in reagent lots due to the change in a non-biological component of an anti-HCV assay [19]. In collaboration with the manufacturer, the root cause was identified and rectified, with subsequent reagent lots reporting levels of reactivity seen prior to the change. Figure 2 represents results from a single laboratory using affected and unaffected reagent lots, with associated mean±3SD calculated for each reagent lot. It is evident from the figure that the introduction of the second, affected reagent lot would trigger a 13s rule. If the laboratory chose to re-set their limits, as is usual practice when addressing Westgard rule failures, they would have accepted this clinically significant change. This is because they would have chosen to ignore the bias introduced by the reagent lot change. Resetting limits in response to a change in reactivity is a dangerous practice that could allow significant issues to go undetected, as there is no reference point to identify unacceptable bias. The use of historical results to establish an assay/QC specific acceptance range overcomes this methodology deficiency [20].
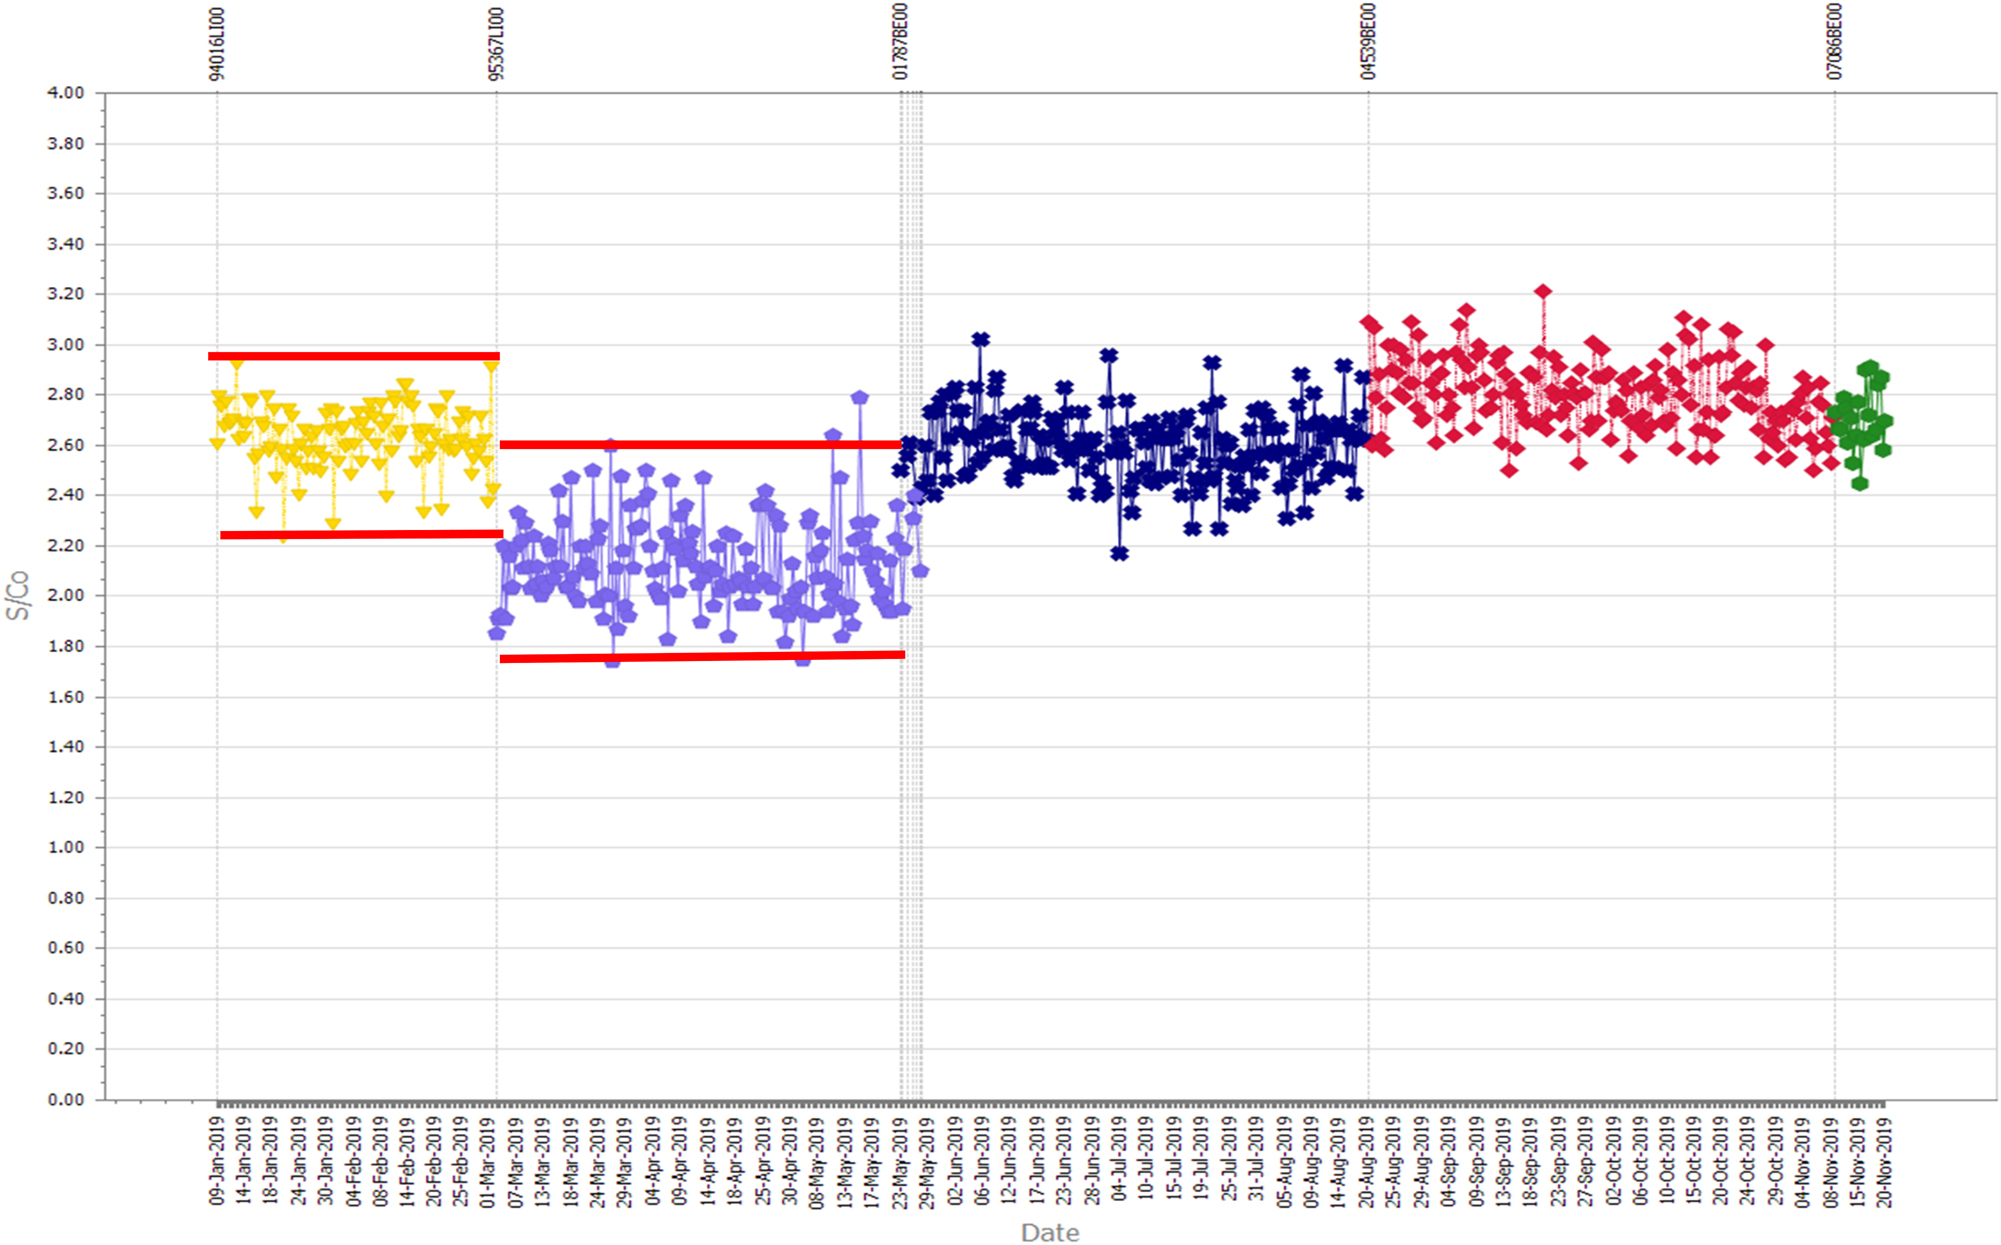
A Levey-Jennings chart of monitoring the reactivity of a single quality control sample tested in an anti-HCV assay. The lower results associated with a reagent lot number (represented in lilac) due to an identified change in reagent manufacture. The horizontal red lines represent three standard deviations from the mean of the results of each reagent lot.
Most commentators on QC processes offer opinions, mainly based on published guidelines that were developed decades ago, prior to infectious disease testing becoming automated [21], and thus applying processes used in clinical chemistry without any evidence that they were fit for use in infectious disease testing. Other commentators provide theoretical solutions using mathematical modelling and complex equations, again, without providing real-world evidence using actual data [15], 22], 23]. Others, like the four papers reviewed in the study, use localised QC data generated from single laboratories over a short period of time [9], [10], [11], [12, 14]. Here, we use comprehensive data derived from real laboratory testing of QC samples to review assumptions used to apply Sigma metrics to infectious disease testing.
There have been numerous publications on the application of Six Sigma to medical laboratory testing [2], [4], [5], [6, 24], while noting that its application is different in a laboratory setting compared with other industries [23]. Some authors have questioned its value [1], while others have called for harmonisation [8]. Irrespective, the application of Sigma metric to infectious disease serology QC requires specific review as it includes assumptions not generally required for other medical laboratory disciplines, in particular relating to the definition of TEa and bias. Khelil recently published an article identifying some deficiencies of some assumptions used by a particular study [25]. Each of the four recently reported studies estimating Sigma values of infectious disease serology testing [9], [10], [11], [12] used different assumptions and study designs, indicating a lack of standardisation in the application of this concept. This paper reviewed the methods employed by each of four papers and used real, comprehensive QC data to critically assess the different methods.
There are three main components required to estimate Sigma values, being the estimation of imprecision (CV%), bias and TEa. The CV% varies considerably depending on the data set or the method used for calculation (simple SD/mean or pooled CV%). A laboratory using the same reagent lot number over a short period will have a small CV% whereas data taken from a longer period across multiple lots will result in a larger CV%. This has a material impact on the estimation of Sigma values. Recent data obtained from NRL’s EDCNet™ demonstrates the significant range of CV% reported by laboratories using the same QC and assay over the same timeframe. Data reported within laboratories at 1-, 3- and 10-month periods, identified that the CV% range is not an indication of assay performance but due to larger numbers of reagent lots included in the estimation.
It is important to have defined criteria for the calculation of imprecision for the purposes of applying Sigma metrics. Using data collected during a small period of time such as 3 months or less will result in an artificially low CV% and consequently a higher Sigma value. Laboratories routinely testing QC samples, or even kit control, and using their results for the purpose of estimating Sigma values should have access to considerable data over a long period of time. It is suggested that data from a laboratory-defined period that accommodates normal lot-to-lot variation be utilised to ensure the CV% estimates include all normal lot-to-lot variation.
In infectious disease serology, bias is attributable to many sources of inherent variation (such as local conditions and calibration and performance of instruments) yet is mainly due to the change of reagent lots [16], 19], [26], [27], [28], [29]. This bias can range from being small to significant, so it is not appropriate to ignore bias without first undertaking an estimate. If bias is found to be small, its exclusion could be justified in the same manner as estimating uncertainty of measurement [30]. NRL has previously published a method for estimating bias for infectious disease serology using the mean of QC test results observed by the laboratory, divided by the mean of the peer group of laboratories using the same QC and assay [31]. Only one of the four studies included bias in the calculation of Sigma values. As has been demonstrated before, reagent lot changes can introduce significant bias and ignoring this component is not appropriate unless it has already been calculated and found to be insignificant [31].
Using the difference between the mean reactivity of the selected QC and the assay cut-off to calculate the TEa implies that a change in reactivity of the QC sample between these levels is acceptable (i.e. allowable error). Apart from the study by Khelil, the selection of the QC used to determine TEa seems to be of convenience, rather than selecting a QC with reactivity that was appropriate for the purpose of estimating Sigma metrics.
The reactivity of QC samples used for infectious disease testing should be designed to be on the linear part of the dose response curve of the assay, not just a unilateral decision to be close to a cut-off [32]. Determination of this level requires the performance of a serial dilution series of the stock material as demonstrated by Khelil and routinely used to manufacture Optitrol QC samples used in QConnect™ [20]. If the difference between the mean of the QC results and the assay cut-off is used to define the TEa, the reactivity of the QC sample should be selected to represent this allowable change in reactivity, not for convenience. That is, if the laboratory accepts a decrease in reactivity of a QC sample from S/Co 3.0 to 1.0 (the cut-off) i.e. a fall of S/Co of 2.0, then the QC sample must be manufactured to have a mean reactivity of 3.0 S/Co. Selecting a QC sample with a mean reactivity of 9.74 S/Co and accepting a decrease to S/Co 1.0, as reported in one study is not acceptable. It should be noted that this is not a comment on whether S/Co 3.0 is more or less appropriate than 9.74 in itself, but on the impact of adopting Sigma metrics would inadvertently have on acceptable S/Co ratios for infectious disease QC samples irrespective of where the best fit is for a given assay and its dose response curve. Assessment of an appropriate assay S/Co target is not the aim of this paper.
Whereas some of the kit control’s reactivity may be adequate for determining Sigma values, others were demonstrably not acceptable. The approach taken by Khelil is appropriate, as the QC used in that study were designed to have reactivity close to the cut-off and also on the linear part of the dose response curve and more arguably represented the allowable error for the assays investigated. If QC reactivity is to be used to calculate the TEa, the samples used must be designed and manufactured for this purpose, not selected for convenience.
All four studies demonstrated that almost all the assays under investigation had a Sigma value of >6. This is not surprising, in particular for kit controls and QC samples tested on the fully automated Abbott ARCHITECT and Alinity i platforms. The adoption of Westgard Sigma Rules to only use the 13S rule on two levels of QC for Six Sigma assays will reduce the number of unnecessary investigations, saving the laboratory significant resources. This finding confirms previous reports identifying the inappropriate use of classical Westgard rules for infectious disease testing [16].
The use of Westgard Sigma rules in infectious disease testing ignores the points raised in recent publications about the differences between serology and clinical chemistry testing, in particular lot to lot variation [16], 17], 28], 29], 33], 34]. This approach will still cause clinically insignificant flags (false rejections) leading to wasted resources, albeit much reduced compared with classical Westgard rules application. The practice of re-setting of acceptance limits by recalculating mean±3 SD, without reference to an acceptable amount of bias, may result in the acceptance of clinically significant failures. An appropriate QC monitoring process for infectious disease testing must determine what amount of bias is acceptable within a test system.
It is important that methods used for the standardisation and control of clinical chemistry assays are not universally applied across other disciplines without consideration of the differences [33]. This is particularly the case for infectious disease testing which experience significant, but normal lot-to-lot variation. The assumptions used to estimate the Sigma value must be carefully considered. The application of Sigma metrics and the use of a single 13s rule on Six Sigma assays will decrease the number of false rejections, benefiting laboratories. However, using a single 13s rule will still lead to false rejections and/or the necessity to recalculate acceptance limits and does not solve the underlying issue – that QC rules based on Gaussian distribution are not applicable/appropriate for datasets that are not normally distributed, such as those including multiple reagent lot changes.
-
Research ethics: Not applicable.
-
Informed consent: Not applicable.
-
Author contributions: All authors have accepted responsibility for the entire content of this manuscript and approved its submission.
-
Use of Large Language Models, AI and Machine Learning Tools: None declared.
-
Conflict of interest: The authors state no conflict of interest.
-
Research funding: None declared.
-
Data availability: The datasets generated and/or analyzed during the current study are available from the corresponding author on reasonable request.
References
1. Badrick, T, Theodorsson, E. Six sigma - is it time to re-evaluate its value in laboratory medicine? Clin Chem Lab Med 2024;62:2398–400. https://doi.org/10.1515/cclm-2024-0377.Search in Google Scholar PubMed
2. Westgard, S, Bayat, H, Westgard, JO. Special issue on six sigma metrics - experiences and recommendations. Biochem Med (Zagreb) 2018;28:020301. https://doi.org/10.11613/bm.2018.020301.Search in Google Scholar PubMed PubMed Central
3. Westgard, S, Bayat, H, Westgard, JO. Analytical Sigma metrics: a review of six sigma implementation tools for medical laboratories. Biochem Med (Zagreb) 2018;28:020502. https://doi.org/10.11613/bm.2018.020502.Search in Google Scholar PubMed PubMed Central
4. Nevalainen, D, Berte, L, Kraft, C, Leigh, E, Picaso, L, Morgan, T. Evaluating laboratory performance on quality indicators with the six sigma scale. Arch Pathol Lab Med 2000;124:516–9. https://doi.org/10.5858/2000-124-0516-elpoqi.Search in Google Scholar PubMed
5. Thakur, V, Akerele, OA, Randell, E. Lean and six sigma as continuous quality improvement frameworks in the clinical diagnostic laboratory. Crit Rev Clin Lab Sci 2023;60:63–81. https://doi.org/10.1080/10408363.2022.2106544.Search in Google Scholar PubMed
6. Raisinghani, MS, Ette, H, Pierce, R, Cannon, G, Daripaly, P. Six sigma: concepts,tools, and applications. Ind Manag Data Syst 2005;105:491–505. https://doi.org/10.1108/02635570510592389.Search in Google Scholar
7. Ninerola, A, Sanchez-Rebull, MV, Hernandez-Lara, AB. Quality improvement in healthcare: six sigma systematic review. Health Policy 2020;124:438–45. https://doi.org/10.1016/j.healthpol.2020.01.002.Search in Google Scholar PubMed
8. Wauthier, L, Di Chiaro, L, Favresse, J. Sigma metrics in laboratory medicine: a call for harmonization. Clin Chim Acta 2022;532:13–20. https://doi.org/10.1016/j.cca.2022.05.012.Search in Google Scholar PubMed
9. Bhatnagar, S, Westgard, S, Dung, NTT, Que, TN, Khanh, BQ, Thanh, NH. Applying sigma metrics to assess quality control processes in the transfusion transmissible infection screening laboratory of a blood center. PLoS One 2024;19:e0312422. https://doi.org/10.1371/journal.pone.0312422.Search in Google Scholar PubMed PubMed Central
10. Khelil, MM. Six Sigma driven QC in antibody testing for infectious diseases. Clin Chem Lab Med 2024;62:e40–3. https://doi.org/10.1515/cclm-2023-0552.Search in Google Scholar PubMed
11. Scheurich, G, Bhatnagar, S, Westgard, S. Sigma metrics analysis of serology screening assays to enhance quality and efficiency in New Zealand blood services. Diagn Microbiol Infect Dis 2024;110:116451. https://doi.org/10.1016/j.diagmicrobio.2024.116451.Search in Google Scholar PubMed
12. Moya-Salazar, J, Díaz- Rosado, RF. Quality analytical planning in blood bank serological screening qualitative assays. Int Clin Pathol J 2019;7:22–6. https://doi.org/10.15406/icpjl.2019.07.00194.Search in Google Scholar
13. Pereira, P. Quality control of qualitative tests for medical laboratories. Portugal: Grafisol; 2019.Search in Google Scholar
14. Green, GA, Carey, RN, Westgard, JO, Carten, T, Shablesky, L, Achord, D, et al.. Quality control for qualitative assays: quantitative QC procedure designed to assure analytical quality required for an ELISA of hepatitis B surface antigen. Clin Chem 1997;43:1618–21. https://doi.org/10.1093/clinchem/43.9.1618.Search in Google Scholar
15. Westgard, JO, Westgard, SA. Quality control review: implementing a scientifically based quality control system. Ann Clin Biochem 2016;53:32–50. https://doi.org/10.1177/0004563215597248.Search in Google Scholar PubMed
16. Dimech, W, Karakaltsas, M, Vincini, GA. Comparison of four methods of establishing control limits for monitoring quality controls in infectious disease serology testing. Clin Chem Lab Med 2018;56:1970–8. https://doi.org/10.1515/cclm-2018-0351.Search in Google Scholar PubMed
17. Dimech, WJ, Vincini, GA, Plebani, M, Lippi, G, Nichols, JH, Sonntag, O. Response to Tony Badrick regarding “Letter to the Editor regarding the article by Wayne J. Dimech et al. Time to address quality control processes applied to antibody testing for infectious diseases. Clin Chem Lab Med 2023;61:205–12 by”. Clin Chem Lab Med 2023;61:e137–e139, https://doi.org/10.1515/cclm-2022-0986.Search in Google Scholar PubMed
18. CLSI. Statistical quality control for quantitative measurement procedures: principles and definitions in CLSI Guideline. Wayne, PA: Clinical and Laboratory Standards Institute; 2016.Search in Google Scholar
19. Dimech, WJ, Vincini, GA, Cabuang, LM, Wieringa, M. Does a change in quality control results influence the sensitivity of an anti-HCV test? Clin Chem Lab Med 2020;58:1372–80. https://doi.org/10.1515/cclm-2020-0031.Search in Google Scholar PubMed
20. Dimech, W, Vincini, G, Karakaltsas, M. Determination of quality control limits for serological infectious disease testing using historical data. Clin Chem Lab Med 2015;53:329–36. https://doi.org/10.1515/cclm-2014-0546.Search in Google Scholar PubMed
21. Levine, JB. How the Westgard QC rules got their name: a personal recollection. Clin Chem 2018;64:874–6. https://doi.org/10.1373/clinchem.2018.288696.Search in Google Scholar PubMed
22. Pereira, P. A non-parametric framework for evaluating total analytical error in in vitro diagnostic medical devices in transfusion medicine. Transfus Apher Sci 2024;63:104026. https://doi.org/10.1016/j.transci.2024.104026.Search in Google Scholar PubMed
23. Bayat, H, Westgard, SA, Westgard, JO. The value of Sigma-metrics in laboratory medicine. Clin Chem Lab Med 2024;62:2401–4. https://doi.org/10.1515/cclm-2024-0609.Search in Google Scholar PubMed
24. Liu, Q, Chen, X, Han, J, Chen, Y, Wang, M, Zhao, J, et al.. Application of a six sigma model to the evaluation of the analytical performance of serum enzyme assays and the design of a quality control strategy for these assays: a multicentre study. Clin Biochem 2021;91:52–8. https://doi.org/10.1016/j.clinbiochem.2021.02.004.Search in Google Scholar PubMed
25. Khelil, MM. Letter to the Editor on article Scheurich G, Bhatnagar S, Westgard S. Sigma metrics analysis of serology screening assays to enhance quality and efficiency in New Zealand blood services. Diagnostic Microbiology & Infectious Disease 110 (2024). Diagn Microbiol Infect Dis 2025;111:116608.10.1016/j.diagmicrobio.2024.116608Search in Google Scholar PubMed
26. Dimech, W, Vincini, G, Karakaltas, M. Counterpoint to the Letter to the Editor by Badrick and Parvin in regard to Comparison of four methods of establishing control limits for monitoring quality controls in infectious disease serology testing. Clin Chem Lab Med 2019;57:e73–4. https://doi.org/10.1515/cclm-2018-1321.Search in Google Scholar PubMed
27. Dimech, WJ, Vincini, GA, Plebani, M, Lippi, G, Nichols, JH, Sonntag, O. Time to address quality control processes applied to antibody testing for infectious diseases. Clin Chem Lab Med 2023;61:205–12. https://doi.org/10.1515/cclm-2022-0986.Search in Google Scholar PubMed
28. Plebani, M, Gillery, P, Greaves, RF, Lackner, KJ, Lippi, G, Melichar, B, et al.. Rethinking internal quality control: the time is now. Clin Chem Lab Med 2022;60:1316–17. https://doi.org/10.1515/cclm-2022-0587.Search in Google Scholar PubMed
29. Plebani, M, Zaninotto, M. Lot-to-lot variation: no longer a neglected issue. J Clin Chem Lab Med 2022;60:645–6. https://doi.org/10.1515/cclm-2022-0128.Search in Google Scholar PubMed
30. Ellison, SLR, Williams, A. Quantifying uncertainty in analytical measurement: EURACHEM/CITAC guide CG 4; 2012.Search in Google Scholar
31. Dimech, W, Francis, B, Kox, J, Roberts, G, Serology Uncertainty of Measurement Working Party. Calculating uncertainty of measurement for serology assays by use of precision and bias. Clin Chem 2006;52:526–9. https://doi.org/10.1373/clinchem.2005.056689.Search in Google Scholar PubMed
32. Dimech, W, Vincini, G, McEwan, B. External quality control processes for infectious disease testing. ASM Affairs 2024;45:41–3. https://doi.org/10.1071/ma24013.Search in Google Scholar
33. Dimech, W. The standardization and control of serology and nucleic acid testing for infectious diseases. Clin Microbiol Rev 2021;34. https://doi.org/10.1128/cmr.00035-21.Search in Google Scholar
34. Plebani, M, Lippi, G. Standardization and harmonization in laboratory medicine: not only for clinical chemistry measurands. Clin Chem Lab Med 2023;61:185–7. https://doi.org/10.1515/cclm-2022-1122.Search in Google Scholar PubMed
© 2025 the author(s), published by De Gruyter, Berlin/Boston
This work is licensed under the Creative Commons Attribution 4.0 International License.
Articles in the same Issue
- Frontmatter
- Editorials
- The Friedewald formula strikes back
- Liquid biopsy in oncology: navigating technical hurdles and future transition for precision medicine
- The neglected issue of pyridoxal- 5′ phosphate
- Reviews
- Health literacy: a new challenge for laboratory medicine
- Clinical applications of circulating tumor cell detection: challenges and strategies
- Opinion Papers
- Pleural effusion as a sample matrix for laboratory analyses in cancer management: a perspective
- Interest of hair tests to discriminate a tail end of a doping regimen from a possible unpredictable source of a prohibited substance in case of challenging an anti-doping rule violation
- Perspectives
- Sigma Metrics misconceptions and limitations
- EN ISO 15189 revision: EFLM Committee Accreditation and ISO/CEN standards (C: A/ISO) analysis and general remarks on the changes
- General Clinical Chemistry and Laboratory Medicine
- Evaluation of current indirect methods for measuring LDL-cholesterol
- Verification of automated review, release and reporting of results with assessment of the risk of harm for patients: the procedure algorithm proposal for clinical laboratories
- Progranulin measurement with a new automated method: a step forward in the diagnostic approach to neurodegenerative disorders
- A comparative analysis of current С-peptide assays compared to a reference method: can we overcome inertia to standardization?
- Blood samples for ammonia analysis do not require transport to the laboratory on ice: a study of ammonia stability and cause of in vitro ammonia increase in samples from patients with hyperammonaemia
- A physio-chemical mathematical model of the effects of blood analysis delay on acid-base, metabolite and electrolyte status: evaluation in blood from critical care patients
- Evolution of autoimmune diagnostics over the past 10 years: lessons learned from the UK NEQAS external quality assessment EQA programs
- Comparison between monotest and traditional batch-based ELISA assays for therapeutic drug monitoring of infliximab and adalimumab levels and anti-drug antibodies
- Evaluation of pre-analytical factors impacting urine test strip and chemistry results
- Evaluation of AUTION EYE AI-4510 flow cell morphology analyzer for counting particles in urine
- Reference Values and Biological Variations
- Estimation of the allowable total error of the absolute CD34+ cell count by flow cytometry using data from UK NEQAS exercises 2004–2024
- Establishment of gender– and age–related reference intervals for serum uric acid in adults based on big data from Zhejiang Province in China
- Cancer Diagnostics
- Tumor specific protein 70 targeted tumor cell isolation technology can improve the accuracy of cytopathological examination
- Cardiovascular Diseases
- Diagnostic performance of Mindray CL1200i high sensitivity cardiac troponin I assay compared to Abbott Alinity cardiac troponin I assay for the diagnosis of type 1 and 2 acute myocardial infarction in females and males: MERITnI study
- Infectious Diseases
- Evidence-based assessment of the application of Six Sigma to infectious disease serology quality control
- Letters to the Editor
- Evaluating the accuracy of ChatGPT in classifying normal and abnormal blood cell morphology
- Refining within-subject biological variation estimation using routine laboratory data: practical applications of the refineR algorithm
- Early rule-out high-sensitivity troponin protocols require continuous analytical robustness: a caution regarding the potential for troponin assay down-calibration
- Biochemical evidence of vitamin B12 deficiency: a crucial issue to address supplementation in pregnant women
- Plasmacytoid dendritic cell proliferation and acute myeloid leukemia with minimal differentiation (AML-M0)
- Failing methemoglobin blood gas analyses in a sodium nitrite intoxication