Enhancing highway security and wildlife safety: Mitigating wildlife–vehicle collisions with deep learning and drone technology
-
Irene Nandutu
 ,
Marcellin Atemkeng
,
Patrice Okouma
,
Marcellin Atemkeng
,
Patrice Okouma

Abstract
In South Africa, it is a common practice for people to leave their vehicles beside the road when traveling long distances for a short comfort break. This practice might increase human encounters with wildlife, threatening their security and safety. Here, we intend to create awareness about wildlife fencing, using drone technology and computer vision algorithms to recognize and detect wildlife fences and associated features. We collected data at Amakhala and Lalibela private game reserves located in the Eastern Cape province of South Africa. We used wildlife electric fence data containing single and double fences for the classification task. Additionally, we used aerial and still annotated images extracted from the drone and still cameras for the segmentation and detection tasks. The model training results from the drone camera outperformed those from the still camera. Generally, poor model performance is attributed to (1) over-decompression of images and (2) the ability of drone cameras to capture more details on images for the machine learning model to learn as compared to still cameras that capture only the front view of the wildlife fence. We argue that our model can be deployed on client-edge devices to inform people about the presence and significance of wildlife fencing, which minimizes human encounters with wildlife, thereby mitigating wildlife–vehicle collisions.
1 Introduction
Wildlife fencing systems are popular in Africa and used extensively to minimize wildlife–vehicle collision (WVC) cases [1]. The fences are advantageous since they reduce (1) threats to wildlife from direct human activities, (2) conflict between people and wildlife, and (3) zoonotic diseases [2]. Fences can also bring about challenges, particularly when they are (1) too low, enabling wildlife to jump over easily; (2) or have loose wires and/or wires spaced too closely together; and (3) are difficult for fleeing animals or birds to see, creating a barrier to wildlife [3]. Barriers of fences to wildlife are (1) limiting foraging opportunities, (2) interfering with connectivity, and (3) failure to easily find new social groups [1]. This study captures wildlife fences from South Africa’s national routes (N2). The implemented fences are either double or single wildlife fences, and the reserves are fenced following South African laws and regulations [4]. The implemented wildlife fences are: (1) single and double fences without electricity, meaning no dangerous animals on the property (i.e., game reserve); (2) the double fences ensure double protection for escaping wildlife from accessing roads. The property owners would have time to rescue the animal before it runs through the highway fence, and (3) the single and double fences can also be electric, meaning that dangerous animals such as lions (Panthera leo) and leopards (Panthera pardus) exist in the property, and road users’ are expected to be aware of such while using roads.
Taking extra precautions when traveling on national roads might lead to a reduction of WVC cases and human deaths. The death rates on highways are worrying in Sub-Sahara Africa [1,5] and South Africa [6] because of the high numbers of roadkills on highways [7]. In addition, the lack of awareness about the presence and absence of wildlife near national roads could prompt road users to come out of their vehicles for a short comfort break, making them vulnerable to attacks from dangerous animals that have escaped the fenced property. Generally, the high numbers of WVC continue escalating with extreme cases recorded in both developed [8–10] and underdeveloped [5,6,11] countries. These elevated collisions have damaged properties, wildlife, and human lives and are very costly to the economy [12]. Identifying ways to minimize these roadkill cases is paramount. Lately, authors are solving this issue by using modeling and prediction [7] and traditional systems such as overpasses, underpasses, and fencing [13]. On the contrary, intelligent systems using sensors have also been deployed on highways in developed countries to minimize wildlife mortality rates [14]. The intelligent systems are break-the-beam [15], area cover [16], and buried cable [17] wildlife detection systems. The intelligent systems detect the presence of wildlife and alert the driver about wildlife on the road before a driver arrives at or near the WVC area.
Detecting WVC incidences is well attempted in the Northern hemisphere using intelligence systems. In other studies, WVC location detection using classification and clustering algorithms has failed to show acceptable results [18]. These challenges are solved using time series analysis linear models such as autoregressive integrated moving average (ARIMA) and autoregressive moving average, which have outperformed state-of-the-art models [19]. So far, work on WVC prediction and time series analysis is ongoing [20,21], and witnessed in Africa and South Africa [7,22]. However, findings show that these ARIMA models have some shortcomings that need to be addressed, and a research gap still exists in this area for future researchers. Some of these shortcomings are the failure to detect a false presence (or absence) of roadkill location and bias in spatial road mortality patterns. Due to weaknesses in previous techniques, especially those applicable in South Africa [14] in detecting roadkill areas, we propose and use a novel technique that could alert drivers of the presence of wildlife using a traditional fencing system and computer vision techniques to detect wildlife fences and wildlife fence features. This work is twofold: (1) we classify and recognize if a wildlife fence is a single or double fence, and (2) to minimize noise, we segment wildlife fence insulators as an approach that detects electric wildlife fences.
In this study, we associate areas with wildlife fences and wildlife fence insulators as unsafe for people to get out of their vehicles, and drivers should proceed cautiously. Avoiding human encounters with wildlife and WVC incidents helps alert residents and tourists about the safety and security of a neighborhood, which contributes to improving visitors’ safety and minimizing WVC cases. We want to eliminate WVC cases using a cost-efficient yet reliable alternative to intelligence systems. We do this by feeding the annotated insulators and their corresponding masks to the U-Net model and fine-tune and concatenate U-Net output prediction. The predictions are then fed into OpenCV to detect insulators on wildlife fences. In addition, single and double fences are input in a classification algorithm to recognize fences. The U-Net, together with OpenCV, is characterized by less cost, high-level efficiency, and huge economic benefits [23]. U-Net is a popular segmentation algorithm used in medical imaging [24]. This architecture is adopted in this work to identify and detect areas where the wildlife fence electrocution and roadkill of wildlife are popular. OpenCV is known as a platform-agnostic library used to develop real-time computer vision applications. The platform focuses on processing images, captures videos, analyzes them and finally detect faces and objects [25]. In addition, classification techniques applied to wildlife fencing are convolutional neural networks (CNN) and ResNet. The data collected for this study comprises two datasets, namely, aerial and still images. In this article, we assessed the prospect of using still and aerial fence images to minimize wildlife encounters with humans and therefore improve safety and security of tourists and residents. Our specific objectives were to (1) determine whether wildlife fence and electric fence insulators extracted from still and aerial images could be used as indicators to alert the presence of potential WVC areas, (2) determine whether the image and associated concatenated mask fed as input to a machine learning algorithm can detect electric fence areas with and without insulators, (3) determine whether the wildlife fence images fed in a classification algorithm can recognize single and double fences, and finally, (4) determine whether OpenCV would detect the electric fence regions with insulators segmented by the machine learning algorithm. Given that wildlife fences and also insulators are unique features on South African highways, we predicted that they would serve as a reliable indicator of informing tourists and citizens about the possible presence of wildlife in the vicinity by sending alerts. This is significant because it detects wildlife fences in real-time, contributing to mitigating WVC and improving tourists’ security and safety around game reserves. Additionally, each time a driver detects possible WVC areas, the client should allow them to save the fence image and global position system (GPS) coordinates. The dataset can further be incorporated into maps or GPS to predict possible WVC areas and alert drivers on the presence of wildlife on highways via GPS. Alternatively, this algorithm can be deployed in self-driving cars. The images captured by drivers should be used to retrain the model and improve performance via reinforcement learning. Argumentatively, the proposed approach has not been applied before in detecting wildlife fences to mitigate WVC.
The structure of the work is as follows: Section 2 discusses tourists’ security and safety issues as well as strategies to minimize the issues, existing techniques for detecting WVC areas and proposes a new technique to detect WVC areas, and finally, WVC prevention. Section 3 discusses the structure of a wildlife fence and the associated components. Section 4 discusses the study’s materials and methods. Section 5 discusses the deep learning models used and optimization. Section 6 discusses the evaluation metrics. Section 7 provides the model experiments and results, and Section 7.5 discusses the significance of the results, while Section 8 proposes future works and concludes the study.
2 Relevance of the work
2.1 Tourist security and safety
Tourism is a competitive business, with a core objective of attracting tourists and consequently influencing their tourism destinations. A tourism destination is a specific location that contains attractions that improve visitors’ travel experiences [26]. In South Africa, the competitive advantage of the tourist sector is popularly backed by science, technology, information, and innovation. The conservationists in this country focus on managing natural resources by creating innovative solutions that contribute to fostering tourist destinations. In this regard, South Africa has a well-connected network of 6.3% national parks and private nature reserves [27]. The latter trend is great because it meets the demands of environmentally sensitive visitors. Even though a conducive environment is implemented for tourists in most of these parks, several factors limit the tourism industry’s effectiveness in South Africa, including (1) fewer funds allocated to the tourism sector; (2) limited merging of local communities into tourism; (3) inadequate education, training, and awareness concerning tourism; and (4) tourism security and safety. These challenges discourage potential tourists from visiting South Africa, negatively reducing tourism demand and leading to low tourist destinations. To minimize the challenges, the Western Cape government of South Africa implemented a six-leveler strategy for tourism safety, and these are: (1) a tourism safety forum, which forms a formally structured, multi-stakeholder, and collaborative safety forum; (2) establishing a multi-stakeholder enforcement task team; (3) provision of tourists safety response by providing assistance and supporting tourists while in distress; (4) to identify and develop tourists safety and security technology platform that can act as an enabler to help address and solve core tourists safety risks; (5) to develop a tourism safety comprehensive communication strategy that integrates all important stakeholders; (6) tourism safety interventions and partnerships by identifying synergies that enable funding of cross-platform initiatives and skills developments. Our work implements strategy four of the Western Cape government, one of the provinces of South Africa, which proposes to innovate a technology platform that helps address tourists’ safety and security risks [28]. We note that tourism security is a major constraint to overseas tourism growth. Safety and security considerations are important aspects of increasing tourism destinations in a country. The success or failure of the destination of tourists depends on the possibility of providing a safe and secure environment for visitors [29]. This study seeks to improve the safety and security of tourists on highways by intervening using artificial intelligence algorithms to minimize wildlife encounters with tourists. Tourists on South African highways need to be made aware of the presence of wildlife fences because some visitors tend to get out of their vehicles near demarcated wildlife places to enjoy the scenery with no idea that some places have dangerous wildlife. Argumentatively, the machine learning algorithms developed in this study can be incorporated into maps and deployed on car dashboards or driverless cars to automatically detect a wildlife fence and record and save the GPS coordinates and other parameters. The purpose of this work is to inform tourists of the presence of wildlife and wildlife fencing, providing security by minimizing encounters between wildlife and tourists, which finally leads to the mitigation of WVC.
2.2 Wildlife roadkill area detections
Roadkill areas vary, spatially and temporally [30]. Researchers in developed economies use intelligent animal detection systems (ADSs) [15–17, 31–44] to detect roadkill areas. These systems are usually costly, and unaffordable to African governments, thus, limiting their implementation in Africa. Popularly, in time series analysis, the roadkill areas are detected using latitude and longitude coordinates collected by researchers and highway maintenance personnel. However, these detected roadkill areas tend not to align well with sites of most serious animal crossing attempts due to imperfect detections [45]. To address the weakness of imperfect detections and the failure of African governments and organizations to implement a cheaper and novel approach for mitigating WVC, we propose and design an artificial intelligence mitigating strategy using classification and segmentation techniques to detect wildlife fences and their associated features called insulators in WVC locations. The algorithms can further be deployed on client-edge devices to assist drivers in detecting fences when driving the car. The camera can see the wildlife fence image and save the GPS coordinates. Further, such a dataset can be integrated into maps and GPS satellites to predict and visualize future WVC locations to drivers’ devices far away before they arrive at a WVC location. Such solutions should be ethically aligned to ensure no harm is caused to animals and humans [46].
2.3 WVC prevention
The WVC is a global problem that has escalated in developed and developing countries. United States registers 1,500,000 WVC cases, and Canada experiences the death of 4–8 animals per day [8]. In South Africa in 2015, the greater Mapungubwe transfrontier conservation area record shows 36 and 991 WVC on unpaved and paved roads, respectively [6]. To prevent WVC, mitigation measures are implemented. These are overpasses, underpasses, wildlife fencing, break-the-beam [15,31–34], area cover [15,16,31,35–38], buried cable [17,39,40], driver assistance [41], autonomous vehicles [42], and mobile mapping ADSs [43,44]. Intelligent systems are popular in developed countries and these are not implemented in South Africa.
In this study, we propose and implement a novel mitigation measure that is suitable for the South African economy. It is cheaper and uses existing client-edge devices such as car dashboards and mobile phones. The measures use wildlife fencing, drone technology, classification, and segmentation algorithms to detect wildlife fences and the associated features. The algorithm can be incorporated into maps to detect fences and alert tourists and drivers about wildlife fences on highways. This approach improves the security and safety of tourists and wildlife. In addition, it mitigates WVC.
3 Wildlife fencing
Wildlife mortality rates are prevalent in places without traditional mitigation roadkill structures such as the wildlife fences [22]. Even in areas with implemented wildlife fencing systems, the wildlife persistently jumps over the fence and collides with cars leading to more cases of WVC [47]. Engineers have adopted the installation of electric fences to help mitigate the alarming WVC cases. In designing electric fences, they use a stand-alone fence or in conjunction with other fence types [48]. In most applications, the fences contain energizers that use batteries recharged from solar panels or wind turbines [48]. The fences also contain high-tensile electric wire fences with wooden, metal, or plastic stands (insulators), as shown in Figure 1(a). For an electric wire to work effectively, it requires a set of components such as a charging system, power source, regulator, energizer, earth system, conductor, reels, posts and stakes, and insulators. The plastic standoffs (insulators) are attached to wooden, metal, or plastic posts [48].

Structure of wildlife fence showing how electric fence works with components such as in (a) as well as in the solar panel (b) and in wind turbine (c). Source: Created by the authors.
The charging system or power source is composed of the solar panel and wind turbine as shown in Figure 1 (c) and (b), respectively. We note that the wind turbine has a generator and an oscillator that converts the mechanical energy generated by wind to electrical energy. Power is generated by solar panels through converting sunlight into electricity. Another power source is the battery charged by the solar panel or wind turbine. These two charging systems (wind turbine and/or solar panel) produce the voltage and store it in the battery. The stored energy is later used in case of limited energy. The black cable from the wind turbine or solar panel carries or transmits the voltage to the regulator.
The regulator, which is a white box on the left in Figure 1(b) near the solar panel and Figure 1(c) near the wind turbine, controls the voltage needed to stop the animals from jumping over the fence (this may result in fatalities if animals are not rescued on time). For example, assume that the wind turbine generates 50 volts or 10 volts, and if the system needs 24 volts, the regulator will reduce the volts from 50 to 24 volts or increase the volts from 10 to 24 volts. The volts from the regulator are transmitted to the energizer (three white boxes) shown in Figures 1(a)–(c) through the black cable. The energizer has an earthing system composed of blue and red cables, which allows the transfer of electronics to and from the fence. The energizer achieves the former by pushing an electrifying pulse through the red wire to the fence; the pulse travels through the conductors and puts pressure (measured in volts) on the fence to attain excess electrons. These electrons complete the cycle by traveling through the animal up to the soil whenever an animal touches the fence. The electrons exit the animal and travels through the ground back to the energizers’ ground rod (blue cable). The blue cable contains the shock effect. The shock effect is invoked when an animal stands on the ground and touches electrified wires; this shock enables the animal to leave the fence, hence preventing electrocution.
Conductors or wires are equally an essential component of the fence as they conduct electricity along the fence line. Some examples of a conductor are steel wires. Also, reels are known for reducing the required time to dismantle a fence. A wildlife fence commonly adopt using wooden posts with attached insulators which prevent the conductor or wire to stay in contact with the posts or stakes, which minimizes the risk of power leakage [49]. A good insulator is vital in maintaining the fence’s performance. In this study, we use wildlife fences and insulators, a feature of a wildlife electric fence, to represent possible WVC areas where there is a concentration of wildlife. We feed the annotated insulators and their corresponding masks to the U-Net model, fine-tune, and concatenate U-Net output prediction. Next, the predictions are fed into OpenCV to detect insulators on wildlife fences.
4 Data collection and annotation
4.1 Study area
We took the images used in this study at Amakhala and Lalibela Private Game Reserves located in the Eastern Cape province of South Africa (Figure 2). These game reserves are located on the highways on a flat and low terrain surrounded by green vegetation. We captured images of the experimental site using a drone and still cameras. To capture aerial images, a DJI Phantom 4 Pro UAV drone was used, and Nikon Z6 Mk 2 still camera helped in capturing still images. The Nikon Z6 Mk 2 contains a 24.5MP FX-Format BSI CMOS Sensor, and Actual: 25.28 Megapixel, with effective: 24.5 megapixel
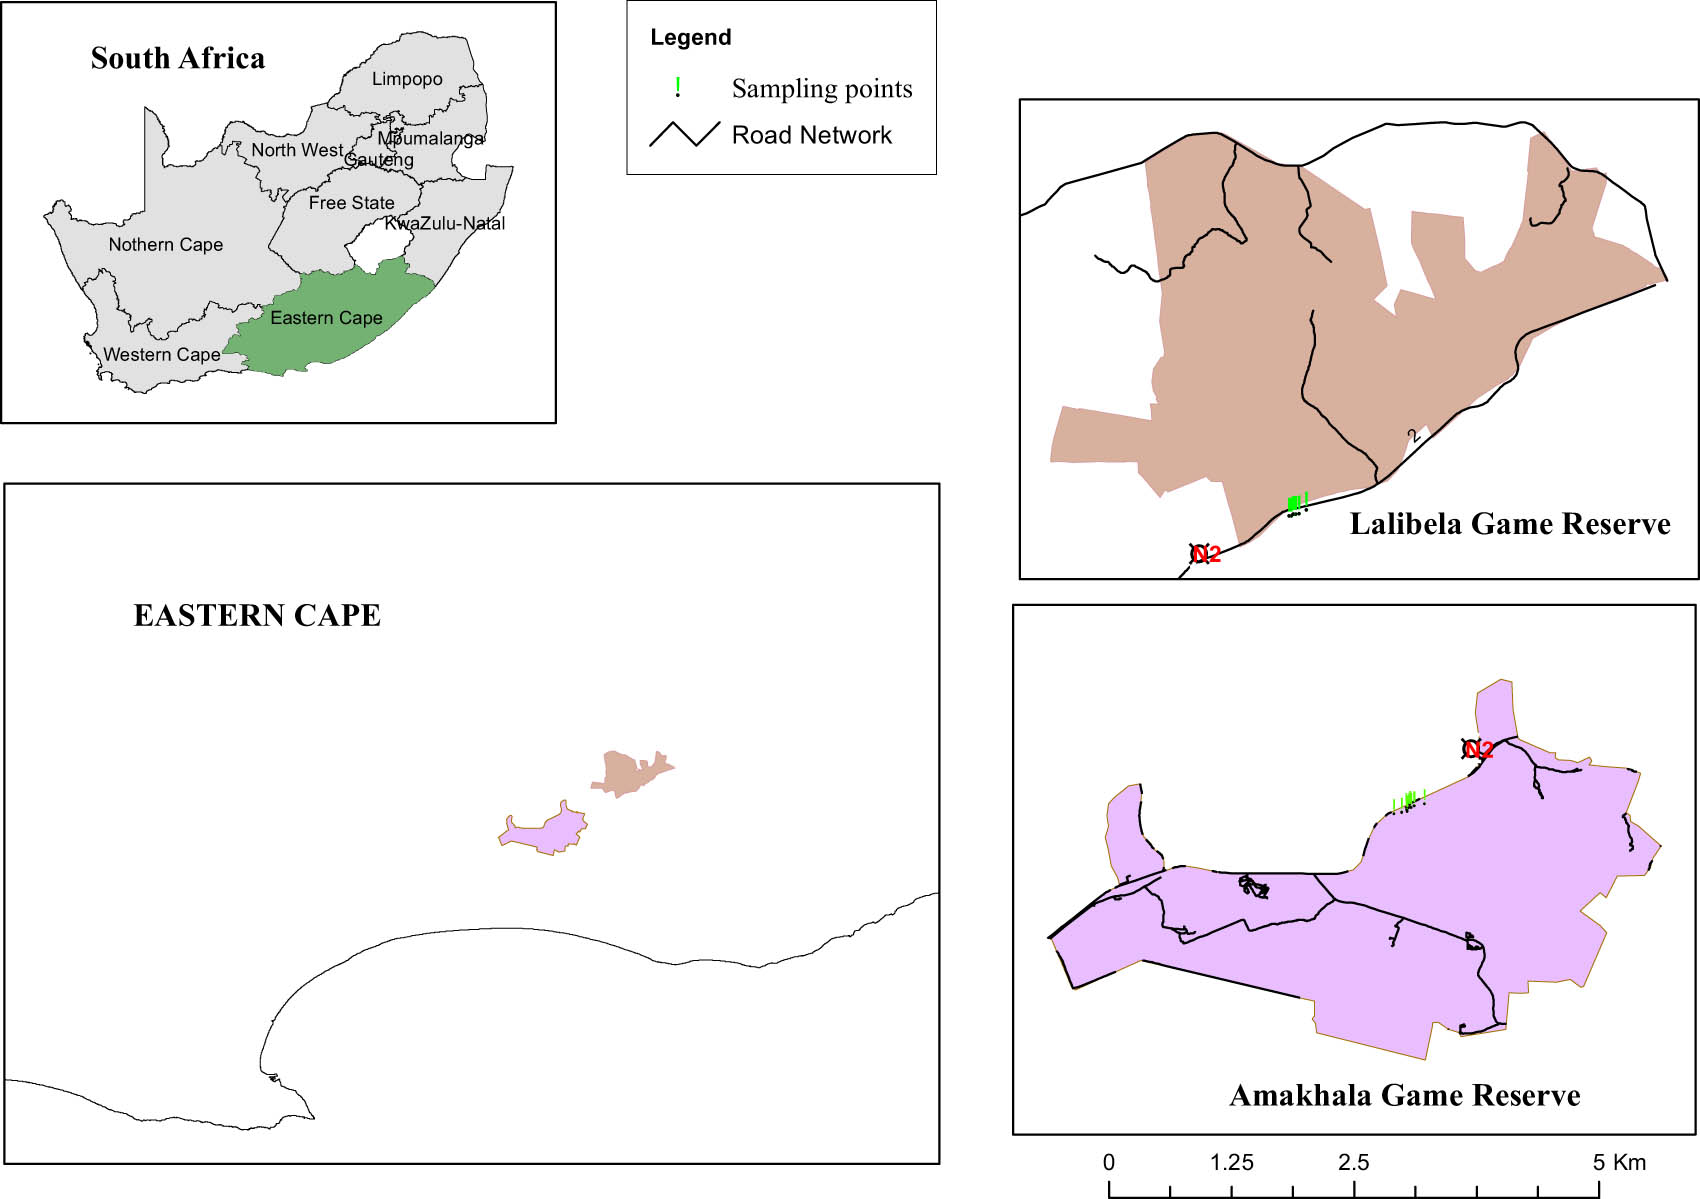
The Amakhala and Lalibela game reserves, Eastern Cape Province, South Africa, showing sampling points in green. Source: Created by the authors.
4.2 Data acquisition
The data collection comprised three co-authors and one UAV pilot who captured the aerial and still photographs. The photographers captured scenes of wildlife fences based on the research objective. Researchers stated the key features to focus on while photographing the wildlife fences. The data collected contains 52 and 159 images from the drone and still cameras, respectively, as shown in Table 1. For both devices, we stored the photos in .jpeg format. Aerial images contain a height of 5,904 and width of 3,933 pixels. Still, images have a height of 5,904 and width of (3,928 or 3,936) pixels. In both image datasets, we observe very high-resolution pixels.
RAW data collected on wildlife N2 fence and used for data augmentation
| Dataset name | Camera type | Fence type | Images | Description |
|---|---|---|---|---|
| Aerial dataset | Drone | Single fence | 26 | Single fences from drone camera |
| Double fence | 26 | Double fences from drone camera | ||
| Still dataset | Standalone | Single fence | 79 | Single fences from standalone camera |
| Double fence | 80 | Double fences from standalone camera | ||
| Total | 211 |
4.3 Data preprocessing and annotation
The images were in image file format – RAW. This file type is uncompressed and commonly captured by digital cameras and sensors. We processed the images from RAW files to JPEG file format using Adobe Photoshop to convert the format and filter the converted images, totaling 211 from UAV and standalone cameras.
For the classification task, the images were compressed to equal dimensions of 512 pixels by 512 pixels. In both datasets, the images were saved in separate folders. The still dataset contained images captured by the standalone camera; the drone captured aerial images of wildlife fences from the sky. The drone camera images used in this study were 26 from the single fence and 26 from the double fence. We had 159 images from a standalone camera containing 79 single and 80 double fence images (Table 1). In Figure 3, we visualize a random sample of images from our dataset and deploy it on mendeley [50]. Because of a few samples, there was a need to expand the training image size to improve model accuracy. Techniques of data augmentation were implemented in the training dataset sample. The techniques made variations to the training sample, avoiding overfitting, and increasing robustness [51]. Data augmentation transformations applied in this study include horizontal flips, vertical flips, random crops, and a small Gaussian blur of approximately 50% of the total images sample with a random sigma of between 0 and 0.5, strengthening or weakening the contrast in each image. We also added some Gaussian noise per pixel and channel by sampling only 50% of all images; this can change not only the color but also the brightness of the pixels. Further, we brightened and darkened some images by sampling 20% of the images of all cases. Each channel is sampled with the multiplier, which leads to the changed color of the images. Finally, affine transformations are applied to each image by scaling, zooming, translating, moving, rotating, and shearing them. All the augmentations performed were applied randomly. From Table 1, 15 Images (from aerial) and 47 Images (from still) were removed and kept aside as a test set; later, the images were used for testing the model. The remaining images in Table 1 were augmented to generate the training and validation sets in Table 2.
![Figure 3
Random samples from wildlife fences datasets for Classification Task [50].](/document/doi/10.1515/jisys-2024-0219/asset/graphic/j_jisys-2024-0219_fig_003.jpg)
Random samples from wildlife fences datasets for Classification Task [50].
Data augmented and used for training machine learning models
| Dataset name | Camera type | Fence type | Images | Total | Train | Validation | Test (from Table 1) |
|---|---|---|---|---|---|---|---|
| Aerial dataset | Drone | Single fence | 75 | 150 | 135 | 15 | 15 |
| Double fence | 75 | 150 | 135 | 15 | 15 | ||
| Still dataset | Standalone | Single fence | 237 | 474 | 427 | 47 | 47 |
| Double fence | 237 | 474 | 427 | 47 | 47 | ||
| Total | 624 | 1,248 | 1,124 | 124 | 124 |
For the segmentation tasks, the original JPEG images have high-resolution pixels as described in Section 4.2. In our observations, the wildlife fence images contain a lot of noise, such as grass and trees, compared to the fence itself. Besides, these images are enormous for machine learning models to process. To minimize the noise, we cropped out noisy parts of the images to
![Figure 4
Split the original image into smaller images of
512
×
512
512\times 512
pixels. Discard images with no insulators and retain images with insulators for further processing [50].](/document/doi/10.1515/jisys-2024-0219/asset/graphic/j_jisys-2024-0219_fig_004.jpg)
Split the original image into smaller images of
To build the ground truth mask of the insulators, we used the Visual Geometry Group (VGG) Image Annotator (VIA) [52]. The VIA was used to define regions and textual descriptions of the regions. The annotated images were saved in a .json extension file containing the coordinates of the insulators. In this task, each sliced image of a wildlife fence insulator was annotated to label insulators as positive regions. The rest of the objects in the image were labeled as negative regions. The positive regions were identified as 1, and the negative regions were identified as 0, which gave us a gray-scaled image as an output or binary mask. The results from the annotations were image masks for each insulator found on the wildlife fence. Since VIA output had smaller images with a single insulator, to reconstruct a larger image containing all insulators in an image, we concatenate them, as shown in Figure 5 and Algorithm 1.
![Figure 5
Input the sliced
512
×
512
512\times 512
pixel image for annotation to generate individual masks for each insulator in the image, later we combined the individual masks to resemble the original image [50].](/document/doi/10.1515/jisys-2024-0219/asset/graphic/j_jisys-2024-0219_fig_005.jpg)
Input the sliced
The generated pairs of
Data reconstructed after slicing, containing images with insulators and annotated masks fed as input to the U-Net model
| Dataset name | Images | Description |
|---|---|---|
| Aerial dataset | 447 | Wildlife fences insulator images and masks from drone camera |
| Still dataset | 686 | Wildlife fences insulator images and masks from still camera |
| Total | 1,033 |
Figure 6 shows all the processes described above, i.e., from fieldwork for data collection, to the implementation of the recognition and detection models then the testing from field data.

Proposed methodology: The process shows the proposed pipeline from the recognition and detection implementation to the test from field data. Source: Created by the authors.
| Algorithm 1 An algorithm for image annotation and mask concatenation |
|---|
|
|
|
|
|
|
|
Input:
|
|
Output:
|
|
|
|
|
|
|
|
|
|
|
|
|
|
|
|
|
|
|
|
|
|
|
|
|
|
|
|
|
|
|
|
|
|
|
|
|
|
|
5 Deep learning and optimization
5.1 CNNs
CNNs have input and output layers, with hidden convolutional layers, pooling layers, and a fully connected layer placed in between. The layers are composed of neurons that contain learnable weights and biases. Each neuron takes in respective inputs, computes a weighted sum by passing it through an activation function, and returns an output [53]. The CNN’s are used to classify images by learning intrinsic image features, clustering these images by similarities, and finally, performing object recognition. A CNN takes in images as input and allocates importance by applying the learnable parameters (weights and biases) to several features in the image, and by doing so, it can differentiate one image from the other [54].
5.2 Transfer learning ResNets
This study leverages transfer learning using the wildlife fences dataset. An approach is known for developing novel applications in image classification, detection, localization, and segmentation tasks. In attempting to improve the performance of CNNs, a transfer learning approach was introduced. Transfer learning technique in machine learning is when we pre-train a model on a given dataset and then re-used it as a building block in a related task [55]. Transfer learning has registered successfully in many applications in machine learning, including image classification [56], image localization and detection [57], as well as image segmentation [58], and has led to the development of CNN models that offer a much greater performance [55,59]. Examples of large transfer learning models include VGG, GoogleNet (Inception), and Residual Network (ResNet). In this study, we adopted ResNet50 architecture because of its power of skip connections that eliminates the vanishing gradient problem. We draw upon these works during model development and tuning hyperparameters when fitting the training data to each binary classification model, as it suggests overfitting is a common issue when transferring learning to validation and testing sets. The ResNet was developed to overcome some challenges experienced when using the initially created transfer learning models. These common challenges include problems with degradation, network optimization, and vanishing or exploding gradient issues. The ResNet50 model uses the concept of shortcut or skipping in the CNN to carry out the task [60,61]. ResNet has shown great performance when applied to computer vision tasks.
5.3 U-Net for segmentation
The architecture of the U-Net network consists of an encoder (downsampler) and decoder (upsampler) with a bottleneck connecting the encoder and decoder [24]. Skip connections join encoder outputs to each stage of the decoder. The decoder or contracting path contains a convolutional network with alternating convolutions of
where
![Figure 7
U-net architecture has arrows that shows the direction of the different operations. Feature maps are represented at each layer using the blue boxes. Cropped feature maps are in the light gray boxes. The gray boxes are from the contracting path and dark gray represents the output image channels. Source: Re-created by the authors [24].](/document/doi/10.1515/jisys-2024-0219/asset/graphic/j_jisys-2024-0219_fig_007.jpg)
U-net architecture has arrows that shows the direction of the different operations. Feature maps are represented at each layer using the blue boxes. Cropped feature maps are in the light gray boxes. The gray boxes are from the contracting path and dark gray represents the output image channels. Source: Re-created by the authors [24].
5.4 Optimization via meta-learning
We adopted the transfer learning and a meta-learning type of optimization because we had a small dataset. The idea of finding the optimized deep models
where the vector
where
Here,
6 Evaluation metrics
6.1 Confusion matrix
The study focused on solving a binary classification problem by evaluating the optimal solution that predicts whether the wildlife fences are either single fences or double fences based on the characteristics of the wildlife fences. The evaluations were done during training and considered confusion matrix [62].
where
where
where
where
Macro-averaging, computes the average metric across classes without considering class frequency.
where
The weighted averaging accounts for class frequency by adjusting the influence of each class on the overall metric
where
7 Experiments and discussion
All experiments in this article were performed using a computer equipped with an Intel(R) Xeon(R) CPU E5-2695 v2 @ 2.40 GHz computing unit, INTEL graphics INTEL 7 CPU for classification, segmentation, and detection tasks. We used the Keras framework with a Tensorflow backend. Results using state-of-the-art networks are compared for all datasets.
7.1 Recognition of wildlife fences using aerial and still datasets
Table 4 shows the number of parameters for the different classification architectures used in this article. We observed that models with less parameters outperformed models with a bigger number of parameters. We also argue that models with smaller hard disk space are easily deployed on mobile clients compared to bigger models, which are usually slow, the CNN model achieved a classification test accuracy of 73% in aerial images and 82% in still images (Table 5). However, the ResNet model showed a better performance on the test set of 100% on aerial images and 95% on still images. This is justified by the transferable capabilities of ResNet from one adaptation domain to another, and their robustness to operate on small datasets. Results indicate that the CNN model performed poorly compared to ResNet. However, results also show that CNN performed better on aerial images than on still images, and ResNet performed competitively on both aerial and still images. Therefore, we recommend using transfer learning on the N2 wildlife fences dataset compared to CNN’s because transfer learning architecture performs better than CNN. In addition, the test accuracy using CNN was generally higher than train and validation accuracy. We attribute this to the small dataset used in this study and the inability of the CNN model to be robust compared to ResNet. Due to these weaknesses, we computed more metrics such as confusion matrix, precision, recall, F1-score, and support, with their associated average accuracy, macro average, and weighted average.
Data reconstructed for segmentation and detection tasks
| Dataset name | Model | Disk size (MBs) | Parameters |
|---|---|---|---|
| Aerial | CNN | 354.0 | 29,492,922 |
| Aerial | ResNet | 101.3 | 24,125,208 |
| Still | CNN | 393.3 | 32,769,882 |
| Still | ResNet | 101.3 | 24,125,208 |
Results from the classification task for both aerial (dataset 1) dataset as well as still (dataset 2) dataset
| Dataset name | Model | Train acc (80%) | Train loss | Val acc (10%) | Val loss | Test acc (10% | Test loss |
|---|---|---|---|---|---|---|---|
| Aerial | CNN | 74.81 | 0.6654 | 73.33 | 6579 | 73.33 | 0.7006 |
| Aerial | ResNet | 100 | 4.6209e-06 | 100 | 0.0054 | 100 |
|
| Still | CNN | 72.37 | 0.5996 | 61.70 | 1.1490 | 82.98 | 0.3767 |
| Still | ResNet | 100 | 1.6472e-08 | 97.87 | 0.0275 | 95.74 | 0.3922 |
The confusion matrix in Figure 8(a)–(d) corresponds to the results from aerial images with CNN, aerial images with ResNet, still images with CNN, and still images with ResNet, respectively. Figure 8(a) shows

Four confusion matrix showing (a) images from drone classified using CNN, (b) images from drone classified using ResNet, (c) images from standalone camera classified using CNN, and (d) images from standalone camera classified using ResNet. The images the model made predictions on are the test data. Source: Created by the authors. (a) Aerial, CNN, (b) Aerial, ResNet, (c) Still, CNN, (d) Still, ResNet.
As in Table 6, the CNN model achieved a classification average accuracy of 73% on aerial images and 83% on still images. However, the ResNet model performance is of 100% on aerial images as well as 96% on still images. Generally, the classification models performed better on aerial images than still images because the drone can capture wildlife fences from the front view, back view, and top view, while the standalone camera captures only the front view. Meaning drones capture more details of the fence and its associated features as compared to a standalone camera. Based on these results, we recommend the use of transfer learning on the wildlife fences dataset as compared to CNNs when using classification algorithms. We further attribute the poor performance to the smaller datasets used for both aerial and still.
Aerial and Still datasets fine-tuned on CNN and ResNet binary classification algorithms
| Avg metrics | Dataset | Model | Fence type | Precision | Recall | F1-score | Support |
|---|---|---|---|---|---|---|---|
| Aerial | CNN | Double fence | 0.70 | 0.88 | 0.78 | 8 | |
| Single fence | 0.80 | 0.57 | 0.67 | 7 | |||
| Accuracy | 0.73 | 15 | |||||
| Macro Avg | 0.75 | 0.72 | 0.72 | 15 | |||
| Weighted Avg | 0.75 | 0.73 | 0.73 | 15 | |||
| Aerial | ResNet | Double fence | 1.00 | 1.00 | 1.00 | 8 | |
| Single fence | 1.00 | 1.00 | 1.00 | 7 | |||
| Accuracy | 1.00 | 15 | |||||
| Macro Avg | 1.00 | 1.00 | 1.00 | 15 | |||
| Weighted Avg | 1.00 | 1.00 | 1.00 | 15 | |||
| Still | CNN | Double fence | 0.77 | 0.96 | 0.85 | 24 | |
| Single fence | 0.94 | 0.70 | 0.80 | 23 | |||
| Accuracy | 0.83 | 47 | |||||
| Macro Avg | 0.85 | 0.83 | 0.83 | 47 | |||
| Weighted Avg | 0.85 | 0.83 | 0.83 | 47 | |||
| Still | ResNet | Double fence | 0.92 | 1.00 | 0.96 | 24 | |
| Single fence | 1.00 | 0.91 | 0.95 | 23 | |||
| Accuracy | 0.96 | 47 | |||||
| Macro Avg | 0.96 | 0.96 | 0.96 | 47 | |||
| Weighted Avg | 0.96 | 0.96 | 0.96 | 47 |
The wildlife single and double fence class evaluations are precision, recall, F1-score, support, average accuracy, macro average, and weighted average.
7.2 Prediction and detection of wildlife fence insulators
On average, 12 days and 2 h were spent on training the aerial and still datasets. During training of the model, the loss, MIoU, accuracy, and dice coefficient were computed on the training and validation datasets for each training epoch. The parameters that were in the final epoch while training are considered the training results. All the parameters of the training step were stored in a dictionary with keys and values, and those values are retrieved and used for plotting the graphs. These graphs were used to evaluate the performance of the model. The model was considered good if the epoch vs accuracy graph was exponential and if the epoch vs loss graph was a hyperbolic curve. Figures 9 and 10 showed the loss, MIoU, accuracy, and dice coefficient curves of the aerial and still datasets, respectively. Figure 11 shows the impact of batch size on model performance. In both datasets (Table 7), the loss curves show some slight oscillations when computing the loss, accuracy, and dice coefficient metrics; these were related to the set small mini-batch size. We note that the network fails to find the optimal convergence direction at the early stage of training. On observing the loss curves, gradually, the network stabilizes whenever we have a continuous network training, which obtains results in Table 7. We also note that the dice loss, often set as the negative Dice coefficient, measures the similarity between the prediction and truth. Reducing the negative Dice coefficient (Dice loss) corresponds to maximizing the Dice coefficient, meaning that the model’s predictions match the ground truth better. This aspect helps optimize for high overlap between predictions and actual target regions.
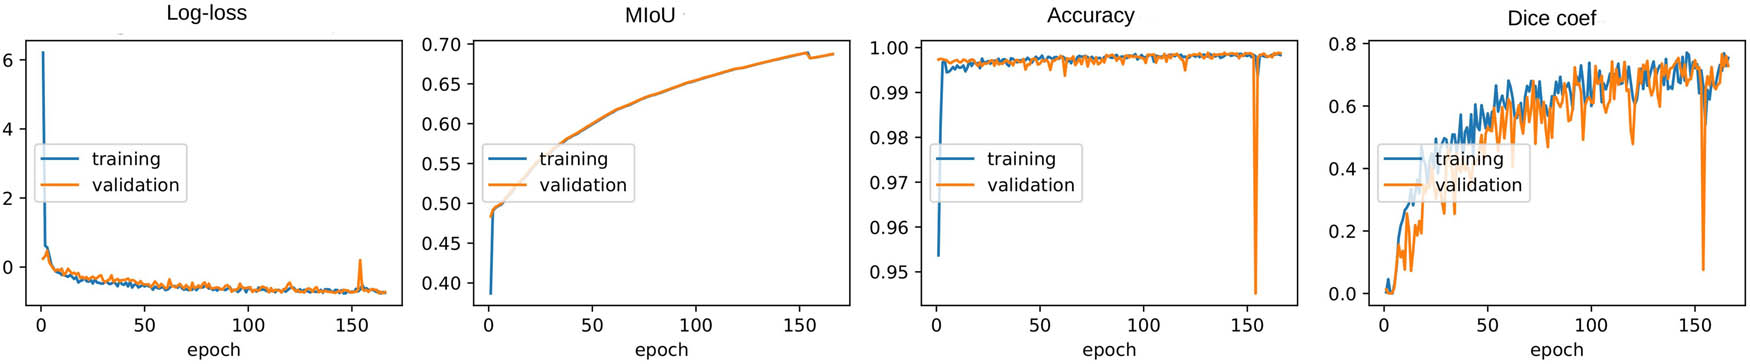
Loss, MIoU, accuracy, and dice curves of the aerial image dataset model. Source: Created by the authors.

Loss, MIoU, accuracy, and dice curves of the still image dataset model. Source: Created by the authors.

The impact of 16 batch size and 8 batch size on the performance of the U-Net model. Accuracy looks stable among the aerial and still datasets and along the 16 and 8 batch sizes. However, we see that the MeanIoU and Dice coefficients are penalized when using the Still dataset compared to the Aerial dataset. This is due to how strict the MeanIoU and Dice Coefficient metrics are, which are more precise measures of segmentation performance by focusing on overlap in the regions of interest. Source: Created by the authors. (a) Aerial, Params and (b) Aerial, Params.
Prediction results on training, validation, and testing dataset samples
| Dataset | Dataset sample | Batch size | Loss | Mean IoU | Accuracy | Dice coefficient |
|---|---|---|---|---|---|---|
| Aerial | Train | 16 |
|
0.6776 | 0.9980 | 0.6361 |
| 8 |
|
0.6442 | 0.9974 | 0.5768 | ||
| Val | 16 |
|
0.7322 | 0.9987 | 0.7066 | |
| 8 |
|
0.6989 | 0.9977 | 0.5793 | ||
| Test | 16 |
|
0.7345 | 0.9982 | 0.6771 | |
| 8 |
|
0.6992 | 0.9981 | 0.6378 | ||
| Still | Train | 16 | 22.7265 | 0.4602 | 0.9684 | 0.0053 |
| 8 |
|
0.5017 | 0.9646 | 0.1872 | ||
| Val | 16 | 22.7265 | 0.4857 | 0.9698 | 0.0097 | |
| 8 |
|
0.5405 | 0.9678 | 0.1644 | ||
| Test | 16 | 19.7826 | 0.4856 | 0.9740 | 0.0047 | |
| 8 |
|
0.5388 | 0.9704 | 0.1069 |
Still, dataset performed better on small batches than on bigger batches. The aerial dataset slightly performed better on the 16 batch size than the 8 batch size. Generally, the model performed better on the aerial dataset than still images.
7.3 Mask prediction accuracy
We applied the U-Net model to the wildlife aerial image dataset and wildlife still dataset, which are labeled as insulators and not insulators. Every image of the data is RGB and has
Model prediction output is an image with each pixel in it related to a probability distribution that detects an area of interest. The output image size corresponds to the input image size. Binary pixel values were obtained by choosing a threshold of 0.5. Any pixel value below a specified threshold was set to zero, and value above the threshold was set to 1. We then multiplied the results of every pixel in an output image by 255 and got a black-and-white predicted mask. Further, for each predicted ground truth mask, we calculated the residuals. The smaller the residuals, the better the model performance, and the more the residuals, the poor the model performance, as shown in Figure 12.

Representation of actual images, ground truth masks, predicted masks, and residual masks on aerial dataset. Source: Created by the authors.
7.4 Insulator detection with OpenCV
OpenCV is an open-source library widely used for image analysis, recognition, and deep learning. The software is used exhaustively to recognize objects in photos and videos. Object detection is a subset of signal processing, big data, and machine learning focusing on identifying features in pictures and videos. In this study, images were labeled as positive and negative to train a cascade function, which was used to detect objects in images [65]. We detected insulators using OpenCV as shown in Figure 13 from the aerial dataset by finding contours defined by joining lines of all points at the image boundary with the same intensity. OpenCV uses a function findContours() to extract contours from an image that meets a specified threshold. In addition, a boundingRect() function was adopted to approximate rectangles of the blobs on an image to show the area of interest after getting the image’s contours or outer shape. This function returned four values, the x-coordinate, y-coordinate, width, and height of the blob. These values were used to draw a rectangle on the image part using pixel coordinates. A few pixels were added to these values to draw a slightly bigger box. These coordinates from mask images were inferred into the actual images to draw the borders around them. The cut-outs images and their corresponding mask images were passed through our OpenCV code to detect all the sources in the image. Later, these images were concatenated back to an original image of which borders were sketched around it, as shown in Figures 13 and 14, applied to the aerial and still images, respectively.
![Figure 13
Detected insulators on wildlife electric fence at Amakhala private game reserve from the aerial dataset [50].](/document/doi/10.1515/jisys-2024-0219/asset/graphic/j_jisys-2024-0219_fig_013.jpg)
Detected insulators on wildlife electric fence at Amakhala private game reserve from the aerial dataset [50].
![Figure 14
Detected insulators on wildlife electric fence at Amakhala private game reserve from the still dataset [50].](/document/doi/10.1515/jisys-2024-0219/asset/graphic/j_jisys-2024-0219_fig_014.jpg)
Detected insulators on wildlife electric fence at Amakhala private game reserve from the still dataset [50].
7.5 Discussion
WVC incidences are high in South Africa particulary near areas with wildlife and wildlife fences [66]. This prompts researchers to focus on measures to minimize and prevent wildlife collisions and ensure the safety of drivers, pedestrians, and other road users. It is therefore imperative that ecologists and wildlife conservationists in Africa work together to develop ways to detect WVC areas with high accuracy and low cost while minimizing the weaknesses of roadkill prediction using time series analysis, an approach currently adopted in road ecology in detecting roadkill areas. To assist the ecologists, this study automatically investigates the possibility of the U-Net segmentation algorithm, CNN, and ResNet in detecting and recognizing WVC areas. It does this by understanding the performance of CNN, ResNet, and U-Net trained on still and aerial wildlife fence and wildlife fence insulator datasets. Ultimately, for segmentation, it verifies if this was a good approach for detecting WVC fences by further drawing bounding boxes on the predicted insulators as shown in Figure 13. In addition, the ResNet and CNN recognize WVC areas using wildlife single and double fences shown on the confusion matrix in Figure 8 as well as precision, recall, F1-score, and support in Table 6. Generally, the accuracy of the models is correlated to the size of the dataset; the bigger the dataset, the higher the accuracy and vice versa [67,68]. This is un-realist in an ecological sense since large amounts of training data can not be easily produced by ecological researchers. For that purpose, we designed the U-Net model for smaller ecological wildlife fences insulator datasets and adopted ResNet for the classification task, which performs better than CNN.
Our work can uniquely combine ecological wildlife fences, wildlife fence insulator data, and deep learning techniques. The field of image recognition, especially when applied to wildlife fencing in detecting WVC areas, is still young. While most researchers have used similar methodologies, they have used them in different fields but not in detecting WVC areas using wildlife fences to minimize WVC.
Our results show that ResNet, CNN, and U-Net are successful within the ecological domain, although they also show some limitations. The algorithms, if deployed, might be a powerful and practical tool that helps ecologists extract ecological information from the wildlife fencing algorithm deployed.
7.6 Future scope
We offer a few possibilities for future work by combining traditional wildlife fencing, classification, and segmentation algorithms.
First, we acknowledge that our datasets were not normally distributed. They comprised only two privately owned game reserves located in the; Eastern Cape, South Africa. As a result, future work should repeat the data collection process, and this should include different provinces of South Africa and test the model’s generalization between the different identified locations. This will improve machine learning systems in generalizing their training data, which makes the model better in generalizing [69].
Second, deploying machine learning models to the client devices is vital, as periodically retraining the model from model staleness. Deployment has been successful in public policy [70], health [71], education [72], and banking [73]
Third, to further improve the classification accuracy of remote sensing, adopting image localization and detection algorithms might help to detect the exact location of an object in an image using algorithms such as histogram of oriented gradients, YOLO, Region-based convolutional neural networks (R-CNN), Fast R-CNN, and Faster R-CNN.
Fourth, building more images of the dataset using synthetic images will improve the performance of the model by exponentially increasing examples given to the model during training. This approach is widely used by U-Net with generative adversarial networks and is successful [74,75].
Fifth, models developed using aerial and still datasets may be continuously trained and deployed to minimize model staleness by using proactive training [76]. This approach will improve model performance and reliability by retraining the images the model provided as incorrect predictions.
Finally, we believe that the future of deep learning models relies upon developing an end-to-end wildlife fence detection system to monitor and detect potential WVC areas. The system should detect wildlife fences as WVC areas and alert the driver. Further, the system should allow the driver to save images and GPS. The collected image dataset can be used to retrain the model and the GPS will help improve the existing roadkill areas detection system by detecting future patterns and distribution of WVC areas using time series analysis.
8 Conclusion
The study aimed to evaluate the model performance of modern computer vision algorithms applied to aerial and still image datasets. For this purpose, we utilized drones and standalone cameras to obtain images of wildlife fences on N2 highways. These images were sorted as single and double fences, each associated with the device from which they originate, i.e., drone or standalone camera. For the classification task, the images were labeled and fed as input to the computer vision algorithms to recognize fences. In addition to the dataset contribution, we also conducted a study that compared state-of-the-art image-based classification algorithms and reported our experimental results in this article. We exploited CNN and ResNet50 architecture for the recognition tasks. The recognition task detects the test image as a single or double fence. For the segmentation task, our contribution is the dataset that contains segmented images and masks for wildlife electric fence insulators. Our proposed approach to detecting fences facilitates the development of image segmentation algorithms with wildlife fences and their associated features. This is done by annotating the dataset, which increases the efficiency of machine learning projects in detecting areas of interest. Detecting wildlife fence features such as insulators is essential in mitigating WVC.
Generally, the classification and U-Net models performed better on aerial images than still images, even though the aerial dataset is small. This is partially true due to the variations in specific camera parameters, which are known to affect the performance and generalization of deep learning models [77]. The two camera devices, DJI Phantom 4 Pro UAV drone and Nikon Z6 Mk 2 still camera, have different parameters affecting the U-Net, CNN, and ResNet results. Also, the drone captures more details (front, back, and top views) for machine learning models to learn compared to the still camera, which captures only the front view. In addition, the images are over-zoomed or decompressed, leading to poor performance since we have much information lost. In the future, we plan to gradually enlarge our dataset for single and double fences using drones and standalone devices. We hope to make our dataset public to foster future image-based wildlife fence recognition research. Further, we will minimize the decompression of images, detect other vital features of wildlife electric fences, adopt localization and detection algorithms to detect the object location in an image, and deploy the algorithms on client devices. Besides, we shall also adopt using other segmentation techniques.
Acknowledgments
The authors would like to thank Amakhala and Lalibela game reserves in South Africa for many valuable discussions and educational help in wildlife fence features, on how wildlife fence works, and for allowing us to take photographs of the wildlife fence on highways. The authors also express sincere gratitude to HLB Photography (https://www.hlbphotography.co.za/) for providing us with a photographer and drone pilot to capture pictures.
-
Funding information: This study was carried out with financial support from Rhodes University.
-
Author contributions: Conceptualization, I.N. and M.A.; methodology, I.N. and M.A.; data collection I.N., M.A. and P.O.; data curation, I.N.; software, I.N.; validation, I.N., M.A. and M.N.; formal analysis, I.N., M.A., P.O., M.N., J.L.E.K.F. and F.T.; investigation, I.N.; writing – original draft preparation, I.N.; writing – review and editing, I.N., M.A., P.O., M.N., J.L.E.K.F. and F.T.; visualization, I.N., M.A., P.O., J.L.E.K.F. and F.T.; supervision, M.A. and P.O.; editing the document with an ecological audience in mind, I.N. and M.N.; project administration, I.N. and M.A.; funding acquisition, M.A. All authors wrote the manuscript, commented and improved it. All authors read and approved the final version of the manuscript.
-
Conflict of interest: No potential conflict of interest was reported by the author(s).
-
Ethical approval: Ethical review and approval were waived for this study by the Animal Research Ethics Committee of Rhodes University, South Africa, because the study did not involve the use of live animals and therefore did not require ethical clearance.
-
Data availability statement: The datasets supporting the findings of this study are available from the corresponding author upon reasonable request. These include: Annotated images of wildlife fences with class labels for classification tasks. Curated images of fence insulators, including pixel-level annotations for segmentation tasks.
References
[1] Pekor A, Miller JRB, Flyman MV, Kasiki S, Kesch MK, Miller SM, et al. Fencing Africa’s protected areas: Costs, benefits, and management issues. Biological Conservation. 2019;229:67–75. 10.1016/j.biocon.2018.10.030.Search in Google Scholar
[2] Durant SM, Becker MS, Creel S, Bashir S, Dickman AJ, Beudels-Jamar RC, et al. Developing fencing policies for dryland ecosystems. J Appl Ecol. 2015;52(3):544–51. 10.1111/1365-2664.12415. Search in Google Scholar
[3] Hanophy W. Fencing with wildlife in mind. XColorado Division of Wildlife; 2009. Search in Google Scholar
[4] COMMISSION SAL. Uniform National Legislation on the Fencing of National Roads; 2000. https://www.gov.za/sites/default/files/gcis_document/201409/ip16prj1192000.pdf, Accessed 15 September 2022. Search in Google Scholar
[5] Kioko J, Kiffner C, Jenkins N, Collinson WJ. Wildlife roadkill patterns on a major highway in northern Tanzania. African Zoo. 2015;50:17–22. 10.1080/15627020.2015.1021161.Search in Google Scholar
[6] Almeida A, Azkune G. Predicting human behaviour with recurrent neural networks. Appl Sci. 2018;8(2):305. 10.3390/app8020305.Search in Google Scholar
[7] Nandutu I, Atemkeng M, Mgqatsa N, Toadoum Sari S, Okouma P, Rockefeller R, et al. Error correction based deep neural networks for modeling and predicting South African wildlife–vehicle collision data. Mathematics. 2022;10(21):3988. 10.3390/math10213988.Search in Google Scholar
[8] White T. Defenders of Wildlife. Watch Out For Wildlife Facts; 2020. https://defenders.org/sites/default/files/publications/collision_facts_and_figures.pdf, Accessed 5 June 2020. Search in Google Scholar
[9] Tony C, Brian L C, Adam F, Marcel H, Bruce F L, Bethanie W, et al. Wildlife-vehicle collision reduction study: Report to congress. U.S Department of Transportation; 2008. https://rosap.ntl.bts.gov/view/dot/48824/dot_48824_DS1.pdf.Search in Google Scholar
[10] Heigl F, Horvath K, Laaha G, Zaller JG. Amphibian and reptile road-kills on tertiary roads in relation to landscape structure: using a citizen science approach with open-access land cover data. BMC Ecol. 2017;17:1–11. 10.1186/s12898-017-0134-z.Search in Google Scholar PubMed PubMed Central
[11] Collision W. Roadkill Study Highlights Wildlife Road Deaths; 2012. https://www.bridgestone.co.za/news-article/698/roadkill-study-highlights-wildlife-road-deaths, Accessed 23 April 2020. Search in Google Scholar
[12] Wheels24. Roadkill: Why so many animals die on SA’s roads; 2015. https://www.wheels24.co.za/News/Roadkill-in-SA-Distraction-not-speed-to-blame-20150422, Accessed 9 April 2020. Search in Google Scholar
[13] Collinson W, Davies-Mostert H, Davies-Mostert W. Effects of culverts and roadside fencing on the rate of roadkill of small terrestrial vertebrates in Northern Limpopo, South Africa. Conservation Evidence. 2017;14:39–43. Search in Google Scholar
[14] Nandutu I, Atemkeng M, Okouma P. Intelligent systems using sensors and/or machine learning to mitigate wildlife–vehicle collisions: A review, challenges, and new perspectives. Sensors. 2022;22(7):2478. 10.3390/s22072478.Search in Google Scholar PubMed PubMed Central
[15] Huijser MP, McGowen PT, Camel W, et al. Animal vehicle crash mitigation using advanced technology phase I: review, design, and implementation. Denmark: Montana State University; 2006. Search in Google Scholar
[16] Desholm M. Thermal animal detection system (TADS). Development of a method for estimating collision frequency of migrating birds at offshore wind turbines. National Environmental Research Institute; 2003. Search in Google Scholar
[17] Huijser MP, Haas C, Crooks KR, et al. The reliability and effectiveness of an electromagnetic animal detection and driver warning system. Colorado. Dept. of Transportation. Research Branch; 2012. https://rosap.ntl.bts.gov/view/dot/24041/dot_24041_DS1.pdf.Search in Google Scholar
[18] Catlett C, Cesario E, Talia D, Vinci A. Spatio-temporal crime predictions in smart cities: A data-driven approach and experiments. Pervasive Mobile Comput. 2019;53:62–74. 10.1016/j.pmcj.2019.01.003.Search in Google Scholar
[19] Butt U, Letchmunan S, Hassan F, Ali M, Baqir A, Koh TW, et al. Spatio-temporal crime predictions by leveraging artificial intelligence for citizens security in smart cities. New Jersey, USA: IEEE Access. 2021. 10.1109/ACCESS.2021.3068306.Search in Google Scholar
[20] HP-Ruffino P, Rodrıguez-C KG, Ramazzotto LA, Freitas PD, et al. Roadkill hotspots in a protected area of Cerrado in Brazil: planning actions to conservation. Revista MVZ Córdoba. 2016;21(2):5441–8. 10.21897/rmvz.609Search in Google Scholar
[21] Özcan AU, Özkazanç NK. Identifying the hotspots of wildlife–vehicle collision on the Çankırı-Kırıkkale highway during summer. Turkish J Zoo. 2017;41(4):722–30. 10.3906/zoo-1601-64.Search in Google Scholar
[22] Collinson W, Parker D, Bernard R, Reilly B, Davies-Mostert H. An inventory of vertebrate Roadkill in the greater Mapungubwe transfrontier conservation area, South Africa. African J Wildlife Res. 2015 Oct;45:301–11. 10.3957/056.045.0301.Search in Google Scholar
[23] Liu Y, Zhang S, Yu H, Wang Y, Feng Y, Sun J, et al. Straw segmentation algorithm based on modified UNet in complex farmland environment. Comput Materials Continua. 2020 Jan;66:247–62. 10.32604/cmc.2020.012328.Search in Google Scholar
[24] Ronneberger O, Fischer P, Brox T. U-net: Convolutional networks for biomedical image segmentation. In: International Conference on Medical image computing and computer-assisted intervention. Germany: Springer; 2015. p. 234–41. 10.1007/978-3-319-24574-4_28.Search in Google Scholar
[25] Bradski G, Kaehler A. Learning OpenCV: Computer vision with the OpenCV library. Sebastopol, CA: O’Reilly Media, Inc.; 2008. Search in Google Scholar
[26] Goeldner CR, Ritchie JB. Tourism principles, practices, philosophies. Bozeman, Montana, USA: John Wiley & Sons; 2007. Search in Google Scholar
[27] Republic of South Africa. White paper on the development and promotion of tourism in South Africa. Department of Environmental Affairs and Tourism Pretoria; 1996. Search in Google Scholar
[28] Mansfeld Y, Pizam A. Tourism, security and safety: From theory to practice (The Management of Hospitality and Tourism Enterprises). 2005. 10.4324/9780080458335Search in Google Scholar
[29] W. cape government. Tourism safety strategy. Destination Western cape. Creating an environment for economic growth and jobs. Western cape government, economic development, and tourism; 2022. Search in Google Scholar
[30] Oddone Aquino AGHE, Nkomo SL. Spatio-temporal patterns and consequences of road kills: a review. Animals. 2021;11(3):799. 10.3390/ani11030799.Search in Google Scholar PubMed PubMed Central
[31] Marcel PH, Tiffany DH, Matt B, Mark CG, Pat TM, Barrett H, et al. The comparison of animal detection systems in a test-bed: A quantitative comparison of system reliability and experiences with operation and maintenance. Federal Highway Administration and Montana Department of Transportation; 2009. 10.21949/1518286.Search in Google Scholar
[32] Antônio WHS, Silva MD, Miani RS, Souza JR. A proposal of an animal detection system using machine learning. Appl Artif Intel. 2019;33:1093–106. 10.1080/08839514.2019.1673993.Search in Google Scholar
[33] Huijser MP, Hayden L. Evaluation of the reliability of an animal detection system in a test-bed. Berkeley, CA, USA: Western Transportation Institute; 2010. Search in Google Scholar
[34] Smith DJ, Grace MK, Miller A, Noss MJW, Noss RF. Assessing the effectiveness and reliability of the roadside animal detection system on US highway 41 near the turner river in Collier county. Final Report. Contract No. BDV37, TWO #2. Florida Department of Transportation, District One, Bartow, FL. 72 pp. + appendices. 2016. Search in Google Scholar
[35] Shapoval V, Lev J, Bartoška J, Kumhála F. Application of doppler radar for wildlife detection in vegetation. Sci Agricult Bohemica. 2018;49:136–41. 10.2478/sab-2018-0019.Search in Google Scholar
[36] Huijser MP, Fairbank ER, Abra FD. The reliability and effectiveness of a radar-based animal detection system. University of Alaska Fairbanks. Center for Environmentally Sustainable; 2017. https://rosap.ntl.bts.gov/view/dot/34943.Search in Google Scholar
[37] Vikhram B, Revathi B, Shanmugapriya R, Sowmiya S, Pragadeeswaran G. Animal detection system in farm areas. Int J Adv Res Comput Commun Eng. 2017;6:587–91. 10.17148/IJARCCE.2017.63137Search in Google Scholar
[38] Mukherjee A, Sullivan A, Sinha A, Liu X, Brake D. Roadway monitoring and driver warning systems for wildlife–vehicle collision avoidance. Toronto, Canada: AUG Signals Ltd; 2013. Search in Google Scholar
[39] Druta C, Alden AS. Evaluation of a buried cable roadside animal detection system. Virginia, USA: Virginia Center for Transportation Innovation and Research; 2015. Search in Google Scholar
[40] Druta C, Alden AS. Preventing animal-vehicle crashes using a smart detection technology and warning system. Transport Res Record. 2020;2674:680–9. 10.1177/0361198120936651.Search in Google Scholar
[41] Sharma S, Shah D. Real-time automatic obstacle detection and alert system for driver assistance on Indian roads. Int J Vehicle Autonom Syst. 2017;13(3):189–202. 10.1504/IJVAS.2017.083499.Search in Google Scholar
[42] Rosenband DL. Inside Waymoas self-driving car: My favorite transistors. In: 2017 Symposium on VLSI Circuits. IEEE; 2017. p. C20–2. 10.23919/VLSIC.2017.8008500.Search in Google Scholar
[43] Sillero N, Hélder R, Marc F, Cristiano S, Gil L. A road mobile mapping device for supervised classification of amphibians on roads. Eur J Wildlife Res. 2018;64:1–6. 10.1007/s10344-018-1236-4.Search in Google Scholar
[44] Sousa Guedes D, Ribeiro H, Sillero N. An improved mobile mapping system to detect road-killed amphibians and small birds. ISPRS. Int J Geo-Inform. 2019;8:565. 10.3390/ijgi8120565.Search in Google Scholar
[45] Hallisey N, Buchanan SW, Gerber BD, Corcoran LS, Karraker NE. Estimating road mortality hotspots while accounting for imperfect detection: A case study with amphibians and reptiles. Land. 2022;11(5):739. 10.3390/land11050739.Search in Google Scholar
[46] Nandutu I, Atemkeng M, Okouma P. Integrating AI ethics in wildlife conservation AI systems in South Africa: A review, challenges, and future research agenda. AI Soc. 2021;38(1):245–57. 10.1007/s00146-021-01285-y.Search in Google Scholar
[47] Gagnon JW, Loberger CD, Sprague SC, Ogren KS, Boe SL, Schweinsburg RE. Cost-effective approach to reducing collisions with elk by fencing between existing highway structures. Human-Wildlife Interact. 2015;9(2):14. https://www.jstor.org/stable/24874142.Search in Google Scholar
[48] Game A, Department F. Wildlife Compatible Fencing; 2022. https://www.nrcs.usda.gov/wps/PA_NRCSConsumption/download?cid=nrcseprd1080807&ext=pdf, Accessed 11 July 2022. Search in Google Scholar
[49] Worley JW. Fences for the Firm; 2022. https://www.nrcs.usda.gov/Internet/FSE_DOCUMENTS/nrcs141p2_023913.pdf. Accessed 11 July 2022. Search in Google Scholar
[50] Atemkeng M, Nandutu I, Okouma P. A dissected dataset for single and double wildlife fences in South Africa (under review). Eastern Cape, South Africa: Data Brief. Unpublished dataset, 2025.Search in Google Scholar
[51] Shorten C, Khoshgoftaar TM. A survey on image data augmentation for deep learning. J Big Data. 2019;6:1–48. 10.1186/s40537-019-0197-0.Search in Google Scholar
[52] Dutta A, Zisserman A. The VIA annotation software for images, audio and video. In: Proceedings of the 27th ACM international conference on multimedia; 2019. p. 2276–79. 10.1145/3343031.3350535.Search in Google Scholar
[53] Albawi S, Mohammed TA, Al-Zawi S, Understanding of a convolutional neural network. In: 2017 International Conference on Engineering and Technology (ICET). IEEE; 2017. p. 1–6. 10.1109/ICEngTechnol.2017.8308186.Search in Google Scholar
[54] O’Shea K, Nash R. An introduction to convolutional neural networks. 2015. 10.48550/arXiv.1511.08458.Search in Google Scholar
[55] Saha R. Transfer Learning–A Comparative Analysis. Berlin, Germany: ResearchGate; 2018. 10.13140/RG.2.2.31127.39848.Search in Google Scholar
[56] Zhu Y, Chen Y, Lu Z, Pan SJ, Xue GR, Yu Y, et al. Heterogeneous transfer learning for image classification. In: Twenty-fifth AAAI Conference on Artificial Intelligence, AAAI Press, Palo Alto, California, USA, 2011. 10.1609/aaai.v25i1.8090.Search in Google Scholar
[57] Shin HC, Roth HR, Gao M, Lu L, Xu Z, Nogues I, et al. Deep convolutional neural networks for computer-aided detection: CNN architectures, dataset characteristics and transfer learning. IEEE Trans Med Imag. 2016;35(5):1285–98. 10.1109/TMI.2016.2528162.Search in Google Scholar PubMed PubMed Central
[58] Van Opbroek A, Ikram MA, Vernooij MW, De Bruijne M. Transfer learning improves supervised image segmentation across imaging protocols. IEEE Trans Med Imag. 2014;34(5):1018–30. 10.1109/TMI.2014.2366792.Search in Google Scholar PubMed
[59] Weiss K, Khoshgoftaar TM, Wang D. A survey of transfer learning. vol. 3, no. 1. Springer International Publishing; 2016. 10.1186/s40537-016-0043-6.Search in Google Scholar
[60] He K, Zhang X, Ren S, Sun J. Deep residual learning for image recognition. In: Proceedings of the IEEE Conference on Computer Vision and Pattern Recognition; 2016. p. 770–8. 10.1109/CVPR.2016.90.Search in Google Scholar
[61] He K, Zhang X, Ren S, Sun J. Identity mappings in deep residual networks. In: European Conference on Computer Vision. Springer; 2016. p. 630–45. 10.1007/978-3-319-46493-0_38.Search in Google Scholar
[62] Hossin M, Sulaiman MN. A review on evaluation metrics for data classification evaluations. Int J Data Mining Knowledge Manag Process. 2015;5(2):1. 10.5121/ijdkp.2015.5201.Search in Google Scholar
[63] Li MY, Zhu DJ, Xu W, Lin YJ, Yung KL, Ip AW. Application of U-net with global convolution network module in computer-aided tongue diagnosis. J Healthcare Eng. 2021;2021:5853128. 10.1155/2021/5853128.Search in Google Scholar PubMed PubMed Central
[64] Kingma DP, Ba J. Adam: A method for stochastic optimization. 2014. 10.48550/arXiv.1412.6980.Search in Google Scholar
[65] Viola P, Jones M. Rapid object detection using a boosted cascade of simple features. In: Proceedings of the 2001 IEEE Computer Society Conference on Computer Vision and Pattern Recognition. CVPR 2001. vol. 1. IEEE; 2001. p. I -I. 10.1109/CVPR.2001.990517.Search in Google Scholar
[66] Eloff P, Van Niekerk A. Temporal patterns of animal-related traffic accidents in the Eastern Cape, South Africa. South African J Wildlife Res-24-month Delayed Open Access. 2008;38(2):153–62. 10.3957/0379-4369-38.2.153Search in Google Scholar
[67] Tabak MA, Norouzzadeh MS, Wolfson DW, Sweeney SJ, VerCauteren KC, Snow NP, et al. Machine learning to classify animal species in camera trap images: Applications in ecology. Meth Ecol Evolut. 2019;10(4):585–90. 10.1111/2041-210X.13120.Search in Google Scholar
[68] Willi M, Pitman RT, Cardoso AW, Locke C, Swanson A, Boyer A, et al. Identifying animal species in camera trap images using deep learning and citizen science. Meth Ecol Evolut. 2019;10(1):80–91. 10.1111/2041-210X.13099.Search in Google Scholar
[69] LeCun Y, Bengio Y, Hinton G. Deep learning. Nature. 2015;521(7553):436–44. 10.1038/nature14539.Search in Google Scholar PubMed
[70] Ackermann K, Walsh J, DeUnánue A, Naveed H, Navarrete Rivera A, Lee SJ, et al. Deploying machine learning models for public policy: A framework. In: Proceedings of the 24th ACM SIGKDD International Conference on Knowledge Discovery & Data Mining; 2018. p. 15–22. 10.1145/3219819.3219911.Search in Google Scholar
[71] Kulkarni V, Gawali M, Kharat A. Key technology considerations in developing and deploying machine learning models in clinical radiology practice. JMIR Med Inform. 2021;9(9):e28776. 10.2196/28776.Search in Google Scholar PubMed PubMed Central
[72] Takabe Y, Uehara M. Rapid deployment for machine learning in educational cloud. In: 2013 16th International Conference on Network-Based Information Systems. IEEE; 2013. p. 372–6. 10.1109/NBiS.2013.59.Search in Google Scholar
[73] Tabiaa M, Madani A. The deployment of Machine Learning in eBanking: A Survey. In: 2019 Third International Conference on Intelligent Computing in Data Sciences (ICDS). IEEE; 2019. p. 1–7. 10.1109/ICDS47004.2019.8942379.Search in Google Scholar
[74] Schonfeld E, Schiele B, Khoreva A. A u-net based discriminator for generative adversarial networks. In: Proceedings of the IEEE/CVF Conference on Computer Vision and Pattern Recognition; 2020. p. 8207–16. 10.1109/CVPR42600.2020.00823Search in Google Scholar
[75] Wu C, Zou Y, Yang Z. U-GAN: generative adversarial networks with U-Net for retinal vessel segmentation. In: 2019 14th International Conference on Computer Science & Education (ICCSE). IEEE; 2019. p. 642–6. 10.1109/ICCSE.2019.8845397.Search in Google Scholar
[76] Prapas I, Derakhshan B, Mahdiraji AR, Markl V. Continuous training and deployment of deep learning models. Datenbank-Spektrum. 2021;21(3):203–12. 10.1007/s13222-021-00386-8.Search in Google Scholar
[77] Liu Z, Lian T, Farrell J, Wandell B. Neural network generalization: The impact of camera parameters. IEEE Access. 2020;8:10443–54. 10.1109/ACCESS.2020.2965089.Search in Google Scholar
© 2025 the author(s), published by De Gruyter
This work is licensed under the Creative Commons Attribution 4.0 International License.
Articles in the same Issue
- Research Articles
- Synergistic effect of artificial intelligence and new real-time disassembly sensors: Overcoming limitations and expanding application scope
- Greenhouse environmental monitoring and control system based on improved fuzzy PID and neural network algorithms
- Explainable deep learning approach for recognizing “Egyptian Cobra” bite in real-time
- Optimization of cyber security through the implementation of AI technologies
- Deep multi-view feature fusion with data augmentation for improved diabetic retinopathy classification
- A new metaheuristic algorithm for solving multi-objective single-machine scheduling problems
- Estimating glycemic index in a specific dataset: The case of Moroccan cuisine
- Hybrid modeling of structure extension and instance weighting for naive Bayes
- Application of adaptive artificial bee colony algorithm in environmental and economic dispatching management
- Stock price prediction based on dual important indicators using ARIMAX: A case study in Vietnam
- Emotion recognition and interaction of smart education environment screen based on deep learning networks
- Supply chain performance evaluation model for integrated circuit industry based on fuzzy analytic hierarchy process and fuzzy neural network
- Application and optimization of machine learning algorithms for optical character recognition in complex scenarios
- Comorbidity diagnosis using machine learning: Fuzzy decision-making approach
- A fast and fully automated system for segmenting retinal blood vessels in fundus images
- Application of computer wireless network database technology in information management
- A new model for maintenance prediction using altruistic dragonfly algorithm and support vector machine
- A stacking ensemble classification model for determining the state of nitrogen-filled car tires
- Research on image random matrix modeling and stylized rendering algorithm for painting color learning
- Predictive models for overall health of hydroelectric equipment based on multi-measurement point output
- Architectural design visual information mining system based on image processing technology
- Measurement and deformation monitoring system for underground engineering robots based on Internet of Things architecture
- Face recognition method based on convolutional neural network and distributed computing
- OPGW fault localization method based on transformer and federated learning
- Class-consistent technology-based outlier detection for incomplete real-valued data based on rough set theory and granular computing
- Detection of single and dual pulmonary diseases using an optimized vision transformer
- CNN-EWC: A continuous deep learning approach for lung cancer classification
- Cloud computing virtualization technology based on bandwidth resource-aware migration algorithm
- Hyperparameters optimization of evolving spiking neural network using artificial bee colony for unsupervised anomaly detection
- Classification of histopathological images for oral cancer in early stages using a deep learning approach
- A refined methodological approach: Long-term stock market forecasting with XGBoost
- Enhancing highway security and wildlife safety: Mitigating wildlife–vehicle collisions with deep learning and drone technology
- An adaptive genetic algorithm with double populations for solving traveling salesman problems
- EEG channels selection for stroke patients rehabilitation using equilibrium optimizer
- Influence of intelligent manufacturing on innovation efficiency based on machine learning: A mechanism analysis of government subsidies and intellectual capital
- An intelligent enterprise system with processing and verification of business documents using big data and AI
- Hybrid deep learning for bankruptcy prediction: An optimized LSTM model with harmony search algorithm
- Construction of classroom teaching evaluation model based on machine learning facilitated facial expression recognition
- Artificial intelligence for enhanced quality assurance through advanced strategies and implementation in the software industry
- An anomaly analysis method for measurement data based on similarity metric and improved deep reinforcement learning under the power Internet of Things architecture
- Optimizing papaya disease classification: A hybrid approach using deep features and PCA-enhanced machine learning
- Review Articles
- A comprehensive review of deep learning and machine learning techniques for early-stage skin cancer detection: Challenges and research gaps
- An experimental study of U-net variants on liver segmentation from CT scans
- Strategies for protection against adversarial attacks in AI models: An in-depth review
- Resource allocation strategies and task scheduling algorithms for cloud computing: A systematic literature review
- Latency optimization approaches for healthcare Internet of Things and fog computing: A comprehensive review