A novel fiberglass-reinforced polyurethane elastomer as the core sandwich material of the ship–plate system
-
Abdi Ismail
 ,
Bambang Piscesa
,
Bambang Piscesa

Abstract
A novel low-cost polyurethane (PU) elastomeric material reinforced with mat-form fiberglass for alternative ship material was developed. The hand lay-up technique was used to prepare samples with glass fiber contents of 0, 7, 9, 11, and 15% by weight. Several tests, including density, tensile, and hardness tests, have been conducted to investigate the effect of fiber content on the material properties of the developed materials. The test results found that only composites with 0% (PU) and 7% (PFg-7) fiberglass had met all Lloyd’s Register criteria. PFg-7 has a density of 1,098 kg/m3, a hardness of 66.15 shore-D, a tensile strength of 21.32 MPa, and an elongation at break of 47.06%, a higher hardness, elastic modulus, and yield strength than PU. PFg-15 achieved the highest density, hardness, tensile strength, elastic modulus, and yield strength, which were 1,228 kg/m3, 68.85 shore-D, 32.13, 2,176, and 30.89 MPa, respectively. The elastic modulus and yield strength of PFg-15 were 5.6 times and 3 times higher than those of PU but PFg-15 did not meet the elongation at break criteria. PFg-9, PFg-11, and PFg-15 showed brittle properties, as indicated by relatively high hardness, elastic modulus, and yield strength compared to the results from various references.
1 Introduction
The development of lightweight material in a ship structure is expected to reduce the weight, increase the ship payload, increase fuel consumption efficiency, and reduce CO2 emission [1]. The use of the sandwich material, which consists of a core layer flanked by two faceplate layers, is promising to be used as the ship’s material because of its lightweight and durable behavior. The faceplate layers are usually made of a high-density and stiffness material. On the other hand, the core layer, which is typically thicker than the faceplates, is made of a material with lower density and stiffness. By combining the two materials, a sandwich-like material effect can be obtained and increase the efficiency ratio of the strength and stiffness to the weight of the sandwich material.
The structures designed using sandwich plates can have a weight reduction of up to 8% compared to the stiffened steel plate structures [2]. Other studies also reported that sandwich plates could reduce the weight by 5 and 12% [3]. In terms of the stiffness efficiency of the sandwich material, a high stiffness/weight ratio can be obtained [4,5,6,7,8,9]. Due to its lightweight, a sandwich material makes ship construction more straightforward, faster (production process) [10], and less costly. Furthermore, the need for stiffeners in the ship structure [11] can be reduced, increasing space utilization [3].
For ship and bridge deck construction, steel and polyurethane (PU) elastomer are often used as the faceplate and core materials for the sandwich panel [3,10,12,13]. In the commercial shipping industry, the sandwich plate system (SPS), which has met the Lloyd’s Register (LR) standards [14], is often used. This SPS material uses steel as the faceplate and room-temperature curing polyurethane elastomer (RTC-PU) as the core material [3,10]. However, the RTC-PU used in SPS is expensive and unavailable in many countries [11,15,16]. For a small-scale ship industry, where the cost of the material will govern the overall cost of the ship production, using RTC-PU would not be economical.
Since steel production is well established, the required material to build a low-cost sandwich material is to develop a fast production core material that can be produced and satisfy the LR standards [11,17,18]. One possible replacement for the RTC-PU in the SPS is the casted PU elastomer. This type of polymer is inexpensive and can reduce the overall cost of the sandwich material system [19]. The mechanical behavior of the core material can be improved by using glass fiber. This additional glass fiber, which is robust against tensile and has excellent thermal stability and chemical resistance, would eventually improve the core material’s tensile strength, toughness, and modulus elasticity [20,21,22].
To the best of our knowledge, the complete study of the glass fiber-reinforced polyurethane (GFRPU), which satisfies the LR criteria, was limited (which includes the uniaxial tensile strength [UTS], density, elastic modulus, hardness, and elongation at break). Saliba et al. [23] studied the UTS and elongation at the break of the GFRPU. The highest UTS achieved was 3.67 MPa, and the highest elongation at break was 1.77%, which did not meet the LR criteria; they did not carry out a density and hardness test. Husic et al. [24] investigated both the UTS and density of the GFRPU using soybean oil polyol and petrochemical polyol. Tensile and density tests have been carried out [24] with a UTS and a density of 259 MPa and 1,830 kg/m3, which meet the LR criteria. However, hardness and elongation data are not yet available. Zhang et al. [25,26] studied the UTS, elongation at break, and hardness of the GFRPU where a special, treated milled fiberglass was used. From their study, the hardness obtained was 64–75 shore-A [25,26], while according to the LR criteria, the required hardness had been higher than 65 shore-D. Even though the elongation at break is above 20%, the UTS of 2.64–5.59 MPa still does not meet the LR criteria, which must be >20 MPa.
Wilberforce and Hashemi [27] did some experimental investigation on the UTS capacity of the short fiberglass-reinforced thermoplastic polyurethane (TPU) elastomers. It was observed that all types of TPUs have UTS above 20 MPa, but density and hardness data are not yet available. Reis et al. [28] used a bi-directional GFRPU, which is subjected to tensile tests under variable strain rates, 0.2–20 mm/min. Another experimental investigation of bi-directional GFRPU with 65–70% fiberglass content was also carried out by Da Costa Mattos et al. [29]. From the studies of Reis et al. [28] and Da Costa Mattos et al. [29], only UTS data were available, and density, hardness, and elongation at break data were not yet available. Elkazaz et al. [30] investigated the elastic modulus, yield stress, and elongation at break of the GFRPU with varying volume fractions of the fiberglass. However, no other test data related to LR criteria and standards related to LR [31,32,33] were reported. PU/cellulose nanocrystal nanocomposites have been reported to have a UTS in the range of 40.9–44.9 MPa and an elongation at break in the range of 994–1,110%, which far exceeds the LR criteria. However, density and hardness data were not available. In previous studies [35–54], a hardness test was carried out, but only Ma and Yi [36] have hardness values that meet the LR criteria (above 65 shore D), i.e., 83–87 shore D. Ma and Yi [36] also reported UTS and elongation at break that meet the LR criteria but the density test was not conducted.
As outlined above, most of the research on the PU composite and TPU composite has yet to examine the suitability of materials for ship structure applications. Experimental testing on GFRPU as a core material that must meet all LR criteria by using the test standards set by LR has not been widely reported, where the density must be above 1,000 kg/m3, UTS must be above 20 MPa, elongation at break must be more than 20%, and hardness should be more than 65 shore D. Therefore, in this study, the experimental study of the GFRPU composite as a novel core material in the ship sandwich plate system (SSPS) will be carried out to meet all LR criteria. In addition to investigating the mechanical behavior of the developed core material, another potential application of the developed GFRPU in other structural systems is also assessed.
2 Materials and methods
2.1 Material development
The manufacturing of novel fiberglass-reinforced polyurethane (FRPU) elastomer comprises several steps. In the first step, PU elastomer was formed from a PU prepolymer based on polypropylene glycol (PPG) polyol and MOCA (MOCA is the commercial name for 4,4′-methylene 2-bis (2-chloroaniline)) as a curing agent. PPG-based PU elastomer prepolymer and MOCA were imported from Headway Advanced Materials Inc. (Taiwan). A chopped fiberglass mat was purchased from PT, Justus Sakti Raya (Indonesia).
Figure 1 shows the details of the composite fabrication and MOCA heating processes. MOCA was heated at 120°C, while the PPG-based PU elastomer prepolymer was heated at 85°C. The PU prepolymer was inserted into the vacuum chamber, where it was perfectly degassed until much of the foaming stopped. MOCA and the PU prepolymer were stirred using a mechanical mixer. The liquid polymer was then poured with the untreated chopped fiberglass mat on the molding, which had a temperature of 100°C using the hand lay-up technique. The specimen was entirely cured after being heated for 16 h at 100°C.

(a) Composite fabrication. (b) The heating process of MOCA.
The specimens were formulated with different fiberglass contents to investigate the effect of adding fiberglass to the mechanical properties of GFRPU composites. The fiberglass content as a fraction of the total weight investigated was 0% (identified as PU), 7% (PFg7, 1-layer fiberglass mat), 9% (PFg9, 2-layer fiberglass mat), 11% (PFg11, 3-layer fiberglass mat), and 15% (PFg15, 4-layer fiberglass mat).
2.2 Experimental testing procedures
Four mechanical properties outlined in the LR criteria, as shown in Table 1, were investigated to ensure that the proposed material can be used as an SSPS core material. These criteria consisted of testing the mechanical properties such as density, hardness, UTS, and elongation of the proposed material. In addition to the tests carried out, a detailed analysis of the behavior of PU and its composites was also carried out to identify the possible application of the proposed material for other structures.
Criteria of the mechanical properties for the core material of SSPS [14]
| Mechanical properties | Criteria |
|---|---|
| Density | ≥1,000 kg/m3 at 25°C |
| Hardness | Shore D ≥ 65 at 25°C |
| Tensile strength | ≥20 MPa at 25°C, ≥5 MPa at +80°C |
| Elongation | Min. 10% at −20°C, Min. 20% at room temperature |
Several tests, including density, tensile, and hardness tests, were conducted to investigate the mechanical behavior of the developed materials under different glass fiber contents. Specimen dimension and testing procedure of each experimental test are explained in detail.
2.2.1 Density test
The displacement technique was used to measure the density, with the volume of samples submerged in water equaling the volume raised in a graduated cylinder. The weight of the samples was measured using a high-precision digital balance with 0.001 g accuracy. Five samples were prepared and tested for each measured density and void content. The void content (V) was estimated using ASTM D2734 [31]:
where V is the void content (%), M d is the measured density (g/cm3), p is the PU weight percentage (%), g is the glass fiber weight percentage (%), d p is the PU density (g/cm3), and d g is the glass fiber density (g/cm3).
2.2.2 Uniaxial tensile tests
Tensile tests were performed to complete the information and basic design of the strength of the material. The tensile test was conducted using a 25 kN Universal Testing Machine (Tensilon RTF-1325, Japan), which was integrated with an electronic extensometer at 60% relative humidity and 25°C temperature. The tensile test was prepared as outlined in ASTM D412 [33]. Figure 2 shows the dimensions of the tensile test specimen in millimeters according to ASTM D412 [33]. The effective sample length was 59 mm. The sample thickness and width were 3 and 6 mm, respectively. Figure 3 shows the schematic loading diagram, placement of sensors (load cell and extensometer), and front and side views of the experimental program. The applied force was measured using a load cell mounted to the top crosshead. The reported data from the uniaxial tensile test represented an average value of four specimens with standard errors. The tensile test was used to determine the UTS, which was the maximum load on the stress–strain curve. The elastic modulus was determined by the initial slope of the stress–strain curve. Yield strengths were defined from the elastic region at a 0.2% offset. Toughness is a measure of a material’s ability to absorb energy before failure and is determined by calculating the area under the stress–strain curve. The work of fracture, which is also a measure of toughness, is calculated as the energy required to fracture a material [34]. Other mechanical properties, such as hardness and elongation at break, can also be obtained from the stress–strain curve. It is important to determine these properties to understand how a material will behave under different loading conditions, which is essential for designing and engineering structures.

Dimensions of the tensile test specimen based on ASTM D412 in millimeters (cross section: 3 mm thick × 6 mm wide).

(a) UTM and extensometer and (b) front and side view of UTM and extensometer.
2.2.3 Hardness test
Hardness testing is one method to measure the mechanical properties of composite materials. The hardness test can be used to evaluate composite materials’ quality and compare the properties of different materials or manufacturing processes. The hardness test involves applying a load to the material’s surface and measuring the resistance to indentation or penetration. This test can be performed using the shore D hardness method. To perform the hardness test of composites, a test specimen is typically prepared by cutting or machining a small section of the material. The surface of the specimen is then polished to remove any surface defects or roughness. A test machine or device is used to apply a specific load to the material’s surface, usually using an indenter. Shore D hardness measurements were performed according to DIN 53505 [32] using a type D digital Durometer with 0.1 shore D of readability. The hardness test results were based on the average values of 10 measurements of the samples with standard errors.
3 Results and discussion
3.1 PU and its composite for the core material of SSPS
The core material developed in this study was an FRPU elastomer composite. PU elastomer and fiberglass used were casting PU elastomer and a chopped fiberglass mat. Density, hardness, and tensile tests were carried out to determine the feasibility of PU and its composites to be applied as a core material for SSPS.
Density, hardness, and their respective standard errors are shown in Figures 4 and 5. PU and all FRPU composite variations had density and hardness values that met the LR criteria: more than 1,000 kg/m3 and more than 65 shore D. The addition of 9, 11, and 15% fiberglass caused an increase in the density than PU (without fiberglass). The highest density was achieved with PFg-15 of 1,228 kg/m3. The density increase was caused by an increase in the mass fraction of the fiberglass, which had a higher density of 2,540 kg/m3, rather than PU of 1,119 kg/m3. The exception was PFg-7, which had a lower density than PU because of the void content, which will be discussed further in Section 3.2.1.

Densities of PU and PU elastomer composites in several fiberglass compositions.

Hardnesses of PU and PU elastomer composites in several fiberglass compositions.
The addition of the fiberglass caused an increase in the composite’s hardness. The greater the fiberglass composition, the higher the composite hardness. The same trend was obtained in other studies. When TPU elastomer was added with 0.5, 1, 1.5, and 2 wt% nitric acid-treated carbon nanotubes, it experienced a gradual increase in hardness. The same was obtained when TPU was added with silane-modified carbon nanotubes [35].
It is important to note that the degree of increase in hardness may vary depending on the type and amount of reinforcement added to the composite. In the case of FRPU composites, the hardness increased as the fiberglass composition increased. This is because fiberglass, also known as glass fiber, is a high-strength, high-stiffness material that has excellent mechanical properties. When fiberglass is incorporated into a PU matrix, it reinforces the material, making it stronger and stiffer. The hardness of a material is a measure of its resistance to indentation or scratching. In the case of PU composites, the hardness is determined by the strength of the PU matrix and its ability to resist deformation. Fiberglass reinforcement enhances the strength and stiffness of the matrix, which, in turn, increases its hardness. Fiberglass reinforcement can also improve the dimensional stability of PU composites. PU is a relatively soft and flexible material that can deform or change shape when subjected to stress or temperature changes. The addition of fiberglass helps to maintain the shape and dimensions of the composite, improving its hardness ability. Moreover, hardness depends on the molecular weight, the types of atoms, and the arrangement of these atoms in the material’s crystal structure [36]. Materials that have a strong and ordered crystal structure tend to be harder than those with a less organized structure.
LR does not specify a specific type of material, but the potential flexible core materials include PU, PU composite, TPU, and TPU composite because the core material that has been successfully applied and patented under the SPS brand is PU. In order to investigate alternative core layers for SSPS, materials were examined to identify the potential to be further developed (Table 2). This study has achieved superior hardness values in comparison to earlier studies [25,35,37,38,39,40,41,42,43,44,45,46,47,48,49,50,51,52,53,54], which have documented hardness within the 6–59 shore D range. It is noteworthy that the hardness attained in this research is inferior to the one reported in the study of Ma and Yi [36]. Accordingly, among the references in Table 2, only the PU based on PPG, mentioned in the study of Ma and Yi [36], can be investigated further for its application as a core material for SSPS because it has a hardness exceeding 65 shore D. Additionally, all materials mentioned in Table 2 have a general application, whereas the material in this study is explicitly developed for marine/ship applications. Overall, the hardness values obtained in this research outperform those reported in other studies mentioned in Table 2.
Hardnesses of PU, PU composite, TPU, and TPU composite
| Reference | Material | Hardness |
|---|---|---|
| Ma and Yi [36] | PU | 83–87 shore D |
| Current study | PU, PFg7, PFg9, PFg11, PFg15 | 65.2–68.85 shore D |
| Lopes et al. [37] | PU and PU composite | 57–59 shore D |
| Chun-Ta et al. [38] | TPU composite | 48–58 shore D |
| Yuan et al. [39] | PU | 43 shore D |
| Zhao et al. [40] | PU composite | 41–51 shore D |
| Somarathna et al. [41] | PU | 40–56 shore D |
| Barczewski et al. [42] | PU and PU composite | 40.3–48.9 shore D |
| Bartolomé et al. [43] | TPU | 35 shore D |
| Bartolomé et al. [44] | TPU | 35 shore D |
| Ashrafizadeh et al. [45] | PU | 32 shore D |
| Sikorski [46] | PU | 32 shore D |
| Tao et al. [47] | PU | 32–55 shore D |
| Mi et al. [48] | TPU and TPU composite | 32 shore D |
| Calvo-Correas et al. [49] | TPU | 32.2–56.3 shore D |
| Chun-Ta et al. [38] | TPU composite | 31–35 shore D |
| Dutta and Naskar [50] | TPU and TPU composite | 25.2–33.5 shore D |
| Tayfun et al. [35] | TPU and TPU composite | 25–34 shore D |
| Xiang et al. [51] | PU | 23–56 shore D |
| Zhang et al. [25] | PU and composite PU | 18–23 shore D |
| Somdee et al. [52] | PU | 13.6–58.8 shore D |
| Parcheta et al. [53] | Bio-based TPU | 7–8 shore D |
| Ljubic et al. [54] | PU | 6–11 shore D |
It is important to emphasize that hardness testing is critical to evaluate the suitability of materials for specific applications. In the present study, the use of the shore D scale to assess hardness is essential for evaluating the performance of the materials in the context of SSPS applications. However, the results obtained in this study can be used as a benchmark to compare the hardness values reported in other studies for evaluating the hardness of PU, PU composites, TPU, and TPU composites. Future research in this area should continue to investigate the mechanical properties of these materials to ensure their suitability for a range of applications.
The UTS, elongation at break, and their respective standard errors are presented in Figures 6 and 7. Since UTS and elongation at break are inversely linked features, establishing an appropriate balance between the two was crucial. In the case of the FRPU composite, increasing the fiberglass composition led to a higher UTS, as demonstrated in Figure 6. The highest UTS achieved was with the PFg-15 composite, which measured 33.06 MPa. By adding 9, 11, and 15% fiberglass compositions relative to PU, the UTS increased by 6.5, 9.2, and 24.4%, respectively. All PU and FRPU composite variations had UTS values exceeding 20 MPa and met the LR criteria. However, it is important to note that the elongation at break decreased as the fiberglass composition increased. To achieve an optimal balance between UTS and elongation at break, a suitable fiberglass composition needs to be identified. Other factors that may influence the properties of the composite include the type of matrix material and manufacturing process. Thus, increasing the fiberglass composition in FRPU composites can enhance their UTS. However, it is crucial to maintain a balance between UTS and elongation at break to achieve an optimal composite. All PU and FRPU composite variations met the LR criteria for UTS and had values exceeding 20 MPa.

UTS of PU and PU elastomer composites in several fiberglass compositions.

Elongation at break of PU and PU elastomer composites in several fiberglass compositions.
The nonlinear relationship between the addition of reinforcement and the increase in UTS was observed in this study, with the PFg-7 composition displaying the lowest UTS at 21.32 MPa when compared to other compositions. This type of nonlinear behavior was also observed in another study [55], where the addition of 10% carbon nanofiber (CNF) to TPU elastomer led to an increase in UTS compared to neat TPU. However, the addition of 20, 30, and 40% CNF resulted in a decrease in UTS when compared to neat TPU [55]. The addition of a fiberglass mill to the PU elastomer increased UTS, which was also nonlinear [25,26]. The addition of 1% fiberglass mill to PU caused a decrease in the composite UTS, but the addition of 5, 10, and 15% of fiberglass mill to PU helped increase the composite UTS compared to the UTS of neat PU [26]. So, in general, PU elastomers have specific characteristics for the addition of particular reinforcement.
The higher the fiberglass addition to the PU elastomer, the lower the elongation at break as seen in Figure 7, because the addition of fiberglass made the composite stiffer and less flexible. When fiberglass was added to the elastomer matrix, it created a reinforcing effect and improved the strength and stiffness of the composite. However, this reinforcement effect came at the expense of flexibility and elongation at break. The fiberglass acted as a barrier to the movement of the polymer chains, making it more difficult for them to move and deform when stress was applied. This resulted in a reduction in the elongation at break, which measured the maximum strain a material can undergo before it broke. The highest elongation at break was achieved by PU at 154.13%, while PFg-15 achieved the lowest elongation at break at 2.72%. The addition of 7, 9, 11, and 15% fiberglass resulted in decreased elongation at break of PU by 69, 97, 98, and 98%, respectively.
It also occurred in several other studies. When a polymer is added with reinforcement or filler, a decrease in elongation at break occurs. The addition of carbon nanotubes of 0.5, 1, 1.5, 2, and 2.5 wt% on the TPU caused a gradual decrease in elongation at break [56]. The same was observed when the TPU was added with graphene nanosheets [56]. When TPU was added with 0.01, 0.03, 0.05, 0.2, 0.5, 1, and 1.5 vol% silver nanowires (AgNWs), it has the same pattern, that is, a gradual decrease in elongation at break [51]. A gradual decreasing pattern of elongation at break also occurred when the PU elastomer was applied to 10, 30, 50, 70, and 90 wt% rubber granules [57].
Overall, it can be seen that only composites with 0% (PU) and 7% (PFg-7) fiberglass met the LR criteria for elongation at break above 20%. For UTS, all fiberglass compositions met the LR criteria above 20 MPa. Thus, composites that met all LR criteria, density, hardness, UTS, and elongation at break, were PU elastomer and composites with a fiberglass composition of 7% (PFg-7). However, PFg-7 had an interesting mechanical behavior to be applied as a core material for SSPS because PFg-7 had a higher hardness, elastic modulus, and yield strength when compared with PU. Also, due to the presence of fiberglass in PFg-7, it had a lower material cost than PU.
3.2 Mechanical behavior of PU and its composite
The mechanical behavior of a material can be studied and quantified using several variables, such as UTS, elongation at break, elastic modulus, yield strength, and toughness, which can be derived from the tensile stress–strain curves. These variables provide crucial information about a material’s mechanical properties and help determine its suitability for various applications. The mechanical properties of FRPU elastomer were evaluated, specifically focusing on its potential as a core material for SSPS applications. The results indicated that the composite had excellent mechanical properties, as evidenced by its high UTS, elongation at break, and elastic modulus, which meet the LR criteria. Additionally, the composite exhibited high yield strength and toughness, highlighting its potential for use in various systems.
By examining the mechanical properties of a material, its potential applications can be determined. In the case of FRPU elastomer, it is promising not only as a core material for SSPS but also in other systems. Its high mechanical strength, elasticity, and toughness made it a versatile material that can be adapted to various applications depending on the system’s specific requirements.
3.2.1 Tensile stress–strain curve behavior
The results presented in Figures 6 and 8 indicate that the addition of fiberglass to the PU elastomer affected its UTS. Specifically, the composite PFg-7 had a lower UTS than the PU without fiberglass. This occurred because PU exhibited strain-hardening behavior in the plastic region, leading to the UTS point occurring at a very high strain value. This phenomenon has been observed in previous studies, as cited in previous studies [27,34,58]. During the crack bridging stage, the material continued to undergo strengthening until it reached the localized cracking zone. On the other hand, PFg-7 did not exhibit strain-hardening behavior in the plastic region but instead experienced crack bridging in the form of low-modulus softening. As a result, the UTS occurred at a relatively low strain value, as illustrated in Figure 7. These findings suggest that the addition of fiberglass to PU can impact the mechanical behavior of the composite, and further investigations may be necessary to fully understand the relationship between the composition and performance.

Tensile stress–strain curve of PU and PFg-7.
The analysis showed that the UTS value in the FRPU composite was not affected by strain hardening, but it was significantly influenced by the amount of fiberglass present. This pattern was observable in all FRPU composites, where an increase in fiberglass composition corresponds to a rise in UTS. The addition of fiberglass in the composite served as reinforcement and improved its tensile strength at very low strain levels. The fiberglass bore a lot of stress at low strain levels, and as the strain level increases, the PU matrix transmitted the stresses to avoid premature failure. In PFg-7, the combination of matrix and reinforcement worked effectively, which resulted in the highest elongation at break and toughness compared to other FRPU composites. Further discussion on the toughness of FRPU composites can be found in Section 3.2.2.
Toughness is a crucial mechanical property that describes a material’s ability to absorb energy and withstand deformation before breaking. It is measured by the area under the stress–strain curve and is related to the material’s ability to resist crack propagation. The addition of fiberglass in the FRPU composite played a significant role in improving its toughness. PFg-7, in particular, had the highest toughness among other FRPU composites due to its effective combination of matrix and reinforcement. The increase in toughness in the composite can be attributed to the crack-bridging effect provided by the reinforcement, which helped to absorb energy and slow down the crack propagation. The use of FRPU composites with high toughness had significant potential in various engineering applications that required high impact resistance and damage tolerance.
The mechanical properties of composite materials are strongly influenced by the presence of voids within the material. As observed in Table 3, PFg-7 had the highest void content among all the composites, which can also be seen in its low-density value. This high void content was the reason for the lower UTS of PFg-7 compared to other composites. It was well-known that the void content was inversely proportional to the density and UTS of the FRPU composites. In fact, the high porosity of CNF/TPU nanocomposites has been reported to result in lower tensile strength compared to neat TPU due to the presence of voids [55]. Furthermore, the voids can cause defects and stress concentration, leading to reduced material uniformity [55]. It is worth noting that the hand lay-up technique may also contribute to the presence of voids in the composite material [59].
Void content, UTS, and density of PU elastomer composites
| Composite | Void content (%) | Density (kg/m3) | UTS (MPa) |
|---|---|---|---|
| PFg-7 | 5.76 | 1,098 | 21.32 |
| PFg-9 | 0.94 | 1,167 | 28.30 |
| PFg-11 | 0.69 | 1,184 | 29.03 |
| PFg-15 | 0.51 | 1,228 | 33.06 |
However, it is possible to minimize the presence of voids in composite materials through the vacuum infusion technique during manufacturing. By reducing the void content, the material’s density and UTS can be increased, resulting in improved mechanical properties. Therefore, in the development of FRPU elastomers or any other composite material, it is crucial to pay close attention to the manufacturing process to minimize the presence of voids and optimize the mechanical properties of the material.
The tensile behavior of the FRPU elastomer composite can be assessed by analyzing the stress–strain curves and various variables, including the area under the curve, elongation at break, and tensile strength. The results of Figure 9 revealed that the FRPU composite with higher fiberglass composition showed narrower area under the stress–strain curve and lower elongation at break at lower strain values. This finding was consistent with other studies [27] that have shown that the addition of fiberglass composition to a composite material causes a decrease in elongation at break and a narrower stress–strain curve. The reduction in elongation at break of FRPU composites with higher fiberglass composition could be attributed to the brittle nature of the fiberglass. The high stiffness of the fiberglass caused the composite to have less ability to deform before breaking. Additionally, the area under the stress–strain curve becomes narrower as a result of the high tensile strength of the composite. This trend was because higher fiberglass composition contributes to a significant increase in the tensile strength of the composite.

Tensile stress–strain curve of PFg-9, PFg-11, and PFg-15.
3.2.2 Elastic modulus, yield strength, and toughness of PU and its composite
The mechanical properties of materials, such as elastic modulus, yield strength, and hardness, are significant indicators of their ability to withstand deformation and stress. The stiffness of a material in handling different types of loads can be better understood through its elastic modulus. Figure 10 shows that the fiberglass composition significantly affected the elastic modulus and yield strength of the FRPU composites. The higher the fiberglass composition, the higher the elastic modulus and yield strength. For instance, the PFg-15 composite achieved the highest elastic modulus and yield strength, which were 2,176 and 30.89 MPa, respectively. Comparatively, the elastic modulus of PFg-15 was 5.6 times higher than that of PU, while its yield strength was three times higher than that of PU. Similarly, PFg-7 had an elastic modulus that was 2.3 times higher than that of PU and a yield strength that was 1.8 times higher than that of PU.

Elastic modulus and yield strength of PU and PU elastomer composites in several fiberglass compositions.
We observed, in this study, that PFg-7 had a higher elastic modulus than PU, indicating better stiffness. Yield strength is another important factor in determining the allowable stress a material can withstand. In this case, PFg-7 had a higher yield strength than PU, meaning that it could handle a higher load before undergoing plastic deformation. It is worth noting that the allowable stress of the core material for SPS is developed from a yield strength at 0.2% offset [60]. Therefore, in addition to meeting LR criteria, PFg-7 can bear a higher load without undergoing plastic deformation compared to PU.
Tables 4 and 5 show the elastic modulus and yield strength of PU and FRPU in this study compared to other studies with TPU, PU, TPU composite, and PU composite materials. From Tables 4 and 5, materials that have the potential to be developed as alternative core layers for SSPS are identified. The flexible materials that are considered to have the potential to function as core materials encompass TPU, PU, TPU composite, and PU composite materials, including the PU material on a sandwich plate that has been patented, namely the SPS. However, all of the materials listed in Tables 4 and 5 are materials that have a general application, except for the material under investigation in this study, which is developed explicitly for marine and ship applications. Moreover, Tables 4 and 5 indicate that research on the development of materials tailored for marine and ship applications, especially for core materials from SSPS, remains significantly underexplored.
Elastic moduli of PU and PU elastomer composites compared with other studies
| Reference | Material | Elastic modulus (MPa) |
|---|---|---|
| Mi et al. [48] | TPU composite | 11.89 |
| Wang et al. [58] | PU | 12 |
| Xiao et al. [68] | PU | 17 |
| Nozaki et al. [67] | PU | 19.1 |
| Chen et al. [56] | PU composite | 19.13 |
| Elkazaz et al. [66] | PU | 22.59 |
| Saliba et al. [23] | PU composite | 23.86 |
| Reis et al. [28] | PU composite | 26.41 |
| Xiang et al. [51] | PU | 43.1 |
| Pei et al. [34] | PU composite | 44.9 |
| Elkazaz et al. [66] | PU composite | 45 |
| Xiao and Sue [65] | TPU | 55.4 |
| Tayfun et al. [35] | PU composite | 74.8 |
| Tayfun et al. [35] | PU composite | 83.2 |
| Li et al. [64] | PU | 176.4 |
| Current study | PU | 387 |
| Ryu et al. [63] | PU | 650 |
| De Freitas et al. [60] | PU | 721 |
| Stephen et al. [62] | PU | 750 |
| Shan [61] | PU | 800 |
| De Freitas et al. [60] | PU | 874 |
| Current study | PFg-7 | 901.95 |
| Current study | PFg-9 | 1569.55 |
| Current study | PFg-11 | 1649.35 |
| Current study | PFg-15 | 2176.17 |
| Wilberforce and Hashemi [27] | TPU composite | 2220.93 |
Yield strengths of PU and PU elastomer composites compared with other studies
| Reference | Material | Yield strength (MPa) |
|---|---|---|
| Cruz and Viana [71] | TPU | 2.1 |
| Cruz and Viana [71] | TPU composite | 2.19 |
| Cruz and Viana [71] | TPU composite | 2.27 |
| Cruz and Viana [71] | TPU composite | 2.29 |
| Cruz and Viana [71] | TPU composite | 2.34 |
| Wang et al. [58] | PU | 3.5 |
| Elkazaz et al. [66] | PU composite | 8 |
| Mahapatra et al. [70] | PU | 8.8 |
| Current study | PU | 9.99 |
| Su et al. [69] | PU composite | 10.3 |
| Mahapatra et al. [70] | PU | 11.4 |
| Su et al. [69] | PU composite | 12.3 |
| Mahapatra et al. [70] | PU | 13.2 |
| Mahapatra et al. [70] | PU | 15 |
| De Freitas et al. [60] | PU | 15.1 |
| Su et al. [69] | PU composite | 15.2 |
| Su et al. [69] | PU composite | 17.7 |
| Current study | PFg-7 | 17.91 |
| Su et al. [69] | PU composite | 21.3 |
| Current study | PFg-9 | 25.14 |
| De Freitas et al. [60] | PU | 26 |
| Current study | PFg-11 | 26.39 |
| Current study | PFg-15 | 30.89 |
Table 4 shows that the elastic moduli of PFg-7, PFg-9, PFg-11, and PFg-15 were higher than the other 21 references. Previous studies [23,28,34,35,51,52,56,58,60–68] show an elastic modulus of 11.89–874 MPa, which is lower than the elastic modulus results of PFg-7, PFg-9, PFg-11, and PFg-15 of 901.95–2176.17 MPa. The elastic modulus of PFg-15 is slightly lower than the elastic modulus of the study of Wilberforce and Hashemi [27] of 2,221 MPa. On the contrary, Det Norske Veritas (DNV) established a standard for the elastic modulus of SSPS core materials, which necessitates a value above 200 MPa [72]. Drawing upon Table 4, PU elastomer (solid polymer), mentioned in previous studies [60–63], and injection-molded TPU reinforced with short glass fibers, mentioned in the study of Wilberforce and Hashemi [27], exhibit an elastic modulus exceeding 200 MPa and are viable candidates for being subjected to four additional LR criteria tests. These evaluations were conducted to assess the suitability of the material as a core material for SSPS in accordance with LR and DNV standards.
Meanwhile, the yield strengths of PFg-11 and PFg-15 (26.4 and 30.9 MPa) were the highest compared to previous studies [58,60,66,69–71] in Table 5. Only two previous studies [60,69] are close to the yield strengths of PFg-7, PFg-11, and PFg-15. In other studies, the yield strength ranges between 2.1 and 17.7 MPa. Compared to other studies, the relatively high elastic modulus and yield strength indicated that the FRPU composite was a promising material for further development, not only for the core material of SSPS but also for different system applications. On the other hand, the PU material investigated in this study satisfied all of the LR criteria. Therefore, the yield strength value of 9.99 MPa exhibited by the PU material can serve as a benchmark for the advancement of alternative core materials. Among the earlier studies referenced in Table 5, PU elastomer and nanostructured hyperbranched PU elastomer hybrids discussed in previous studies [60,70], and synthesized polyester PU elastomer composite mentioned in the study of Su et al. [69] hold the potential to be advanced as core materials (via testing of the remaining four LR criteria, namely density, hardness, UTS, and elongation at break) since they possess a yield strength exceeding 9.99 MPa.
PFg-7 still had ductile PU elastomer properties. Meanwhile, PFg-9, PFg-11, and PFg-15 showed brittle properties, as indicated by toughness and elongation at break. In contrast to hardness, elastic modulus, and yield strength, which had an increasing pattern, toughness and elongation at break had a decreasing pattern with the addition of fiberglass composition. The higher the fiberglass composition, the lower the toughness (as a function of the stress–strain curve area) and elongation at break (Figure 11). The highest toughness was achieved by PU at 33.73 MJ/m3, while PFg-15 obtained the lowest toughness at 1.29 MJ/m3. The toughness of PU in this study was lower than that of PU in Pei et al.’s study of 37 MJ/m3 [34].
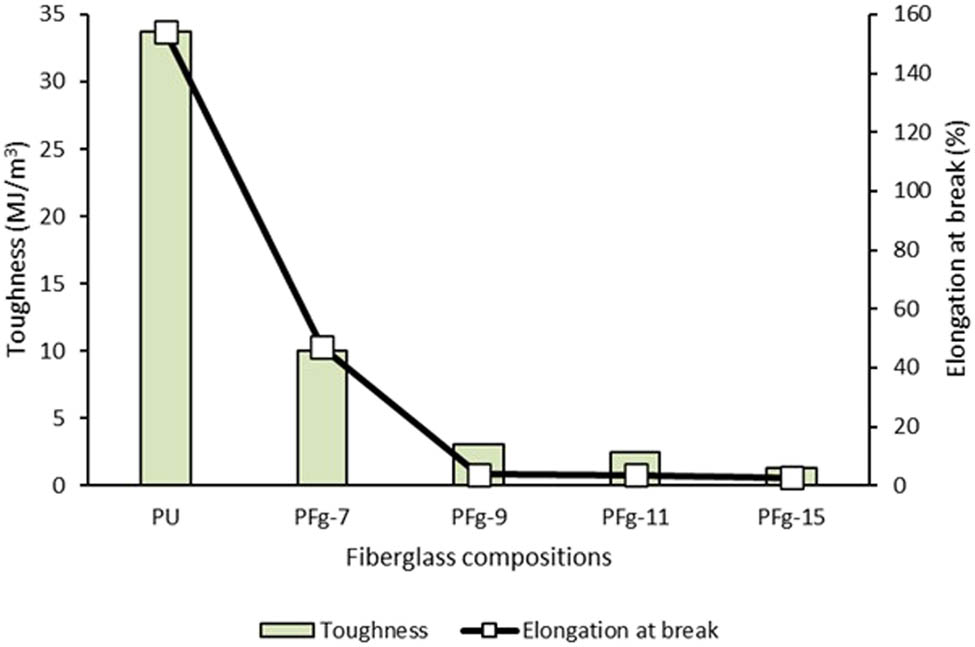
Toughness and elongation at break of PU and PU elastomer composites in several fiberglass compositions.
PU and PFg-7 had shown potential as core materials for SSPS, but it is important to note that there could be other potential applications for these materials beyond SSPS. Further research is necessary to explore the compatibility and suitability of other FRPU composites, such as PFg-9, PFg-11, and PFg-15, for various structural applications, considering their interesting hardness, elastic modulus, and yield strength values. It is worth mentioning that the appropriate bonding technique between the faceplate and the core of SSPS has not been widely published, and debonding during the manufacturing process can be a challenge [73,74,75,76]. Future research could focus on investigating the best bonding technique to prevent debonding and improve the overall strength and durability of the structure. Additionally, bond shear tests and bending tests of SSPS with the FRPU composite core material could be conducted to better understand the mechanical properties of the system. Such tests could provide valuable insight into the strength, stiffness, and other characteristics of the materials under different loading conditions, which could indicate their applications in various structural systems.
4 Conclusion
The FRPU compatibility study as a novel core material of the SSPS had been experimentally conducted. PU and PFg-7 met several LR criteria, including hardness, density, UTS, and elongation at break. However, PFg-7 had better mechanical characteristics for the core material of SSPS because PFg-7 had higher hardness, elastic modulus, and yield strength than PU. The fiberglass content in PFg-7 also had the potential to make the core material more economical than PU. The use of PFg-7 as a core material was of low-cost and expected to get a more robust core material in withstanding various ship structural loads.
In the plastic area, PU experienced strain-hardening crack bridging, while the FRPU composite experienced softening crack bridging. Stress was borne by fiberglass at a very low strain level. In higher strain levels, PU elastomers distributed tensile stress to prevent premature failure. The combination of matrix and reinforcement worked quite well on PFg-7 so that PFg-7 had the highest elongation at break and toughness among other FRPU composites. Moreover, PFg-7 had a combination of ductile PU and brittle FRPU composite. The ductile properties of PFg-7 can be seen from the 47% elongation at break, and the brittle properties of PFg-7 can be seen from the 901 MPa elastic modulus. So, it does not rule out that PFg-7 can be applied to systems that require moderate elastic modulus and elongation at break. Meanwhile, PFg-9, PFg-11, and PFg-15 need to be further explored for their suitability in other systems considering that these materials have attractive hardness, elastic modulus, and yield strength compared to PU, PU composite, TPU, and TPU composite from other studies.
Acknowledgments
This research was funded by The Ministry of Education, Culture, Research, and Technology of The Republic of Indonesia under “Penelitian Dasar Unggulan Perguruan Tinggi” research scheme with contract numbers 008/E5/PG.02.00.PT/2022 and 1526/PKS/ITS/2022.
-
Author contributions: All authors have accepted responsibility for the entire content of this manuscript and approved the final paper. Abdi Ismail was the main contributor of this paper.
-
Conflict of interest: The authors state no conflict of interest.
References
[1] Ismail A, Zubaydi A, Piscesa B, Ariesta RC. Vibration-based damage identification for ship sandwich plate using finite element method. Open Eng. 2020;10(1):744–52.10.1515/eng-2020-0086Suche in Google Scholar
[2] Momčilović N, Motok M. Estimation of ship lightweight reduction by means of application of sandwich plate system. FME Trans. 2009;37(3):123–8.Suche in Google Scholar
[3] Brooking M, Kennedy S. The performance, safety and production benefits of SPS structures for double hull tankers. Proceedings of the RINA Conference on Double Hull Tankers. London, UK; 2004. 10.3940/rina.dht.2004.7.Suche in Google Scholar
[4] Mohamed M, Anandan S, Huo Z, Birman V, Volz J, Chandrashekhara K. Manufacturing and characterization of polyurethane based sandwich composite structures. Compos Struct. 2015;123:169–79.10.1016/j.compstruct.2014.12.042Suche in Google Scholar
[5] Yang JS, Ma L, Schmidt R, Qi G, Schröder KU, Xiong J, et al. Hybrid lightweight composite pyramidal truss sandwich panels with high damping and stiffness efficiency. Compos Struct. 2016;148:85–96.10.1016/j.compstruct.2016.03.056Suche in Google Scholar
[6] Zhang X, Zhou H, Shi W, Zeng F, Zeng H, Chen G. Vibration tests of 3D printed satellite structure made of lattice sandwich panels. AIAA J. 2018;56:4213–7.10.2514/1.J057241Suche in Google Scholar
[7] Li C, Shen HS, Wang H. Nonlinear bending of sandwich beams with functionally graded negative Poisson’s ratio honeycomb core. Compos Struct. 2019;212:317–25.10.1016/j.compstruct.2019.01.020Suche in Google Scholar
[8] Ardhyananta H, Sari EN, Wicaksono ST, Ismail H, Tuswan, Ismail A. Characterization of vinyl ester bio-resin for core material sandwich panel construction of ship structure application: Effect of palm oil and sesame oil. International Conference on Science and Applied Science (ICSAS) 2019; 2019 Jul 20; Surakarta, Indonesia. AIP Conference Proceedings, 2019. p. 020051.10.1063/1.5141664Suche in Google Scholar
[9] Tuswan T, Sari EN, Ismail A, Prabowo AR. Experimental evaluation on palm oil and sesame oil-based resin properties as core sandwich material for lightweight ship structure. Int J Eng Trans C: Asp. 2022;35(9):1690–8.10.5829/IJE.2022.35.09C.03Suche in Google Scholar
[10] Ramakrishnan KV, Kumar PGS. Applications of Sandwich Plate System for Ship Structures. IOSR J Mech Civ Eng. 2016;83–90.Suche in Google Scholar
[11] Sujiatanti SH, Zubaydi A, Budipriyanto A. Finite element analysis of ship deck sandwich panel. Appl Mech Mater. 2018;874:134–9.10.4028/www.scientific.net/AMM.874.134Suche in Google Scholar
[12] Yazici M, Wright J, Bertin D, Shukla A. Experimental and numerical study of foam filled corrugated core steel sandwich structures subjected to blast loading. Compos Struct. 2014;110:98–109.10.1016/j.compstruct.2013.11.016Suche in Google Scholar
[13] Shan C, Yi Y. Stress concentration analysis of an orthotropic sandwich bridge deck under wheel loading. J Constr Steel Res. 2016;122:488–94.10.1016/j.jcsr.2016.04.011Suche in Google Scholar
[14] Register’s L. Rules for the application of sandwich panel construction to ship structure. London, UK: Lloyd’s Register Group Limited; 2020.Suche in Google Scholar
[15] Ismail A, Zubaydi A, Piscesa B, Tuswan T, Ariesta RC. Study of sandwich panel application on side hull of crude oil tanker. J Appl Eng Sci. 2021;19(4):1090–8.10.5937/jaes0-30373Suche in Google Scholar
[16] Ariesta RC, Tuswan T, Zubaydi A, Ismail A. Identification of damage size effect of natural frequency on sandwich material using free vibration analysis. Nase More. 2022;69(1):1–8.10.17818/NM/2022/1.1Suche in Google Scholar
[17] Utomo E, Zubaydi A, Pratisna P. Study of core material sandwich panel in ship construction. The 2nd International Seminar on Science and Technology; 2016 Aug 2; Surabaya, Indonesia. IPTEK J Proc Ser 2017;2:93–8.10.12962/j23546026.y2017i2.2304Suche in Google Scholar
[18] Zubaydi A, Budipriyanto A, Iswidodo W. Sandwich core material development for ship deck structure. The Third International Conference on Civil Engineering Research (ICCER), Regional Conference in Civil Engineering (RCCE); 2017 Aug 1–2; Surabaya, Indonesia. p. 86–91.10.12962/j23546026.y2017i6.3237Suche in Google Scholar
[19] Sathishkumar TP, Satheeshkumar S, Naveen J. Glass fiber-reinforced polymer composites - A review. J Reinforced Plast Compos. 2014;33(13):1258–75.10.1177/0731684414530790Suche in Google Scholar
[20] Liu X, Xu Y, Ben K, Chen Z, Wang Y, Guan Z. Transparent, durable and thermally stable PDMS-derived superhydrophobic surfaces. Appl Surf Sci. 2015;339:94–101.10.1016/j.apsusc.2015.02.157Suche in Google Scholar
[21] Zang D, Liu F, Zhang M, Niu X, Gao Z, Wang C. Superhydrophobic coating on fibreglass cloth for selective removal of oil from water. Chem Eng J. 2015;262:210–6.10.1016/j.cej.2014.09.082Suche in Google Scholar
[22] Yadav SPS, Verma AS. Fabrication of composite material using jute fiber/glass fiber. Int Res J Eng Technol. 2017;4(8):892–7.Suche in Google Scholar
[23] Saliba CC, Oréfice RL, Carneiro JRG, Duarte AK, Schneider WT, Fernandes MRF. Effect of the incorporation of a novel natural inorganic short fiber on the properties of polyurethane composites. Polym Test. 2005;24(7):819–24.10.1016/j.polymertesting.2005.07.008Suche in Google Scholar
[24] Husic S, Javni I, Petrovic ZS. Thermal and mechanical properties of glass reinforced soy-based polyurethane composites. Compos Sci Technol. 2005;65(1):19–25.10.1016/j.compscitech.2004.05.020Suche in Google Scholar
[25] Zhang H, Li W, Yang X, Zhang Y, Chen Y. Microstructural characterizations and mechanical behavior of polyurethane elastomers strengthened with milled fiberglass. J Mater Process Technol. 2007;190(1–3):96–101.10.1016/j.jmatprotec.2007.02.053Suche in Google Scholar
[26] Zhang H, Li W, Yang X, Lu L, Wang X, Sun X, et al. Development of polyurethane elastomer composite materials by addition of milled fiberglass with coupling agent. Mater Lett. 2007;61(6):1358–62.10.1016/j.matlet.2006.07.031Suche in Google Scholar
[27] Wilberforce S, Hashemi S. Effect of fibre concentration, strain rate and weldline on mechanical properties of injection-moulded short glass fibre reinforced thermoplastic polyurethane. J Mater Sci. 2009;44(5):1333–43.10.1007/s10853-008-3233-6Suche in Google Scholar
[28] Reis JML, Chaves FL, da Costa Mattos HS. Tensile behaviour of glass fibre reinforced polyurethane at different strain rates. Mater Des. 2013;49:192–6.10.1016/j.matdes.2013.01.065Suche in Google Scholar
[29] Da Costa Mattos HS, Reis JML, Paim LM, da Silva ML, Amorim FC, Perrut VA. Analysis of a glass fibre reinforced polyurethane composite repair system for corroded pipelines at elevated temperatures. Compos Struct. 2014;114:117–23.10.1016/j.compstruct.2014.04.015Suche in Google Scholar
[30] Elkazaz E, Crosby WA, Ollick AM, Elhadary M. Effect of fiber volume fraction on the mechanical properties of randomly oriented glass fiber reinforced polyurethane elastomer with crosshead speeds. Alex Eng J. 2020;59(1):209–16.Suche in Google Scholar
[31] ASTM D2734. Standard test methods for void content of reinforced plastics. West Conshohocken (PA), USA: ASTM International; 2003.Suche in Google Scholar
[32] DIN 53505. Shore A and Shore D hardness testing of rubber. Berlin, Germany: Deutsches Institut fur Normung E.V. (DIN); 2000.Suche in Google Scholar
[33] ASTM D412. Standard test methods for vulcanized rubber and thermoplastic elastomers – tension. West Conshohocken (PA), USA: ASTM International; 2002.Suche in Google Scholar
[34] Pei A, Malho JM, Ruokolainen J, Zhou Q, Berglund LA. Strong nanocomposite reinforcement effects in polyurethane elastomer with low volume fraction of cellulose nanocrystals. Macromolecules. 2011;44(11):4422–7.10.1021/ma200318kSuche in Google Scholar
[35] Tayfun U, Kanbur Y, Abac U, Güney HY, Bayraml E. Mechanical, electrical, and melt flow properties of polyurethane elastomer/surface-modified carbon nanotube composites. J Compos Mater. 2017;51(14):1987–96.10.1177/0021998316666158Suche in Google Scholar
[36] Ma RY, Yi YH. Study on thermal stability and aging resistance of high hardness polyurethane elastomer via thermal analysis. Adv Mater Res. 2013;849:261–4.10.4028/www.scientific.net/AMR.849.261Suche in Google Scholar
[37] Lopes MC, de Castro VG, Seara LM, Diniz VPA, Lavall RL, Silva GG. Thermosetting polyurethane-multiwalled carbon nanotube composites: Thermomechanical properties and nanoindentation. J Appl Polym Sci. 2014;131:23.10.1002/app.41207Suche in Google Scholar
[38] Chun-Ta Y, Chiu-Chun L, Fu-Ming W, Lung-Chang L, Wen-Chung L, Chih-Lang W, et al. Fabrication of thermoplastic polyurethane (TPU)/thermoplastic amide elastomer (TPAE) composite foams with supercritical carbon dioxide and their mechanical properties. J Manuf Process. 2019;48:127–36.10.1016/j.jmapro.2019.09.022Suche in Google Scholar
[39] Yuan Y, Wang S, Tan P, Zhu H. Mechanical performance and shear constitutive model study of a new high-capacity polyurethane elastomeric bearing. Constr Build Mater. 2020;232:117227.10.1016/j.conbuildmat.2019.117227Suche in Google Scholar
[40] Zhao Z, Guo Q, Qian J, Pan G. Mechanical properties and tribological behaviour of polyurethane elastomer reinforced with CaCO3 nanoparticles. Polym Polym Compos. 2012;20(7):575–80.10.1177/096739111202000701Suche in Google Scholar
[41] Somarathna H, Raman S, Badri K, Mutalib A, Mohotti D, Ravana S. Quasi-static behavior of palm-based elastomeric polyurethane: for strengthening application of structures under impulsive loadings. Polymers. 2016;8(5):202.10.3390/polym8050202Suche in Google Scholar PubMed PubMed Central
[42] Barczewski M, Wojciechowska P, Szostak M. Mechanical properties and structure of reactive rotationally molded polyurethane - basalt powder composites. Springer Theses; 2019. p. 601–9.10.1007/978-3-030-16943-5_52Suche in Google Scholar
[43] Bartolomé L, Aginagalde A, Martínez AB, Urchegui MA, Tato W. Experimental characterization and modelling of large-strain viscoelastic behavior of a thermoplastic polyurethane elastomer. Rubber Chem Technol. 2013;86(1):146–64.10.5254/rct.13.87998Suche in Google Scholar
[44] Bartolomé L, Aurrekoetxea J, Urchegui MA, Tato W. The influences of deformation state and experimental conditions on inelastic behaviour of an extruded thermoplastic polyurethane elastomer. Mater Des. 2013;49:974–80.10.1016/j.matdes.2013.02.055Suche in Google Scholar
[45] Ashrafizadeh H, Mertiny P, McDonald A. Evaluation of the effect of temperature on mechanical properties and wear resistance of polyurethane elastomers. Wear. 2016;368–369:26–38.10.1016/j.wear.2016.08.008Suche in Google Scholar
[46] Sikorski W. Active dielectric window: a new concept of combined acoustic emission and electromagnetic partial discharge detector for power transformers. Energies. 2019;12(1):115.10.3390/en12010115Suche in Google Scholar
[47] Tao HT, Liu XJ, Ma TN. Preparation and mechanical properties of polyurethane elastomer with two soft segments of HTPB/PTMG. Adv Mater Res. 2010;150–151:1689–92.10.4028/www.scientific.net/AMR.150-151.1689Suche in Google Scholar
[48] Mi HY, Li Z, Turng LS, Sun Y, Gong S. Silver nanowire/thermoplastic polyurethane elastomer nanocomposites: Thermal, mechanical, and dielectric properties. Mater Des. 2014;56:398–404.10.1016/j.matdes.2013.11.029Suche in Google Scholar
[49] Calvo-Correas T, Ugarte L, Trzebiatowska PJ, Sanzberro R, Datta J, Corcuera MÁ, et al. Thermoplastic polyurethanes with glycolysate intermediates from polyurethane waste recycling. Polym Degrad Stab. 2017;144:411–9.10.1016/j.polymdegradstab.2017.09.001Suche in Google Scholar
[50] Dutta J, Naskar K. Investigation of morphology, mechanical, dynamic mechanical and thermal behaviour of blends based on ethylene vinyl acetate (EVA) and thermoplastic polyurethane (TPU). RSC Adv. 2014;4(105):60831–41.10.1039/C4RA07823CSuche in Google Scholar
[51] Xiang D, Liu L, Liang Y. Effect of hard segment content on structure, dielectric and mechanical properties of hydroxyl-terminated butadiene-acrylonitrile copolymer-based polyurethane elastomers. Polymer. 2017;132:180–7.10.1016/j.polymer.2017.11.001Suche in Google Scholar
[52] Somdee P, Lassu-Kuknyo T, Konya C, Marossy K. Influence of chain extender on soft and hard segment of polyurethane elastomers. Mater Sci Eng. 2018;43(1):98–107.Suche in Google Scholar
[53] Parcheta P, Głowińska E, Datta J. Effect of bio-based components on the chemical structure, thermal stability and mechanical properties of green thermoplastic polyurethane elastomers. Eur Polym J. 2019;123:109422.10.1016/j.eurpolymj.2019.109422Suche in Google Scholar
[54] Ljubic D, Srinivasan M, Szoszkiewicz R, Javni I, Petrović ZS. Surface modified graphene/single-phase polyurethane elastomers with improved thermo-mechanical and dielectric properties. Eur Polym J. 2015;70:55–65.10.1016/j.eurpolymj.2015.07.008Suche in Google Scholar
[55] Wu T, Chen B. Facile fabrication of porous conductive thermoplastic polyurethane nanocomposite films via solution casting. Sci Rep. 2017;7(1):17470.10.1038/s41598-017-17647-wSuche in Google Scholar PubMed PubMed Central
[56] Chen T, Pan L, Lin M, Wang B, Liu L, Li Y. Dielectric, mechanical and electro-stimulus response properties studies of polyurethane dielectric elastomer modified by carbon nanotube-graphene nanosheet hybrid fillers. Polym Test. 2015;47:4–11.10.1016/j.polymertesting.2015.08.001Suche in Google Scholar
[57] Czuprynski M. Polyurethane elastomers filled with granulated rubber. Int Polym Sci Technol. 2004;31(5):73–6.10.1177/0307174X0403100515Suche in Google Scholar
[58] Wang F, Chen S, Wu Q, Zhang R, Sun P. Strain-induced structural and dynamic changes in segmented polyurethane elastomers. Polymer. 2019;163:154–61.10.1016/j.polymer.2018.12.062Suche in Google Scholar
[59] Patel VK, Rawat N. Physico-mechanical properties of sustainable Sagwan-Teak Wood Flour/Polyester Composites with/without gum rosin. Sustain Mater Technol. 2017;13:1–8.10.1016/j.susmat.2017.05.002Suche in Google Scholar
[60] De Freitas ST, Kolstein H, Bijlaard F. Sandwich system for renovation of orthotropic steel bridge decks. J Sandw Struct Mater. 2010;13(3):279–301.10.1177/1099636210386848Suche in Google Scholar
[61] Shan C. Bending performance of steel–polyurethane sandwich plate under local distributed load. Adv Struct Eng. 2017;20(11):1615–22.10.1177/1369433216687567Suche in Google Scholar
[62] Stephen JK, Aldo EM, Alireza M, Fabio Z. Equivalent SPS Compact Double Hull (CDH) bottom structure grounding of inland waterway barges. Ship Sci Technol. 2018;12(23):41–61.10.25043/19098642.170Suche in Google Scholar
[63] Ryu J, Lho SH, Lee CH, Ju YK. Flexural behavior of prestressed sandwich plate system composite beams. Eng Struct. 2020;215:110705.10.1016/j.engstruct.2020.110705Suche in Google Scholar
[64] Li H, Sun JT, Wang C, Liu S, Yuan D, Zhou X, et al. High Modulus, Strength, and Toughness Polyurethane Elastomer Based on Unmodified Lignin. ACS Sustain Chem Eng. 2017;5(9):7942–9.10.1021/acssuschemeng.7b01481Suche in Google Scholar
[65] Xiao S, Sue HJ. Effect of molecular weight on scratch and abrasive wear behaviors of thermoplastic polyurethane elastomers. Polymer. 2019;169:124–30.10.1016/j.polymer.2019.02.059Suche in Google Scholar
[66] Elkazaz E, Crosby WA, Ollick AM, Elhadary M. Effect of fiber volume fraction on the mechanical properties of randomly oriented glass fiber reinforced polyurethane elastomer with crosshead speeds. Alex Eng J. 2019;59(1):209–16.10.1016/j.aej.2019.12.024Suche in Google Scholar
[67] Nozaki S, Masuda S, Kamitani K, Kojio K, Takahara A, Kuwamura G, et al. Superior properties of polyurethane elastomers synthesized with aliphatic diisocyanate bearing a symmetric structure. Macromolecules. 2017;50(3):1008–15.10.1021/acs.macromol.6b02044Suche in Google Scholar
[68] Xiao S, Hossain MM, Liu P, Wang H, Hu F, Sue HJ. Scratch behavior of model polyurethane elastomers containing different soft segment types. Mater Des. 2017;132:419–29.10.1016/j.matdes.2017.07.016Suche in Google Scholar
[69] Su T, Zhang R, Wang J, Shao W, Hu Y. Study on the poly(3-hydroxybutyrate-co−4-hydroxybutyrate)-based composites toughened by synthesized polyester polyurethane elastomer. J Appl Polym Sci. 2015;132(44):42740.10.1002/app.42740Suche in Google Scholar
[70] Mahapatra SS, Yadav SK, Cho JW. Nanostructured hyperbranched polyurethane elastomer hybrids that incorporate polyhedral oligosilsesquioxane. Reactive Funct Polym. 2012;72(4):227–32.10.1016/j.reactfunctpolym.2012.02.001Suche in Google Scholar
[71] Cruz SM, Viana JC. Structure-properties relationships in thermoplastic polyurethane elastomer nanocomposites: interactions between polymer phases and nanofillers. Macromol Mater Eng. 2015;300(11):1153–62.10.1002/mame.201500188Suche in Google Scholar
[72] Det Norske Veritas. Steel Sandwich Panel Construction. Classification notes for ship, No. 30. Norway: DNV; 2012.Suche in Google Scholar
[73] Tuswan T, Zubaydi, Piscesa B, Ismail A, Ilham MF. Free vibration analysis of interfacial debonded sandwich of ferry ro-ro’s stern ramp door. Procedia Struct Integr. 2020;27:22–9.10.1016/j.prostr.2020.07.004Suche in Google Scholar
[74] Tuswan T, Zubaydi A, Piscesa B, Ismail A. Dynamic characteristic of partially debonded sandwich of ferry ro-ro’s car deck: A numerical modeling. Open Eng. 2020;10(1):424–33.10.1515/eng-2020-0051Suche in Google Scholar
[75] Tuswan T, Zubaydi A, Piscesa B, Ismail A, Ariesta RC, Ilham MF, et al. Influence of application of sandwich panel on static and dynamic behaviour of ferry ro-ro ramp door. J Appl Eng Sci. 2021;19(1):208–16.10.5937/jaes0-27708Suche in Google Scholar
[76] Ariesta RC, Zubaydi A, Ismail A, Tuswan T. Damage evaluation of sandwich material on side plate hull using experimental modal analysis. Mater Today: Proc. 2021;47:2310–4.10.1016/j.matpr.2021.04.293Suche in Google Scholar
© 2023 the author(s), published by De Gruyter
This work is licensed under the Creative Commons Attribution 4.0 International License.
Artikel in diesem Heft
- Research Articles
- The mechanical properties of lightweight (volcanic pumice) concrete containing fibers with exposure to high temperatures
- Experimental investigation on the influence of partially stabilised nano-ZrO2 on the properties of prepared clay-based refractory mortar
- Investigation of cycloaliphatic amine-cured bisphenol-A epoxy resin under quenching treatment and the effect on its carbon fiber composite lamination strength
- Influence on compressive and tensile strength properties of fiber-reinforced concrete using polypropylene, jute, and coir fiber
- Estimation of uniaxial compressive and indirect tensile strengths of intact rock from Schmidt hammer rebound number
- Effect of calcined diatomaceous earth, polypropylene fiber, and glass fiber on the mechanical properties of ultra-high-performance fiber-reinforced concrete
- Analysis of the tensile and bending strengths of the joints of “Gigantochloa apus” bamboo composite laminated boards with epoxy resin matrix
- Performance analysis of subgrade in asphaltic rail track design and Indonesia’s existing ballasted track
- Utilization of hybrid fibers in different types of concrete and their activity
- Validated three-dimensional finite element modeling for static behavior of RC tapered columns
- Mechanical properties and durability of ultra-high-performance concrete with calcined diatomaceous earth as cement replacement
- Characterization of rutting resistance of warm-modified asphalt mixtures tested in a dynamic shear rheometer
- Microstructural characteristics and mechanical properties of rotary friction-welded dissimilar AISI 431 steel/AISI 1018 steel joints
- Wear performance analysis of B4C and graphene particles reinforced Al–Cu alloy based composites using Taguchi method
- Connective and magnetic effects in a curved wavy channel with nanoparticles under different waveforms
- Development of AHP-embedded Deng’s hybrid MCDM model in micro-EDM using carbon-coated electrode
- Characterization of wear and fatigue behavior of aluminum piston alloy using alumina nanoparticles
- Evaluation of mechanical properties of fiber-reinforced syntactic foam thermoset composites: A robust artificial intelligence modeling approach for improved accuracy with little datasets
- Assessment of the beam configuration effects on designed beam–column connection structures using FE methodology based on experimental benchmarking
- Influence of graphene coating in electrical discharge machining with an aluminum electrode
- A novel fiberglass-reinforced polyurethane elastomer as the core sandwich material of the ship–plate system
- Seismic monitoring of strength in stabilized foundations by P-wave reflection and downhole geophysical logging for drill borehole core
- Blood flow analysis in narrow channel with activation energy and nonlinear thermal radiation
- Investigation of machining characterization of solar material on WEDM process through response surface methodology
- High-temperature oxidation and hot corrosion behavior of the Inconel 738LC coating with and without Al2O3-CNTs
- Influence of flexoelectric effect on the bending rigidity of a Timoshenko graphene-reinforced nanorod
- An analysis of longitudinal residual stresses in EN AW-5083 alloy strips as a function of cold-rolling process parameters
- Assessment of the OTEC cold water pipe design under bending loading: A benchmarking and parametric study using finite element approach
- A theoretical study of mechanical source in a hygrothermoelastic medium with an overlying non-viscous fluid
- An atomistic study on the strain rate and temperature dependences of the plastic deformation Cu–Au core–shell nanowires: On the role of dislocations
- Effect of lightweight expanded clay aggregate as partial replacement of coarse aggregate on the mechanical properties of fire-exposed concrete
- Utilization of nanoparticles and waste materials in cement mortars
- Investigation of the ability of steel plate shear walls against designed cyclic loadings: Benchmarking and parametric study
- Effect of truck and train loading on permanent deformation and fatigue cracking behavior of asphalt concrete in flexible pavement highway and asphaltic overlayment track
- The impact of zirconia nanoparticles on the mechanical characteristics of 7075 aluminum alloy
- Investigation of the performance of integrated intelligent models to predict the roughness of Ti6Al4V end-milled surface with uncoated cutting tool
- Low-temperature relaxation of various samarium phosphate glasses
- Disposal of demolished waste as partial fine aggregate replacement in roller-compacted concrete
- Review Articles
- Assessment of eggshell-based material as a green-composite filler: Project milestones and future potential as an engineering material
- Effect of post-processing treatments on mechanical performance of cold spray coating – an overview
- Internal curing of ultra-high-performance concrete: A comprehensive overview
- Special Issue: Sustainability and Development in Civil Engineering - Part II
- Behavior of circular skirted footing on gypseous soil subjected to water infiltration
- Numerical analysis of slopes treated by nano-materials
- Soil–water characteristic curve of unsaturated collapsible soils
- A new sand raining technique to reconstitute large sand specimens
- Groundwater flow modeling and hydraulic assessment of Al-Ruhbah region, Iraq
- Proposing an inflatable rubber dam on the Tidal Shatt Al-Arab River, Southern Iraq
- Sustainable high-strength lightweight concrete with pumice stone and sugar molasses
- Transient response and performance of prestressed concrete deep T-beams with large web openings under impact loading
- Shear transfer strength estimation of concrete elements using generalized artificial neural network models
- Simulation and assessment of water supply network for specified districts at Najaf Governorate
- Comparison between cement and chemically improved sandy soil by column models using low-pressure injection laboratory setup
- Alteration of physicochemical properties of tap water passing through different intensities of magnetic field
- Numerical analysis of reinforced concrete beams subjected to impact loads
- The peristaltic flow for Carreau fluid through an elastic channel
- Efficiency of CFRP torsional strengthening technique for L-shaped spandrel reinforced concrete beams
- Numerical modeling of connected piled raft foundation under seismic loading in layered soils
- Predicting the performance of retaining structure under seismic loads by PLAXIS software
- Effect of surcharge load location on the behavior of cantilever retaining wall
- Shear strength behavior of organic soils treated with fly ash and fly ash-based geopolymer
- Dynamic response of a two-story steel structure subjected to earthquake excitation by using deterministic and nondeterministic approaches
- Nonlinear-finite-element analysis of reactive powder concrete columns subjected to eccentric compressive load
- An experimental study of the effect of lateral static load on cyclic response of pile group in sandy soil