Soil–water characteristic curve of unsaturated collapsible soils
-
Qasim A. Al-Obaidi
 and
Tom Schanz
and
Tom Schanz

Abstract
Collapsible soils are almost found in unsaturated states and involved significant engineering problems. Geotechnical challenges of such soils are represented by the hydro-mechanical behaviour during wetting–drying cycles due to the humidity and climate conditions. The main objective of this paper is to investigate the soil–water characteristic curve (SWCC) of unsaturated collapsible soils. In this study, three types of collapsible soils were investigated such as natural soils of sandy gypseous, silty loess, and artificial soil of gypsum–sand mixture. Determination of soil–water characteristic curve represented by wetting and drying paths has been done using a combination of the axis-translation technique (i.e. pressure plate device) and vapour equilibrium technique (i.e. salts solution desiccators) to cover a wide range of applied suction. The test results show that the air-entry value for all soils occurs at a very low suction range. At the boundary effect zone, the coarse grain size of the soil mass cannot hold the water molecules in the pore space, even with a low value of imposed suction. Moreover, the amount of hysteresis varied based on the geological formation and homogeneity of the soil fabric. Furthermore, SWCC has been interpreted by insignificant volume change and a slight reduction in void ratio, especially at high applied suction.
1 Introduction
In recent decades, many geotechnical problems such as collapse deformation and foundation failure were observed. Deformation of the engineering constructions is commonly occurred when carried out on collapsible soil layers, especially in unsaturated conditions [1]. The collapse deformation can be expected in single or multi-step wetting process. Soil wetting due to the reduction in suction pressure leads to particle softening, dissolution of cementing bonds, and hydro-mechanical changes within the soil skeleton [2,3].
Soil suction is a general term that is commonly associated with unsaturated soil mechanics and may be used when referring to matric suction, osmotic suction, or total suction [4,5]. Thus, the relationship between the suction types can be formulated as follows:
where
To study and solve the air and water flow problems and to analyse seepage, shear strength, and volume change behaviour involving unsaturated and saturated soils, the soil–water characteristic curve (SWCC) is required [5,6]. The SWCC is the denotation of the water content or degree of saturation of the soil corresponding to the soil suction [6,7]. A combination of two methods must be utilized to determine the SWCC because there is no unique technique or device that can cover the entire range of unsaturated soil suction values [6]. The most common laboratory technique is the axis-translation technique (ATT), which utilizes the porous ceramic disks in a pressure plate apparatus. This method can cover matric suction range equal to the maximum air-entry value of the ceramic disk of 1500 kPa. However, a controlled relative humidity environment (i.e. vapour equilibrium technique (VET)) is used to apply total suction up to more than 250000 kPa depending on the type and concentration of salt solutions used [2,6,8].
In general, the SWCC commonly consists of the drying path and the wetting path. To determine the drying path, the applied suction is increased incrementally on the initially fully saturated sample under zero net vertical stress. The volume and the amount of water in the saturated sample are slightly decreased as the suction increases until the air-entry value suction
2 Material, equipment, and techniques
2.1 Soil
Three types of soils were used: Gypseous sand soil of (70%) gypsum content from Al-Ramadi city, Iraq (GI); Loess silt soil from Dresden region, Germany (LG); and artificial sample of (70%) gypsum–(30%) Silber sand mixture (70G30S) [1,3]. The summary of the geotechnical properties of the soil samples is shown in Table 1.
Summary of the geotechnical properties of the soil samples
| Property | Gypseous soil GI | Mixed soil 70G30S | Loess soil LG | Standard |
|---|---|---|---|---|
| Atterberg’s limits: LL, PL, PI (%) | NP | NP | 28.2, 16.8, 11.4 | ASTM D4318 |
| Specific gravity (Gs) | 2.35 | 2.4 | 2.63 | ASTM D854 |
| In place dry density (g/cm3) | 1.3 | — | 1.6 | ASTM D2937 |
| Standard compaction test | ASTM D1557 | |||
| Max.dry density (g/cm3) | 1.7 | 1.69 | 1.74 | |
| Opt. moisture content (%) | 8.0 | 12.9 | 16.4 | |
| Natural void ratio,
|
0.81 | — | 0.64 | |
| Cu | 11.58 | 19.4 | — | ASTM D422 |
| Cc | 0.33 | 0.16 | — | |
| Passing sieve (75 µ) (%) | 22.1 | 35.5 | 98 | |
| Initial suction
|
139280 | 198016 | 111311 | Chilled-Mirror [11] |
| Collapse potential
|
9.3 | 11.1 | 5.4 | ASTM D5333 [1,2] |
2.2 Equipment and techniques
Two techniques were used during the determination of SWCC to cover wide range of imposed suction. The first technique is the axis-translation technique (ATT) using pressure plate apparatus, and the second is the vapour equilibrium technique (VET) using constant relative humidity desiccators with salt solutions.
2.2.1 Pressure plate apparatus
Pressure plate apparatus with ATT technique is used to determine parts of the drying and wetting paths of SWCC by applying matric suction range less than 1500 kPa as shown in Figure 1. The soil specimen was prepared in a Plexiglas plastic ring with a diameter of 50 mm and a height of 15 mm.

Pressure plate apparatus with axis-translation technique (ATT): (a) device set up; (b) schematic plot.
Three types of saturated and air-flushed ceramic disks with different air-entry values
2.2.2 Constant relative humidity desiccators
The constant relative humidity desiccators with the VET technique are utilized for continuing the determination of the rest parts of the drying and wetting paths of the SWCC. Many large and leak-proof desiccators containing different concentrations of salt solutions were used to apply total suction range >2000 kPa on the soil specimens, as shown in Figure 2. The actual total suction based on the relative humidity of the salt solutions was measured at the beginning and the end of the test using the chilled-mirror hygrometer technique [11]. The isolated chamber of constant temperature (22 ± 0.5°C) is used to conduct the test.

Constant relative humidity desiccators with vapour equilibrium technique (VET): (a) desiccators set up; (b) schematic plot.
3 Best-fit laboratory data for the SWCC
3.1 Van Genuchten (1980)–Mualem (1976) model
Van Genuchten [12] proposed a mathematical function which connected the soil suction and the water content as demonstrated in Eq. (2). In order to unify (n and m) parameters in a single variable, Van Genuchten (1980) used Mualem's (1976) relationship between (n and m) as shown in Eq. (3):
where
3.2 Fredlund and Xing (1994) model
The Fredlund and Xing [10] SWCC equation which expressed in Eqs. (4) or (8) is used the correction factor
or
If the SWCC is required to fit only between saturated conditions and residual conditions, another form of Eq. (6) can be used to obtain best fit for the experimental data as follows:
where
The fitting parameters (a, m, and n) used to obtain the best fit for SWCC as well as the standard regression (R 2) are illustrated in Table 2.
Fitting parameters for drying and wetting paths of SWCCs of GI, 70G30S, and LG soils
| Model | Van Genuchten (1980)–Mualem (1976) | Fredlund and Xing (1994) | ||||||
|---|---|---|---|---|---|---|---|---|
| Parameter | a | m | n | R 2 | a | m | n | R 2 |
| GI | ||||||||
| Drying-w | 0.55 | 0.26 | 1.35 | 0.990 | 5.5 | 1.2 | 1.2 | 0.974 |
| Drying-Sr | 0.3 | 0.31 | 1.44 | 0.980 | 4.5 | 1.0 | 1.4 | 0.984 |
| Wetting-w | 0.7 | 0.26 | 1.35 | 0.902 | 3.0 | 0.58 | 5.0 | 0.982 |
| Wetting-Sr | 0.7 | 0.26 | 1.35 | 0.903 | 3.0 | 0.58 | 5.0 | 0.981 |
| 70G30S | ||||||||
| Drying-w | 0.15 | 0.35 | 1.55 | 0.994 | 13.0 | 1.75 | 1.0 | 0.996 |
| Drying-Sr | 0.12 | 0.35 | 1.54 | 0.993 | 20.0 | 1.85 | 1.0 | 0.993 |
| Wetting-w | 0.45 | 0.37 | 1.58 | 0.985 | 3.5 | 0.85 | 4.0 | 0.993 |
| Wetting-Sr | 0.45 | 0.37 | 1.58 | 0.985 | 3.5 | 0.85 | 4.0 | 0.993 |
| LG | ||||||||
| Drying-w | 0.042 | 0.26 | 1.35 | 0.993 | 50 | 1.1 | 1.0 | 0.994 |
| Drying-Sr | 0.032 | 0.25 | 1.33 | 0.990 | 50 | 1.0 | 0.9 | 0.992 |
| Wetting-w | 0.4 | 0.17 | 1.21 | 0.981 | 4.0 | 0.43 | 1.9 | 0.994 |
| Wetting-Sr | 0.4 | 0.17 | 1.21 | 0.987 | 5.0 | 0.5 | 1.7 | 0.993 |
4 Results and discussion
Figure 3 shows the variation of void ratio with applied suction in SWCC test-Drying path results for GI, 70G30S, and LG soil samples, while Figures 4–9 and Table 3 demonstrate the results of gravimetric water content versus suction and degree of saturation versus suction, respectively (i.e. SWCCs). Figures 10–12 indicate the verification of experimental data with predicted data.
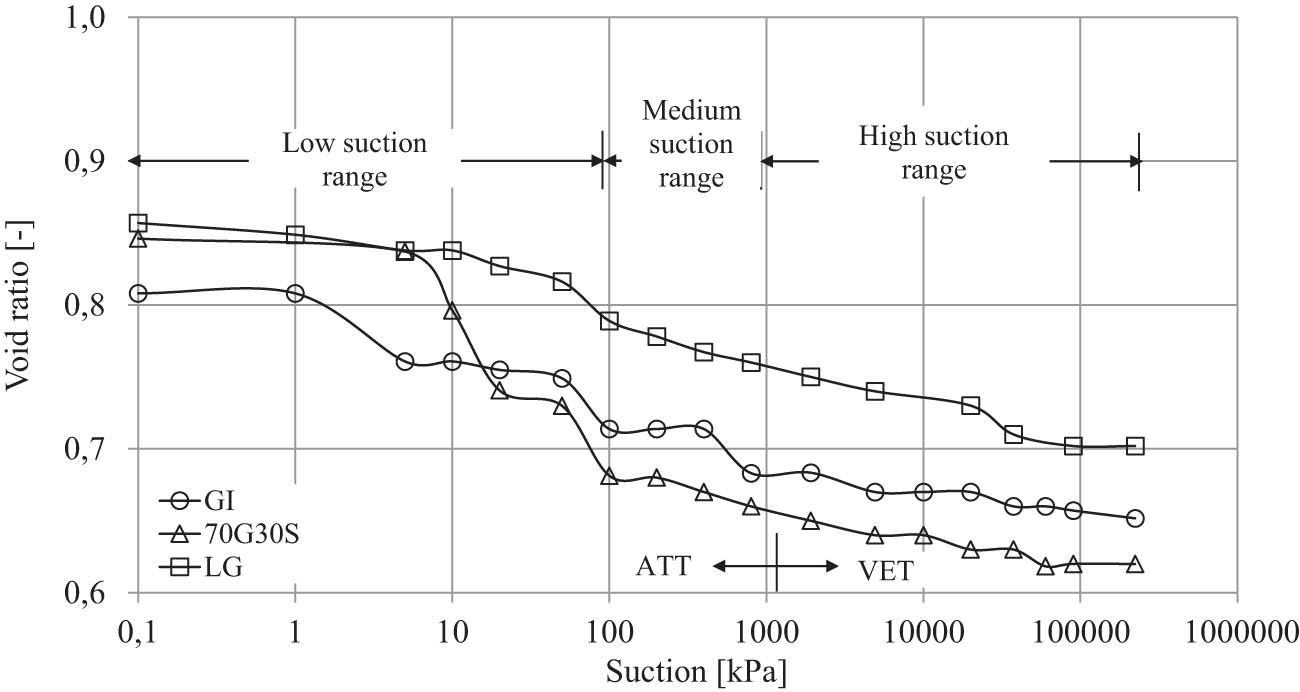
Variation of void ratio with applied suction in SWCC test-drying path results for GI, 70G30S, and LG soil samples.

Soil–water characteristic curve, gravimetric water content versus suction for GI soil.

Soil–water characteristic curve, gravimetric water content versus suction for 70G30Ssoil.

Soil–water characteristic curve, gravimetric water content versus suction for LG soil.

Soil–water characteristic curve (SWCC), degree of saturation versus suction for GI soil.

Soil–water characteristic SWCC, degree of saturation versus suction for 70G30S soil.

Soil–water characteristic curve (SWCC), degree of saturation versus suction for LG soil.
Initial suction, air entry value and residual suction of SWCC
| Soil sample | Initial suction
|
Air entry value (
|
Residual suction (
|
|---|---|---|---|
| GI | 139280 | 2 | 70 |
| 70G30S | 198016 | 4 | 250 |
| LG | 111311 | 15 | 2000 |

Verification of experimental with predicted data of SWCC: (left) gravimetric water content (w) results and (right) degree of saturation (Sr) results for GI soil.

Verification of experimental with predicted data of SWCC: (left) gravimetric water content (w) results and (right) degree of saturation (Sr) results for 70G30S soil.

Verification of experimental with predicted data of SWCC: (left) gravimetric water content (w) results and (right) degree of saturation (Sr) results for LG soil.
From Figure 3, it can be noticed that the SWCC has been interpreted by insignificant volume change throughout the test, especially at high applied suction. However, slight reduction in void ratio is observed during the drying path when for suction values lower than 1500 kPa. This behaviour can be attributed to shrinkage of the soil mass due to an increase in the rate of desorption as well as increasing suction application.
From the SWCCs of both GI (Figures 4 and 6) and 70G30S (Figures 5 and 8) soils, it can be observed that the air-entry value
By comparing the SWCCs for both GI (Figures 4 and 6) and 70G30S (Figures 5 and 8) soils, the transition zone of 70G30S soil was greater and flatter than the transition zone of GI soil, where the residual suction of 70G30S soil exceeded the residual suction of GI soil by approximately five times. However, the gypsum cementing structure showed considerable hysteresis on its SWCC with a clear increase in the magnitude of hysteresis for 70G30S soil. This behaviour can be related to the type and the difference in geological formation and homogeneity of soil fabric and gypsum bonds.
For LG soil, the
In general, hysteresis in SWCCs for all soil specimens exists. This can be related to two reasons: first, the difference in the contact angles and/or open end pores because of cementing bonds dissolution. This action occurred when withdrawing the soil–water interface during drying and when proceeding during wetting, such as in Gypseous soils (GI and 70G30S). Second, the non-uniformity formation of the individual trapped air and pores media causes an ‘ink bottle’ effect phenomenon [13] such as in Loess soil (LG).
It is worth mentioning that the slope of the SWCCs of the three samples at boundary effect zone is not straight. They show a slight desaturation where the capillary suction in this range is less than the
On the other hand, the drying path of SWCCs for all samples showed also a curvature shape after the residual condition even with a high range of applied suction as in LG soil (Figures 6 and 9). Significant moisture in the microscope level of soil structure is the reason behind this behaviour.
Figures 10–12 show the verification results of experimental data with the predicted data of the SWCCs. Regression analysis for the experimental results using the Van Genuchten (1980)–Mualem (1976) and Fredlund and Xing models reveal the high accuracy of these results in comparison with the predicted data of the SWCCs (Table 2).
The Fredlund and Xing [10] model provided reliable closeness of fit with experimental data sets and more flexibility, particularly at the residual zone of the wetting part at the point of the inflection of the SWCC as confirmed by many researchers such as [5,14].
5 Conclusions
The SWCC has been interpreted by insignificant volume change especially at high applied suction. However, a slight reduction in the void ratio during the drying path is observed. The shrinkage of the soil mass has occurred as a result of increasing the rate of desorption simultaneously with increasing suction application.
The air-entry value for all soils occurs at a low suction range. The residual suction value for gypseous soils occurs at low suction while for loess soil occurs at a relatively high suction range.
At the boundary effect zone, the coarse grain size of the soil mass cannot hold the water molecules in the pore space, even with a low value of imposed suction due to the high permeability and weak interparticle tension forces of the metastable soil.
The hysteresis in SWCC is presented for the three soil samples. The amount of hysteresis varied based on the geological formation and homogeneity of the soil fabric.
Hysteresis in SWCCs caused by the differences in the contact angles; open end pores at the withdrawing and proceeding of soil–water interface as in Gypseous soils. And/or to the non-uniformity of the individual pores and trapped air as in Loess soil.
The slope of the SWCCs at the boundary effect zone for the three soil samples is not straight and shows a slight desaturation where the capillary suction in this range is less than the air entry value.
At the boundary effect zone, the air has not yet completely penetrated into the soil pores. The observed slight desaturation is due to the increase in the applied capillary force (i.e. suction pressure) towards the air-entry value. It caused successive loss of water within the soil mass.
Significant moisture in the microscope level of soil structure is the reason behind the curvature of the drying path of SWCC after the residual condition.
Acknowledgements
I hereby would like to express my gratitude and appreciation to the Chair of Soil Mechanics, Foundation Engineering and Environmental Engineering, Department of Civil and Environmental Engineering, Ruhr-Universität Bochum, Bochum, Germany and German Academic Exchange Service DAAD for their support and cooperation.
-
Funding information: The authors state no funding involved.
-
Author contributions: All authors have accepted responsibility for the entire content of this manuscript and approved its submission.
-
Conflict of interest: The authors state no conflict of interest.
References
[1] Al-Obaidi QA, Schanz T, Ibrahim S. Evaluation of collapse potential investigated from different collapsible soils. In: Laloui L, Ferrari A, editors. Multiphysical testing of soils and shales. Berlin, Heidelberg: Springer; 2012. p. 117–22.10.1007/978-3-642-32492-5_12Search in Google Scholar
[2] Al-Obaidi QA. Hydro-mechanical behaviour of collapsible soils [dissertation]. Bochum: Ruhr-Universität Bochum; 2014.Search in Google Scholar
[3] Al-Obaidi QA, Karim H, Al-Shamoosi A. Collapsibility of gypseous soil under suction control. IOP Conf Ser Mater Sci Eng. 2020;737:012103.10.1088/1757-899X/737/1/012103Search in Google Scholar
[4] Fredlund D, Rahardjo H. Soil mechanics for unsaturated soils. New York: John Wiley & Sons Inc; 1993.10.1002/9780470172759Search in Google Scholar
[5] Fredlund D, Rahardjo H, Fredlund M. Unsaturated soil mechanics in engineering practice. Hoboken (NJ): John Wiley & Sons, Inc; 2012.10.1002/9781118280492Search in Google Scholar
[6] Agus S. An experimental study on hydro-mechanical characteristics of compacted bentonite-sand mixtures [dissertation]. Weimar: Bauhaus-Universität Weimar; 2005.Search in Google Scholar
[7] ASTM D 6836. Standard test methods for determination of the soil water characteristic curve for desorption using a hanging column, pressure extractor, chilled mirror hygrometer, and/or centrifuge. Annual Book of ASTM Standards. West Conshohocken (PA): ASTM. Vol. 04.08, 2008.Search in Google Scholar
[8] Lins Y. Hydro-mechanical properties of partially saturated sand [dissertation]. Bochum: Ruhr-Universität Bochum; 2009.Search in Google Scholar
[9] Mualem Y. A new model for predicting the hydraulic conductivity of unsaturated porous media. Water Resour Res. 1976;12:513–22.10.1029/WR012i003p00513Search in Google Scholar
[10] Fredlund D, Xing A. Equations for the soil-water characteristic curve. Can Geotech J. 1994;31(3):521–32.10.1139/t94-061Search in Google Scholar
[11] Al-Obaidi QA, Schanz T. Total suction measurement of unsaturated artificial gypsified soil using the chilled-mirror hygrometer technique. Eng Technol J. 2013;31(20):359–74.10.30684/etj.2013.83849Search in Google Scholar
[12] Van Genuchten M. A closed-form equation for predicting the hydraulic conductivity of unsaturated soils. J Soil Sci Soc Am. 1980;44:892–8.10.2136/sssaj1980.03615995004400050002xSearch in Google Scholar
[13] Fredlund D, Morgenstern N. Stress state variables for unsaturated soils. J Geotech Engrg Div, ASCE. 1977;103(5):447–66.10.1061/AJGEB6.0000423Search in Google Scholar
[14] Sillers W. The mathematical representation of the soil-water characteristic curve [dissertation]. Saskatoon: University of Saskatchewan; 1997.Search in Google Scholar
© 2023 the author(s), published by De Gruyter
This work is licensed under the Creative Commons Attribution 4.0 International License.
Articles in the same Issue
- Research Articles
- The mechanical properties of lightweight (volcanic pumice) concrete containing fibers with exposure to high temperatures
- Experimental investigation on the influence of partially stabilised nano-ZrO2 on the properties of prepared clay-based refractory mortar
- Investigation of cycloaliphatic amine-cured bisphenol-A epoxy resin under quenching treatment and the effect on its carbon fiber composite lamination strength
- Influence on compressive and tensile strength properties of fiber-reinforced concrete using polypropylene, jute, and coir fiber
- Estimation of uniaxial compressive and indirect tensile strengths of intact rock from Schmidt hammer rebound number
- Effect of calcined diatomaceous earth, polypropylene fiber, and glass fiber on the mechanical properties of ultra-high-performance fiber-reinforced concrete
- Analysis of the tensile and bending strengths of the joints of “Gigantochloa apus” bamboo composite laminated boards with epoxy resin matrix
- Performance analysis of subgrade in asphaltic rail track design and Indonesia’s existing ballasted track
- Utilization of hybrid fibers in different types of concrete and their activity
- Validated three-dimensional finite element modeling for static behavior of RC tapered columns
- Mechanical properties and durability of ultra-high-performance concrete with calcined diatomaceous earth as cement replacement
- Characterization of rutting resistance of warm-modified asphalt mixtures tested in a dynamic shear rheometer
- Microstructural characteristics and mechanical properties of rotary friction-welded dissimilar AISI 431 steel/AISI 1018 steel joints
- Wear performance analysis of B4C and graphene particles reinforced Al–Cu alloy based composites using Taguchi method
- Connective and magnetic effects in a curved wavy channel with nanoparticles under different waveforms
- Development of AHP-embedded Deng’s hybrid MCDM model in micro-EDM using carbon-coated electrode
- Characterization of wear and fatigue behavior of aluminum piston alloy using alumina nanoparticles
- Evaluation of mechanical properties of fiber-reinforced syntactic foam thermoset composites: A robust artificial intelligence modeling approach for improved accuracy with little datasets
- Assessment of the beam configuration effects on designed beam–column connection structures using FE methodology based on experimental benchmarking
- Influence of graphene coating in electrical discharge machining with an aluminum electrode
- A novel fiberglass-reinforced polyurethane elastomer as the core sandwich material of the ship–plate system
- Seismic monitoring of strength in stabilized foundations by P-wave reflection and downhole geophysical logging for drill borehole core
- Blood flow analysis in narrow channel with activation energy and nonlinear thermal radiation
- Investigation of machining characterization of solar material on WEDM process through response surface methodology
- High-temperature oxidation and hot corrosion behavior of the Inconel 738LC coating with and without Al2O3-CNTs
- Influence of flexoelectric effect on the bending rigidity of a Timoshenko graphene-reinforced nanorod
- An analysis of longitudinal residual stresses in EN AW-5083 alloy strips as a function of cold-rolling process parameters
- Assessment of the OTEC cold water pipe design under bending loading: A benchmarking and parametric study using finite element approach
- A theoretical study of mechanical source in a hygrothermoelastic medium with an overlying non-viscous fluid
- An atomistic study on the strain rate and temperature dependences of the plastic deformation Cu–Au core–shell nanowires: On the role of dislocations
- Effect of lightweight expanded clay aggregate as partial replacement of coarse aggregate on the mechanical properties of fire-exposed concrete
- Utilization of nanoparticles and waste materials in cement mortars
- Investigation of the ability of steel plate shear walls against designed cyclic loadings: Benchmarking and parametric study
- Effect of truck and train loading on permanent deformation and fatigue cracking behavior of asphalt concrete in flexible pavement highway and asphaltic overlayment track
- The impact of zirconia nanoparticles on the mechanical characteristics of 7075 aluminum alloy
- Investigation of the performance of integrated intelligent models to predict the roughness of Ti6Al4V end-milled surface with uncoated cutting tool
- Low-temperature relaxation of various samarium phosphate glasses
- Disposal of demolished waste as partial fine aggregate replacement in roller-compacted concrete
- Review Articles
- Assessment of eggshell-based material as a green-composite filler: Project milestones and future potential as an engineering material
- Effect of post-processing treatments on mechanical performance of cold spray coating – an overview
- Internal curing of ultra-high-performance concrete: A comprehensive overview
- Special Issue: Sustainability and Development in Civil Engineering - Part II
- Behavior of circular skirted footing on gypseous soil subjected to water infiltration
- Numerical analysis of slopes treated by nano-materials
- Soil–water characteristic curve of unsaturated collapsible soils
- A new sand raining technique to reconstitute large sand specimens
- Groundwater flow modeling and hydraulic assessment of Al-Ruhbah region, Iraq
- Proposing an inflatable rubber dam on the Tidal Shatt Al-Arab River, Southern Iraq
- Sustainable high-strength lightweight concrete with pumice stone and sugar molasses
- Transient response and performance of prestressed concrete deep T-beams with large web openings under impact loading
- Shear transfer strength estimation of concrete elements using generalized artificial neural network models
- Simulation and assessment of water supply network for specified districts at Najaf Governorate
- Comparison between cement and chemically improved sandy soil by column models using low-pressure injection laboratory setup
- Alteration of physicochemical properties of tap water passing through different intensities of magnetic field
- Numerical analysis of reinforced concrete beams subjected to impact loads
- The peristaltic flow for Carreau fluid through an elastic channel
- Efficiency of CFRP torsional strengthening technique for L-shaped spandrel reinforced concrete beams
- Numerical modeling of connected piled raft foundation under seismic loading in layered soils
- Predicting the performance of retaining structure under seismic loads by PLAXIS software
- Effect of surcharge load location on the behavior of cantilever retaining wall
- Shear strength behavior of organic soils treated with fly ash and fly ash-based geopolymer
- Dynamic response of a two-story steel structure subjected to earthquake excitation by using deterministic and nondeterministic approaches
- Nonlinear-finite-element analysis of reactive powder concrete columns subjected to eccentric compressive load
- An experimental study of the effect of lateral static load on cyclic response of pile group in sandy soil