Effect of truck and train loading on permanent deformation and fatigue cracking behavior of asphalt concrete in flexible pavement highway and asphaltic overlayment track
-
Dian M. Setiawan


Abstract
This research investigated the largest magnitude of displacement and horizontal tensile strain in several critical locations within the asphalt concrete (AC) layer in both the flexible pavement highway (FPH) and asphaltic overlayment track (AOT) structure using the numerical modeling method. The role of the hauling loads, speed, and loading cycles of freight truck’s dumps and freight train’s wagons on the mechanical behavior of FPH and AOT in terms of the permanent deformation and fatigue cracking was examined. Furthermore, the performance of the FPH and AOT in terms of permanent deformation and fatigue cracking characteristics due to various magnitudes of hauling loads, speed, and loading cycles of freight truck’s dumps and freight train’s wagons was compared to determine the optimum infrastructure for the freight coal transportation, based on the hauling capacity as well as the magnitude of permanent deformation and the horizontal tensile strain of the AC layer. According to the findings of this study, it is suggested to choose the AOT structure with fourth or sixth loading systems to run the freight coal transportation with the highest magnitude of the hauling capacity of 360,000 tons, since it produces the minimum magnitude of the permanent deformation and fatigue cracking of the AC layer. Future research should be conducted to examine the potential and the characteristics of fatigue cracking due to the contact between the edge of the sleeper and the surface of the AC layer in AOT.
1 Introduction
South Sumatra Province is one of the regions that has the largest coal reserves in Indonesia, with a recorded potential of around 22.24 billion tons or ±38% of the national reserves, with details that have been measured at 1.97 billion tons, indicated at 19.95 billion tons, and inferred of 0.32 billion tons. This potential is generally found in Muara Enim, Lahat, Musi Banyuasin, and Musi Rawas Regencies. The potential for coal has not been optimally exploited; this is partly due to the limited capacity of the available transportation network in South Sumatra Province [1,2]. In order to optimize the coal potential of the province of South Sumatra, a reliable and large-capacity transportation infrastructure network is mandatory [3].
In transporting and distributing the coal from the South Sumatera to other areas such as Lampung Province, the small companies use truck mode (Figure 1), while big companies, namely, PT Bukit Asam Tbk, use the train mode (Figure 2). However, the trucks carry coal cargo as much as 25–30 tons, while the reasonable limit is only 10 tons. Therefore, coal transportation from South Sumatra to Lampung using truck mode damages road infrastructure due to the overload and brings some negative effects detrimental to society such as pollution, traffic congestion, and accidents [2,4].
![Figure 1
Freight coal truck in South Sumatera, Indonesia [11].](/document/doi/10.1515/jmbm-2022-0303/asset/graphic/j_jmbm-2022-0303_fig_001.jpg)
Freight coal truck in South Sumatera, Indonesia [11].
![Figure 2
Freight coal train in South Sumatera, Indonesia [12].](/document/doi/10.1515/jmbm-2022-0303/asset/graphic/j_jmbm-2022-0303_fig_002.jpg)
Freight coal train in South Sumatera, Indonesia [12].
On another side, of the 8,357 km of total Indonesia’s railway network in 2017, only 5,107 km is operated [5], and most are traditional ballasted or conventional tracks such as the railway networks available in South Sumatera and Lampung Province. Unfortunately, the Indonesian railway network remains of a low standard, with the maximum axle load of 18 tons, the relatively light rail weight of 54 kg/m (R54), and the low freight train operating speed between 40 and 80 kph. Therefore, the load characteristics, rail strength, carrying capacity, and the train operation speed limit the capability of Indonesia’s railway network [6]. In addition, common damage to the ballast layer in the existing conventional track in Indonesia is dirty ballast material and lost or reduced ballast so that the stability of the conventional track will decrease. Besides, the presence of ballast pockets under the ballast can cause mud pumping [4,7]. The conventional track may experience further ballast deformations and track misalignment [8]. Heavy trains and environmental loads can cause a decline in mechanical and geometrical performance of the ballast structure layer [9,10].
Therefore, Setiawan [13] compared the performance of granular or ballasted track with the asphaltic overlayment track (AOT) by predicting the service life of the asphalt concrete (AC) layer and the subgrade layer using the mechanistic-empirical software, KENTRACK, developed by the University of Kentucky [14,15,16]. In AOT structure, ballast is replaced by the AC layer, and the sleeper is located on top of the AC layer. Setiawan [13] concluded that the AOT with a minimum AC layer thickness of 350 mm and a minimum sub-grade modulus of 82 MPa was a better option than ballasted track for railway systems with high load repetition per year (>500,000 train cars/year) and high axle load train (>36 tons).
Asphalt’s durability makes it a popular choice for flexible pavement highways (FPHs). However, large and slow traffic loads may lead to deformation issues in the AC layer from time to time [17]. According to Nagy et al. [18], pavement distress is an essential parameter of pavement design. The majority of pavement distresses are caused by the deficiencies in materials, construction, and maintenance. Rutting, also known as permanent deformation (Figure 3), is considered a primary distress mode in asphalt flexible pavements and has always been a concern in the asphalt pavement industry [19]. Rutting is also one of the typical failure modes of semi-rigid base asphalt pavement in the high-temperature area [20]. The presence of rutting on flexible pavement structure has always been a concern that destructively influences the performance of the pavement by shortening its lifespan and creating a safety hazard for vehicles [21]. Permanent deformation can also incline to severe traffic accidents under some adverse driving circumstances such as rain and curve section [22].
![Figure 3
Cross-section of rutting or permanent deformation [23].](/document/doi/10.1515/jmbm-2022-0303/asset/graphic/j_jmbm-2022-0303_fig_003.jpg)
Cross-section of rutting or permanent deformation [23].
Fatigue cracking is also a key issue in AC pavements because it reduces ride comfort and fuel efficiency and creates a pathway for water penetration, which causes a pavement system to degrade fast [24]. Figure 4 illustrates the mechanism of alligator cracking or fatigue cracking. List of researchers studied this phenomenon because it significantly affects the road function and gives discomfort to the users and try to solve this problem. Due to repeated loading on asphalt pavement, accumulation of damage occurred, which causes one of the primary distresses known as fatigue cracking [25].

Mechanism of alligator cracking or fatigue cracking.
When the pavement has reached the end of its useful life and the asphalt binder is rigid, fatigue cracking develops. It is a load-related crack that developed as a result of constant loading. In order to create microcracks, the horizontal tensile stresses at the bottom of the pavement layer have to be greater than the tensile strength of the pavement [26,27,28]. Alligator or fatigue is a macrocrack that develops when these fractures spread [26,28,29].
It is a well-known fact that asphalt material is a vital part of the pavement. However, the loading conditions and functional requirements for the pavement structure are totally different between road and railway transport systems [30]. Moreover, there are limited studies that focus on permanent deformation and fatigue cracking behavior and characteristics of the AC layer in the AOT structure. Also, there is limited research that compares the loading characteristics of freight trucks and freight trains and their contribution to the permanent deformation and fatigue cracking behavior of the AC layer in FPH and AOT structures. Therefore, this research was conducted to compare the fatigue cracking and the permanent deformation behavior of the AC layer in FPH and AOT structures, as well as to compare the performance and the response of FPH and AOT to the different level of loading systems (LSs) by varying the hauling loads, speed, and loading cycles of freight coal trucks and freight coal trains. The ABAQUS software was used to create the cyclic loading from the passing freight coal trucks and freight coal trains and to develop the two-dimensional model of FPH and AOT structures with the same geometric (width and thicknesses) and the same material properties of AC surface course, AC base course, unbound granular sub-base or sub-ballast layers, as well as soil subgrade layers.
2 Methods
2.1 Geometry of flexible pavement and AOT
The structural configuration of FPH and asphaltic overlayment for rail track (AOT) is provided in Figure 5a and b, respectively. In this research, the FPH consists of AC surface course, AC base course, sub-base, and subgrade, while the AOT includes the rails (left and right) and concrete sleeper (200 mm length and 220 mm height) laid on top of the AC surface course, AC base course, sub-ballast, and subgrade. Both FPH and AOT have the same width and height, which are 3,000 and 1,500 mm, respectively.

(a) FPH structure and (b) AOT structure.
2.1.1 LSs and configurations based on freight truck and freight train
The pressure loading in the form of cyclic load from single-unit two-axle freight truck load was considered and applied to the surface of the flexible pavement. The distance between the center of the left and the right tire is 1,530 mm, while the distance between two axles is 3,400 mm (Figures 5a and 6). Figure 7a and b presents the contact area between freight truck’s tires and the pavement surface as well as its equivalent contact area. Since L is 389 mm, 1 (one) wheel has a rectangular area conversion of 0.5227 L2, with a length of 339 mm and a width of 234 mm [17].

Single-unit two-axle truck load.
![Figure 7
(a) Contact area between tires and the pavement surface and (b) equivalent contact area [17].](/document/doi/10.1515/jmbm-2022-0303/asset/graphic/j_jmbm-2022-0303_fig_007.jpg)
(a) Contact area between tires and the pavement surface and (b) equivalent contact area [17].
In other side, the concentrated loading in the form of cyclic load from the wheelset of freight trains was considered and applied to the left and the right rails of AOT. The distance between the point load of the left and the right wheelset is 1,067 mm, while the distance between two axles is 11,000 mm (Figures 5b and 8).

Freight train wagons.
The construction of LSs from the passing freight trucks was based on three variations in hauling loads (10, 25, and 36 tons/truck), three variations in running speeds (40, 60, and 80 kph), and two variations in loading cycles (5,000 and 10,000 times). As shown in Table 1, in total, there were nine model variations that have been constructed for flexible pavement design and analysis. On the other hand, the development of LSs from the passing freight trains was in accordance with three variations in hauling loads (72 and 36 tons/train), three variations in running speeds (40, 60, and 80 kph), and two variations in loading cycles (5,000 and 10,000 times). As presented in Table 2, in total, there were six model variations that have been constructed for AOT design and analysis.
LSs based on combination of freight truck’s speed, axle load, and loading cycles
| LS | Speed (km/h) | Axle load (tons) | Loading cycles | Freight truck’s capacity (tons/truck) | Number of passing truck | Freight truck hauling capacity (tons) |
|---|---|---|---|---|---|---|
| 1 | 40 | 5 | 5,000 | 10 | 5,000 | 50,000 |
| 2 | 60 | |||||
| 3 | 80 | |||||
| 4 | 40 | 12.5 | 10,000 | 25 | 10,000 | 250,000 |
| 5 | 60 | |||||
| 6 | 80 | |||||
| 7 | 40 | 18 | 10,000 | 36 | 10,000 | 360,000 |
| 8 | 60 | |||||
| 9 | 80 |
LS based on combination of freight trains speed, axle load, and loading cycles
| LSs | Speed (km/h) | Axle load (tons) | Loading cycles | Freight truck’s capacity (tons/truck) | Number of passing truck | Freight truck hauling capacity (tons) |
|---|---|---|---|---|---|---|
| 1 | 40 | 36 | 5,000 | 72 | 5,000 | 360,000 |
| 2 | 60 | |||||
| 3 | 80 | |||||
| 4 | 40 | 18 | 10,000 | 36 | 10,000 | 360,000 |
| 5 | 60 | |||||
| 6 | 80 |
2.2 Construction of the model
The details of the FPH and AOT model using ABAQUS software can be seen in Figures 9a and b, respectively. To simplify both models, the interaction of each layer is considered as glued. In FPH model, a 3-node linear plane strain triangle (CPE3) was used for the AC surface course (structured), AC base course (free), and sub-base layer (structured), while a 4-node bilinear plane strain quadrilateral (CPE4) was used for the subgrade layer. The mesh with the size of 0.025 m × 0.025 m was applied to the model below tire footprints, where 0.025 m × 0.05 m was assigned for the AC surface course, 0.05 m × 0.05 m for both the AC base course and sub-base layer, and 0.05 m × 0.1 m for the subgrade layer of the flexible arterial pavement. Therefore, a total of 2,624 elements were created for this model.

(a) FPH model and measuring nodes and (b) AOT model and measuring nodes.
In AOT model, two rails (left and right) and a concrete sleeper were laid on top of the AOT structure. The sleeper is anchored and fixed at the top of the AC surface layer. A CPE3 was assigned for the rails (free), AC surface course (structured), AC base course (structured), and sub-ballast layer (structured). On the other hand, a CPE4 was used for the sleeper and subgrade layer. The mesh with the size of 0.015 m × 0.015 m was constructed for rails, 0.0525 m × 0.05 m for the sleeper, 0.025 m × 0.05 for the AC surface course, 0.05 m × 0.05 m for the AC base course and sub-ballast layer, and 0.1 m × 0.05 m for the subgrade layer of the AOT. Therefore, a total of 2,755 elements were created to construct this model. Furthermore, the concentrated force is applied around 0.015 m from the inner edges of the rail head.
The measuring nodes, in yellow dots (to obtain the horizontal tensile strain and the displacement at the top of the AC surface course) and green dots (to obtain the horizontal tensile strain and the displacement at the bottom of the AC base course) within both FPH and AOT models, also presented in Figures 9a and b, respectively. There are six pairs of measuring nodes that were assigned to six different key locations in FPH model. They are located parallel to or below the left edge of the outer tire (node 1-A), below the right edge of the outer tire (node 2-B), between the outer and the inner tire (node 3-C), below the left edge of the inner tire (node 4-D), below the right edge of the inner tire (node 5-E), and at the center of the FPH structure (node 6-F). In other side, there are five pairs of the measuring nodes that were assigned to five different key locations in AOT model. They are located parallel to or below the left edge of the sleeper (node 1-A), below the left edge of the left rail (node 2-B), at the center of the left rail (node 3-C), below the right edge of the left rail (node 4-D), and at the center of the AOT structure (node 5-E). Moreover, the permanent deformation of the total AC layer is obtained as the relative displacement between the top of AC surface and the bottom of AC base course.
2.3 Material properties
In this study, the top part of both FPH and AOT consists of AC surface course and AC base course with the same material properties, considering the linear viscoelastic constitutive relationship based on Lee et al. [31]. The elastic modulus of the AC surface and AC base course is 25,201.2 MPa and 22,903.8 MPa, respectively, while both AC materials have the same value of Poisson’s ratio and density, which are 0.35 and 2,345.35 kg/m3, respectively. The subgrade layer in both FPH and AOT has the following properties: elastic modulus of 60 MPa, Poisson’s ratio of 0.25, and density of 2,000 kg/m3. In addition, the material properties for sub-base in FPH were the same material properties as sub-ballast in AOT: elastic modulus of 120 MPa, Poisson’s ratio of 0.30, and density of 1,900 kg/m3. Special for AOT structure, a pair of rails (elastic modulus of 206,000 MPa, Poisson’s ratio of 0.30, and density of 7,800 kg/m3), and a concrete sleeper (elastic modulus of 30,000 MPa, Poisson’s ratio of 0.20, and density of 1,833.33 kg/m3) are required to transfer the load from the freight trains to the AOT structure.
3 Results and discussion
As a standard convention, the negative strain is known as compressive, while the positive strain is known as tensile. In the following section, several analyses and evaluation methods were conducted, starting with the largest magnitude of displacement and then the horizontal tensile strain in several important locations within the AC layer in both the FPH and AOT structure. Then, the role of the load, speed, and loading cycles of freight truck and freight train on the mechanical behavior of FPH and AOT in terms of the permanent deformation and fatigue cracking potential was examined. Finally, the performance of the FPH and AOT in terms of permanent deformation and fatigue cracking characteristics due to various magnitudes of loads, speed, and loading cycles of freight trucks (first to ninth LSs) and freight trains (first to sixth LSs) was compared to predict and suggest the most optimum as well as the alternative infrastructure for the freight transportation in South Sumatera, Indonesia, based on the engineering point of view.
3.1 Permanent deformation potential in several key locations within AC layer
According to Lee et al. [31], the thicker AC layer deforms slightly more than the thinner layer. Figure 10 illustrates the development of permanent deformation of the AC layer in six key locations within the FPH structure due to the first LSs from the freight truck dumps. The largest permanent deformation was found between the outer and the inner tire, followed by the permanent deformation below the right edge of the outer tire, below the left edge of the inner tire, below the left edge of the outer tire, below the right edge of the inner tire, and finally the permanent deformation at the location parallel to the center of the pavement structure.

Permanent deformation of the AC layer below six key locations within the FPH structure due to first LSs from freight truck dumps.
The development of permanent deformation of AC layer in five key locations within the AOT structure due to the first LSs from the freight trains wagons is provided by Figure 11. The largest permanent deformation was obtained below the right edge of the left rail, followed by the permanent deformation below the center of the left rail, below the left edge of the left rail, parallel to the center of the track, and finally the permanent deformation below left edge of the sleeper.

Permanent deformation of the AC layer below five key locations within the AOT structure due to first LSs from freight train wagons.
As shown in Figure 12a, the area of the AC layer in FPH between the outer and the inner tire shows a key location that is prone to permanent deformation. In other side, the area between the left and the right rails in AOT (Figure 12b) has the highest potential to experience the permanent deformation.

Vertical displacement within the AC layer due to the first LSs: (a) FPH and (b) AOT.
3.2 Role of tonnage, speed, and loading cycles of freight truck and freight train on total permanent deformation of AC layer in FPH and AOT
The next stage of this study is the evaluation of permanent deformation of the AC layer in FPH and AOT structures as the effect of various levels and magnitudes of speed, hauling loads, and loading cycles (number of passing) of freight truck dumps and freight train wagons. Figure 13 presents the largest permanent deformation of the AC layer in the FPH due to nine different LSs. It can be concluded that the seventh LS produces the largest permanent deformation among nine cases of LSs. Besides, the fourth and the ninth LSs have almost similar magnitude of permanent deformation at 10,000 loading cycles. It can also be predicted that at certain level of loading cycles (>10,000), the magnitude of permanent deformation due to the fourth LS will overtake the magnitude of permanent deformation due to the ninth LS. As expected, the lower the freight truck speed and the heavier the freight truck load, the larger the permanent deformation of the AC layer in FPH structure.

Largest permanent deformation of the AC layer in the FPH structure due to different LS combinations (first to ninth).
Figure 14 presents the largest permanent deformation of the AC layer in the AOT due to six different LSs. In terms of permanent deformation behavior analysis in this study, it is better to run the freight trains with 50% lighter hauling loads but 100% more loading cycles (red line, AOT Case 4), than run the freight trains with 100% heavier hauling loads, but 50% less loading cycles (orange line, AOT Case 2). The LSs from Case 1 produce the largest permanent deformation among six cases LSs. Although Case 1 has only 5,000 loading cycles, it has 72 tons/trucks of hauling loads and but it has the slowest speed of 40 kph. In addition, Case 2 and Case 4 have almost similar magnitude of permanent deformation, even though Case 4 has a 50% lighter hauling loads, but it has 33% slower speed and 100% more loading cycles. It was also found that Case 4 has a larger magnitude of permanent deformation than Case 3, even though Case 3 has 100% faster speed and 50% less loading cycles, but it has 100% heavier hauling loads. Case 3 also has a larger magnitude of permanent deformation than Case 5, even though Case 5 has 100% more loading cycles, but it also has 25% slower speed and 50% lighter hauling loads. Again, as expected, the lower the freight train speed and the heavier the freight train load, the larger the permanent deformation of the AC layer in the AOT structure.

Largest permanent deformation of the AC layer in the AOT structure due to different LS combinations (first to sixth).
Figure 15 shows the comparison between the permanent deformation of the AC layer produced by the set of LSs with the lowest speed and heaviest hauling loads of freight truck (LSs from Cases 1, 4, and 7 for FPH) and freight trains (LSs from Cases 1 and 4 for AOT). We also need to note that the multiplication between the hauling loads (tons/truck dumps or tons/train wagons) and the loading cycles (number of passing truck dumps or train wagons) will produce the parameter of hauling capacity (tons), as shown in Tables 1 and 2.

Comparison of the largest permanent deformation of AC layer due to the LSs with the lowest speed of 40 kph (Cases 1, 4, and 7 for FPH and Cases 1 and 4 for AOT).
The permanent deformation of the AC layer in the FPH structure due to the LSs from Case 7 (blue line, 36 tons/truck dump; 10,000 loading cycles, equals to the hauling capacity of 360,000 tons) is similar to the permanent deformation of the AC layer in the AOT structure due to the LSs from Case 4 (orange line, 36 tons/truck dump; 10,000 loading cycles, also equals to the hauling capacity of 360,000 tons). In addition, the permanent deformation of the AC layer in the AOT structure due to the LSs from Case 1 (red line, 72 tons/train wagon; 5,000 loading cycles, equals to hauling capacity of 360,000 tons) is still around 25% larger than the permanent deformation of the AC layer in the AOT structure due to the LSs from Case 4 (orange line, 36 tons/train wagon; 10,000 loading cycles, also equals to hauling capacity of 360,000 tons) even though Case 1 has 50% less loading cycles. Because at the same time, Case 1 also has 100% heavier hauling loads than Case 4.
As expected, the permanent deformation of the AC layer in the FPH structure due to the LSs from Case 1 (light green, 10 tons/truck dump; 5,000 loading cycles, equals to hauling capacity of 50,000 tons) is 86% smaller than the permanent deformation of the AC layer in AOT structures due to the LSs from Case 1 (red line, 72 tons/train wagon; 5,000 loading cycles, equals to hauling capacity of 360,000 tons), which has 86% heavier hauling capacity. The same comparison condition also applies to AOT Case 4 versus FPH Case 4 as well as FPH Case 7 versus FPH Case 4.
In terms of the minimum magnitude of the permanent deformation of the AC layer in both FPH and AOT structures and in order to run the freight transportation, either truck or train, with the highest magnitude of the hauling capacity considered in this study (Tables 1 and 2), 360,000 tons, it is suggested to use and construct either the FPH structure with seventh LS (blue line in Figure 15) or the AOT structure with fourth LSs (orange line in Figure 15).
3.3 Fatigue cracking potential in several key locations within AC layer
Figure 16 depicts the development of horizontal tensile and compressive strain at the top of AC surface course below six key locations within the FPH structure due to the first LSs from the freight truck dumps. The largest compressive strain (negative strain) at the top of AC surface course of FPH was found between the outer and the inner tire, followed by the compressive strain below the right edge of the outer tire, below the left edge of the inner tire, below the left edge of the outer tire, and below the right edge of the inner tire. In other side, the largest horizontal tensile strain (positive strain) at the top of AC surface course of FPH was obtained at the location parallel to the center of the pavement structure.

Horizontal tensile strain and compressive strain at the top of the AC surface course below six key locations within the FPH structure due to first LSs from freight truck dumps.
The development of horizontal tensile strain and compressive strain at the bottom of AC base course below six key locations within the FPH structure due to the first LSs from the freight truck dumps is shown in Figure 17. The largest compressive strain at the bottom of the AC base course of FHP was found at the location parallel to the center of the pavement structure. The magnitudes of the horizontal tensile strain below the right edge of the outer tire, between the outer and the inner tire, and below the left edge of the inner tire are similar and are the largest, followed by the horizontal tensile strain below the left edge of the outer tire and below the right edge of the inner tire. On the other side, the largest compressive strain at the bottom of AC base course of FPH is at the location parallel to the center of the pavement structure.

Horizontal tensile strain and compressive strain at the bottom of the AC base course below six key locations within the FPH structure due to first LSs from freight truck dumps.
As shown in Figure 18, the largest horizontal tensile strain at the top of the AC surface course of AOT is located below the left edge of the sleeper. On the other hand, the largest compressive strain at the top of AC surface course of AOT is located parallel to the center of the AOT structure, followed by the compressive strain below the right edge of the left rail, parallel to the center of the left rail, and below the left edge of the left rail.

Horizontal tensile strain and compressive strain at the top of AC surface course below five key locations within the AOT structure due to first LSs from freight train wagons.
The largest horizontal tensile strain at the bottom of AC base course of AOT is located below the right edge of the left rail, followed by the horizontal tensile strain parallel to the center of the left rail, below the left edge of left rail, and parallel to the center of the AOT structure (Figure 19). Besides, the largest compressive strain at the bottom of AC base course of AOT is located below the left edge of the sleeper.

Horizontal tensile strain and compressive strain at the bottom of AC base course below five key locations within the AOT structure due to first LSs from freight train wagons.
As presented in Figure 20a, the top area of AC surface course parallel to the center of flexible pavement structure shows a key location that is prone to the top-down fatigue cracking (yellow-red contour), while the bottom area of AC base course below the tire tread has the highest potential to experience the bottom-up fatigue cracking (also yellow-red contour). On the other hand, the side-top area of the AC surface course in the AOT structure (starting from the left-right edge of the sleeper to the left-right boundary of the model) exhibits a key location that is prone to the top-down fatigue cracking, while the bottom area of AC base course below the left and right rails has the highest potential to experience the bottom-up fatigue cracking (Figure 20b).

Horizontal tensile strain and compressive strain within the AC layer due to the first LSs: (a) FPH and (b) AOT.
3.4 Role of tonnage, speed, and loading cycles of freight truck and freight train on fatigue cracking of AC layer in FPH and AOT
The next stage of this study is the evaluation of horizontal tensile strain at the top of AC surface course as well as at the bottom of the AC base course in FPH and AOT structures as the effect of various levels and magnitudes of speed, hauling loads, and loading cycles (number of passing) of freight truck dumps and freight train wagons. The largest horizontal tensile strains at the top of AC surface course as well as at the bottom of the AC base course in the FPH structure due to first to ninth LS combinations are presented in Figures 21 and 22, respectively. It can be concluded that the seventh LS produces the largest horizontal tensile strain at the top of AC surface course (Figure 21) as well as the largest horizontal tensile strain at the bottom of AC base course (Figure 22) among nine cases of LSs. It also can be seen that, within the same magnitude of freight truck’s hauling loads and the same number of passing trucks (Case 1 vs Case 2 vs Case 3; Case 4 vs Case 5 vs Case 6; and Case 7 vs Case 8 vs Case 9), the lower the freight truck’s speed, the larger the horizontal tensile strain both at the top of AC surface course (Figure 21) and at the bottom of the AC base course (Figure 22), respectively.

Largest horizontal tensile strain at the top of AC surface course in the FPH structure due to different LS combinations (first to ninth).

Largest horizontal tensile strain at the bottom of AC base course in the FPH structure due to different LS combinations (first to ninth).
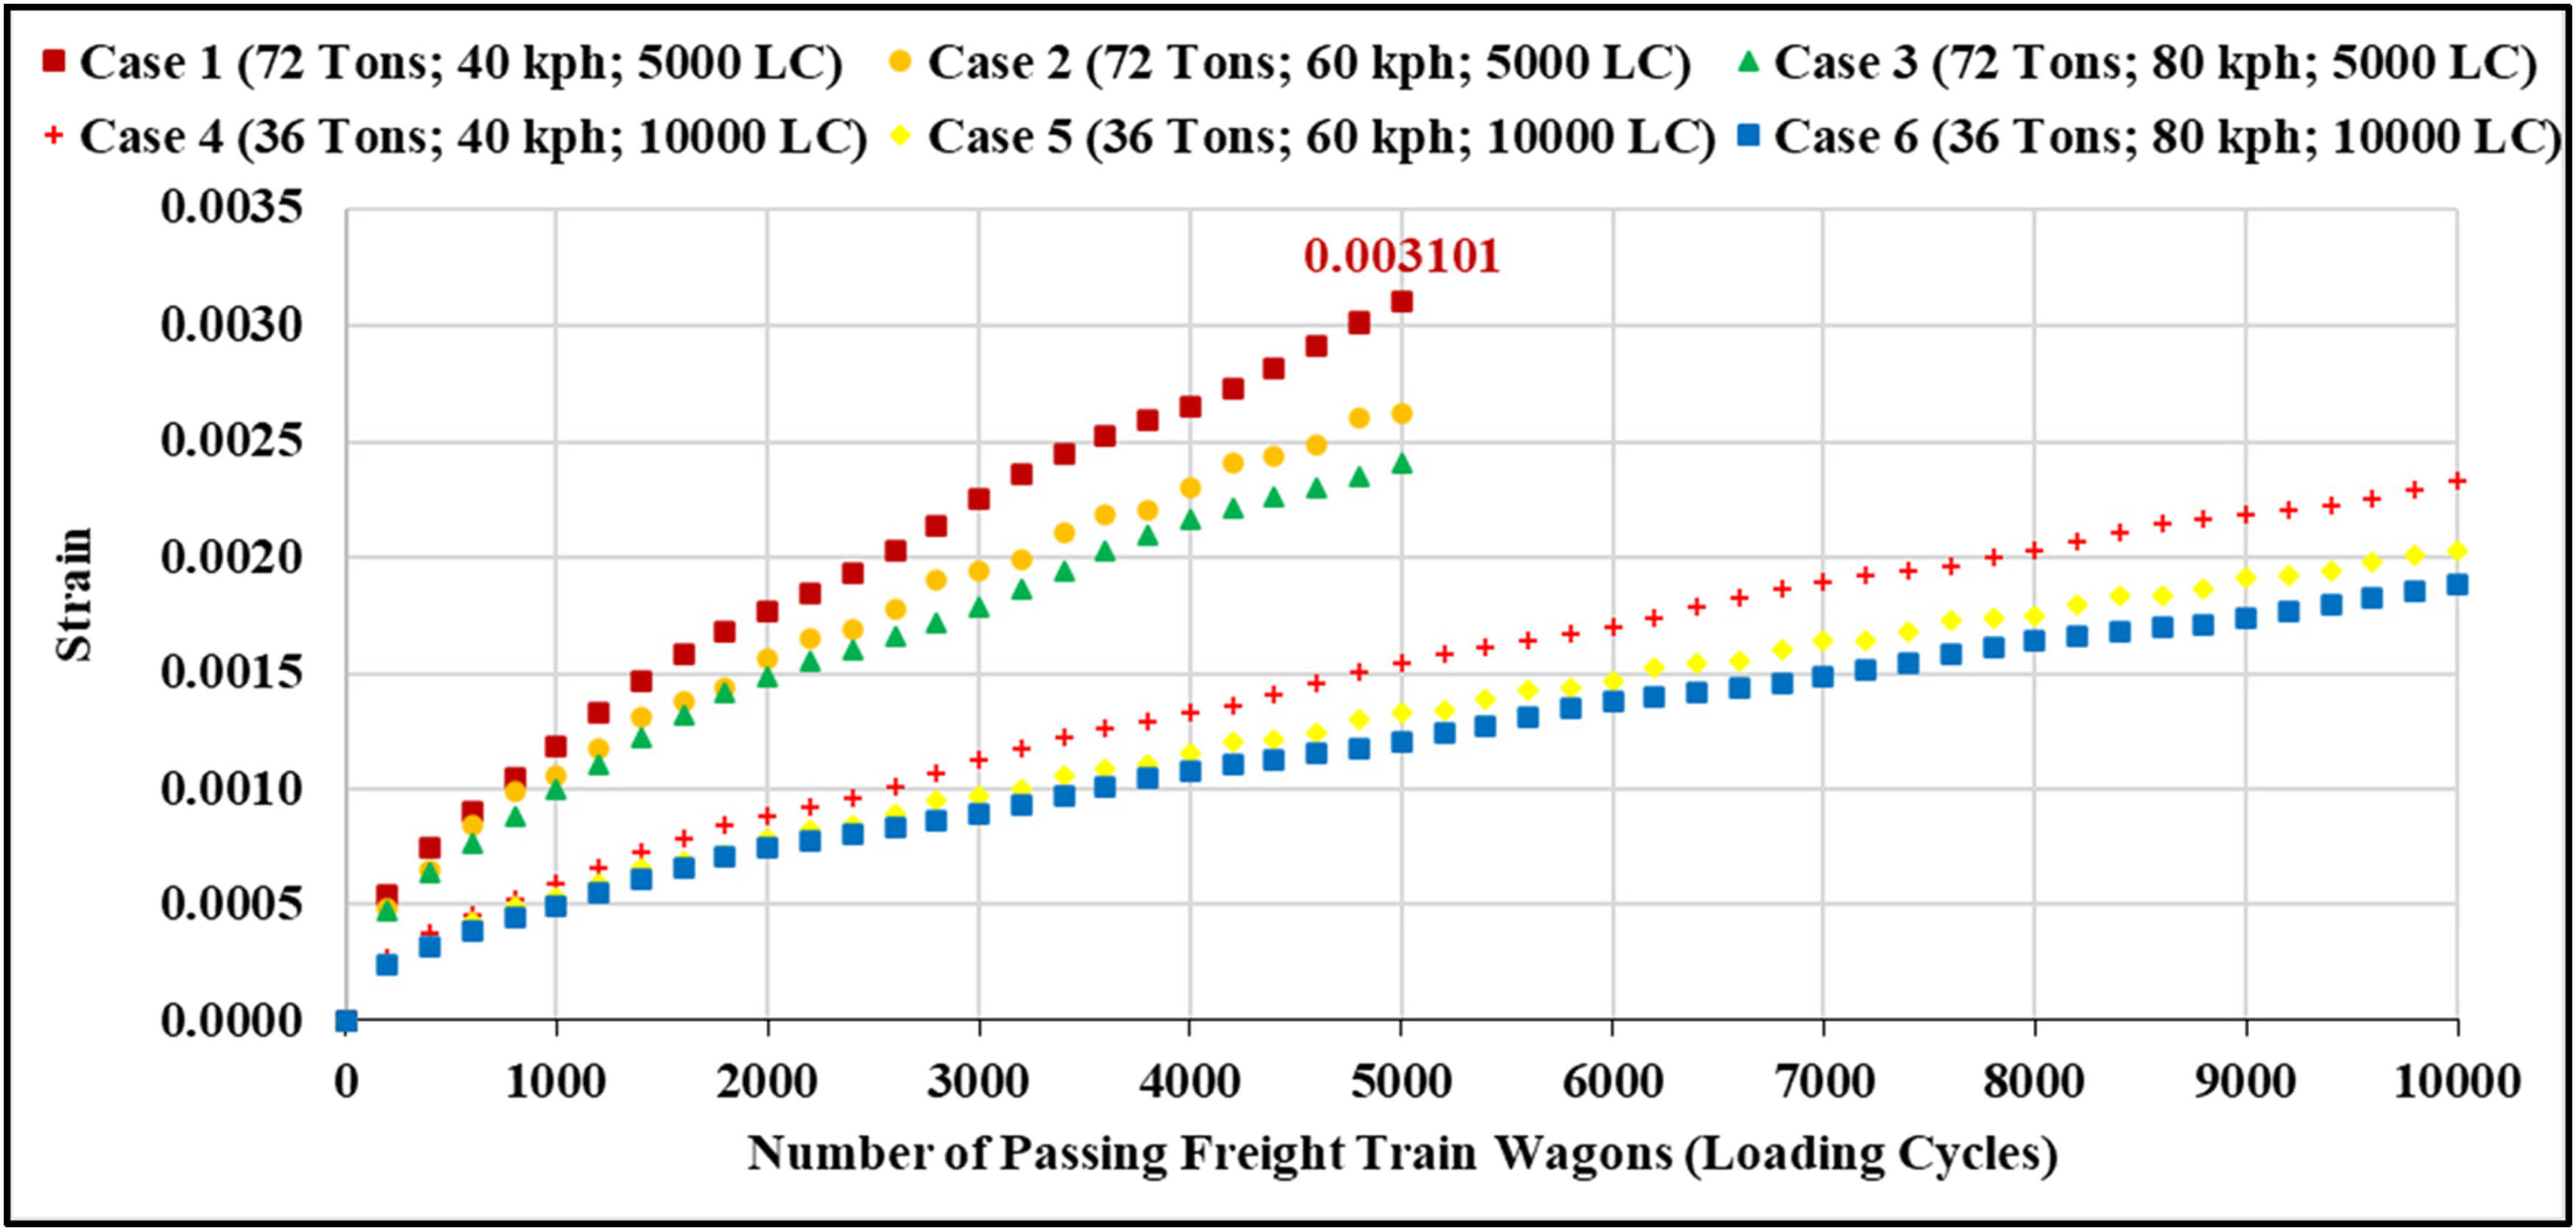
Figures 23 and 24 show the largest horizontal tensile strain at the top of AC surface course as well as at the bottom of the AC base course in the AOT structure due to first to sixth LS combinations, respectively. There are two distinct groups of horizontal tensile strain development in both Figure 23 (at the top of AC surface course) and Figure 24 (at the bottom of AC base course), which are Case 1 through 3 and Case 4 through 6. Each group has the same magnitude of freight train’s hauling loads (72 tons/train wagons for the first group; 36 tons/train wagons for the second group) and loading cycles (5,000 times for the first group; 10,000 times for the second group).

Largest horizontal tensile strain at the top of AC surface course in the AOT due to different LS combinations (first to sixth).
Largest horizontal tensile strain at the bottom of AC base course in the AOT due to different LS combinations (first to sixth).
As shown in Figure 23, after the loading cycles of the freight train’s wagons reach around 3,500 times, the horizontal tensile strain development due to the third and sixth LSs overtakes the other LSs in their groups and finally becomes the LSs that produce the largest horizontal tensile strain at the top of the AC surface course at the loading cycles of 5,000 times and 10,000 times, respectively. Moreover, increasing the freight trains’ speed 50% from 40 to 60 kph and 33% from 60 to 80 kph, but with the same magnitudes of freight trains’ hauling loads (76 tons/train wagons) and loading cycles (5,000 times), will increase the horizontal tensile strain at the top of AC surface approximately 8% and 5%, respectively. In other side, increasing the freight trains’ speed 50% from 40 to 60 kph and 33% from 60 to 80 kph, but with the same magnitudes of freight trains’ hauling loads (36 tons/train wagons) and loading cycles (10,000 times), will increase the horizontal tensile strain at the top of AC surface approximately 51% and 20%, respectively (Figure 23). Furthermore, decreasing the freight train’s hauling loads 50% from 72 to 36 tons/train wagons and increasing the loading cycles 100% from 5,000 to 10,000 times, but still with the same level of speed, 40, 60, or 80 kph, respectively, will reduce the magnitude of the horizontal tensile strain at the top of the AC surface course about 65, 52, and 45%, respectively (Figure 23). In terms of the minimum magnitude of the horizontal tensile strain at the top of AC surface in AOT and in order to run the freight trains with the same magnitude of the hauling capacity, 360,000 tons, it is suggested to apply the fourth, fifth, or sixth LSs (36 tons/train wagons; 10,000 number of passing train wagons, with different operational speed, 40, 60, or 80 kph).
As presented in Figure 24, within the same magnitude of freight train’s hauling loads and loading cycles, both Case 1 and Case 4 became the LSs in their group that produce the largest horizontal tensile strain at the bottom of AC base course in the AOT structure. Besides, increasing the freight trains’ speed 50% from 40 to 60 kph and 33% from 60 to 80 kph, but with the same magnitudes of freight trains’ hauling loads (76 tons/train wagons) and loading cycles (5,000 times), will decrease the horizontal tensile strain at the bottom of AC base course approximately 15 and 8%, respectively. In other side, increasing the freight trains’ speed 50% from 40 to 60 kph and 33% from 60 to 80 kph, but with the same magnitudes of freight trains’ hauling loads (36 tons/train wagons) and loading cycles (10,000 times), will increase the horizontal tensile strain at the bottom of AC base approximately 13% and 7%, respectively (Figure 24). Also, decreasing the freight train’s hauling loads 50% from 72 to 36 tons/train wagons and increasing the loading cycles 100% from 5,000 to 10,000 times, but still with the same level of speed, 40, 60, or 80 kph, respectively, will decrease the magnitude of the horizontal tensile strain at the bottom of AC base course about 25, 23, and 21%, respectively (Figure 24). Although the third LSs (green line) have 50% less freight train’s loading cycles than the fourth LSs (red line), but the third LSs produce higher magnitude of horizontal tensile strain at the bottom of AC base than the fourth LSs, since the third LSs have 100% heavier freight train’s hauling loads and 100% faster freight train’s speed. In terms of the minimum magnitude of the horizontal tensile strain at the bottom of AC base in AOT and in order to run the freight trains with the same magnitude of the hauling capacity, 360,000 tons, it is suggested to apply the sixth, fifth, or fourth LSs (36 tons/train wagons; 10,000 number of passing train wagons, with different operational speed, 80, 60, or 40 kph).
Soto et al. [32] found that the horizontal tensile strain of the AC layer in an asphaltic rail track due to the passing vehicle with 8 tons of axle load was 53% lower than the horizontal tensile strain of the AC layer in a flexible pavement due to the passing train with the same magnitude of axle loads. Figure 25 shows the comparison between the horizontal tensile strain at the top of AC surface course produced by the set of LSs with the lowest speed and heaviest hauling loads of freight truck (LSs from Cases 1, 4, and 7 for FPH) and freight trains (LSs from Cases 3 and 6 for AOT). In terms of the minimum magnitude of the horizontal tensile strain at the top of AC surface course in both FPH and AOT structure and in order to run the freight transportation, either truck or train, with the highest magnitude of the hauling capacity considered in this study (Table 1 and 2), 360,000 tons, it is suggested to use and construct the AOT structure with sixth LS (orange line in Figure 25).

Comparison of the largest horizontal tensile strain at the top of AC surface course due to the LSs with the lowest speed of 40 kph (Cases 1, 4, and 7 for FPH; Cases 3 and 6 for AOT).
Figure 26 illustrates the comparison between the horizontal tensile strains at the bottom of AC base course produced by the set of LSs with the lowest speed and heaviest hauling loads of freight truck (LSs from Case 1, 4, and 7 for FPH) and freight trains (LSs from Cases 1 and 4 for AOT). In terms of the minimum magnitude of the horizontal tensile strain at the bottom of AC base course in both FPH and AOT structures and in order to run the freight transportation, either truck or train, with the highest magnitude of the hauling capacity considered in this study (Tables 1 and 2), 360,000 tons, once again, it is suggested to use and construct the AOT structure with sixth LS (orange line in Figure 26).

Comparison of the largest horizontal tensile strain at the bottom of AC base course due to the LSs with the lowest speed of 40 kph (Cases 1, 4, and 7 for FPH; Cases 1 and 4 for AOT).
4 Conclusions
In this article, several analyses and evaluation methods have been conducted, starting with the largest magnitude of displacement and then the horizontal tensile strain in several important locations within the AC layer in both the FPH and AOT structure using numerical modeling method. Then, the role of the load, speed, and loading cycles of freight truck and freight train on the mechanical behavior of FPH and AOT in terms of the permanent deformation and fatigue cracking potential was examined. Finally, the performance of the FPH and AOT in terms of permanent deformation and fatigue cracking characteristics due to various magnitudes of loads, speed, and loading cycles of freight trucks (first to ninth LSs) and freight trains (first to sixth LSs) was compared to predict and suggest the most optimum as well as the alternative infrastructure for the freight coal transportation in South Sumatera, Indonesia, based on the engineering point of view. Several conclusions can be drawn based on the results of this study:
The largest permanent deformation of the AC layer in FPH was found between the outer and the inner tire, while the largest permanent deformation of the AC layer in AOT was obtained below the right edge of the left rail.
The largest horizontal tensile strain at the top of the AC surface course of FPH was obtained at the location parallel to the center of the pavement structure, while the largest horizontal tensile strain at the bottom of the AC base course of FPH was found between the outer and the inner tire. On the other hand, the largest horizontal tensile strain at the top of AC surface course of AOT was located below the left edge of the sleeper, while the largest horizontal tensile strain at the bottom of AC base course of AOT was below the right edge of the left rail.
The area of the AC layer in FPH between the outer and the inner tire shows a key location that is prone to permanent deformation. In other side, the area between the left and the right rails in AOT has the highest potential to experience the permanent deformation.
The top area of the AC surface course parallel to the center of flexible pavement structure shows a key location that is prone to the top-down fatigue cracking, while the bottom area of the AC base course below the tire tread has the highest potential to experience the bottom-up fatigue cracking. In the other side, the side-top area of the AC surface course in AOT structure, starting from the left-right edge of the sleeper to the left-right boundary of the model, exhibits a key location that is prone to the top-down fatigue cracking, while the bottom area of the AC base course below the left and right rails has the highest potential to experience the bottom-up fatigue cracking.
The heavier the hauling loads, the lower the truck’s or train’s speed, and the more loading cycles, will result in larger permanent deformation of the AC layer in both FPH and AOT, and within the same level of speed and loading cycles, the increase in hauling loads is proportional to the increase in the magnitude of permanent deformation.
With the same hauling capacity of 360,000 tons, the permanent deformation of the AC layer in the FPH structure due to the 36 tons/truck dump of hauling loads, 40 kph of truck’s speed, and 10,000 loading cycles is similar to the permanent deformation of the AC layer in the AOT structure due to the 36 tons/train wagons, 40 kph of train’s speed, and 10,000 loading cycles.
In terms of the minimum magnitude of permanent deformation of the AC layer and with the same hauling capacity (360,000 tons) as well as the same speed, it is better to run the freight trains with 36 tons/dumps of hauling loads and 10,000 times of loading cycles, than run the freight trains with 76 tons/wagons of hauling loads and 5,000 times of loading cycles (1 loading cycle equals to 1 truck dump or 1 train wagon).
In addition, with the same hauling capacity (360,000 tons) as well as the same speed (40 kph), the permanent deformation of the AC layer in the AOT structure due to the 72 tons/train wagon of hauling loads and 5,000 loading cycles is still around 25% larger than the permanent deformation of the AC layer in the AOT structure due to the 36 tons/train wagons of hauling loads and 10,000 loading cycles.
In terms of the minimum magnitude of the permanent deformation of the AC layer in both FPH and AOT structures and in order to run the freight transportation, either truck or train, with the highest magnitude of the hauling capacity considered in this study, 360,000 tons, it is suggested to use and construct either the FPH structure with seventh LS or the AOT structure with the fourth LSs.
In terms of the minimum magnitude of the horizontal tensile strain at the top of AC surface course as well as at the bottom of AC base course in both FPH and AOT structures and in order to run the freight transportation, either truck or train, with the highest magnitude of the hauling capacity considered in this study (360,000 tons), it is suggested to use and construct the AOT structure with the sixth LS.
Future research should be conducted to examine the potential and the characteristics of fatigue cracking due to the contact between the edge of the sleeper and the surface of the AC layer in AOT. Since temperature variations can influence the mechanical behavior and susceptibility to fracture of bituminous concrete, future study may also investigate its thermal properties as well as evaluate the effect of thermal loading on the response of the FPH and AOT structures.
Acknowledgements
The author would like to express gratitude to the Institute of Research, Publications & Community Service of Universitas Muhammadiyah Yogyakarta (LPPM UMY), for the Funding of Domestic Partnership Scheme 2023 (No: 16/R-LRI/I/2023).
-
Author contributions: Author has accepted responsibility for the entire content of this manuscript and approved its submission.
-
Conflict of interest: The author states no conflict of interest.
References
[1] Indonesia Investments. Coal. 2018. https://www.indonesia-investments.com/business/commodities/coal/item236 [cited 2021 Dec 20].Search in Google Scholar
[2] Sulistyorini R. Potensi kereta api sebagai angkutan barang di provinsi Lampung. Jurnal Kelitbangan Provinsi. 2015;3(2):1–15. (In Indonesian)Search in Google Scholar
[3] Setiawan DM. Pembatasan kecepatan maksimum dan kaitannya terhadap kapasitas lintas jalur kereta api Muara Enim – Lahat Sumatera Selatan (in Bahasa Indonesia). Prosiding Seminar Nasional Teknik Sipil. Muhammadiyah Surakarta, Solo, Indonesia: Fakultas Teknik Universitas; 2016. (In Indonesian)Search in Google Scholar
[4] Setiawan DM. Conventional track and asphaltic underlayment track mechanical behavior under Indonesia’s Babaranjang freight trains loading. Eng App Sci Res. 2022;49(5):657–68.Search in Google Scholar
[5] Badan Pusat Statistik [BPS]. Panjang jaringan jalan rel kereta api di Indonesia (km), 2015-2017 (in Bahasa Indonesia). 2015. https://www.bps.go.id/indicator/17/1195/1/panjang-jaringan-jalan-rel-kereta-api-di-indonesia-.html. [cited 2021 Dec 19]. (In Indonesian)Search in Google Scholar
[6] Setiawan DM. Investigation of conventional and asphaltic underlayment track behaviors subjected to freight train load: mechanistic approach. J App Eng Sci. 2022;20(3):673–87.10.5937/jaes0-35499Search in Google Scholar
[7] Duong TV, Cui YJ, Tang AM, Dupla JC, Canoua J, Calon N. Investigating the mud pumping and interlayer creation phenomena in railway sub-structure. Eng Geol. 2013;171:45–58.10.1016/j.enggeo.2013.12.016Search in Google Scholar
[8] Setiawan DM. Stress-strain characteristics and service life of conventional and asphaltic underlayment track under heavy load Babaranjang trains traffic. J Mech Behav Mater. 2022;31(1):22–36.10.1515/jmbm-2022-0003Search in Google Scholar
[9] Setiawan DM. Sub-grade service life and construction cost of ballasted, asphaltic underlayment and combination rail track design. Jordan J Civ Eng 16(1):173–92.Search in Google Scholar
[10] Zakeri JA, Mosayebi SA. Study of ballast layer stiffness in railway tracks. Gradevinar. 2016;68(4):311–8.Search in Google Scholar
[11] Sumsel Update. Agar Pasokan Batubara ke PLN Tak Tersendat, Pemerintah Dorong Pengoperasian Kereta Tambang (in Bahasa Indonesia). 2018. https://sumselupdate.com/agar-pasokan-batubara-ke-pln-tak-tersendat-pemerintah-dorong-pengoperasian-kereta-tambang/. [cited 2023 February 6]. (In Indonesian)Search in Google Scholar
[12] Regional Kompas. Truk Batubara Dilarang Melintas di Jalan Umum, Sumsel Terancam Merugi Rp 18,3 Triliun per Tahun (in Bahasa Indonesia). 2018. https://regional.kompas.com/read/2018/11/09/08220131/truk-batubara-dilarang-melintas-di-jalan-umum-sumsel-terancam-merugi-rp-183. [cited 2023 February 6]. (In Indonesian)Search in Google Scholar
[13] Setiawan DM. Structural response and sensitivity analysis of granular and asphaltic overlayment track considering linear viscoelastic behavior of asphalt. J Mech Behav Mater. 2021;30(1):66–86.10.1515/jmbm-2021-0008Search in Google Scholar
[14] Rose JG, Shushu L, Souleyrette R. KENTRACK 4.0: A railway trackbed structural design program. Proceedings of the 2014 Joint Rail Conference; 2014 Apr 2–4; Colorado Springs (CO), USA. ASME, 2014.10.1115/JRC2014-3752Search in Google Scholar
[15] Rose JG, Agarwal N, Brown JD, Ilavala N. KENTRACK, a performance-based layered elastic railway trackbed structural design and analysis procedure: A tutorial. Proceedings of the 2010 Joint Rail Conference; 2010 Apr 27–29; Urbana (IL), USA. ASME, 2010. p. 73–110.10.1115/JRC2010-36067Search in Google Scholar
[16] Huang YH, Lin C, Deng XJ, Rose J. KENTRACK, A computer program for hot-mix asphalt and conventional ballast railway trackbeds. USA: Asphalt Institute Publication RR-84-1 and National Asphalt Pavement Association Publication QIP-105; 1984.Search in Google Scholar
[17] Huang YH. Pavement analysis and design. 2nd ed. Old Bridge (NJ), USA: Pearson/Prentice-Hall; 2004.Search in Google Scholar
[18] Nagy AA, El-Maaty AEA, Hashim IH. Evaluation of maintenance and rehabilitation treatments on long-term asphalt pavement performance. Eng Res J. 2023;46(1):65–81.Search in Google Scholar
[19] Bastola NR, Souliman MI, Vechione M. Preliminary study on rutting performance of pavement structures under the effect of future autonomous vehicle movements. Innov Infrastruct Solut. 2023;8(60). 10.1007/s41062-022-01024-2.Search in Google Scholar
[20] Liu Z, Gu X. Analysis for rutting development and evolution rules of asphalt pavement based on accelerated pavement test. The Transportation Research Board (TRB) 102nd Annual Meeting; 2023 Jan 8–12; Washington DC, USA.Search in Google Scholar
[21] Hatoum A, Khatib J, Barraj F, Elkordi A. Assessing the influence of overweight axles on rutting lives in flexible pavements using parametric survival analysis. BAU J Sci Technol. 2022;4(1). 10.54729/CUBR7851.Search in Google Scholar
[22] Chen D, Chen L, Qian Z. Impact of pavement rutting on vehicle safety: a closed-loop assessment method. Road Mater Pavement Des. 2022;24(10):2363–78.10.1080/14680629.2022.2146601Search in Google Scholar
[23] Federal Highway Administration. Distress identification manual for the long-term pavement performance program. Publication No. FHWA-HRT-13-092, 2014.Search in Google Scholar
[24] Mensching DJ, Rahbar-Rastegar R, Underwood BS, Daniel JS. Identifying indicators for fatigue cracking in hot-mix asphalt pavements using viscoelastic continuum damage principles. Transp Res Rec. 2016;2576:28–39.10.3141/2576-04Search in Google Scholar
[25] Asmael NM, Fattah MY, Kadhim AJ. Exploring the effect of warm additives on fatigue cracking of asphalt mixtures. J Appl Sci Eng. 2020;23(2):197–205.Search in Google Scholar
[26] Deef-Allah E, Abdelrahman M. Investigating the relationship between the fatigue cracking resistance and thermal characteristics of asphalt binders extracted from field mixes containing recycled materials. Transp Eng. 2021;4:100055.10.1016/j.treng.2021.100055Search in Google Scholar
[27] Rahbar-Rastegar R. Cracking in asphalt pavements: impact of component properties and aging on fatigue and thermal cracking [dissertation]. New Hampshire, USA: University of New Hampshire; 2017.Search in Google Scholar
[28] Brown RB, Kandhal PS, Roberts FL, Kim YR, Lee DY, Kennedy TW. Hot mix asphalt materials, mixture design, and construction. 3rd ed. Lanham (MD), USA: NAPA Research and Education Foundation; 2009.Search in Google Scholar
[29] Deef-Allah E, Abdelrahman M. Balancing the performance of asphalt binder modified by tire rubber and used motor oil. Int J Recent Technol Eng. 2019;8(4):5501–8.10.35940/ijrte.D8893.118419Search in Google Scholar
[30] Yusupov B, Qiu Y, Sharipov G, Wu C. Characterization of vertical response of asphalt trackbed concrete in railway substructure to external loads. Adv Mater Sci Eng. 2020;2020:1–12.10.1155/2020/3578281Search in Google Scholar
[31] Lee SH, Vo HV, Park DW. Investigation of asphalt track behavior under cyclic loading: full-scale testing and numerical simulation. J Test Eval. 2018;46(3):934–42.10.1520/JTE20160554Search in Google Scholar
[32] Soto FM, Di Mino G, Acuto F. Effect of temperature and traffic on mix-design of bituminous asphalt for railway sub-ballast layer. 10th International Conference on the Bearing Capacity of Roads: Railways and Airfields; 2017 Jun 28–Jul 1; Athens, Greece.Search in Google Scholar
© 2023 the author(s), published by De Gruyter
This work is licensed under the Creative Commons Attribution 4.0 International License.
Articles in the same Issue
- Research Articles
- The mechanical properties of lightweight (volcanic pumice) concrete containing fibers with exposure to high temperatures
- Experimental investigation on the influence of partially stabilised nano-ZrO2 on the properties of prepared clay-based refractory mortar
- Investigation of cycloaliphatic amine-cured bisphenol-A epoxy resin under quenching treatment and the effect on its carbon fiber composite lamination strength
- Influence on compressive and tensile strength properties of fiber-reinforced concrete using polypropylene, jute, and coir fiber
- Estimation of uniaxial compressive and indirect tensile strengths of intact rock from Schmidt hammer rebound number
- Effect of calcined diatomaceous earth, polypropylene fiber, and glass fiber on the mechanical properties of ultra-high-performance fiber-reinforced concrete
- Analysis of the tensile and bending strengths of the joints of “Gigantochloa apus” bamboo composite laminated boards with epoxy resin matrix
- Performance analysis of subgrade in asphaltic rail track design and Indonesia’s existing ballasted track
- Utilization of hybrid fibers in different types of concrete and their activity
- Validated three-dimensional finite element modeling for static behavior of RC tapered columns
- Mechanical properties and durability of ultra-high-performance concrete with calcined diatomaceous earth as cement replacement
- Characterization of rutting resistance of warm-modified asphalt mixtures tested in a dynamic shear rheometer
- Microstructural characteristics and mechanical properties of rotary friction-welded dissimilar AISI 431 steel/AISI 1018 steel joints
- Wear performance analysis of B4C and graphene particles reinforced Al–Cu alloy based composites using Taguchi method
- Connective and magnetic effects in a curved wavy channel with nanoparticles under different waveforms
- Development of AHP-embedded Deng’s hybrid MCDM model in micro-EDM using carbon-coated electrode
- Characterization of wear and fatigue behavior of aluminum piston alloy using alumina nanoparticles
- Evaluation of mechanical properties of fiber-reinforced syntactic foam thermoset composites: A robust artificial intelligence modeling approach for improved accuracy with little datasets
- Assessment of the beam configuration effects on designed beam–column connection structures using FE methodology based on experimental benchmarking
- Influence of graphene coating in electrical discharge machining with an aluminum electrode
- A novel fiberglass-reinforced polyurethane elastomer as the core sandwich material of the ship–plate system
- Seismic monitoring of strength in stabilized foundations by P-wave reflection and downhole geophysical logging for drill borehole core
- Blood flow analysis in narrow channel with activation energy and nonlinear thermal radiation
- Investigation of machining characterization of solar material on WEDM process through response surface methodology
- High-temperature oxidation and hot corrosion behavior of the Inconel 738LC coating with and without Al2O3-CNTs
- Influence of flexoelectric effect on the bending rigidity of a Timoshenko graphene-reinforced nanorod
- An analysis of longitudinal residual stresses in EN AW-5083 alloy strips as a function of cold-rolling process parameters
- Assessment of the OTEC cold water pipe design under bending loading: A benchmarking and parametric study using finite element approach
- A theoretical study of mechanical source in a hygrothermoelastic medium with an overlying non-viscous fluid
- An atomistic study on the strain rate and temperature dependences of the plastic deformation Cu–Au core–shell nanowires: On the role of dislocations
- Effect of lightweight expanded clay aggregate as partial replacement of coarse aggregate on the mechanical properties of fire-exposed concrete
- Utilization of nanoparticles and waste materials in cement mortars
- Investigation of the ability of steel plate shear walls against designed cyclic loadings: Benchmarking and parametric study
- Effect of truck and train loading on permanent deformation and fatigue cracking behavior of asphalt concrete in flexible pavement highway and asphaltic overlayment track
- The impact of zirconia nanoparticles on the mechanical characteristics of 7075 aluminum alloy
- Investigation of the performance of integrated intelligent models to predict the roughness of Ti6Al4V end-milled surface with uncoated cutting tool
- Low-temperature relaxation of various samarium phosphate glasses
- Disposal of demolished waste as partial fine aggregate replacement in roller-compacted concrete
- Review Articles
- Assessment of eggshell-based material as a green-composite filler: Project milestones and future potential as an engineering material
- Effect of post-processing treatments on mechanical performance of cold spray coating – an overview
- Internal curing of ultra-high-performance concrete: A comprehensive overview
- Special Issue: Sustainability and Development in Civil Engineering - Part II
- Behavior of circular skirted footing on gypseous soil subjected to water infiltration
- Numerical analysis of slopes treated by nano-materials
- Soil–water characteristic curve of unsaturated collapsible soils
- A new sand raining technique to reconstitute large sand specimens
- Groundwater flow modeling and hydraulic assessment of Al-Ruhbah region, Iraq
- Proposing an inflatable rubber dam on the Tidal Shatt Al-Arab River, Southern Iraq
- Sustainable high-strength lightweight concrete with pumice stone and sugar molasses
- Transient response and performance of prestressed concrete deep T-beams with large web openings under impact loading
- Shear transfer strength estimation of concrete elements using generalized artificial neural network models
- Simulation and assessment of water supply network for specified districts at Najaf Governorate
- Comparison between cement and chemically improved sandy soil by column models using low-pressure injection laboratory setup
- Alteration of physicochemical properties of tap water passing through different intensities of magnetic field
- Numerical analysis of reinforced concrete beams subjected to impact loads
- The peristaltic flow for Carreau fluid through an elastic channel
- Efficiency of CFRP torsional strengthening technique for L-shaped spandrel reinforced concrete beams
- Numerical modeling of connected piled raft foundation under seismic loading in layered soils
- Predicting the performance of retaining structure under seismic loads by PLAXIS software
- Effect of surcharge load location on the behavior of cantilever retaining wall
- Shear strength behavior of organic soils treated with fly ash and fly ash-based geopolymer
- Dynamic response of a two-story steel structure subjected to earthquake excitation by using deterministic and nondeterministic approaches
- Nonlinear-finite-element analysis of reactive powder concrete columns subjected to eccentric compressive load
- An experimental study of the effect of lateral static load on cyclic response of pile group in sandy soil