Intelligent terminal security technology of power grid sensing layer based upon information entropy data mining
-
Shuai Ren
 ,
Shuheng Xu
,
Shuheng Xu

Abstract
The power grid is an important connection between power sources and users, responsible for supplying and distributing electric energy to users. Modern power grids are widely distributed and large in scale, and their security faces new problems and challenges. Information entropy theory is an objective weighting method that compares the information order of each evaluation index to judge the weight value. With the wide application of entropy theory in various disciplines, the subject of introducing entropy into the power system has been gradually concerned. This article aims to study the smart terminal security technology of the power grid perception layer based on information entropy data mining. This article analyzes its related methods and designs a smart terminal for the power grid. On this basis, a data analysis platform is built and a safety plan is designed. The result is that the average absolute error, root mean square error, average absolute percentage error, and mean square error of the platform's power load forecast are 1.58, 1.96, 8.2%, and 3.93, respectively. These error values are within the ideal range, and the data processing ability is strong. The packet loss rate of the adversary's eavesdropping was tested, and the average packet loss rates at locations a, b, c, and d were 1.05, 1.2, 1.81, and 2.2%, respectively. Data packets will be definitely lost, so the platform is highly secure.
1 Introduction
1.1 Background
The smart grid is the intelligence of the power grid, also known as “Grid 2.0.” It is based on an integrated, high-speed two-way communication network. Through the application of advanced sensing and measurement technologies and methods, the reliability and the goal of safety, economy, efficiency, environmental friendliness, and safe use. Modern power grids gradually show interconnected, real-time, nonlinear, dynamic, and random characteristics. These complex characteristics have brought new problems to the safe operation of the power grid, for example, high construction cost, frequent maintenance, and it is difficult to ensure the safety of the power grid in the harsh environment. The power grid is often faced with various faults and changes in environmental factors. To avoid grid risks as much as possible and reduce failure losses, it is particularly important to conduct a reasonable and effective analysis of the smart terminal security technology of the power grid perception layer [1]. The information entropy theory is a weighting method that can effectively determine the importance of each index. It has been widely used in multi-index decision-making problems and has achieved relatively ideal results. Combining this method with big data and applying it to the research of power grid security technology is of great value to the stability and reliability of the power grid.
1.2 Significance
Recently, large-scale power outages often occur, and power companies and employees have become more aware of the importance of grid security. The causes of large-scale power outage mainly include natural disasters, power grid management system and mechanism reasons, man-made accidents reasons, and network security reasons. Among them, natural disasters are the most important cause of large-scale power failure accidents. Such accidents have accidental occurrence, have a clear impact range on the power system, and are not easy to spread, but are also accompanied by the combination of a variety of factors, and the cause of network security is also an increasingly important reason. Relevant scholars realized that when studying power grid security technology, it is difficult to meet the demands of today's power system using only traditional methods. To find new ways to improve the current grid security technology, data mining has been introduced. There will be a lot of data and a lot of information on the power system and energy system. This information hides great values and needs people to mine it [2,3]. So many scholars have paid attention to this point and established a data-driven thinking to deal with big data onto the power grid. Then, the theory of “information entropy” is used in the big data onto the power grid, so as to study the smart terminal security technology of the power grid perception layer.
1.3 Related work
Since the theory of information entropy was proposed, many scholars have studied it and used it in many fields. Silva Vf found that entropy can be used to assess changes in rainfall and runoff. The level of uncertainty in runoff data is higher than that in rainfall data. Rainfall and runoff changes can be obtained based on marginal entropy, and rainfall and runoff carry the same information content. But the shortcoming of this article is the lack of actual data support [4]. The research on the spread of rumors is mainly based on social and biological infection models or on public opinion dynamic models. Here, Wang proposed a comprehensive model based on information entropy. The model takes into account factors such as the role of memory, the herding effect, the subjective tendency to produce distortions, and the changes in the degree of people's trust in each other. The change of trust degree is controlled by the confidence factor β, and the tendency to produce distortion is controlled by the conservation factor K. This helps to limit the decision-making of the spread of rumors, but the model's handling of details needs to be strengthened [5]. Lv has established an evaluation system consisting of 11 indicators. Lv takes Oxford and Fengzhen as the research objects. Then, he established an intelligent growth evaluation model. The entropy method is used to calculate the indicator weights, and the model is used to evaluate the development plans of these two cities, and the indicator’s contribution to the level of intelligent growth is calculated from it. The results show that the intelligence growth level of Oxford University is higher than that of Lv et al. [6]. Kim et al. focused on filtering methods based on information entropy: IG (information gain), FCBF (filtering based on fast correlation), and mRMR (minimum redundancy and maximum correlation). FCBF has the advantage of reducing the computational burden by eliminating redundant features that meet the approximate Markov coverage conditions. However, FCBF only considers the correlation between features and classes to select the best features. Kim et al. proposed an improved FCBF to overcome this shortcoming. When this method has high requirements for practical operating conditions, its practicability is not strong [7]. Wang and Yao proposed a novel objective reduction method based on Nonlinear Correlation Information Entropy (NCIE). The method is embedded in Pareto-based and indicator-based MOEA, and the results show that this method significantly improves the performance of Pareto-based MOEA on reducible and nonreducible MaOP. But it is not very helpful to the performance of indicator-based MOEA [8]. Chaoliang et al. proposed a Demons algorithm based on regional information entropy. It introduces inertial parameters to improve the convergence performance of the algorithm. Simulation research and experiments of realistic infrared images show that the algorithm can match images with different intensities, but the disadvantage is that the sharpness of the image may not be high [9].
1.4 Innovation
The innovations of this article are as follows: (1) Combining information entropy with smart terminals of the power grid and introducing the security technology of smart terminals based on information entropy. (2) Data processing of the smart grid is performed by using a linear regression function algorithm.
2 Power grid smart terminal security technology in view of information entropy data mining
2.1 Smart terminal security technology for power grid perception layer
2.1.1 Grid smart terminal
To investigate the risks of smart terminals in the power grid, it is necessary to investigate the basic situation of the terminals, so as to screen smart terminals of the power grid and screen out smart terminals that may be at risk. Here are some classic smart terminals [10]. Intelligent terminals of the power grid specifically include various types of energy meters, environmental monitoring equipment, measurement and sensing sensors, power transformers, intelligent micro circuit breakers, relays and controllers, protocols, smart electricity meters, etc.
2.1.1.1 Smart meter
The basic equipment for data collection of smart meters is responsible for the collection [11]. In addition to the traditional power metering functions, it also has intelligent functions such as user control and prevention of electrical theft. Its topology is shown in Figure 1.
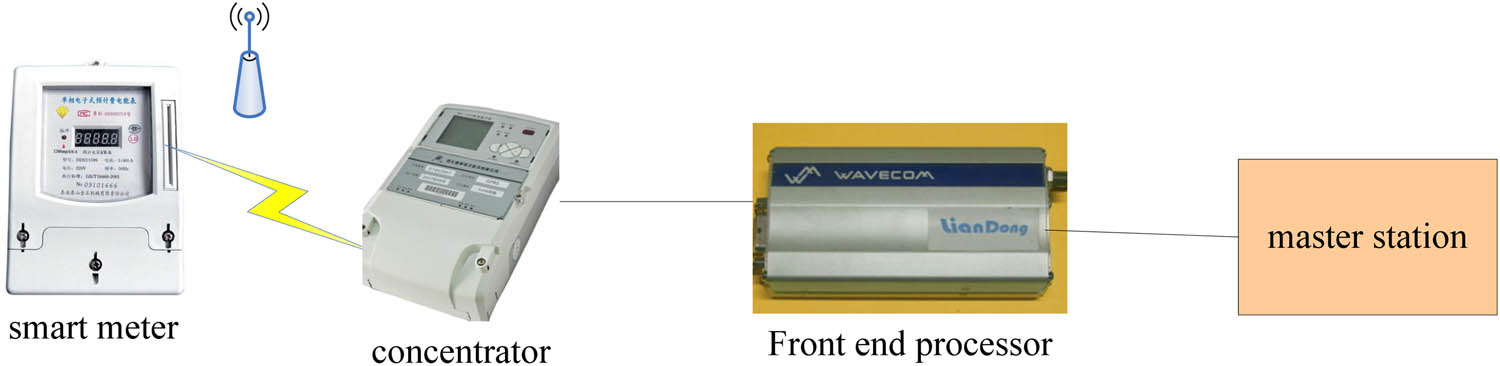
Smart meter network topology diagram.
2.1.1.2 Negative control/special transformer power consumption information collection terminal
The power consumption information acquisition terminal is used to collect power consumption information. It can ensure reasonable load and controllable residential electricity consumption [12]. Its structure is shown in Figure 2.
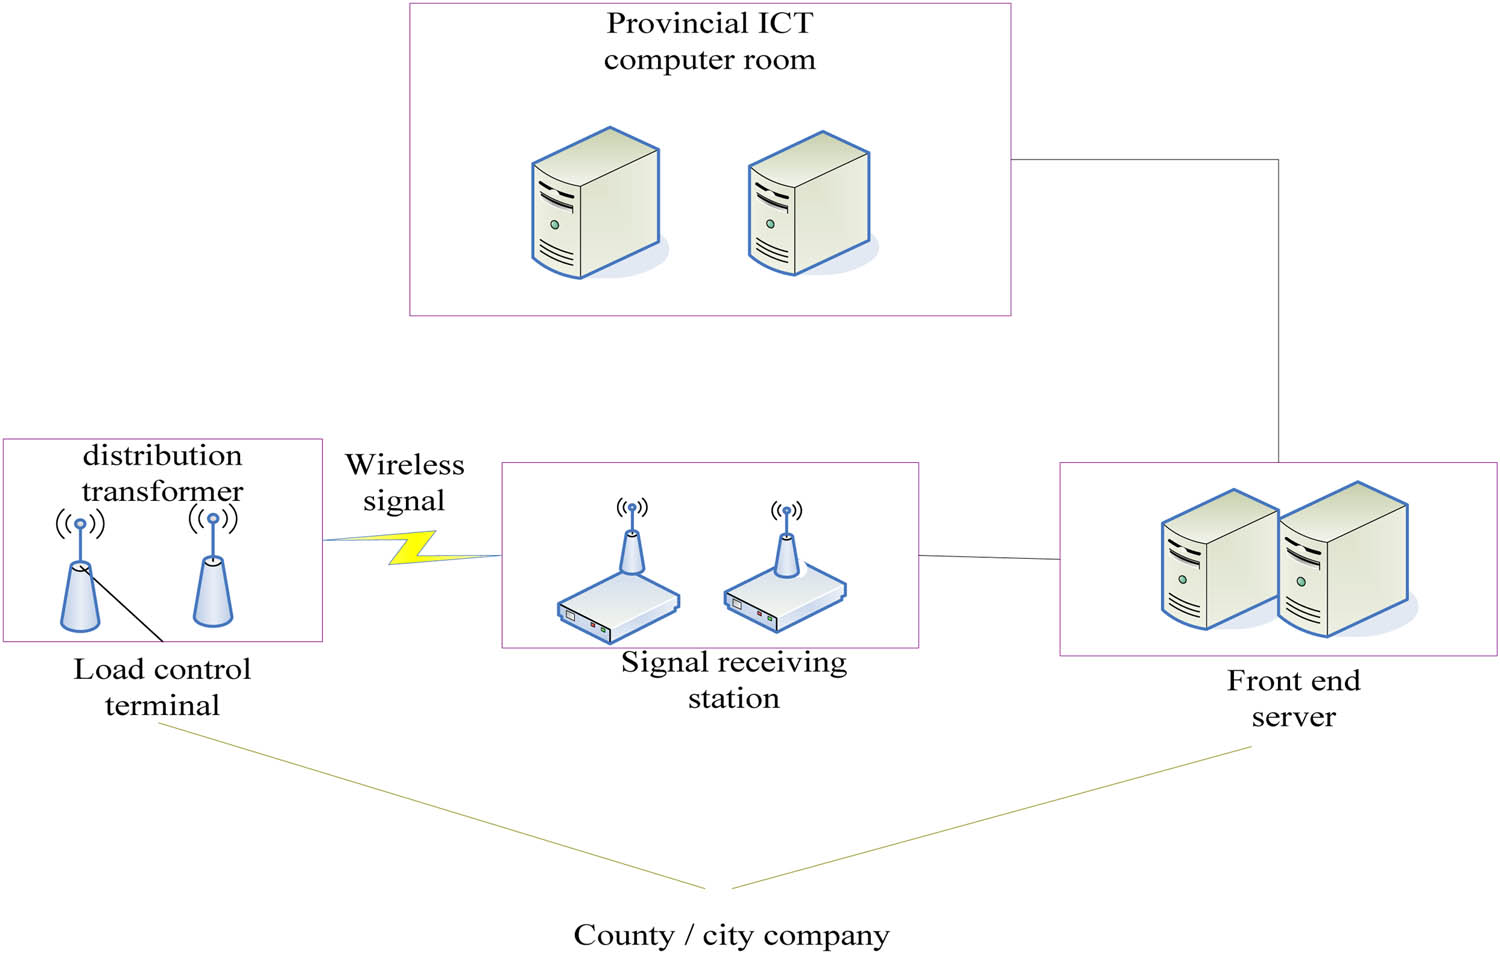
Electricity information collection terminal.
2.1.2 Smart terminal security technology
In the recent years, the information security situation is very severe. The smart terminal of the power grid is an important target for attacking the power network. It faces serious security risks. Electric power information security risks are divided into three aspects: chip layer, terminal layer, and interaction layer, as shown in Figure 3 [13]:
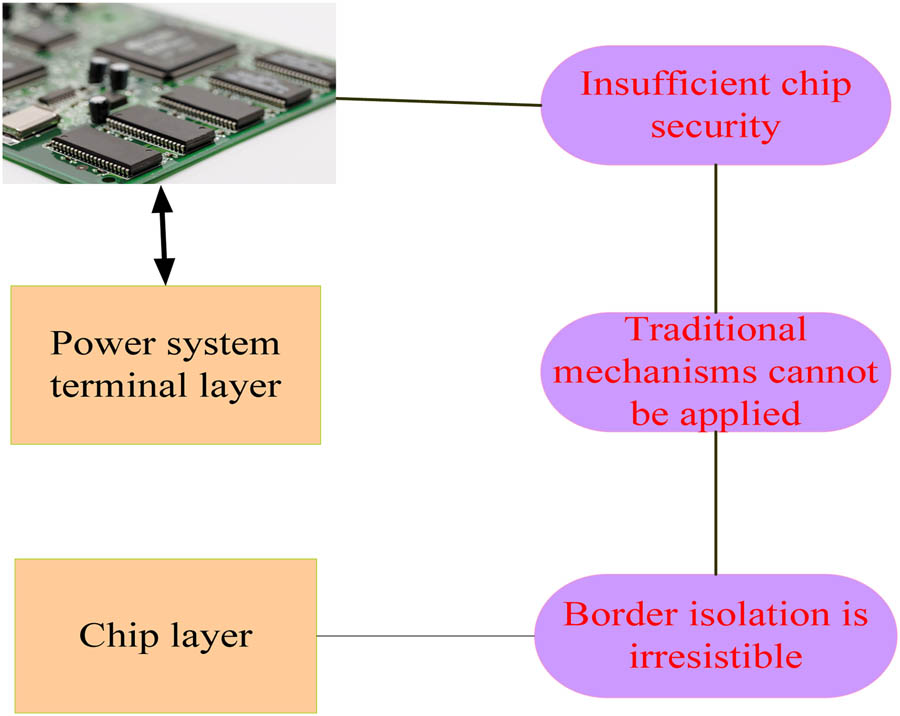
Security challenges of grid smart terminals.
2.1.3 Calculation method of power quality of smart terminal
2.1.3.1 Filtering link
To improve the ability to resist high-order harmonic interference, it is necessary to add low-pass filtering links in many places. First, discretize the analysis of the low-pass filter environment. The low-pass filter transfer function is expressed as follows:
Suppose
2.1.3.2 Preliminary data processing
It is important to standardize the data obtained by sampling and conversion, with a nominal value of 1. In addition, it is also optional to filter the sampled data once to filter out the noise introduced by the sample [14].
2.1.3.3 Realization of coordinate transformation
Next is the realization of coordinate transformation. To reduce the multiplication operation that consumes multiple instruction cycles, the coordinate transformation is performed according to the following formula:
Also, the CPU consumes a lot of time to calculate the sine and cosine. To improve the response speed, the coordinate method is used for calculation. The look-up table first transforms to the 0–90 degree interval according to the nature of the trigonometric function, finds the position of the array corresponding to the angle to be calculated, and finally uses the median interpolation method to complete the calculation.
2.1.3.4 PI controller
A PI regulator is a kind of linear controller, which forms control deviation according to the given value and the actual output value, forms the control quantity by the linear combination of the proportion and integral of the deviation, and controls the controlled object. The mathematical expression of the PI controller discretization is expressed as follows:
To ensure that the frequency amplitude is within the specified range of the national standard, it is necessary to limit the output of the PI controller.
2.2 Power grid smart security technology based on data mining
2.2.1 Data mining
Data mining refers to the process of searching for information hidden in a large amount of data through algorithms. Data mining is generally related to computer science and achieves these goals through a number of methods such as statistics, online analytical processing, intelligence retrieval, machine learning, expert systems (relying on past rules of thumb), and pattern recognition. Generally speaking, data mining has several characteristics: Data mining technology helps users find interesting but not clear requirements [15,16,17]. The data to be mined is large and difficult to process with traditional statistical methods. With reference to the knowledge of probability and statistics, the rules in data mining are based on a certain degree of confidence. Data mining systems often integrate the discovery, management, and maintenance of rules [18,19,20,21]. The general structure of data mining is shown in Figure 4:

Data mining model.
2.2.2 Intelligent prediction algorithm for power grid data based on data mining
The prediction model used for intelligent prediction of power grid data is a comprehensive prediction model. Synthesizing various prediction information and prediction accuracy provided by various prediction models improve prediction performance by optimizing and combining prediction results [22]. The structure of the prediction model is shown in Figure 5. First, the extended smoothing analysis and the linear regression analysis of the original data are performed separately, followed by a weighted synthesis, and finally, the results are predicted.
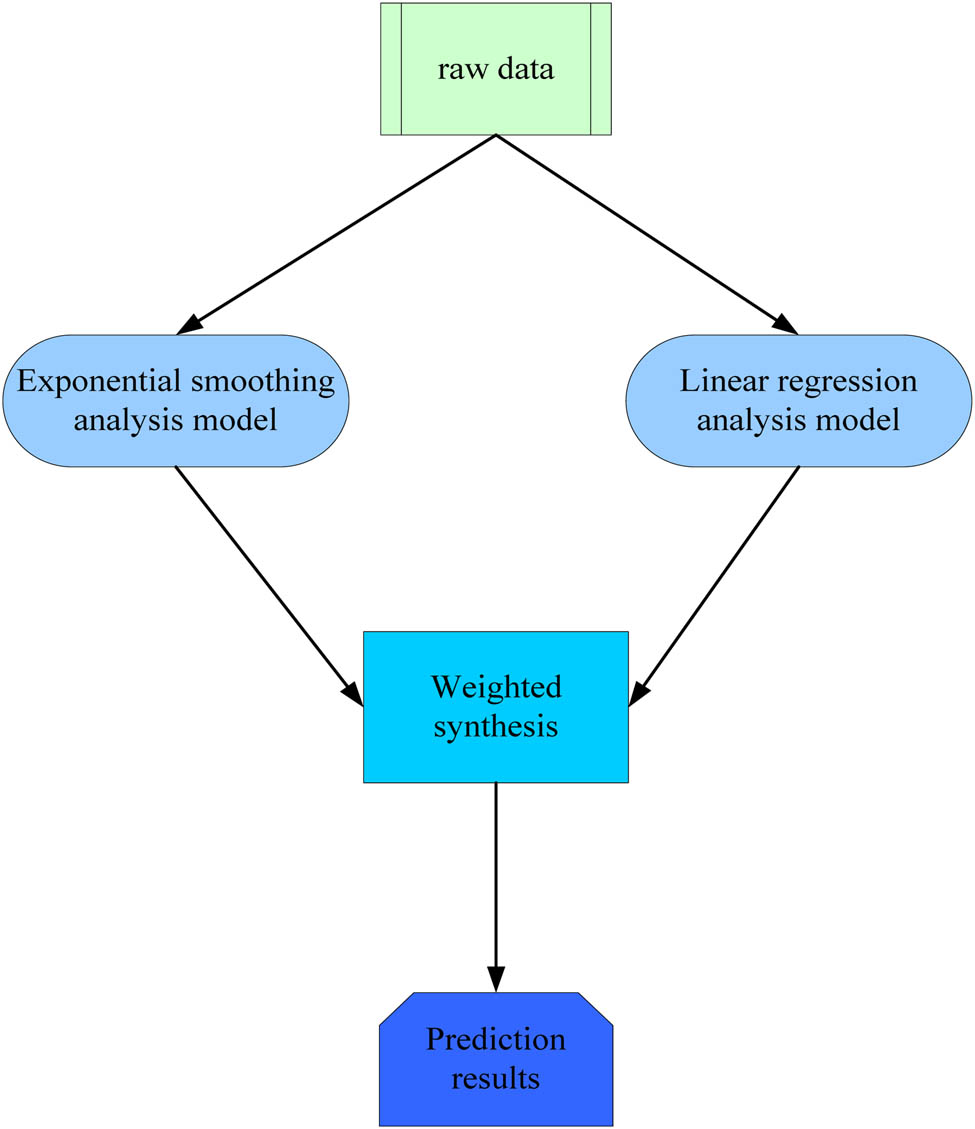
Predictive model of intelligent analysis.
2.2.2.1 Exponential smoothing analysis
The principle of the exponential smoothing analysis is to select each weight value as a descending exponential series. The exponential smoothing method finds the main development trend by eliminating the laws in the historical sequence [23]. For a time series, the formula for a smoothing index is expressed as follows:
where
The prediction model of the primary index is expressed as follows:
It can be seen from the calculation formula of exponential smoothing that exponential smoothing is an iterative calculation process. To use this method to predict, the initial value
When the number of periods in the time series is less than 20, the average value of the previous observation should be used instead of [24], such as:
2.2.2.2 Linear regression analysis model
The linear regression model is used to determine the correlation between variables. The univariate linear regression model can explore the linear relationship between X and Y [25]. Its general form is expressed as follows:
where a represents the estimated value of Y. X is the independent variable, a and b are unknown parameters, and b is the regression coefficient.
2.2.2.3 Determination of weights in comprehensive forecasting
Here, linear combination prediction is used to determine the weight of each single prediction model [26].
There are n single prediction methods, and the error of the ith prediction method is expressed as follows:
Combine the least-squares method to obtain the weight:
Finally, the predicted value is calculated by weighted processing and comprehensive analysis [27].
2.3 Power grid terminal security technology based on information entropy
2.3.1 Information entropy
The concept of entropy was originally a term dedicated to thermodynamics, which describes the degree of chaos in the distribution of energy in space [28]. The entropy theory has important applications in many fields, for example, in the field of the chemical industry, computer science, and physical biology. With the development of entropy theory, various fields regard it as an important parameter. Humans try to use the entropy theory to reason and evaluate things, so as to get various ideas and opinions about world affairs. Therefore, the concept of entropy thought came into being [29]. Claude Elwood Shannon combined entropy with information theory and proposed information entropy. For any random variable, the greater its information entropy, the more information is needed to understand it clearly, indicating that its uncertainty is also greater. At the same time, information entropy is also a quantitative description of the degree of system order. With the development of information theory, entropy theory has received more and more attention and has been gradually applied to the field of electric power.
Information entropy is divided into discrete information entropy and continuous information entropy according to the nature of random variables [30]. Among them, the definition of discrete information entropy is expressed as follows:
where C is a constant,
So when p(i) = 0, there are:
The definition expression of continuous information entropy is given as follows:
Among them, f(x) is the probability density function of random variable X, and continuous information entropy is used to describe the average uncertainty of the information source [31].
2.3.2 Power grid security analysis based on information entropy
Currently, the urban power grid is in an important period of large-scale development and upgrading. Therefore, how to achieve a more reasonable, objective, and comprehensive safety assessment while planning work has important practical significance [32].
Then set up a risk evaluation model to evaluate the risk. For any (x, y) risk evaluation problem, the quantitative risk can be evaluated according to the following calculation formula:
where
2.3.2.1 Entropy calculation formula used for safety assessment
Define
where n represents the exact number of digits of A.
2.3.2.2 Entropy calculation formula used for safety assessment
It can be seen from the formula that when the entropy value is close to 1, even if the entropy value of each indicator is slightly different, the entropy weight will change. For example, the entropy values of the two indicators of a particular scheme are almost the same. If both indicators are close to 1, the corresponding entropy weighted value is very close [33]. However, the phenomenon of entropy jumping occurs frequently. That is to say, the weighting coefficient obtained according to the previous entropy weighting calculation formula will vary greatly. In the (x, y) evaluation problem, the entropy weight of the ith evaluation index of the power grid is expressed as follows:
2.3.2.3 Power grid security assessment model based on information entropy
Since it is difficult to determine the weight coefficients of m evaluation indicators [34], it is necessary to use the calculated entropy weight A to weigh the evaluation matrix R. Normalizing the weighting matrix B, the following formula is obtained:
3 Data mining power grid smart terminal experiment based on information entropy
3.1 Design of intelligent terminal for power grid on account of data mining
3.1.1 Overall architecture of grid smart terminals
Smart terminals must be able to participate in remote control tasks, form a complete communication network for the power grid, and realize reliable communication connections between the central controller and power equipment such as DG, energy storage, and loads. Regarding data transmission, the intelligent terminal receives the adjustment and control commands of the central controller and sends them to the corresponding basic equipment controller.
Due to the rapid development of science and technology, the grid system has also developed very rapidly. Today, China's power grid system has integrated network, automation, and smart technology to a certain extent. As shown in Figure 6, it is the overall architecture of the grid smart terminal designed in this experiment. It mainly includes an intelligent cloud platform, big data processing layer, network layer, and infrastructure layer. Power smart terminals include smart car charging piles, power distribution network terminals, and smart meters.
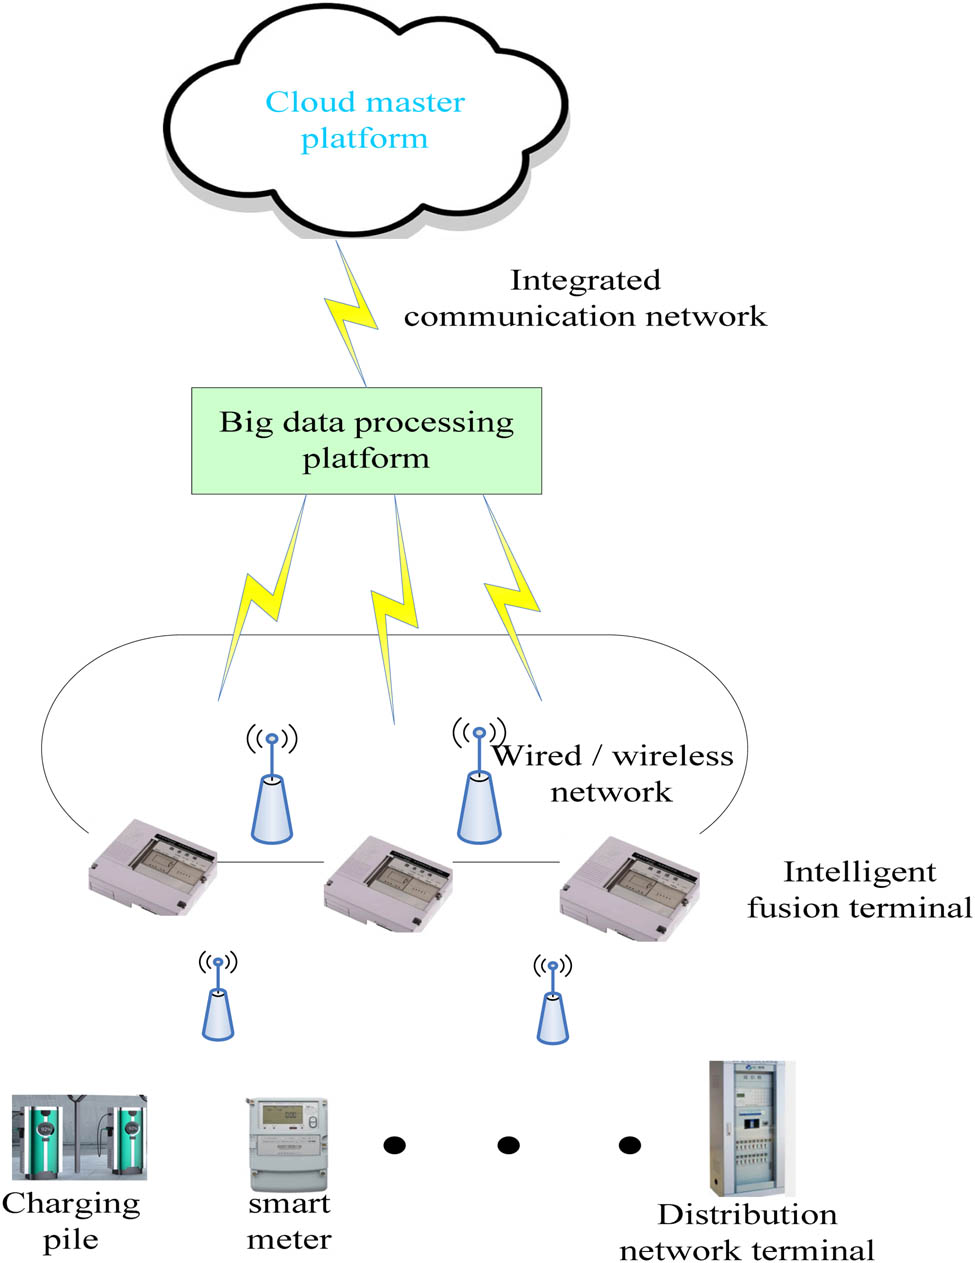
Grid smart terminal structure.
3.1.2 Overall system arrangement
Based on the large platform of grid smart terminals, this experiment redesigned a grid data platform based on data mining. In this platform, big grid data are collected and analyzed, so that the system predicts various grid data such as power load data. This experiment also designed a security plan for the smart terminal of the power grid to ensure the security of the power grid.
3.2 Data mining-based power grid data analysis platform experiment
3.2.1 Design of power grid data analysis platform
3.2.1.1 Construction of grid data analysis platform
This platform is a platform on which data mining algorithms are applied. By deploying data mining algorithms on this platform, it can process data. Figure 7 shows the structure of the grid data analysis platform. The platform includes portals, data source servers, and other parts.
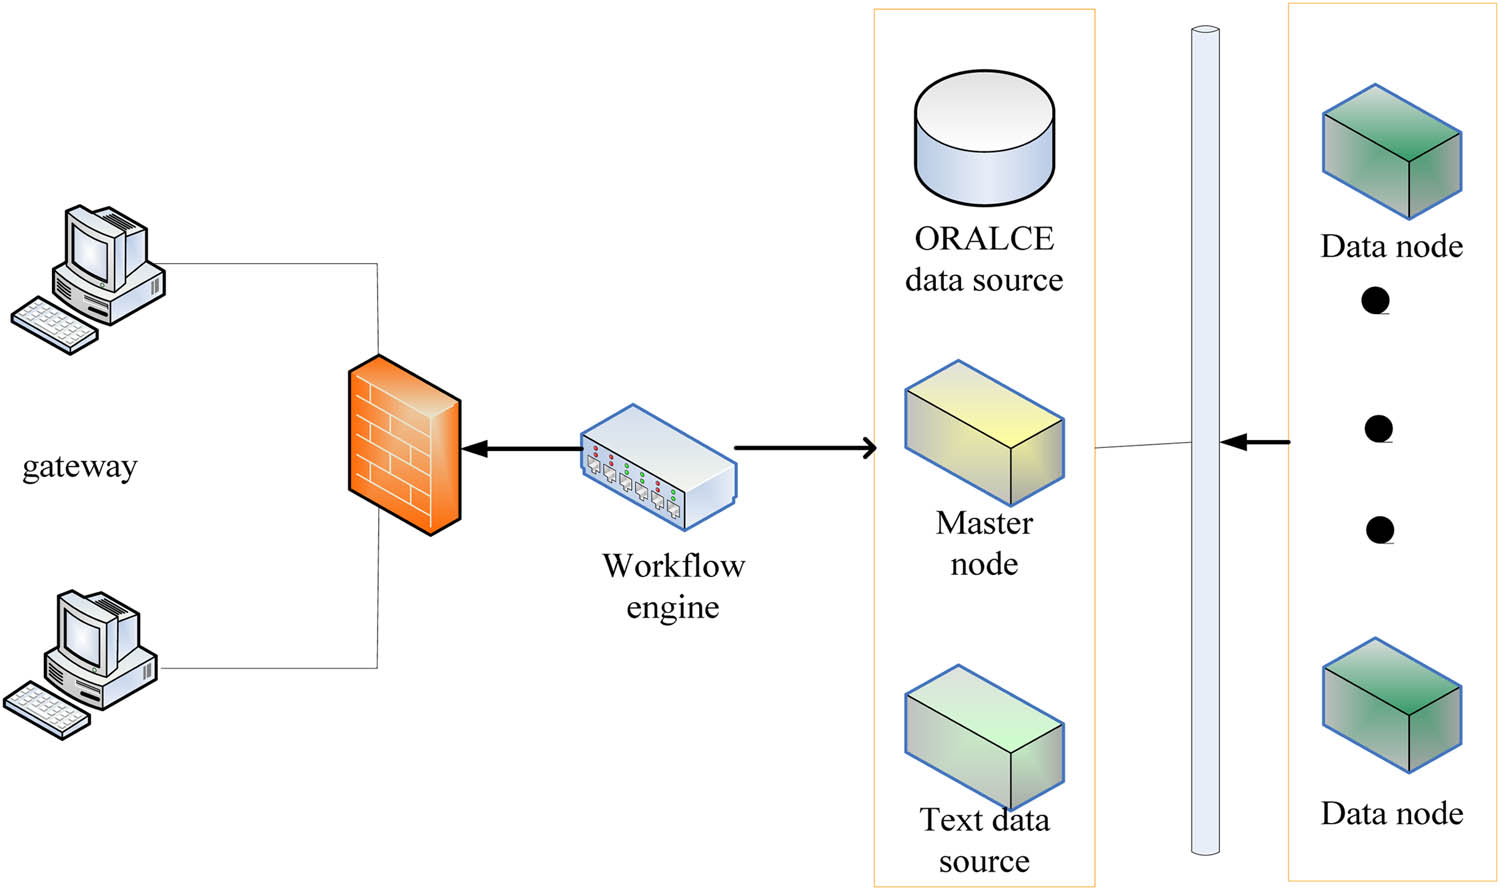
Platform topology diagram.
The workflow engine is used in the platform to edit the workflow and perform mining tasks. The heartbeat mechanism is used to communicate between the Master node and the DataNode data node. In this system platform, the Master node is separately deployed in a server, and then there are seven servers as DataNode data nodes. The overall architecture of the analysis platform includes four parts: the data layer mainly provides data storage and reading and writing services; the component layer is the core layer of the platform, and the same layer provides a variety of components to complete data preprocessing and data mining task; service layer is the layer for system management and production and editing workflow; and portal for data analysis and display.
3.2.1.2 Intelligent analysis process of grid data
The intelligent analysis process of the platform is divided into multidimensional analysis of historical data and time series prediction. A multidimensional database can be simply understood as follows: storing data in an n-dimensional array, rather than storing it in the form of records like a relational database. So it has a lot of sparse matrices and people can look at the data through a multidimensional view. The intelligent analysis process is shown in Figure 8:
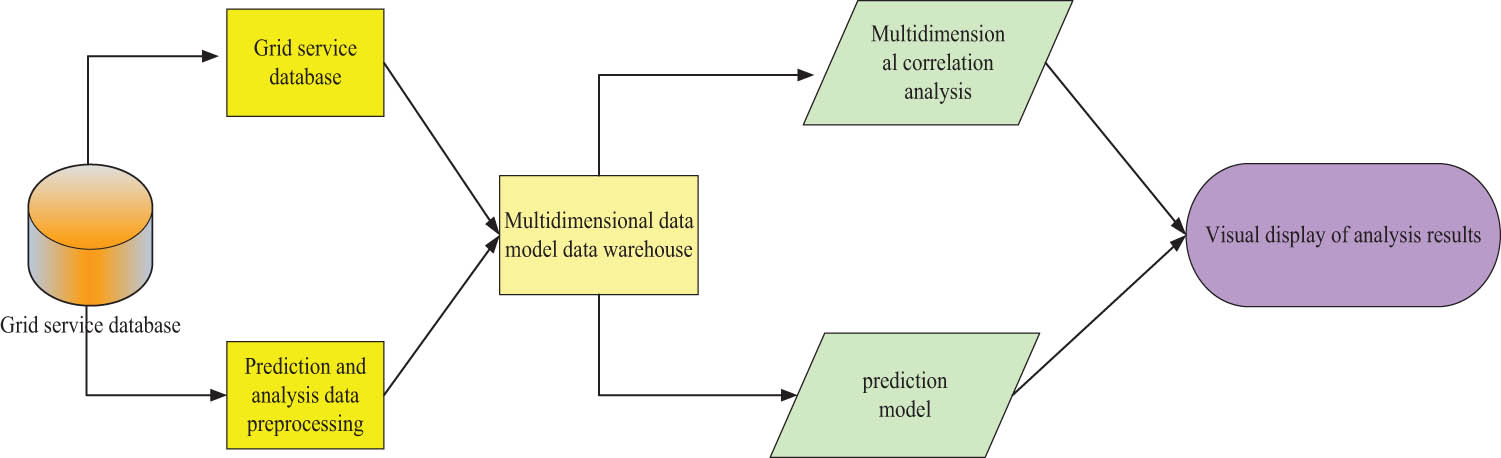
Grid data analysis process.
The grid business data layer uses the SQL Server database to store historical data and perform data preprocessing. It is then saved in a database based on the multidimensional data model. It digs balls for various needs, performs multidimensional correlation analysis and time series forecasting, and finally displays the digging information in front of users in a graphical form.
3.2.2 Data prediction experiment results of grid smart terminal
3.2.2.1 Analysis of power load forecast errors
To scientifically evaluate the accuracy of the prediction data of the power grid data analysis platform of the power grid intelligent terminal, the error index usually needs to be analyzed. To comprehensively evaluate the overall accuracy of the platform for power load forecasting, four indicators of average absolute error (MAE), average absolute percentage error (MAPE), mean square error (MSE), and root mean square error (RMSE) are finally selected for error analysis and evaluation of three grid load data forecasting algorithms. Figure 9 shows the four error values of the power load forecast by the grid data analysis platform within one day.
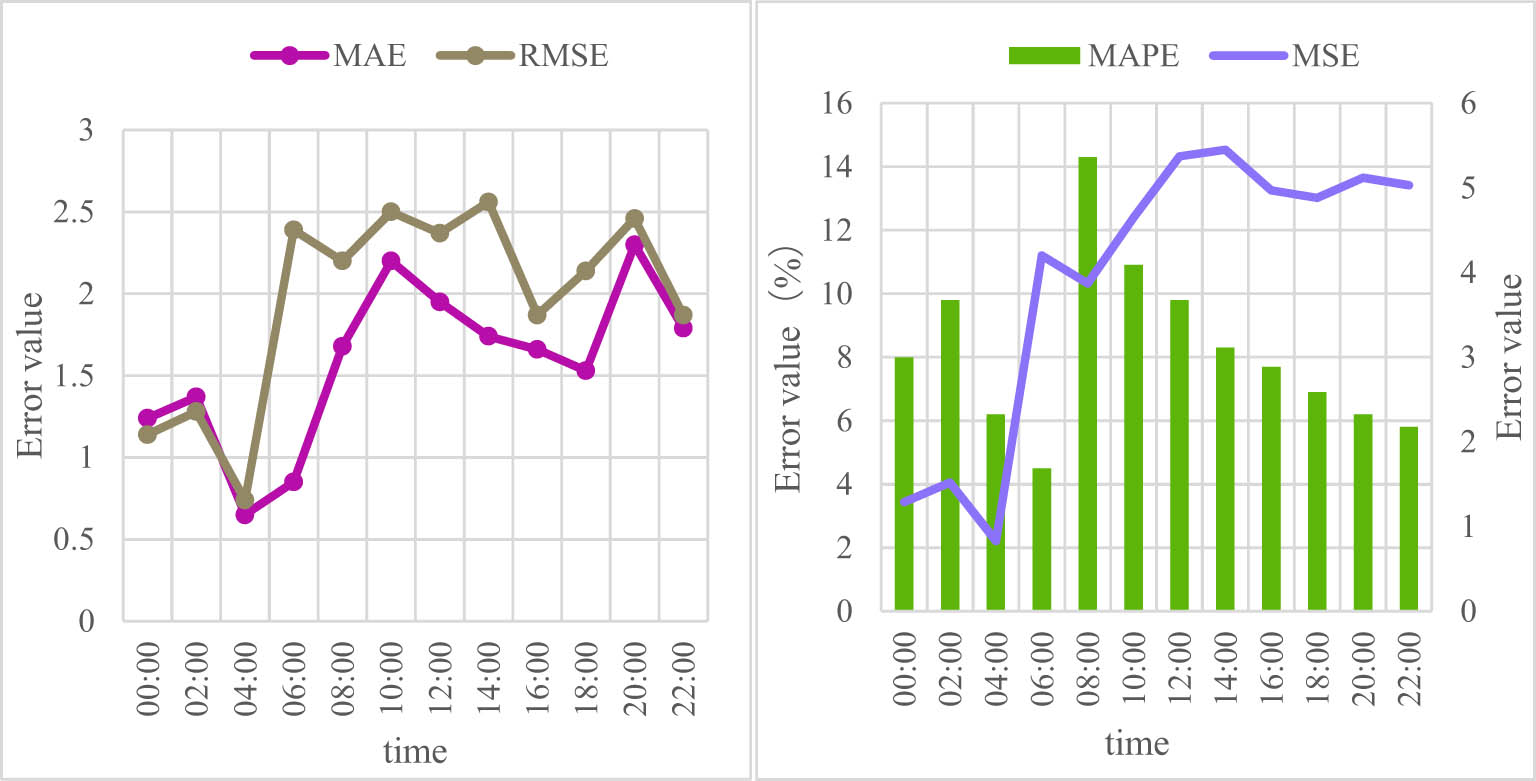
Grid load forecast error value.
Figure 9 shows that the maximum value of the mean absolute error occurs at 20:00 and the value is 2.3. The maximum value of the root mean square error occurs at 14:00, and the value is 2.56. The maximum value of the average absolute percentage error occurs at 8:00, and the value is 14.3%. The maximum mean square error occurs at 14:00, and the value is 5.45. Figure 9 shows that the minimum mean absolute error is 0.6, minimum RMSE error is 0.65, minimum mean absolute percentage error is 4.3%, and minimum MSE error is 2.1%.
We averaged the four error values of MAE, PMSE, MAPE, and MSE at different times and presented in Table 1:
Mean value of error
| Average value | |
|---|---|
| MAE | 1.58 |
| PMSE | 1.96 |
| MAPE | 8.2% |
| MSE | 3.93 |
From Table 1, we can see the average value of each error at different times. These values are within the ideal range, which proves that the error value of the power load forecasting based on the data mining power grid data analysis platform is relatively small and the accuracy rate is high.
3.2.2.2 Data processing efficiency
To verify the data processing efficiency of the platform, this article uses a large-scale data set as the input data. When the input data scale is the same, processing efficiency of this platform and the SPSS software's prediction algorithm for massive data is compared. Let the processing time of this platform be T1, the processing time of SPSS is T2, the input data size is continuously increased, and the processing time of the two algorithms on the massive data is recorded. Table 2 presents the efficiency comparison result.
Efficiency comparison
| Enter dataset size (MB) | T1 (min) | T2 (min) |
|---|---|---|
| 400 | 1.3 | 1.5 |
| 1,000 | 5 | 6 |
| 4,096 | 8 | 28 |
| 10,240 | 12 | 62 |
The processing time of both the platform and the SPSS increases with the increase of the data set. When the dataset is 400 MB, the processing time of the two is close. But with the increase of the data set, the processing time of this platform does not increase much, and the processing time of SPSS increases greatly. It shows that the data processing effect of this article is significantly improved, and with the increase of the data quantity, the efficiency improvement is more obvious.
3.3 Grid smart terminal security solution
3.3.1 Design of smart terminal security scheme
The smart grid communication security solution proposed in this experiment includes two parts: equipment authentication and data encryption. Smart meters and collection terminals are first certified for lightweight devices. When the authentication is passed, the data communication is continued. If the authentication is not passed, the authentication will be terminated to ensure the security of the system. The system adopts lightweight data encryption algorithm to ensure the security and integrity of data.
3.3.1.1 Analysis and design of lightweight equipment certification protocol
Lightweight data encryption algorithm is a packet cryptography algorithm, it has a strong differential resistance analysis ability, and encryption speed is much faster than DES, compared to some low-performance processor situations. In the smart grid information collection system, there are multiple communications between the smart meter terminal and the collector. In the upstream direction, the smart meter collects various power information, including current, voltage, and power consumption, and uploads it to the collector and its upstream business system. In the downstream direction, the business system issues control commands to adjust the operating status of the power user side. In the communication process, once an illegal device is connected to maliciously send false control commands, it will lead to instability of the power grid system. Therefore, in this experiment, based on the problems of the current mainstream lightweight device authentication protocols, a set of lightweight device authentication protocols suitable for smart meters and collectors is improved and designed to ensure the credibility of the identities of the communicating parties.
3.3.1.2 Analysis and design of lightweight data encryption algorithm
When communicating with the information collection system, if the attacker obtains the user's name, address, meter data, billing history, meter IP, etc., it will cause the user's privacy disclosure, damage the user's interests, and affect the development of the smart grid. In this experiment, a lightweight encryption algorithm is designed. The algorithm adopts the symmetric key algorithm with fast encryption speed, makes rational use of key resources, solves the problem of key update, and ensures the confidentiality of data to the greatest extent.
3.3.1.3 Experimental environment configuration
The experimental system configuration is presented in Table 3.
Experimental configuration environment
| Software and hardware | To configure |
| CPU | Intel Core i5 |
| Dominant frequency | 2.5 GHz |
| Memory | 8 G |
| Hard disk | 256 G |
| Operating system | Windows 10 |
3.3.2 Analysis of the safety results of the smart terminal of the power grid
3.3.2.1 Key security analysis
The key is constantly updated. During key transmission, the slave needs to ensure the accuracy of receiving the request and the master needs to ensure the accuracy of receiving the response. This experiment has done 10 tests to simulate the actual communication environment and send data packets to verify the performance of key update. The results are presented in Table 4.
Key update synchronization between master and slave devices
| Number of requested packets | Number of retransmitted packets | Packet retransmission rate (%) | Number of theoretical updates | Actual update times |
|---|---|---|---|---|
| 1,000 | 85 | 8.5 | 28 | 28 |
| 2,000 | 167 | 8.4 | 57 | 57 |
| 3,000 | 290 | 9.7 | 83 | 83 |
| 4,000 | 399 | 10 | 124 | 124 |
| 5,000 | 464 | 9.2 | 156 | 156 |
| 6,000 | 580 | 9.7 | 173 | 173 |
| 7,000 | 736 | 10.5 | 196 | 196 |
| 8,000 | 820 | 10.3 | 213 | 213 |
| 9,000 | 956 | 10.6 | 258 | 258 |
| 10,000 | 1,019 | 10.2 | 281 | 281 |
The master and slave devices record the status of 1,000 communication request update packets and keys. It can be seen from the table that the theoretical number of key updates is the same as the number of keys updated in the actual communication process. The results show that the key updates of the master device and the slave device are synchronous, and the system realizes the goal of the self-organization management.
3.3.2.2 Adversary key tracking
We conducted an experiment, and the eavesdropping packet loss rate is shown in Figure 10. During the communication process, three different locations were set up, and 10 groups of experiments were conducted at each location, and each group sent 5,000 data packets.
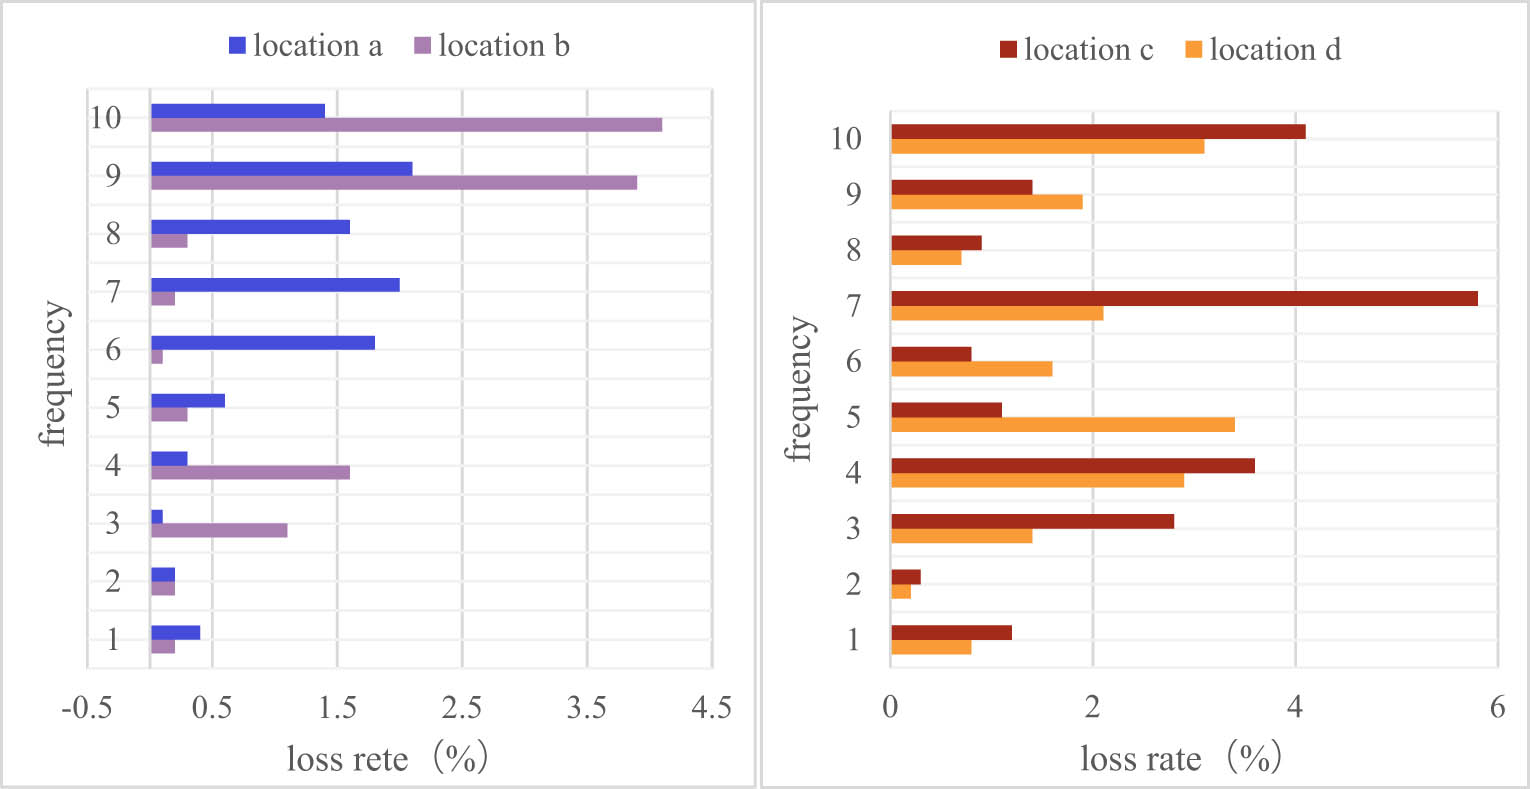
Eavesdropping packet loss rate.
After calculation, the average loss rate of data packets at location a is 1.05% and that at location b is 1.2%. The average loss rates of positions c and d are 1.81 and 2.2%. Therefore, the enemy will certainly have the problem of packet loss when eavesdropping on data communication. Once a packet is lost, the enemy eavesdropping fails. From this point of view, the overall data packet loss rate is not more than 6%, and the average is below 1.8%, indicating that the data confidentiality and security of this article are good (Figure 11).
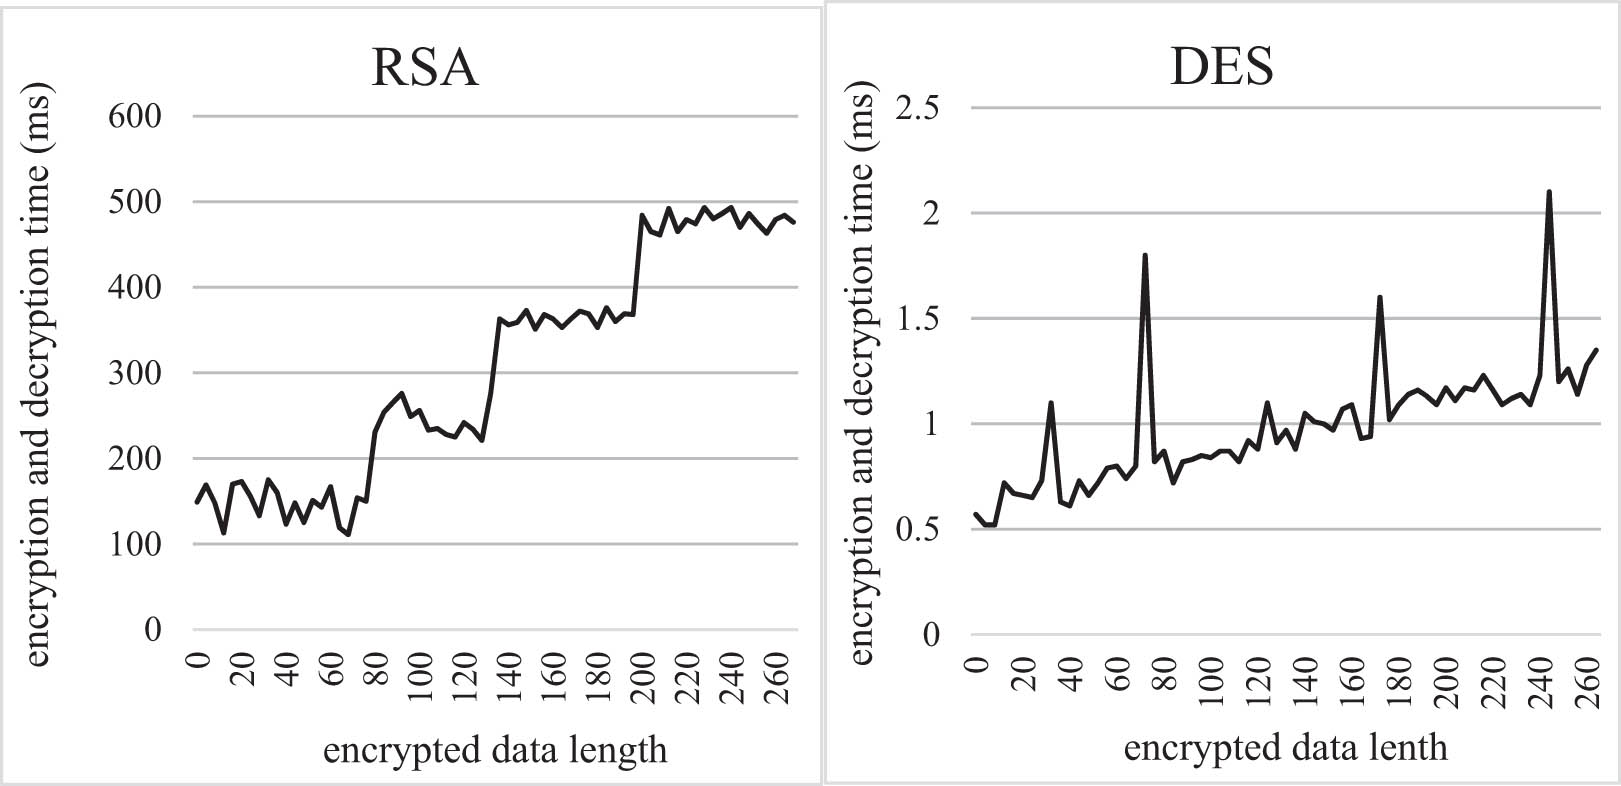
Time-consuming encryption and decryption of different algorithms.
3.3.2.3 Data encryption and decryption analysis
This experiment uses the more classic RSA and DES algorithms to explore the time-consuming situation of these two encryption and decryption processes. The time of 100 experiments was counted.
Both RSA and DES encryption and decryption algorithms consume less time as the data length increases. For the RSA algorithm, its encryption and decryption time are on the order of hundreds of milliseconds. It can be seen from the figure that when the data length is between 200 Byte and 264 Byte, the average time consumption of the RSA algorithm is 478 ms. For DES whose encryption and decryption take less than 10 ms, the average time for the data length between 200 Byte and 256 Byte is 1.24 ms. It can be seen from the experiment that the encryption and decryption of the platform's security scheme are good so that no matter whether a high-level or low-level algorithm is used, the encryption and decryption time is relatively ideal, which meets the requirements of timely communication.
4 Discussion
With the construction of power grids, more and more smart terminals are used in all aspects of the power grid. The construction of smart grid terminals is now very strong, but with the change in grid structure and the development of emerging industries, the level of construction of smart grid terminals needs to be further improved. Data mining technology has the advantages of the huge computing scale, advanced algorithm, and strong function. In the actual engineering project test, the application of data mining technology to the analysis and processing of power grid data has high reliability and practicability. Applying data mining to the smart terminal perception layer of the power grid can improve the performance of the power grid and increase its security.
5 Conclusion
This article introduces the related methods of smart terminal security technology of power grid perception layer based on information entropy data mining. This article first introduces the security technology of the smart terminal of the power grid and then introduces the security technology of the smart terminal based on data mining and information entropy. Finally, this article designs a power grid smart terminal, designs a data analysis platform based on data mining, and uses the platform to perform experiments to obtain the results: (1) The average absolute error, root mean square error, average absolute percentage error, and mean square error of power load forecasting are 1.58, 1.96, 8.2%, and 3.93, respectively. These error values are all within the ideal range. (2) The platform data processing time is short, and the efficiency is high. This article also designed a security plan, analyzed the plan, and obtained the result: (1) Test the packet loss rate of the adversary's eavesdropping; the average packet loss rates at positions a, b, c, and d are 1.05, 1.2, 1.81, and 2.2%, respectively; the problem of packet loss will occur when the enemy eavesdropping. (2) Whether it is RSA or DES encryption and decryption algorithms, time consumption is within the ideal range.
Smart grids must be more reliable – smart grids provide reliable power supply wherever and whenever users are. It provides adequate warning of possible grid problems and tolerates most grid disturbances without outages. It can take effective corrective action before the user is affected by the outage, so as to protect the grid users from the impact of power interruption.
6 In the future
Smart grids must be more environmentally friendly – smart grids reduce environmental impact through innovations in generation, transmission, distribution, energy storage, and consumption, also further expand the access to renewable energy. Where possible, in future designs, smart grid assets will take up less land and have a less physical impact on the landscape. The smart grid must be safe to use – the smart grid must not harm the public or grid workers, that is, the use of electricity must be safe.
-
Conflict of interest: The authors state no conflict of interest.
-
Data availability statement: The data that support the findings of this study are available from the corresponding author upon reasonable request.
References
[1] Guo K. Research on location selection model of distribution network with constrained line constraints based on genetic algorithm. Neural Comput Appl. 2020;32(6):1679–89.10.1007/s00521-019-04257-ySuche in Google Scholar
[2] Tsai SB, Yu J, Ma L, Luo F, Zhou J, Chen Q, et al. A study on solving the production process problems of the phEconomicotovoltaic cell industry. Renew Sustain Energy Rev. 2018;2018(82):3546–53.10.1016/j.rser.2017.10.105Suche in Google Scholar
[3] Tsai SB, Xue Y, Zhang J, Chen Q, Liu Y, Zhoug J, et al. Models for Forecasting Growth Trends in Renewable Energy. Renew Sustain Energy Rev. 2017;77:1169–78. 10.1016/j.rser.2017.03.098.Suche in Google Scholar
[4] Rodrigues da Silva VP, Belo Filho AF, Rodrigues Almeida RS, de Holanda RM, da Cunha Campos JHB. Shannon information entropy for assessing space–time variability of rainfall and stream flow in semiarid region. Sci Total Environ. 2016;544(feb.15):330–8.10.1016/j.scitotenv.2015.11.082Suche in Google Scholar PubMed
[5] Wangang C, Tan ZX, Ye Y, Wang L, Cheong KH, Xie NG, et al. A rumor spreading model based on information entropy. Sci Rep. 2017;7(1):9615.10.1038/s41598-017-09171-8Suche in Google Scholar PubMed PubMed Central
[6] Lv X, Zhang S, Li A, Li J. Research on smart growth of sustainable cities based on information entropy and super-efficiency DEA model. J Appl Math Phys. 2017;5(5):1198–214.10.4236/jamp.2017.55103Suche in Google Scholar
[7] Kim JT, Kum HY, Kim JH. A comparative study of filter methods based on information entropy. J Korean Soc Mar Eng. 2016;40(5):437–46.10.5916/jkosme.2016.40.5.437Suche in Google Scholar
[8] Wang H, Yao X. Objective reduction based on nonlinear correlation information entropy. Soft Comput. 2016;20(6):2393–407.10.1007/s00500-015-1648-ySuche in Google Scholar
[9] Chaoliang L, Lihua M, Min Y, Shumin C. Regional information entropy Demons for infrared image nonrigid registration. Opt – Int J Light Electron Opt. 2016;127(1):227–31.10.1016/j.ijleo.2015.08.080Suche in Google Scholar
[10] Jiang Q, Shen Y, Li H, Xu, Xu FF. New fault recognition method for rotary machinery based on information entropy and a probabilistic neural network. Sensors. 2018;18(2):337.10.3390/s18020337Suche in Google Scholar PubMed PubMed Central
[11] Huo W, Huang Y, Pei J, Zhang Q, Gu Q, Yang, et al. Ship detection from ocean SAR image based on local contrast variance weighted information entropy. Sensors. 2018;18(4):1196.10.3390/s18041196Suche in Google Scholar PubMed PubMed Central
[12] Kamrani S, Rezaei M, Amiri V, Saberinasr A. Investigating the efficiency of information entropy and fuzzy theories to classification of groundwater samples for drinking purposes: Lenjanat Plain, Central Iran. Environ Earth Sci. 2016;75(20):1370.10.1007/s12665-016-6185-1Suche in Google Scholar
[13] Braga N, Rocha RD. AdS/QCD duality and the quarkonia holographic information entropy. Phys Lett B. 2017;776(C):78–83.10.1016/j.physletb.2017.11.034Suche in Google Scholar
[14] Ye G, Pan C, Huang X, Zhao Z, He, He JJ. A chaotic image encryption algorithm based on information entropy. Int J Bifurc Chaos. 2018;28(1):1850010.10.1142/S0218127418500104Suche in Google Scholar
[15] Tang LM, Tan YT, Fang Z, Xiang C, Chen S. An improved criminisi image inpainting algorithm based on structure component and information entropy. J Optoelectronics·Laser. 2017;28(1):108–16.Suche in Google Scholar
[16] Chen G, Lu Y, Meng Y, Li B, Tan K, Pei D, et al. Fuso: fast multi-path loss recovery for data center networks. IEEE/ACM Trans Netw. 2018;26:1–14.10.1109/TNET.2018.2830414Suche in Google Scholar
[17] Zeng Y, Chen G, Li K, Zhou Y, Zhou X, Li K. M-skyline: taking sunk cost and alternative recommendation in consideration for skyline query on uncertain data. Knowl Based Syst. 2019;163(JAN.1):204–13.10.1016/j.knosys.2018.08.024Suche in Google Scholar
[18] Khalaf OI, Abdulsahib GM. Optimized dynamic storage of data (ODSD) in IoT based on blockchain for wireless sensor networks. Peer-to-Peer Netw Appl. 2021;14:2858–73. 10.1007/s12083-021-01115-4.Suche in Google Scholar
[19] Alsubari SN, Deshmukh SN, Alqarni AA, Alsharif NH, Aldhyani TH, Alsaade FW, et al. Data analytics for the identification of fake reviews using supervised learning. CMC-Computers, Mater & Continua. 2022;70(2):3189–204.10.32604/cmc.2022.019625Suche in Google Scholar
[20] Khalaf OI, Abdulsahib GM. Energy efficient routing and reliable data transmission protocol in WSN. Int J Adv Soft Comput Appl. 2020;12(3):45–53.Suche in Google Scholar
[21] Abdulsahib GM, Khalaf OI. Accurate and effective data collection with minimum energy path selection in wireless sensor networks using mobile sinks. J Inf Technol Manag. 2021;13(2):139–53.Suche in Google Scholar
[22] Pandey B. Testing isotropy in the two micron all-sky redshift survey with information entropy. Monthly Not R Astronomical Soc. 2017;468(2):1953–61.10.1093/mnras/stx573Suche in Google Scholar
[23] Kui D. Maximum information entropy principle and the interpretation of probabilities in statistical mechanics a short review. Eur Phys J B. 2016;89(5):1–7.10.1140/epjb/e2016-70175-6Suche in Google Scholar
[24] Lin S, Tian E, Fu Y, Tang XD, Li DD. Power load classification method based on information entropy piecewise aggregate approximation and spectral clustering. Proceedings of the CSEE. Vol. 37, Issue 8; 2017. p. 2242–52.Suche in Google Scholar
[25] Sriraman T, Chakrabarti B, Trombettoni A, Muruganandam P. Characteristic features of the Shannon information entropy of dipolar Bose-Einstein condensates. J Chem Phys. 2017;147(4):129–69.10.1063/1.4994922Suche in Google Scholar PubMed
[26] Meshalkin VP, Butusov OB, Kantyukov RR, Belozerskii AY. Local-potential morphometric algorithm for information-entropy estimation of the impact of technogenic chemical pollution on forests. Doklady Chem. 2020;495(2):199–204.10.1134/S0012500820120010Suche in Google Scholar
[27] Zhang S, Pu J, Si Y. An adaptive improved ant colony system based on population information entropy for path planning of mobile robot. IEEE Access. 2021;3(9):24933–45.10.1109/ACCESS.2021.3056651Suche in Google Scholar
[28] Lu P, Chen W. Identifying vital nodes in complex networks based on information entropy, minimum dominating set and distance. Int J Mod Phys B. 2021;35(5):109637–596.10.1142/S0217979221500715Suche in Google Scholar
[29] Yan X, Liu B, Wang S, Dong A, Feng Z, Yelin Y. Efilter: An effective fault localization based on information entropy with unlabelled test cases. Inf Softw Technol. 2021;134(8):106543.10.1016/j.infsof.2021.106543Suche in Google Scholar
[30] Deng B, Jin D, Luan J. Adaptive Short-Time Fractional Fourier Transform Based on Minimum Information Entropy. J Beijing Inst Technol. 2021;30(3):265–73.Suche in Google Scholar
[31] Edet CO, Ikot AN. Shannon information entropy in the presence of magnetic and Aharanov-Bohm (AB) fields. Eur Phys J Plus. 2021;136(4):432.10.1140/epjp/s13360-021-01438-4Suche in Google Scholar
[32] Zhang P, Li H, Ni Y, Gong F, Li M, Wang F. Security aware virtual network embedding algorithm using information entropy TOPSIS. J Netw Syst Manag. 2020;28(1):35–57.10.1007/s10922-019-09500-4Suche in Google Scholar
[33] Li F, Chen G. The evolution of information entropy components in relativistic heavy-ion collisions. Eur Phys J A. 2020;56(6):1–7.10.1140/epja/s10050-020-00169-xSuche in Google Scholar
[34] Han M, Wu Y, Wang Y, Liu W. Roller bearing fault diagnosis based on LMD and multi-scale symbolic dynamic information entropy. J Mech Sci Technol. 2021;35(5):1993–2005.10.1007/s12206-021-0417-3Suche in Google Scholar
© 2022 Shuai Ren et al., published by De Gruyter
This work is licensed under the Creative Commons Attribution 4.0 International License.
Artikel in diesem Heft
- Research Articles
- Construction of 3D model of knee joint motion based on MRI image registration
- Evaluation of several initialization methods on arithmetic optimization algorithm performance
- Application of visual elements in product paper packaging design: An example of the “squirrel” pattern
- Deep learning approach to text analysis for human emotion detection from big data
- Cognitive prediction of obstacle's movement for reinforcement learning pedestrian interacting model
- The application of neural network algorithm and embedded system in computer distance teach system
- Machine translation of English speech: Comparison of multiple algorithms
- Automatic control of computer application data processing system based on artificial intelligence
- A secure framework for IoT-based smart climate agriculture system: Toward blockchain and edge computing
- Application of mining algorithm in personalized Internet marketing strategy in massive data environment
- On the correction of errors in English grammar by deep learning
- Research on intelligent interactive music information based on visualization technology
- Extractive summarization of Malayalam documents using latent Dirichlet allocation: An experience
- Conception and realization of an IoT-enabled deep CNN decision support system for automated arrhythmia classification
- Masking and noise reduction processing of music signals in reverberant music
- Cat swarm optimization algorithm based on the information interaction of subgroup and the top-N learning strategy
- State feedback based on grey wolf optimizer controller for two-wheeled self-balancing robot
- Research on an English translation method based on an improved transformer model
- Short-term prediction of parking availability in an open parking lot
- PUC: parallel mining of high-utility itemsets with load balancing on spark
- Image retrieval based on weighted nearest neighbor tag prediction
- A comparative study of different neural networks in predicting gross domestic product
- A study of an intelligent algorithm combining semantic environments for the translation of complex English sentences
- IoT-enabled edge computing model for smart irrigation system
- A study on automatic correction of English grammar errors based on deep learning
- A novel fingerprint recognition method based on a Siamese neural network
- A hidden Markov optimization model for processing and recognition of English speech feature signals
- Crime reporting and police controlling: Mobile and web-based approach for information-sharing in Iraq
- Convex optimization for additive noise reduction in quantitative complex object wave retrieval using compressive off-axis digital holographic imaging
- CRNet: Context feature and refined network for multi-person pose estimation
- Improving the efficiency of intrusion detection in information systems
- Research on reform and breakthrough of news, film, and television media based on artificial intelligence
- An optimized solution to the course scheduling problem in universities under an improved genetic algorithm
- An adaptive RNN algorithm to detect shilling attacks for online products in hybrid recommender system
- Computing the inverse of cardinal direction relations between regions
- Human-centered artificial intelligence-based ice hockey sports classification system with web 4.0
- Construction of an IoT customer operation analysis system based on big data analysis and human-centered artificial intelligence for web 4.0
- An improved Jaya optimization algorithm with ring topology and population size reduction
- Review Articles
- A review on voice pathology: Taxonomy, diagnosis, medical procedures and detection techniques, open challenges, limitations, and recommendations for future directions
- An extensive review of state-of-the-art transfer learning techniques used in medical imaging: Open issues and challenges
- Special Issue: Explainable Artificial Intelligence and Intelligent Systems in Analysis For Complex Problems and Systems
- Tree-based machine learning algorithms in the Internet of Things environment for multivariate flood status prediction
- Evaluating OADM network simulation and an overview based metropolitan application
- Radiography image analysis using cat swarm optimized deep belief networks
- Comparative analysis of blockchain technology to support digital transformation in ports and shipping
- IoT network security using autoencoder deep neural network and channel access algorithm
- Large-scale timetabling problems with adaptive tabu search
- Eurasian oystercatcher optimiser: New meta-heuristic algorithm
- Trip generation modeling for a selected sector in Baghdad city using the artificial neural network
- Trainable watershed-based model for cornea endothelial cell segmentation
- Hessenberg factorization and firework algorithms for optimized data hiding in digital images
- The application of an artificial neural network for 2D coordinate transformation
- A novel method to find the best path in SDN using firefly algorithm
- Systematic review for lung cancer detection and lung nodule classification: Taxonomy, challenges, and recommendation future works
- Special Issue on International Conference on Computing Communication & Informatics
- Edge detail enhancement algorithm for high-dynamic range images
- Suitability evaluation method of urban and rural spatial planning based on artificial intelligence
- Writing assistant scoring system for English second language learners based on machine learning
- Dynamic evaluation of college English writing ability based on AI technology
- Image denoising algorithm of social network based on multifeature fusion
- Automatic recognition method of installation errors of metallurgical machinery parts based on neural network
- An FCM clustering algorithm based on the identification of accounting statement whitewashing behavior in universities
- Emotional information transmission of color in image oil painting
- College music teaching and ideological and political education integration mode based on deep learning
- Behavior feature extraction method of college students’ social network in sports field based on clustering algorithm
- Evaluation model of multimedia-aided teaching effect of physical education course based on random forest algorithm
- Venture financing risk assessment and risk control algorithm for small and medium-sized enterprises in the era of big data
- Interactive 3D reconstruction method of fuzzy static images in social media
- The impact of public health emergency governance based on artificial intelligence
- Optimal loading method of multi type railway flatcars based on improved genetic algorithm
- Special Issue: Evolution of Smart Cities and Societies using Emerging Technologies
- Data mining applications in university information management system development
- Implementation of network information security monitoring system based on adaptive deep detection
- Face recognition algorithm based on stack denoising and self-encoding LBP
- Research on data mining method of network security situation awareness based on cloud computing
- Topology optimization of computer communication network based on improved genetic algorithm
- Implementation of the Spark technique in a matrix distributed computing algorithm
- Construction of a financial default risk prediction model based on the LightGBM algorithm
- Application of embedded Linux in the design of Internet of Things gateway
- Research on computer static software defect detection system based on big data technology
- Study on data mining method of network security situation perception based on cloud computing
- Modeling and PID control of quadrotor UAV based on machine learning
- Simulation design of automobile automatic clutch based on mechatronics
- Research on the application of search algorithm in computer communication network
- Special Issue: Artificial Intelligence based Techniques and Applications for Intelligent IoT Systems
- Personalized recommendation system based on social tags in the era of Internet of Things
- Supervision method of indoor construction engineering quality acceptance based on cloud computing
- Intelligent terminal security technology of power grid sensing layer based upon information entropy data mining
- Deep learning technology of Internet of Things Blockchain in distribution network faults
- Optimization of shared bike paths considering faulty vehicle recovery during dispatch
- The application of graphic language in animation visual guidance system under intelligent environment
- Iot-based power detection equipment management and control system
- Estimation and application of matrix eigenvalues based on deep neural network
- Brand image innovation design based on the era of 5G internet of things
- Special Issue: Cognitive Cyber-Physical System with Artificial Intelligence for Healthcare 4.0.
- Auxiliary diagnosis study of integrated electronic medical record text and CT images
- A hybrid particle swarm optimization with multi-objective clustering for dermatologic diseases diagnosis
- An efficient recurrent neural network with ensemble classifier-based weighted model for disease prediction
- Design of metaheuristic rough set-based feature selection and rule-based medical data classification model on MapReduce framework