
Research of the thermal aging mechanism of polycarbonate and polyester film
-
Wei Wang

 ,
Kai Yang
,
Kai Yang

Abstract
Insulating paper is a traditional insulation material used for transformer insulation. Transformer development is not only limited to small sizes and large capacities, but also limited to insulation life as insulating paper cannot withstand high temperatures. Therefore, recent studies have focused on improving the performance of insulation paper and discovering better insulation materials. In this study, two types of polymeric materials, polycarbonate (PC) and polyester film (PET), were chosen for comparative analysis. In order to test whether these two materials could be used in oil-immersed transformers, the PC and PET were placed in transformer oil for thermal aging at 110°C and 130°C, respectively. The thermal cracking processes and fragmentation mechanisms of the PC, PET, and insulation paper were analyzed using thermal gravimetric analysis (TGA), differential scanning calorimetry (DSC), and atomic force microscopy (AFM), as well as their degrees of polymerization and surface morphologies. According to the test results, the initial thermal decomposition temperature of PC and PET are higher than insulation paper and exhibited a better thermal resistance. PC and PET have the potential to substitute insulation paper for large capacity power transformer.
1 Introduction
Insulation systems are important parts of transformers (1), (2), (3). The technical and economic indicators of a transformer are all associated with the performance of its insulation system and the lifespan of the insulating material (4), (5). Insulating paper, which has been commonly used as the solid insulation material in oil-paper insulation, has two defects. The dielectric constant of insulating paper, which is prone to partial discharge, is much higher than that of transformer oil, which causes an uneven electric field strength distribution in transformers. In addition, oil molecules decompose into gasses, such as H2, CH4, and C2H2, at high electric field strengths to the ion impact and increased probability of partial discharge. Thus, transformer insulation ages easily as insulation paper has a poor heat resistance and decomposes easily. After aging, insulation paper is brittle and loses most of its mechanical and electrical properties. When a short circuit occurs, insulation paper disintegrates and causes transformer malfunctions.
In recent years, synthetic insulation materials have been rapidly developed and widely used in many technological aspects due to their numerous advantages, including their superior insulation performances and heat resistances and lower manufacturing costs (6), (7), (8), (9). In addition, the dielectric constant of polymer materials is lower and closer to that of oil than insulation paper. Using polymeric materials as an alternative to insulation paper in oil immersed transformers could improve both the electric field distribution and insulation structure as well as significantly narrow the oil gap. Compared to transformers of the same capacity, the overall volume of transformers with polymeric insulation materials is smaller. Furthermore, transformers with polymeric insulation materials have narrower main insulation and window height differences and lower copper and silicon steel sheet consumptions, and, thereby, have considerable economic benefits. The heat resistance of polymer materials is also superior to that of electrical boards. Using polymer material can significantly improve insulation strength and service life at an equal temperature.
Therefore, polymer materials are researched to replace insulated pressboard, in order for high voltage, large capacity power transformers. Using polymer materials in oil-immersed power transformers would be of great scientific significance and yield economic benefits as the resulting power transformers would have smaller sizes, larger capacities, higher heat resistances and greater reliabilities (10), (11), (12).
In this study, two polymeric materials, polycarbonate (PC) and polyester film (PET), were chosen for a comparative analysis with insulation paper. The PC and PET were placed in transformer oil for thermal aging at 110°C and 130°C. Then, in order to determine whether the polymeric materials could be used in oil-immersed transformers, the thermal cracking processes and fragmentation mechanisms of the three insulation materials (PC, PET and nd insulation paper) were analyzed using thermal gravimetric analysis (TGA), differential scanning calorimetry (DSC), and atomic force microscopy (AFM) tests, as well as their degrees of polymerization and surface morphologies.
2 Polymer insulation material thermal aging tests
2.1 Polymeric insulation material selection
In this paper, PC and PET, were selected for analysis based on their electrical properties, mechanical properties, and aging resistance (13), (14). These materials were compared to cellulose insulation paper, and their aging characteristics were studied at different temperatures and with different aging times.
PC has a high strength, rigidity, impact resistance and creep resistance, low polarity, high long-term use temperature of 120°C, excellent electrical properties and good electrical properties at high temperatures. Figure 1 shows the chemical structure of PC. The test specimens used in this experiment are 0.5 mm thick.
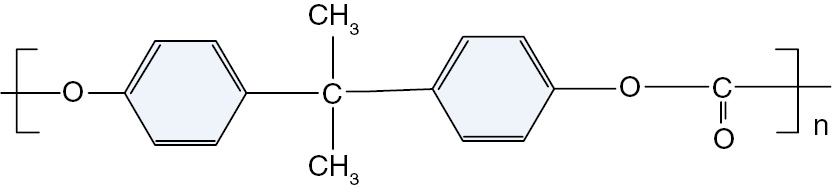
The chemical structure of PC.
PET, which has a high and low temperature resistance, chemical resistance, working temperature of approximately –60°C to 120°C, and high insulation resistance and breakdown field strength, exhibits a dielectric constant similar to that of mineral oil (3.0~3.4) and a low dielectric loss (~0.005%). The chemical structure of PET is shown in Figure 2. PC and PET specimens that are used in the experiment were produced by the DuPont Company, and have the same molecular weight.

The chemical structure of PET.
2.2 Temperature and aging test selection
The normal operating temperature of an oil-immersed transformer ranges from 75°C to 85°C, and some partial temperatures can reach to as high as 98°C. However, during emergencies, such as partial discharges, coronas, and spark discharges, some partial temperatures can be>100°C. The flash point temperature of tests conducted with #25 transformer oil is approximately 140°C. In cases such as this, the temperature reaches or exceeds the flash point temperature, the gas evaporates, the volume rapidly expands and explosions can occur; thus, the accelerated aging process temperature should not exceed 140°C. However, if the test temperature is too low, insulation material aging slows, and does not accurately reflect actual transformer operations and transformer failure cannot be judged (15), (16). Therefore, 110°C and 130°C temperatures were chosen as the accelerated aging temperatures.
An oil-immersed power transformer’s working life is approximately 30 years under reasonable and economical operation conditions. The half-life temperatures of other insulation materials range from 6°C to 14°C. According to IEC 60067–7 2005, at an 80°C–140°C temperature range, the insulation life of insulation paper can be estimated with the 6°C law, meaning that when the temperature is operating temperature increases by 6°C, the insulation life decreases by 50%. According to the 6°C law, the aging degree of insulation paper that has aged for 300 days at 110°C is equivalent to that of a transformer that has functioned for 26.67 years at 80°C. Thus, the insulation materials analyzed in this study were aged for 300 days at 110°C. In addition, as the properties of these material are essentially lost after 130 days at 130°C, a 130-day aging time was selected for the 130°C temperature. Periodic sampling tests were conducted in order to analyze the variations in the characteristic parameters.
3 Polymer material thermal aging tests
3.1 Thermal analysis kinetics
Thermal analysis is widely used to research the physical, chemical, and mechanical relationships of polymers at different temperatures in order to identify their structural stabilities. Through thermodynamic tests, thermal analysis kinetic parameters of polymeric insulation materials can be obtained and described with mathematical models. These parameters could be used as reference data for the thermal properties of polymer insulation materials undergoing thermal aging and thermal degradation.
The activation energy (E), pre-exponential factor (A), and enthalpy (ΔH) can be obtained through TGA and DSC. The activation energy (E) refers to minimum energy which must be available to a chemical system with potential reactants to result in a chemical reaction. The pre-exponential factor (A) is related to the molecular collision frequency. Enthalpy (ΔH) is the state of the variables in a system; heat enthalpy is defined according to a given system state. Large enthalpy (ΔH) values indicate unstable material performance; thus, a steady state is achieved by heat absorption. Enthalpy increases as the age of an insulation material increases.
3.1.1 Thermal gravimetric analysis
In this paper, a NETZSCH thermal gravimetric analyzer produced by the NETZSCH Corporation was used to conduct the TGA. The samples used in this experiment were obtained from flask immersed insulation paper. The insulating paper was cut into small particles with a 1 m molecular sieve in order to obtain uniform particles with approximately 5 mg weights. The heating rate was equal to 10°C/min, the temperature rose from to 30°C to 700°C, and the nitrogen purge rates were equal to 40 mL/min.
3.1.2 Differential scanning calorimetry
In this paper, a Q2000 DSC produced by the TA Corporation (USA) was used to test the DSC. The weight of the samples was approximately 5 mg. The heating rate was equal to 10°C/min, the temperature rose from 30°C to 400°C, and the nitrogen purge rates were equal to 40 mL/min. In the early experiments, the physically volatile transformer oil was found to be capable of affecting the endothermic peak produced through the pyrolysis of the insulation material. Thus, the insulation paper and PET were placed in a dichloromethane solvent, and the PC was placed in petroleum ether to remove the oil.
3.2 Atomic force microscopy (AFM)
Through AFM tests, the three-dimensional surface topography and roughness of the polymer insulation materials can be obtained. The surface undulation of the insulating materials at different stages of the aging process can be visualized with three-dimensional surface topography, and the surface roughness of the insulation materials can be quantified and used as a parameter in order to characterize the aging process and, thereby, assist in analyzing the experimental phenomena. The microstructure and changes of the insulation material can be analyzed using AFM detection (17). In this paper, an AFM. Veeco-icon precisional atomic force microscope was used.
4 Test results and analysis
4.1 Thermal gravimetric analysis
The initial decomposition temperature (at 5% of the weight loss, T5 for acronyms), the temperature at the maximum reaction rate, and the terminate decomposition temperature (Tf for acronyms) of the three characteristic quantities were obtained during the thermal gravimetric tests. The thermal decomposition (DTG) curves and values at the different stages of the aging process at 110°C and 130°C are shown in Figures 3–12. The aging time is the total time that the polymers suffered under electric and thermal stress, in the unit of days.
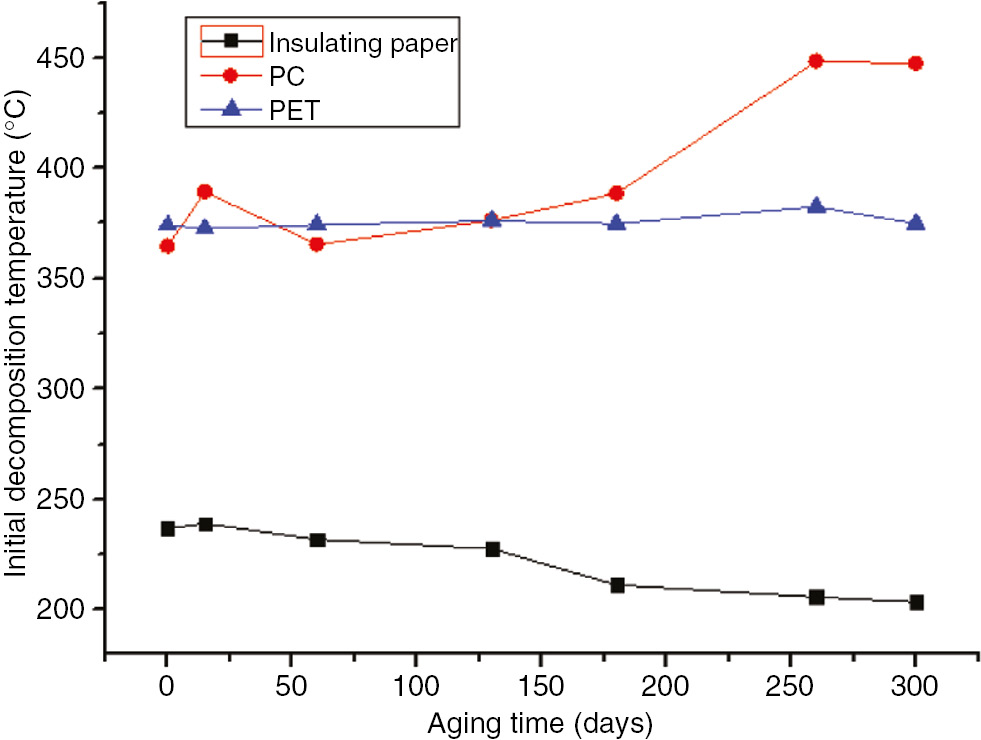
The initial decomposition temperatures of the three materials at 110°C.

The terminate decomposition temperatures of the three materials at 110°C.
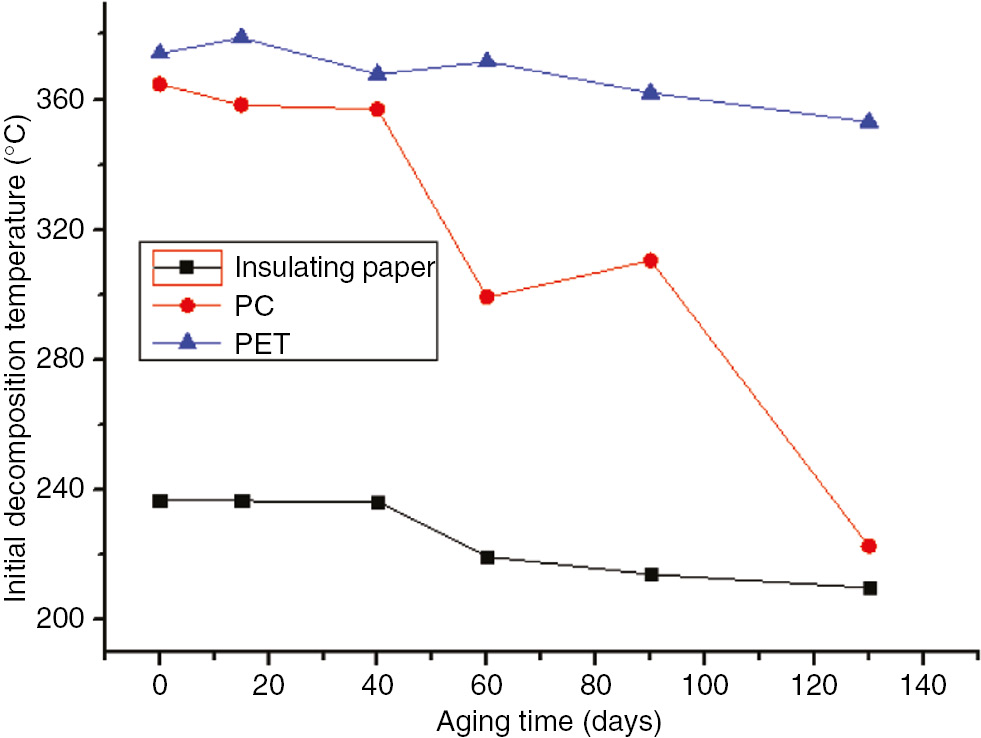
The initial decomposition temperatures of the three materials at 130°C.
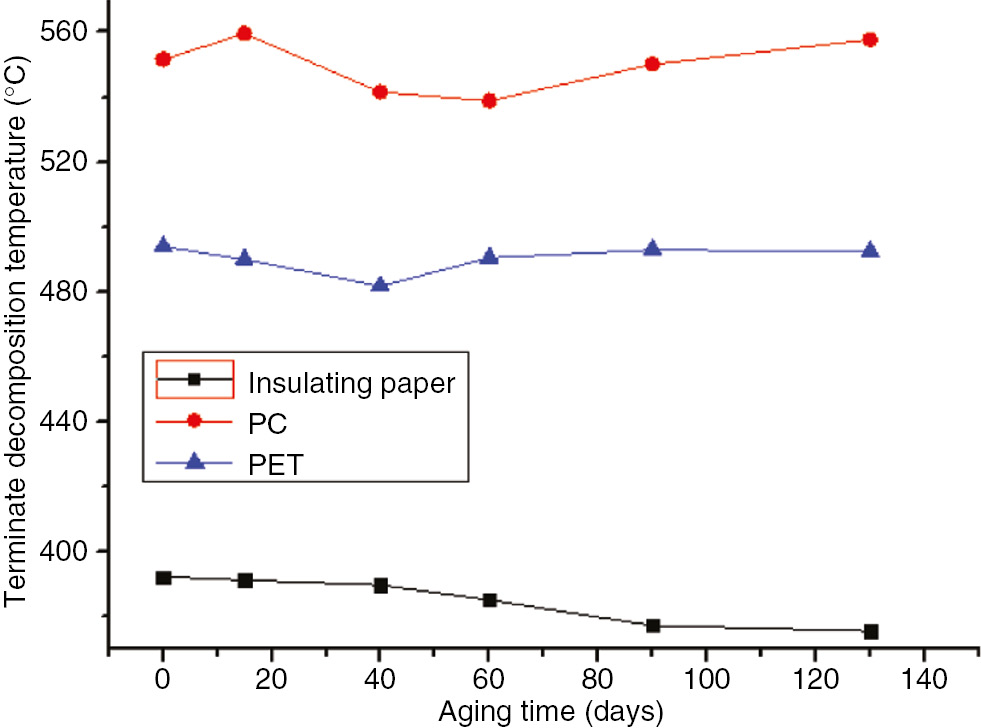
The terminate decomposition temperatures of the three materials at 130°C

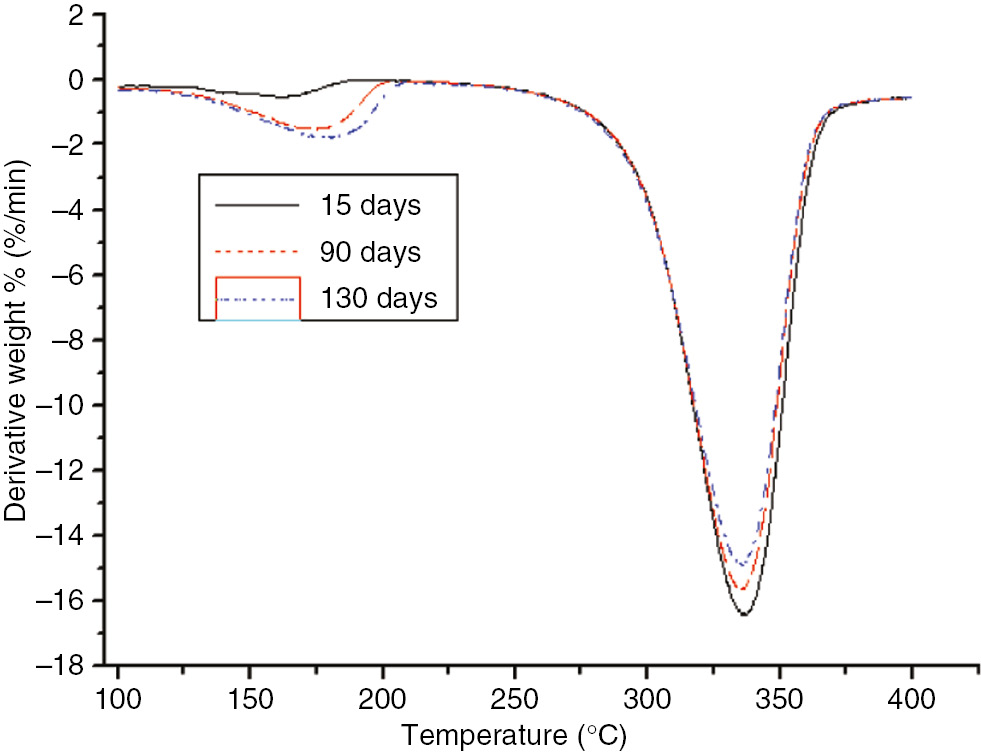
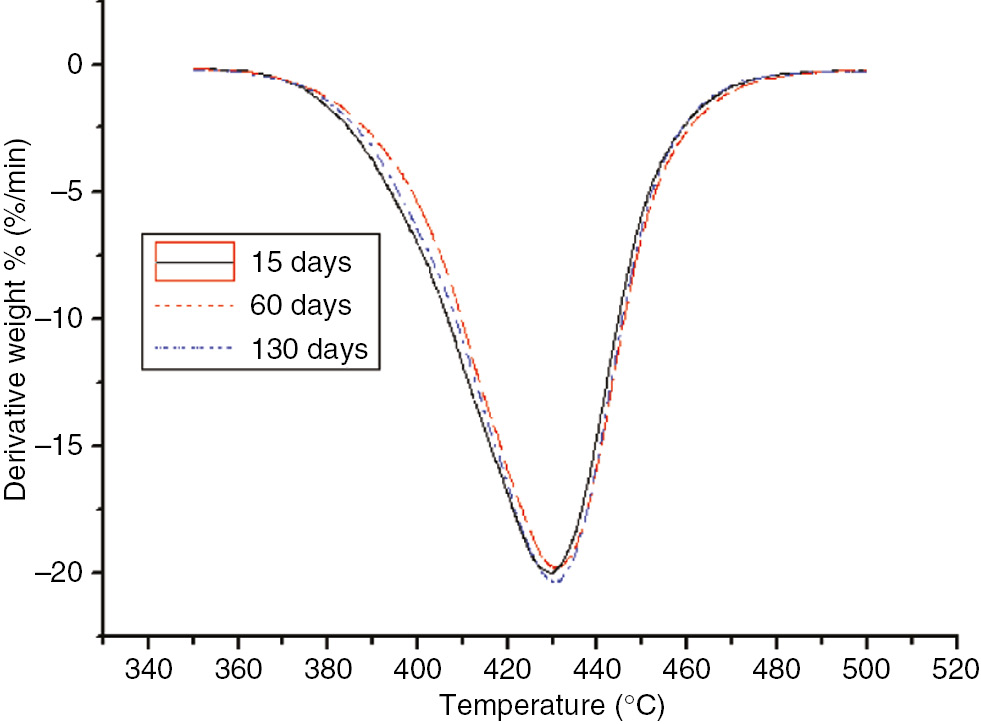
DTG curves of the different aging stages of the insulation paper at 110°C.
DTG curves of the different aging stages of the insulation paper at 130°C.
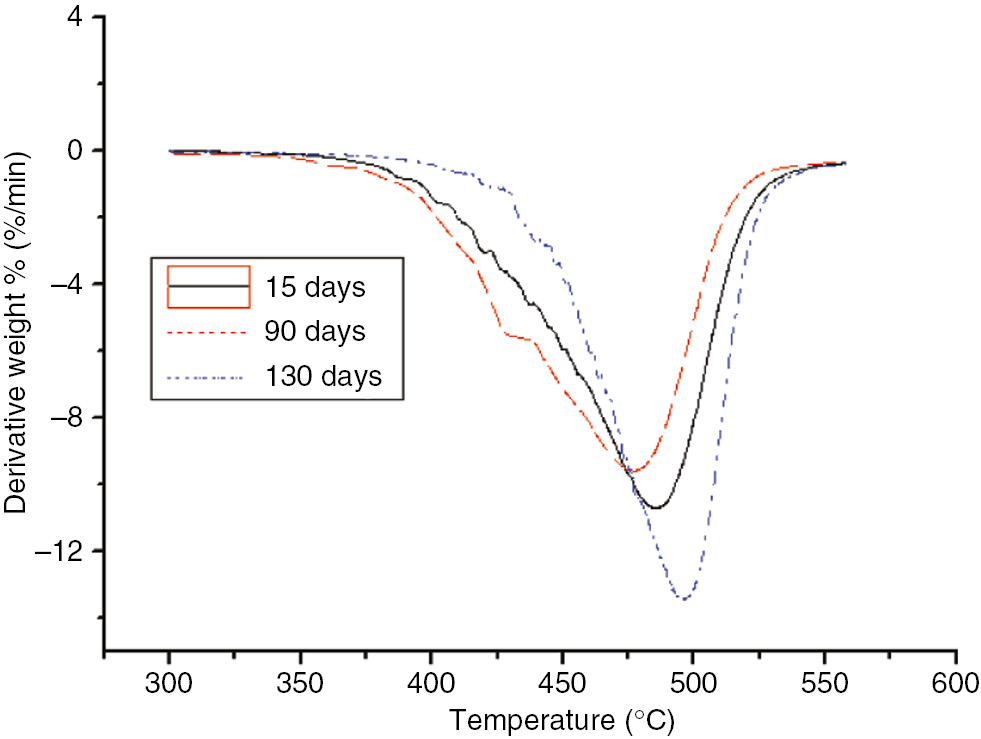
DTG curves of the different aging stages of the PC at 110°C.
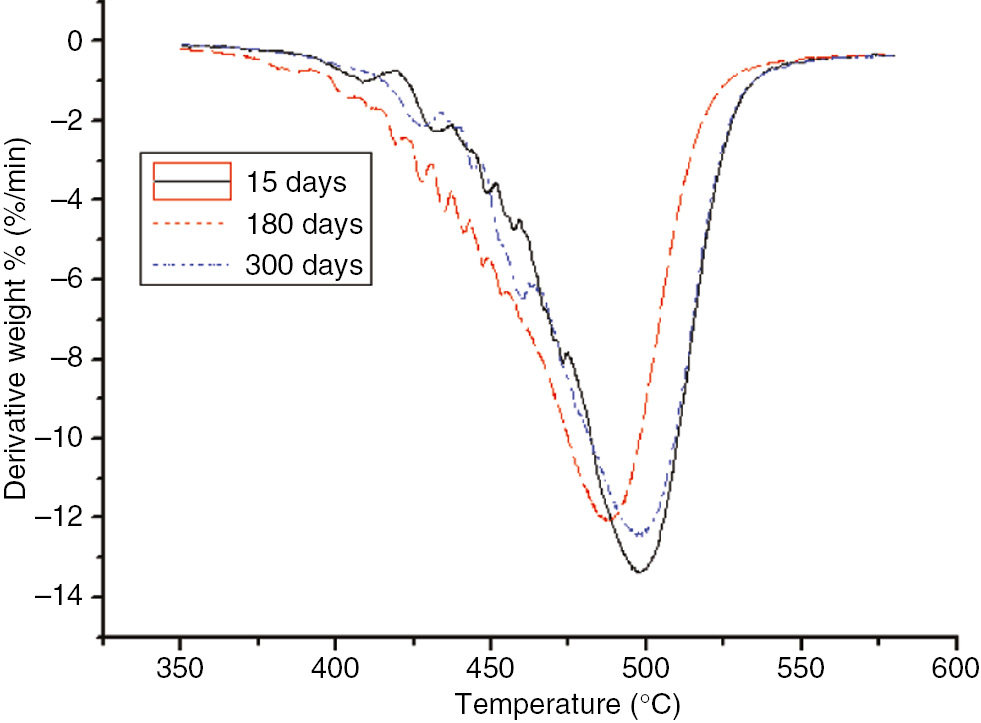
DTG curves of the different aging stages of the PC at 130°C.
DTG curves of the different aging stages of the PET at 110°C.
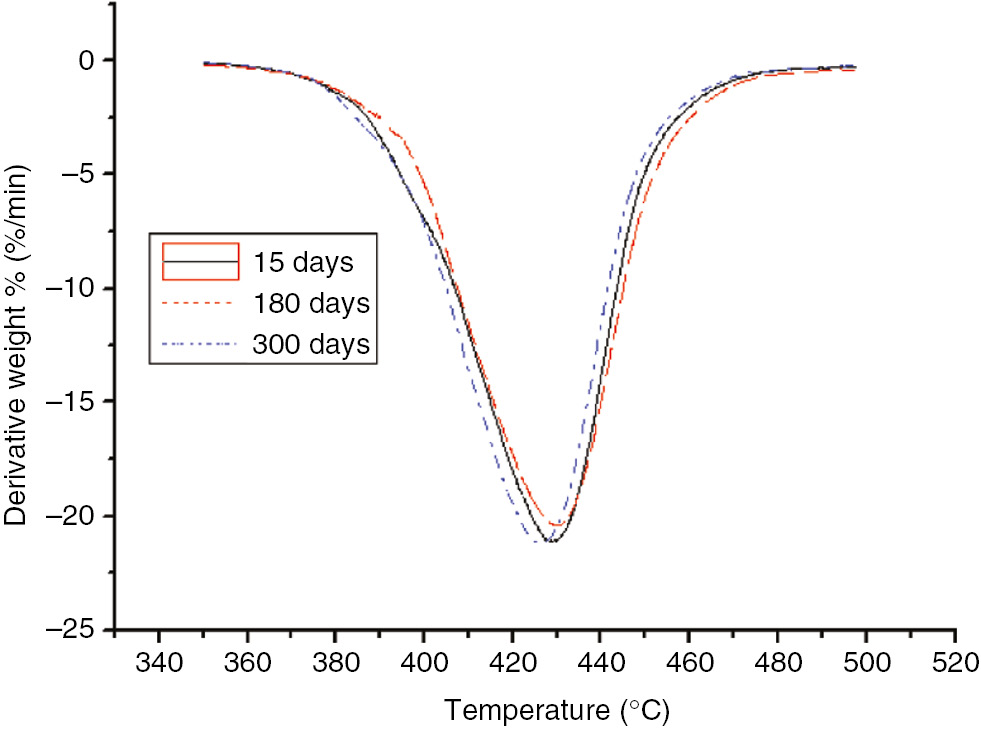
DTG curves of the different aging stages of the PET at 130°C.
As shown in these figures, as the aging time increased, the decomposition temperature, temperature at the maximum reaction rate, and Tf of the insulating paper sample decreased for both aging temperatures. Thus, as the aging time increased, the degree of sample aging increased, the thermal stability of the sample decreased, and the material was essentially destroyed, and, thereby, T5 and Tf were lowered. Therefore, the thermal decomposition eigenvalue of insulation paper could be used as an indication of the degree of aging.
As the aging time increased, T5, the temperature at the maximum reaction rate, and Tf of the PC exhibited no significant variations, and did not change monotonically. After 60 days at 130°C, the three characteristic quantities of PC pyrolysis were significantly lower than that after the same number of days at 110°C; this indicated that, during the accelerated aging test, the degree of material aging was still embodied by the pyrolysis test. Differences between the PC and insulating paper were obvious; T5 and Tf of the PC was much higher than that of the insulation paper, indicating that the PC’s temperature resistance was higher than that of the insulation paper. However, since the thermal decomposition value of the PC exhibited no significant variation, it could not be used as an aging indicator.
The thermal decomposition values of the PET were the same as that of the PC with no significant changes. Compared to the insulation paper, T5 of the PET was much higher than that of the insulation paper and essentially equal to that of the PC. Thus, the temperature resistance properties of the PET were better than that of the insulating paper, but similar to that of the PC. However, since its thermal decomposition eigenvalue exhibited no significant variation, it could not be used as an indication of the degree of aging.
In this paper, an A2 reaction model was selected as it was best suited to the reaction mechanism model of insulation materials, or F(α)=(–ln(1–α))1/2 (18), where α represents the relative weight loss. In general, two methods are used to determine kinetic parameters: the integral method and the differential method. In this paper, the Coats-Redfern mechanism equation was used with different methods to calculate the thermal decomposition kinetics.
In this equation, β denotes the heating rate, R=8.314 J/(mol·K) is the gas constant, Ea represents the activation energy, A is the pre-exponential factor, and T denotes the absolute temperature in units of K. Since 1–2RT/Ea≈1, in Equations [1], the vertical axis is ln ((–ln (1–α)) 1/2/T2), the abscissa is 1/T, the slope is –Ea/R, and the intercept is lnAR/βEa. Through DTG curves, these equations were used to calculate the activation energies (Ea); the activation energies and variation curves of the three materials are shown in Figures 13 and 14.
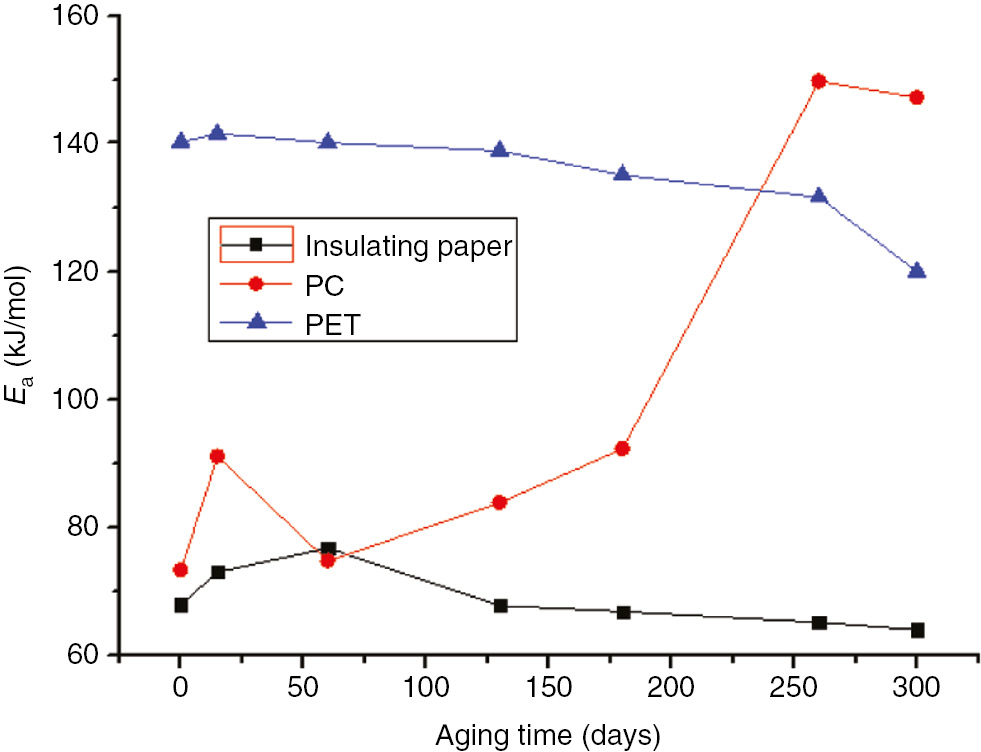
Activation energy variation curves of the three materials at 110°C.
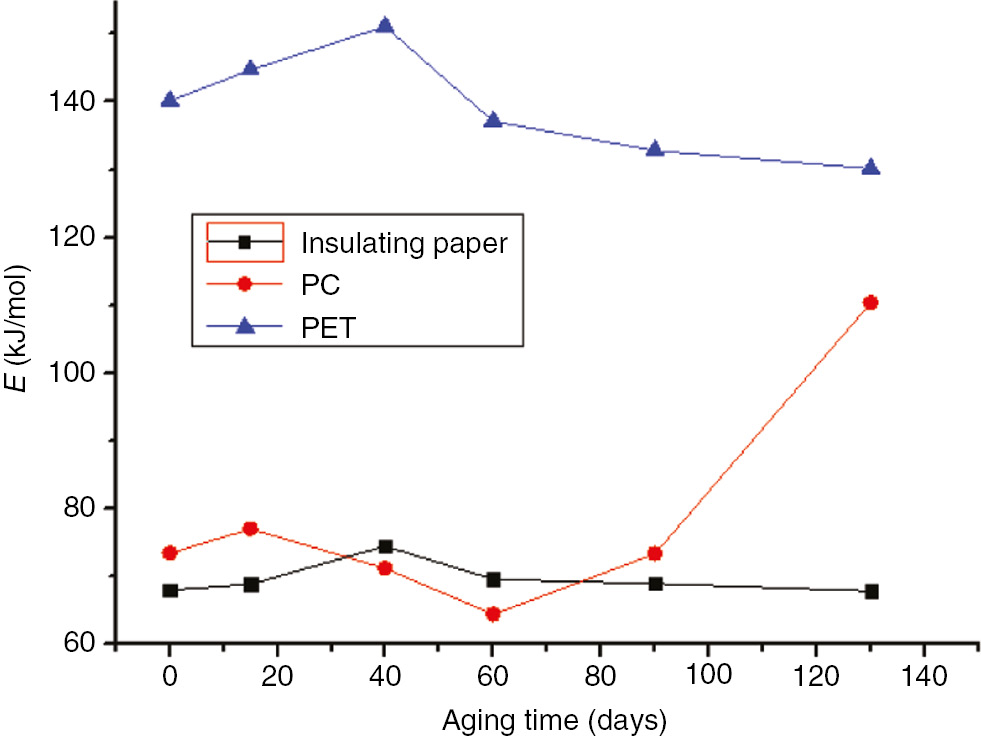
Activation energy variation curves of the three materials at 130°C.
The initial activation energy of unaged insulation paper is small because, due to its high energy, only a small amount of external energy absorption can be activated. The aging of insulation paper results from the degradation of its crystalline and amorphous regions. During the early stages of the aging process, the amorphous region of the insulation paper was destroyed, leading to an increased proportion of crystalline regions; these crystalline regions combined through hydrogen bonds and became activated molecules. As these activated molecules absorbed more energy, the activation energy increases. As the aging time increased, the crystalline regions continued to degrade; when the crystalline region was severely damaged, the thermal decomposition exhibited a decrease in activation energy. The pre-exponential factor and activation energy exhibited the same trends.
As the aging time increased, the activation energy of the PC, without significant change, continued to fluctuate during the prometaphase. The activation energy of the PC peaked after 260 days at 110°C and after 130 days at 130°C. Compared to the initial decomposition temperature (T5) and terminate decomposition temperature (Tf), the change in activation energy and thermal decomposition values exhibited a certain relationship. Compared to unaged PC, T5 increased by approximately 80°C after 300 days at 110°C; thus, in order to reach the reactive state, the PC absorbed more energy during thermal decomposition. In addition, compared to unaged PC, T5 decrease by approximately 140°C after 130 days at 130°C, but the temperature at the maximum reaction rate and Tf increased significantly. Thus, although the PC decomposed easily, the decomposition time and temperature increased, causing an increase in activation energy.
As the aging time increased, the activation energy of the PC exhibited no significant changes. By comparing the initial decomposition temperature and Tf, the variation in activation energy was found to vary corresponding to the thermal decomposition values. As the initial decomposition temperature increased, the thermal decomposition slowed, the activated molecules required absorbed more energy, and the corresponding activation energy increased.
PET is similar to insulation paper in that it is composed of crystalline and non-crystalline regions. During the aging process, the non-crystalline region was destroyed first. Then, the relative crystallinity of the material and the activation energy increased. As the aging time increased, the crystalline region was destroyed, and the relative crystallinity and activation energy decreased.
4.2 DSC analysis
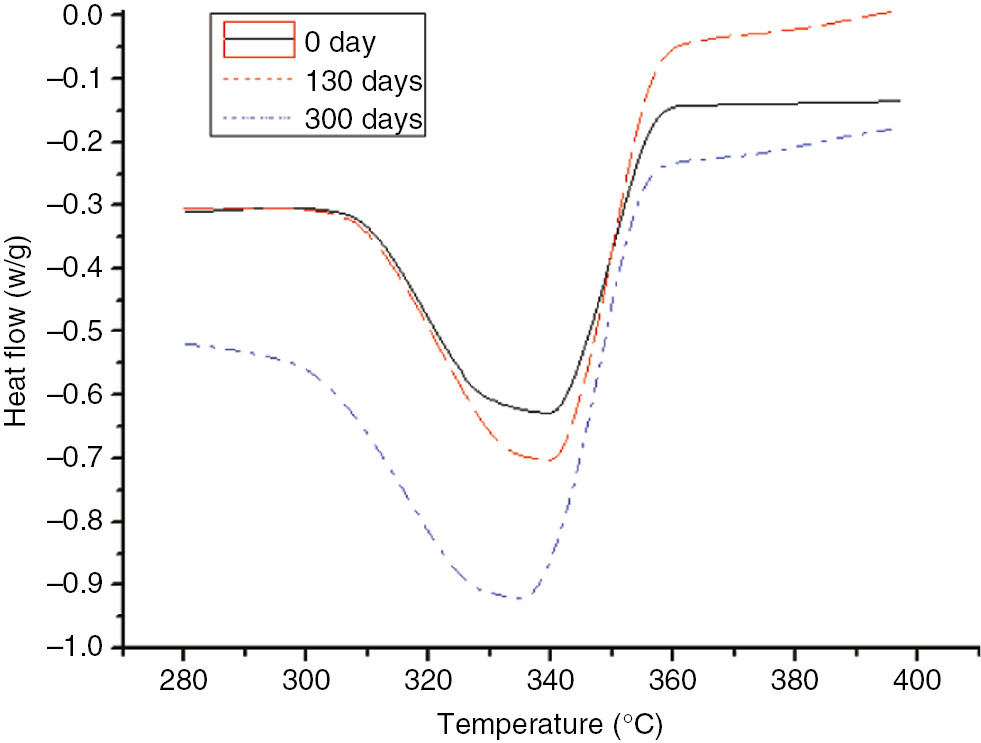
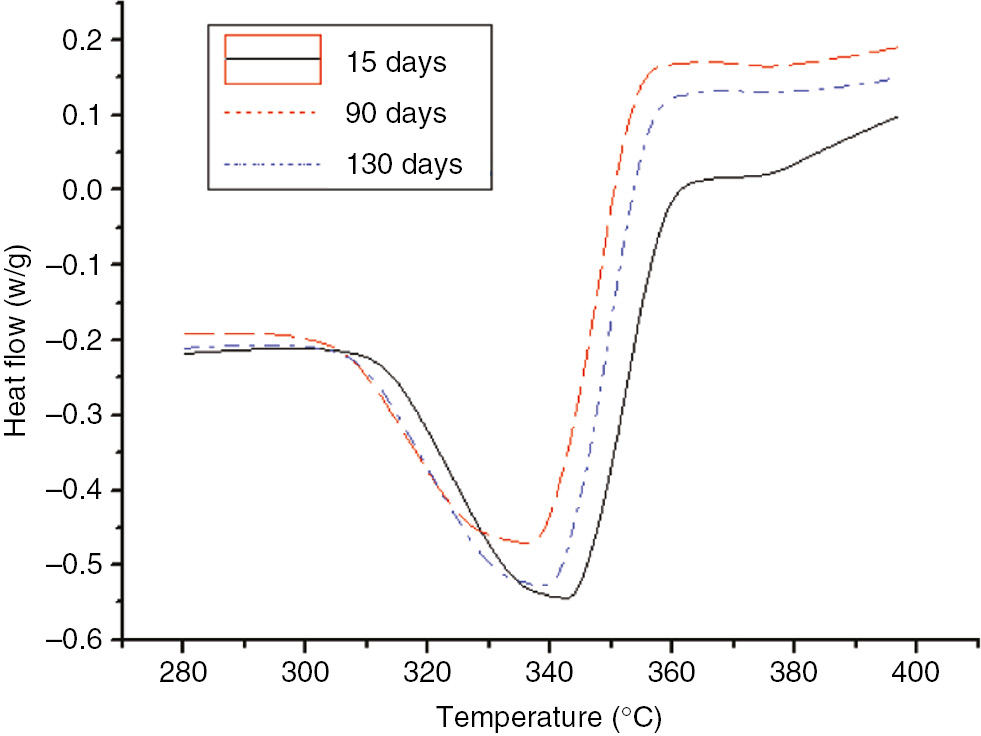
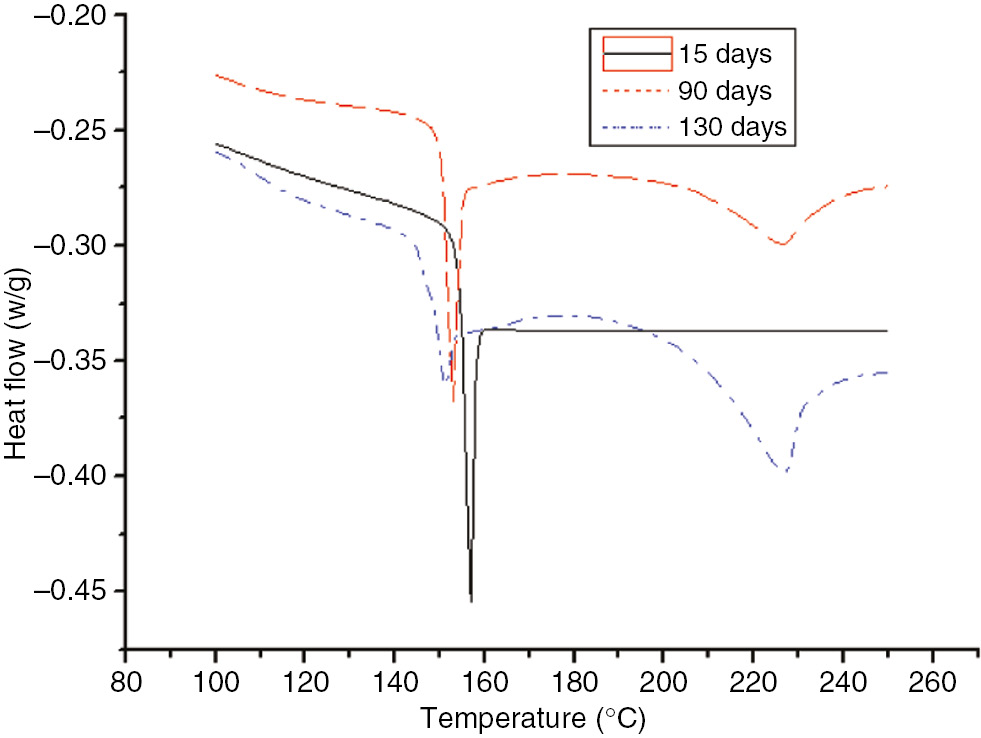
The DSC curves for the insulating paper, PC and PET at different stages of the aging process at 110°C and 130°C are shown in Figures 15–20. The endothermic peak corresponds to enthalpy, and the variations in enthalpy for the three materials are shown in Figures 21 and 22.
DSC curves of the insulation paper at different degrees of the aging process at 110°C.
DSC curves of the insulation paper at different degrees of the aging process at 130°C.
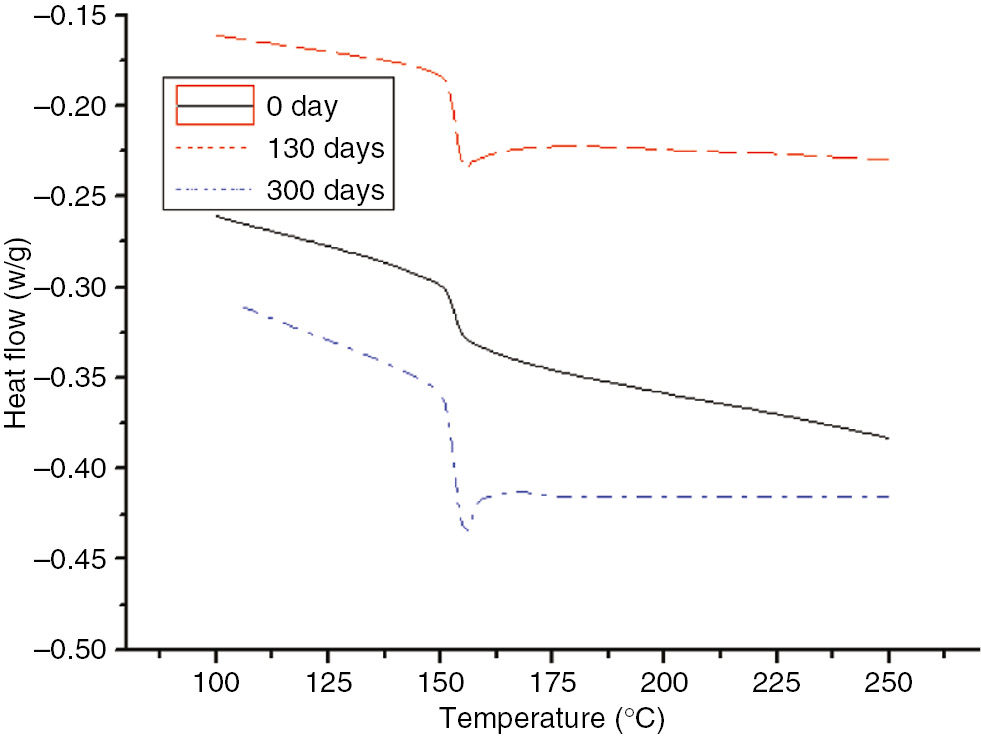
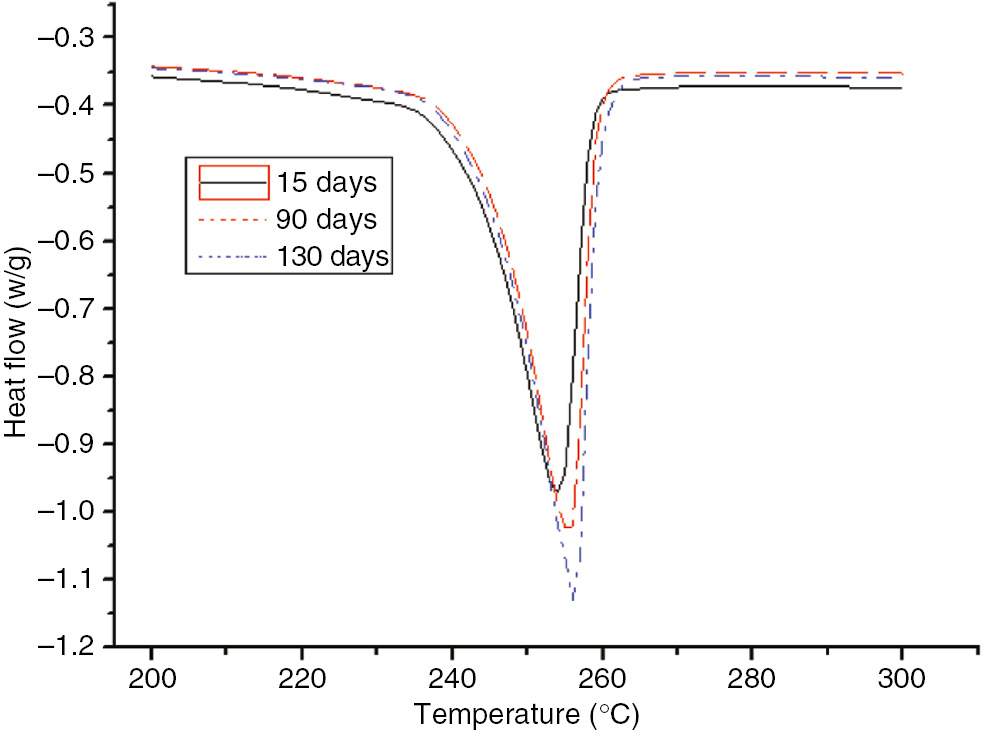
DSC curves of the PC at different degrees of the aging process at 110°C.
DSC curves of the PC at different degrees of the aging process at 130°C.
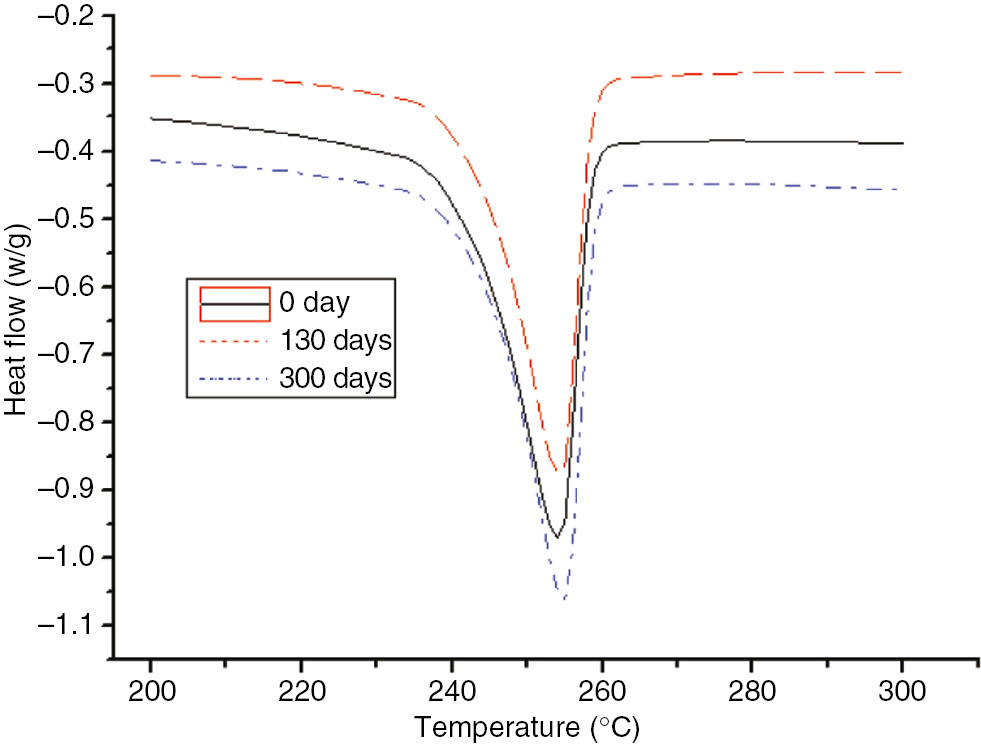
DSC curves of the PET at different degrees of the aging process at 110°C.
DSC curves of the PET at different degrees of the aging process at 130°C.
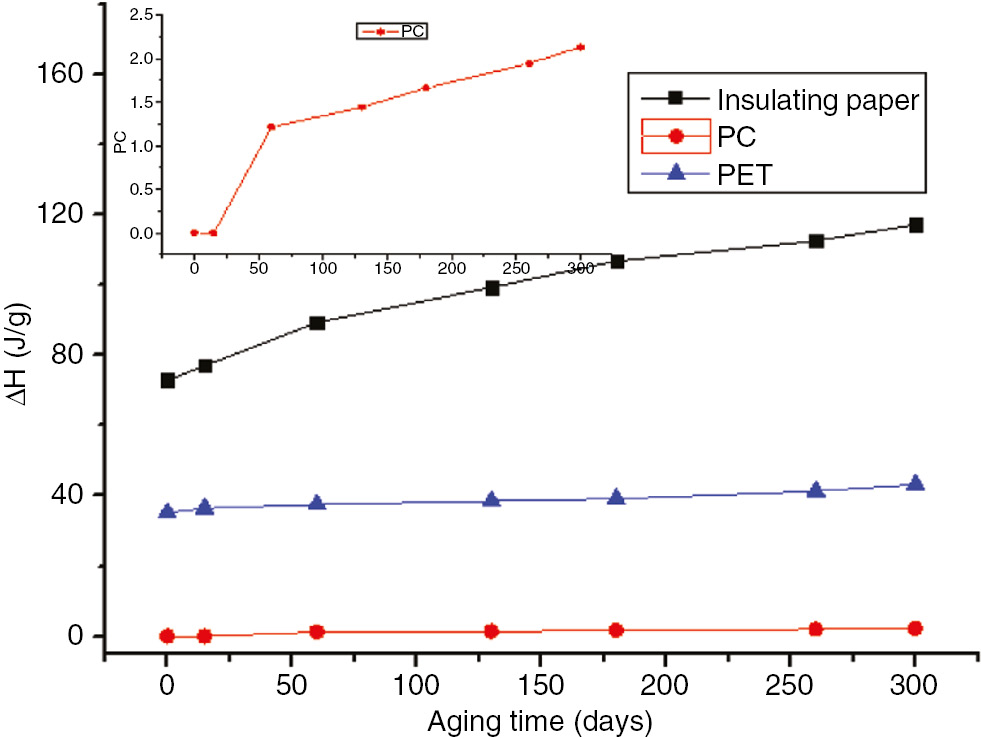
Enthalpy variation curves of the three materials at 110°C.
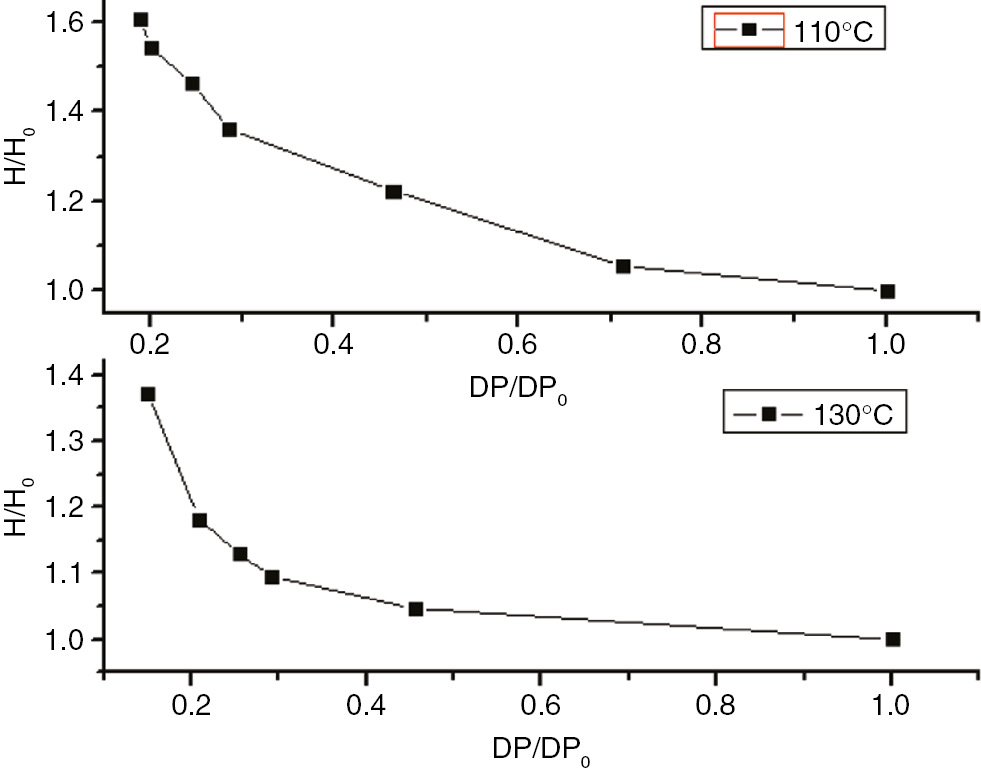
The degree of polymerization of the insulation paper and the enthalpy curve.
As shown in Figures 15 and 16, as the aging time increased, the initial heat flow temperature and the maximum heat flow temperature of the insulation paper decreased, indicating that the extent of damage coincided with the conclusions of the TGA tests.
As shown in Figures 17 and 18, without the endothermic peak, a heat flow transition temperature occurred at 150°C before the PC was fully aged. At 110°C, as the aging time increased, the endothermic peak appeared, and the appearance time increased as the time increased. The endothermic peak appeared after 15, and two endothermic peaks were apparent after 60 days. As the aging time increased, the endothermic peaks occurred later, and the height and area of one peak decreased as the area of the second endothermic peak increased. During the thermal aging process, two heat flow transition temperatures occurred in the PC curve. In addition, the heat flow gradually decreased at low lower and higher temperatures. This was due to the molding process of the PC; as the PC cooled from a higher temperature, segments started to freeze, resulting in heightened internal stress. In the accelerated aging process at high temperatures, the system’s internal stress was non-uniform. The heat flow transition of the relaxed internal stress occurred at a low temperature, while that of the un-relaxed internal stress occurred at a high temperature. If the non-uniformity caused by the internal stress relaxation was adequately large, two heat flow transition temperatures would be apparent on the DSC curve (19).
As displayed in Figures 19 and 20, as the aging time increased, the height and area of the PET peak increased. The initial and maximum heat flow temperatures did not exhibit any obvious trends as the aging time increased.
As shown in Figure 21, the enthalpy of the insulation paper and PET increased as the aging time increased, which coincided with the DSC curve (20). At 110°C, although the PC did not initially exhibit an endothermic peak, after 60 days, a small endothermic peak appeared. Thus, the PC possessed a smaller enthalpy.
Two endothermic peaks appeared during the aging process, and two enthalpy values occurred at 130°C. The enthalpy value corresponding to the first endothermic peak gradually decreased, and the enthalpy value corresponding to the second endothermic peak gradually increased. Enthalpy is the variable of a state for a given system; heat enthalpy is identified accordingly. Larger enthalpies (ΔH) indicate unstable material performance (21), and heat absorption is necessary for such a material to achieve a steady state. More severely aged insulating materials have greater corresponding enthalpies.
The enthalpy variations and degrees of polymerization of insulation paper, PC, and PET at 110°C and 130°C are shown in Figures 22–24 . These figures indicate that the relative enthalpy (ΔH/ΔH0), or enthalpy divided by the initial enthalpy value, and the degree of relative polymerization (ΔDP/ΔDP0), the degree of polymerization divided by the initial degree of polymerization ratio, of insulating paper and PET exhibited a one-to-one relationship. Therefore, the enthalpy values could be used to characterize the degree of aging for insulation paper and PET. As PC does not exhibit enthalpy values at 110°C, and exhibits two changes in enthalpy at 130°C, enthalpy cannot be used to characterize the degree of aging for PC.
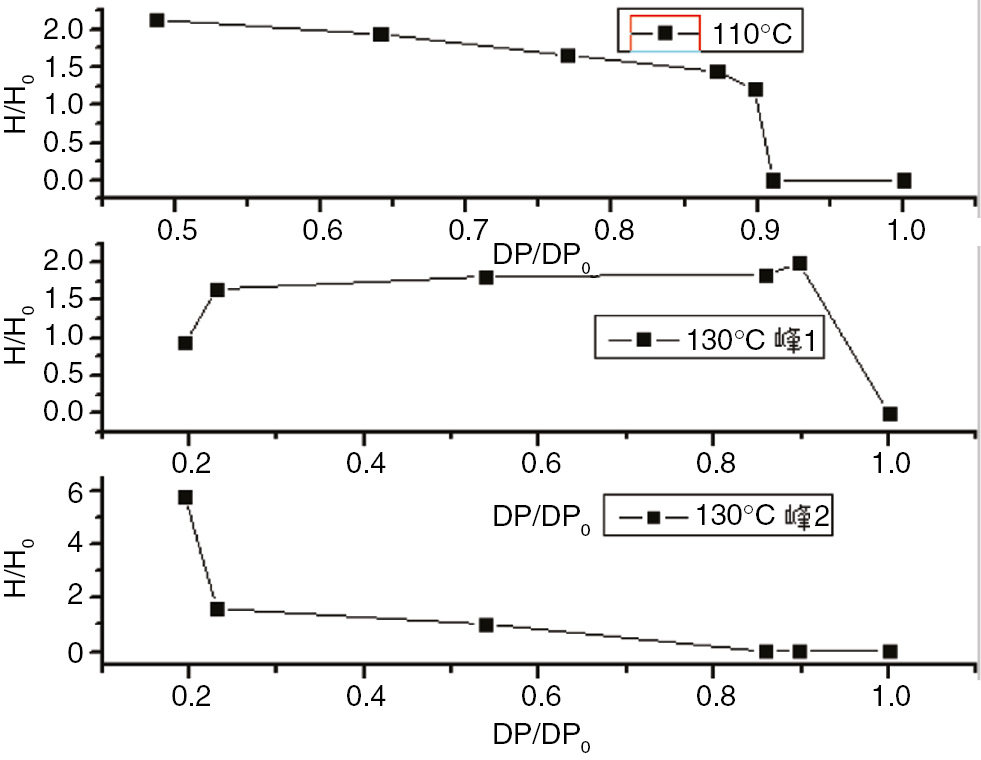
The degree of polymerization of the PC and the enthalpy curve.
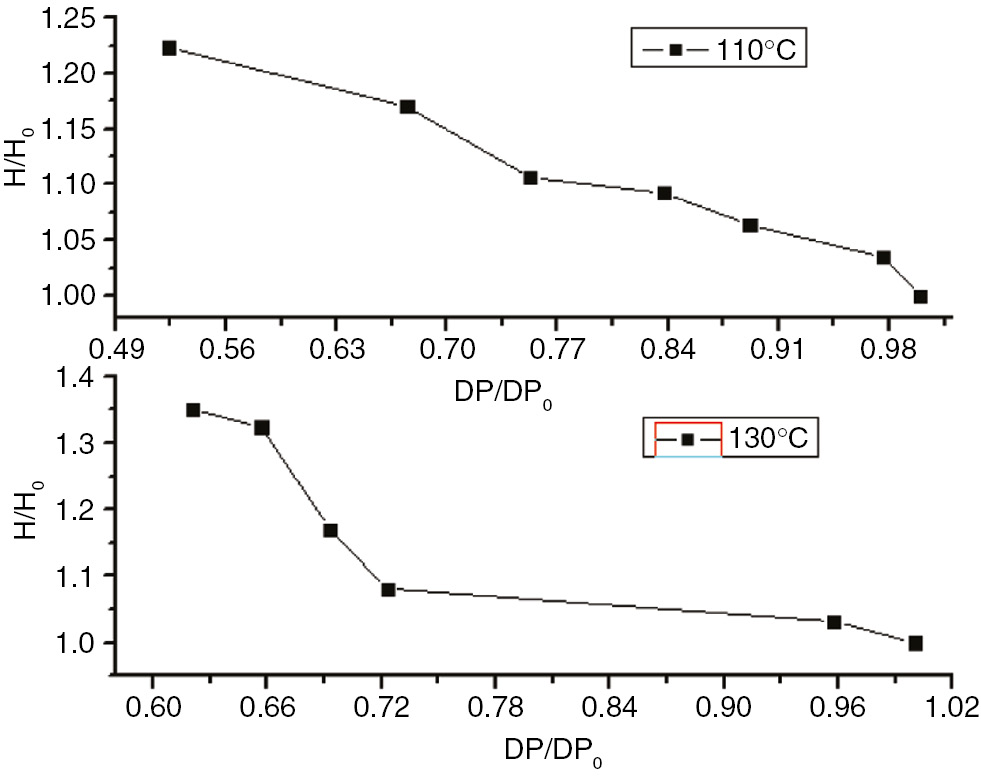
The degree of polymerization of the PET and the enthalpy curve.
4.3 AFM
The AFM 3D graphs for insulation paper, PC and PET at 110°C and 130°C are shown in Figures 25–30.
AFM three-d imensional images of the insulation paper at 110°C.
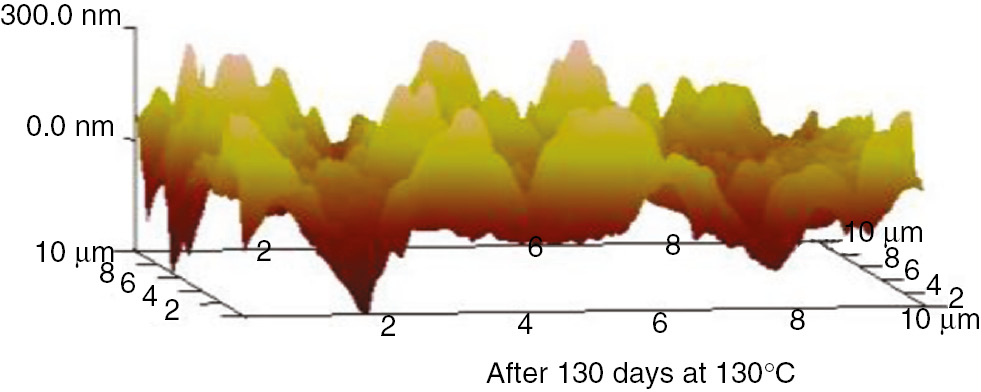
AFM three-dimensional images of the insulation paper at 130°C.
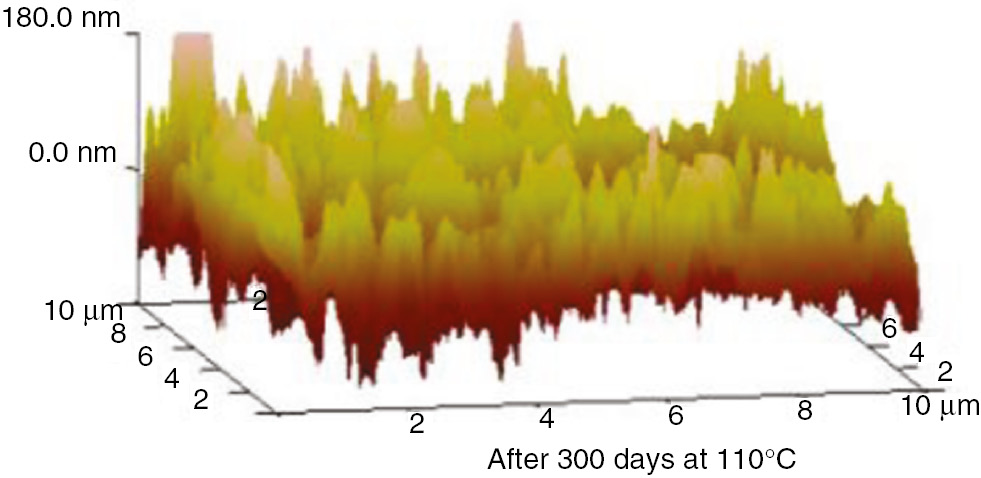
AFM three-dimensional images of the PC at 110°C.
AFM three-dimensional images of the PC at 130°C.
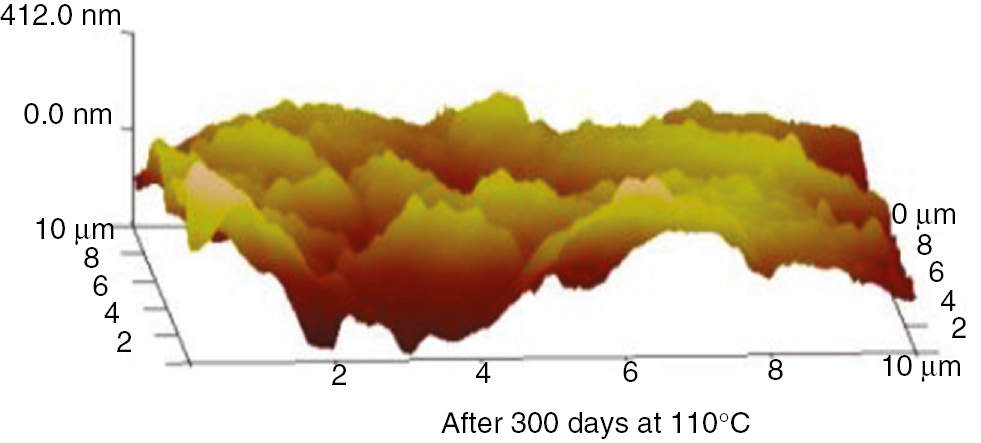
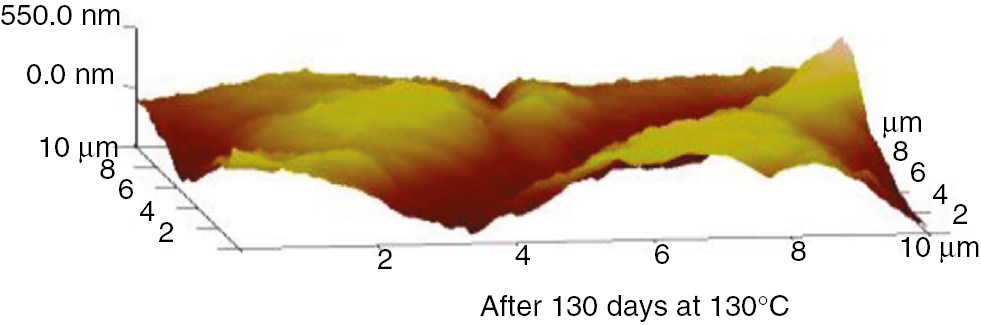
AFM three-dimensional images of the PET at 110°C.
AFM three-dimensional images of the PET at 130°C.
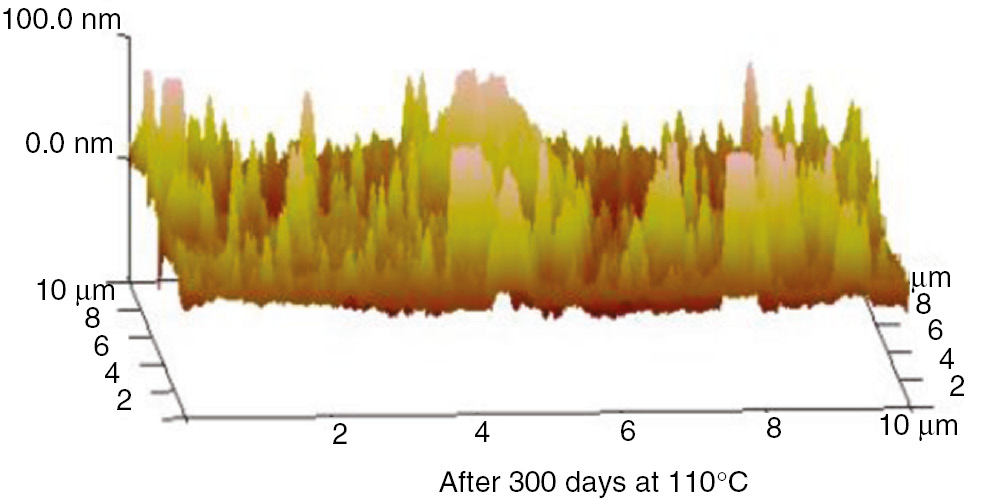
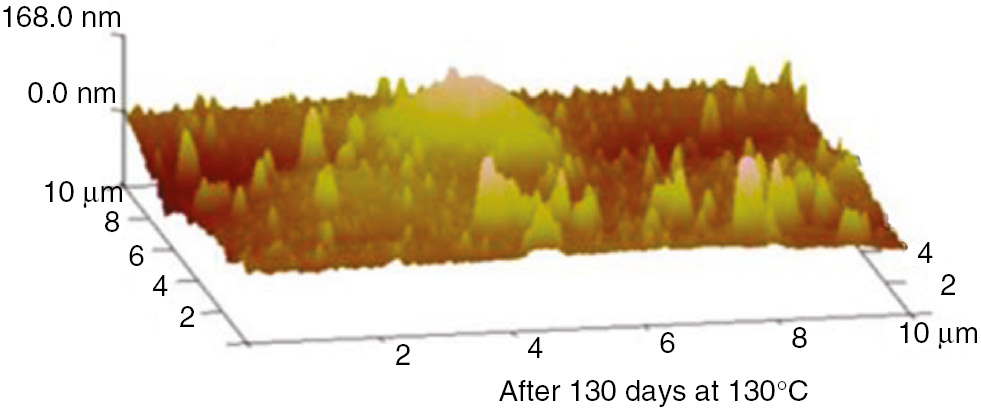
These AFM results indicate that the surfaces of the insulation materials fluctuated acutely as the aging time increased, and as the aging temperature increased, the inhomogeneity became more apparent. The initial maximum fluctuation degree of the insulation paper was much higher than that of the PC and PET. This was because the insulation paper was composed of crisscrossed cellulose; its surface was not entirely smooth. Thus, when the atomic force microscope imaging principle was used to test the insulation paper, the microcosmic surface fluctuated significantly. However, the microcosmic surfaces of PC and PET are smooth and uniform. Therefore, their degrees of fluctuation were lower. This result can be visualized in the microscopic SEM pictures. As the aging time increased, the insulating paper fibers became thin, and some cracks and holes developed on the surface. As shown in the 3D AFM images, the degree of fluctuation and the fluctuation ratio of the unit area increased. At high temperatures, the PC and PET also exhibited this phenomenon. The surface developed particles and cracks during aging, and the three-dimensional figures indicate that the degree of fluctuation was more severe than before the aging process.
The variations in surface roughness of the insulation paper, PC and PET during the aging process at 110°C and 130°C are shown in Figures 31 and 32.
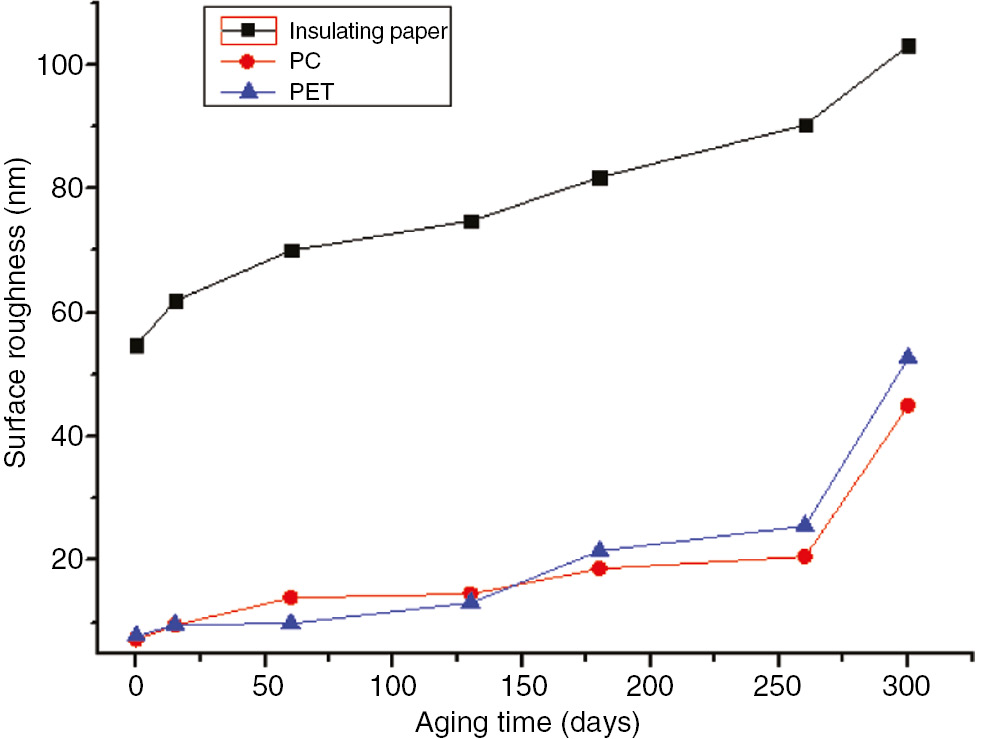
The surface roughness of the three materials with the aging time variation curve at 110°C.
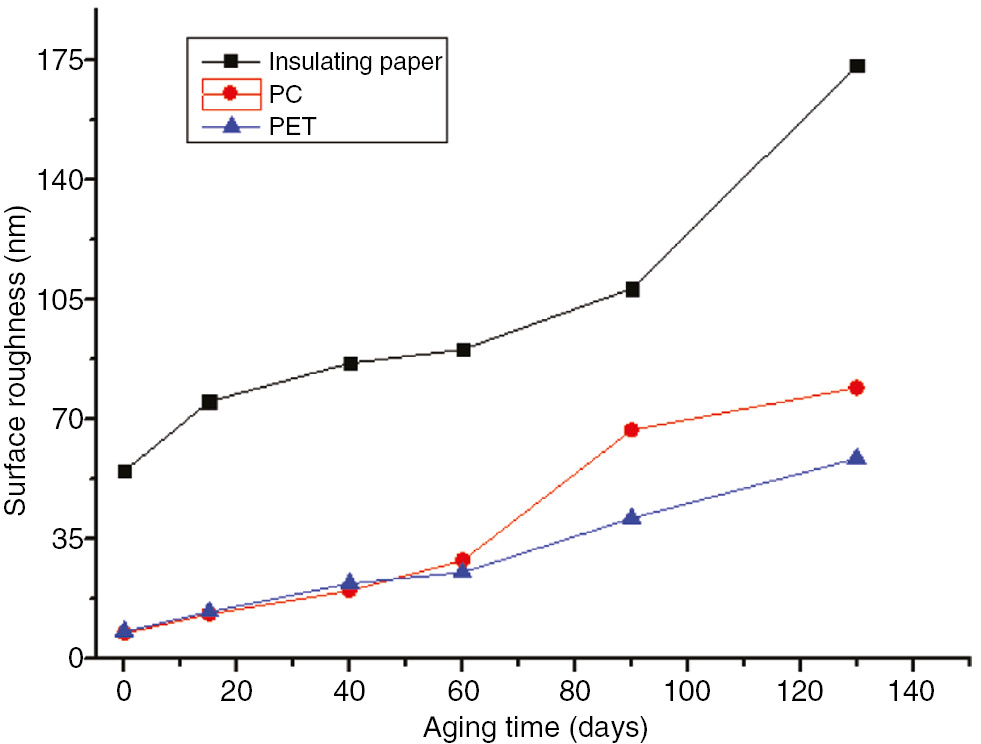
The surface roughness of the three materials with the aging time variation curve at 130°C.
As shown in Figures 31 and 32, the surface roughness of the three insulation materials increased as the aging time and temperature increased at 110°C and 130°C. After 300 days at 110°C, the surface roughness of the insulation paper increased from 54.7 to 103, by approximately 88%. The surface roughness further increased to 173 after 130 days at 130°C, by 216%. The surface roughness of the PC increased from 7.31 to 45 after 300 days at 110°C, by approximately 516%; it increased further to 79 after 130 days at 130°C, by approximately 980%. The surface roughness of the PET increased from 7.8 to 52.7 after 300 days at 110°C, by approximately 575%. It increased further after 130 days at 130°C to 58.5, by approximately 650%.
During high temperature aging, the long chains in the PC and PET broke into small molecules, and cracks began to appear on the surface of the structure. Due to its lower initial surface roughness value, the structural surface changed somewhat, but the surface roughness changed more. At 110°C and 130°C, the rate of change of the insulation paper was far less than that of the PET and PC. However, the insulation paper had a much higher surface roughness than the PC and PET, which exhibited similar values.
The surface roughness of the insulating material in a transformer has a certain impact on the oil flow electrification during operation. A greater surface roughness results in a stronger surface charge absorption ability and the accumulation of higher electrical charges as the oil flow increases. Thus, PC and PET are more advantageous in reducing the occurrence of oil flow electrification in transformers due to their low initial surface roughness values (22). In addition, as surface roughness increases, water absorption performance also increases. An increase in moisture could reduce the performance of insulation material and accelerate the aging process, resulting in a higher likelihood of the insulation materials being damaged at high temperatures. As the water inhibition of PC and PET are far less than that of insulation paper, they are less likely to age at high temperatures.
5 Conclusions
The early thermal degradation of insulation paper began in the amorphous regions. During this period, the molecular chains broke, cavities appeared on the surface, the degree of polymerization decreased, the surface roughness increased, and the enthalpy increased. However, due to the increase in relative crystallinity, the activation energy decreased. During the aging process, the crystalline regions were significantly damaged, therefore, the relative crystallinity decreased as the enthalpy decreased.
During the early aging process, the surface of the PC aged, the molecular chains broke, the degree of polymerization decreased, and the surface roughness increased. In this period, pyrolysis and hydrolysis resulted in an increased aging rate. These effects heightened as the temperature increased. At 130°C, the pyrolysis mechanism of the PC changes, and two thermal flow peaks appeared.
PET and insulation paper consist of amorphous and crystalline regions. Similar to the events that occurred during the aging process of the insulation paper, in the PET, the molecular chains broke, and the degree of polymerization and the pyrolysis mechanism decreased.
According to the test results, the initial thermal decomposition temperature of PC was the highest and exhibited a better thermal resistance. The PET performed second-best, followed by the insulation paper. However, the pyrolysis mechanism of PC changed at 130°C. As power transformer’s long-term working temperature ranges from 75°C to 85°C, the highest just reaches to 98°C and rarely reaches to 130°C. Therefore, insulation paper could be substituted with PC and PET for application in large capacity power transformer.
Funding source: National Natural Science Foundation of China
Award Identifier / Grant number: 50977025
Funding statement: This paper was supported by National Natural Science Foundation of China (50977025), and the Fundamental Research Funds for the Central Universities 2016XS07.
Acknowledgments
This paper was supported by National Natural Science Foundation of China (50977025), and the Fundamental Research Funds for the Central Universities 2016XS07.
References
1. Yiyi Z, Ruijin L, Lijun Y, Hanbo Z, Cai-xin S. An assessment method for insulation condition of power transformer based upon cloud model. Transactionsn of China Electrotechnical Society. 2012;27(5):13–20.Suche in Google Scholar
2. Paraskevas CD, Vassiliou P, Dervos CT. Temperature dependentdielectric spectroscopy in frequency domain of highvoltagetransformer oils compared to physicochemical results. IEEE Trans Dielectr Electr Insul. 2006;13(6):539–46.10.1109/TDEI.2006.1657966Suche in Google Scholar
3. Muthanna KT, Sarkar A, Das K, Waldner K. Transformerinsulation life assessment. IEEE Trans Power Del. 2006;21(1):150–6.10.1109/TPWRD.2005.855474Suche in Google Scholar
4. Zhou N, Ma J, Hu B, Miao S. Reliability tracing technique for power transformers using the fault tree analysis method. Power System Protection and Control. 2010;40(19):72–7.Suche in Google Scholar
5. Pradhan MK, Ramu TS. On the estimation of elapsed life of oil-immersed power transformers. IEEE Trans Power Del. 2005;20(3):1962–6.10.1109/TPWRD.2005.848663Suche in Google Scholar
6. Gu X. The characteristics of resisting high temperature insulation structure of liquid-immersed transformers. China Electrical Equipment Industry. 2005;19(3):43–4.Suche in Google Scholar
7. IEEEStd1276-1998. IEEE Guide for the application of high-temperature insulation materials in liquid-immersed power transformers.Suche in Google Scholar
8. Fox M. New high temperature insulation for oil-filled transformer. Electrical Insulation. 1994;22(6):567–9.10.1109/ELINSL.1994.401392Suche in Google Scholar
9. He D, Yue C, Wang W. Preliminary study on infrared spectral characteristics of polymer materials in mineral oil under electro-thermal aging. The 2012 IEEE International Symposium on Electrical Insulation. San Juan, Puerto Rico, 2012:189–92.10.1109/ELINSL.2012.6251455Suche in Google Scholar
10. Wang W, Yue CP, He DX, Yang K, Chen S. A comparative analysis of dielectric properties of oil-paper insulation and polymer materials before and after thermal aging[J]. Sci China Technol Sc. 2014;57(4):738–46.10.1007/s11431-014-5481-9Suche in Google Scholar
11. Youping T, Weizhong S, Caipeng Y. Trans. China Electrotech Soc. 2013;28(1):7–13.Suche in Google Scholar
12. Wang W, He D, Gu J, Lu J, Du J. Electrical–thermal aging characteristic research of polymer materials by infrared spectroscopy. Polym Adv Technol. 2014;25(12):1396–405.10.1002/pat.3375Suche in Google Scholar
13. Xiaoming Z, Xiongya L. Fiber-reinforced thermoplastic composite material and its application. Beijing: Chemical Industry Press, 2007.Suche in Google Scholar
14. Ming-Bo Y, Zhiyu T. Polymer materials manual [M]. Beijing: Chemical Industry Press, 2009.Suche in Google Scholar
15. Yali G. Research on power transformer aging analysis and character. Chongqing: Chongqing University, Master’s thesis, 2007.Suche in Google Scholar
16. Huanchao C. Research on power transformer oil-paper insulation thermal aging characteristics and statistic analysis. Chongqing: Chongqing University, Master’s thesis, 2006.Suche in Google Scholar
17. Huihui H. Research on transformer aging character and analysis aging mechanism. Hunan: Changsha University of Science Thesis, 2010.Suche in Google Scholar
18. Hui P. Intrinsic viscosity and degree of polymerization of polyester. Polyester Ind. 2004;17(3):5–6.Suche in Google Scholar
19. Sen C. Study on pyrolysis charaeteristic and pyrolysis kineties of biomass. Nanjing: Nanjing University of Technology, 2005.Suche in Google Scholar
20. Xiaoyu S, Xiangxu C, Mingyan WU, et al. Two heat transformation of polycarbonate physical aging. Journal of Fudan University 2000;39(3):338–42.Suche in Google Scholar
21. Wei-Bin G, Liangcheng X, Yi D. Thermo-oxidative aging on properties of polycarbonate. Plastic. 2010;39(2):61–4.Suche in Google Scholar
22. Jufen W, Haolong M. Flow electrification phenomenon in power transformer. High Volt Engin. 2008;34(5):878–82.Suche in Google Scholar
©2017 Walter de Gruyter GmbH, Berlin/Boston
This article is distributed under the terms of the Creative Commons Attribution Non-Commercial License, which permits unrestricted non-commercial use, distribution, and reproduction in any medium, provided the original work is properly cited.
Artikel in diesem Heft
- Frontmatter
- In this Issue
- Editorial
- Innovations in polymers and composite materials
- Full length articles
- Preparation and properties of chemically reduced graphene oxide/copolymer-polyamide nanocomposites
- Synthesis and properties of well-defined carbazole-containing fluorescent star polymers of different arms
- The effect of high-current pulsed electron beam modification on the surface wetting property of polyamide 6
- Synthesis and application of waterborne polyurethane fluorescent composite
- Medicated structural PVP/PEG composites fabricated using coaxial electrospinning
- Research of the thermal aging mechanism of polycarbonate and polyester film
- Damage indication of 2′, 7′-dichlorofluorescein for epoxy polymer and the effect of water on its damage indicating ability
- Synthesis and characterization of thermosensitive and polarity-sensitive fluorescent PNIPAM-coated gold nanoparticles
- Comparative study of crystallization and lamellae orientation of isotactic polypropylene by rapid heat cycle molding and conventional injection molding
- Determination of deformation of a highly oriented polymer under three-point bending using finite element analysis
- Kinetic studies on the cure reaction of hydroxyl-terminated polybutadiene based polyurethane with variable catalysts by differential scanning calorimetry
- Preparation and swelling properties of poly(acrylic acid-co-acrylamide) composite hydrogels