Preparation and properties of chemically reduced graphene oxide/copolymer-polyamide nanocomposites
-
Xin Liu
 ,
Xiao Yu Shao
,
Xiao Yu Shao

Abstract
To enhance the physical properties of copolymer-polyamide (CO-PA), a sequence of nanocomposites based upon CO-PA and chemically reduced graphene oxide (CRGO) nanoplatelets were prepared by in-situ reduction using hydrazine hydrate. Graphene oxide (GO), prepared by the improved Hummers method, was used to fabricate CRGO nanaoplatelets. Atomic-force microscopy (AFM), transmission electron microscopy (TEM), Fourier transform infrared (FTIR) spectroscopy and X-ray diffraction (XRD) analysis showed that the thickness and the width of GO was about 0.9 nm and 1 μm, respectively. An abundance of oxygen-containing functional groups were introduced onto the GO sheets. XRD and SEM analysis showed that CRGO nanoplatelets were well dispersed in the CO-PA matrix with the appropriate CRGO content. TGA and DSC analysis demonstrated that CRGO nanoplatelets can significantly improve the thermal stability, glass-transition temperature, crystallization temperature of the composites. The mechanical properties of the nanocomposites were improved significantly with the appropriate increment of CRGO nanoplatelets content, though the elongation at break of the composites decreased with the increase of CRGO nanoplatelets content. The electrical conductivity test showed a significant increase in electrical conductivity from an insulator to almost a semiconductor with increasing CRGO nanoplatelets content. And at 1.0 wt% CRGO content, the electrical percolation threshold of the nanocomposites was found.
1 Introduction
Graphene, a new carbon material, has attracted a great deal of attention and become a primary focus in the field of materials science, since it was discovered in 2004 by Geim (1) and his colleagues at Manchester University. Graphene’s unique two-dimensional structure gives it important qualities including thermal properties, abrasion resistance (2), and a large theoretical surface area (2675 m2·g-1) (3). These properties translate to broad application prospects in the areas of mechanical reinforcement, electrical conductive materials, and thermal conductive materials (4), (5), (6), (7), (8), (9). The tensile strength of graphene is 130 GPa, which is the highest intensity material as known in the world (10).
Monolayer oxide graphite (GO) is an important derivative of graphene. Substantially, it has the same structure as graphene. GO is expected to become a high-quality filler for polymer in the coming years, because of it is readily available and inexpensive. A number of researchers have studied the impacts of GO on tensile strength. Roy et al. (11) studied the interface bonding and dispersion at low loading of modified GO to fabricate super nylon 12 nanocomposites in the molecular level, which the tensile strength and Young’s modulus improved by ~54%, ~74%, respectively, at the 0.35% modified GO. The super nylon exhibited significantly high thermal stability. Liu et al. (12) studied nylon 6 nanocomposites with GO modified by benzoic acid and found that the tensile strength and Young’s modulus improved by ~30% and ~300%, respectively at the 0.1 wt% GO addition. Liang et al. (13) prepared a PVA/GO composite using the solution method. When GO was loaded at 0.7 wt%, the tensile strength and Young’s modulus of the composite materials increased by ~76% and ~62% over pure PVA, respectively.
Chen (5) prepared a GO/EPDM composite material using the solution method; the test results showed that GO can improve the damping performance and thermal stability of the composite material. In GO, the infinite two-dimensional space of the one carbon atoms connects with a large number of oxygen-containing functional groups, such as -OH and C-O-C contained on the plane, and, at its edges, the sheet containing -COOH (14). These functional groups give GO new features, such as dispersion, hydrophilicity, and preferable compatibility with some polymers. However, these functional groups make the π bond break and lose the unique properties for graphene including electrical conductivity and thermal conductivity. Through chemical reduction, the functional groups in the surface of GO were reduced and the broken conjugate structure was recovered, which offered the reduced GO high electrical conductivity and excellent thermal conductivity. However, the graphene nanoplatelets obtained through the chemical reduction method still had a small amount of carboxyl, epoxy and hydroxyl retained on their surface, and these oxygen-containing functional groups resulted in graphene nanoplatelets having better compatibility with polymers and improved its dispersion in polar materials.
At present, the most widely used method to reduce GO is using hydrazine hydrate to prepare graphene nanoplatelets. This method results in good quality graphene nanoplatelets with electrical conductivity up to 2420 S/m – the electrical conductivity of GO is only about 0.02 S/m (15). The reduction degree of graphene nanoplatelets is higher when the reduction is carried out in organic solvent (such as DMF, NMP) with hydrazine hydrate, this can result in conductivity up to 16,000 S/m (16).
As a nanofiller, graphene has a great effect on the properties of composites. For example, Rafiq et al. (17) and Jin et al. (18) used the melt extrusion method to prepare functionalized graphene/nylon 12 and nylon 11 composite material, respectively. Test results showed that a small amount of functionalized graphene can enhance the tensile strength, elongation at break, and the impact strength of the nylon. Al-Jabareen (19) studied the effects of photon emission tomography (PET) barrier properties when graphene was added in PET, and found the ideal to be when graphene content was 1.5 wt%, the oxygen permeability was reduced by 99%. The increased oxygen barrier properties were mainly due to the addition of graphene sheets and the reduced crystallization of the composite.
CO-PA is composed of nylon 6, nylon 66 and nylon 1010 by copolymerization. CO-PA has better processing performance compared with nylon 6, nylon 66, etc. In the practical application, using CO-PA can save a lot of time and energy because of its low processing temperature and sample operation. So in recent years, CO-PA has received worldwide attention. CO-PA has many excellent properties such as antistatic behavior, oil resistivity, drug resistance, bonding properties and so on. Therefore, it has been widely used in footwear, clothing, electronics, telecommunications, automobile, machinery and other industries.
However, CO-PA is an insulating material, and the improvement of the thermal, water resistance, mechanical, and electric properties is an urgent issue to be tackled. In this study, we prepared CRGO/CO-PA nanocomposites using the in-situ reduction and solution mixing method. This method very effectively dispersed graphene in the CO-PA matrix and the composites exhibited excellent properties.
2 Experiment
2.1 Materials
Natural graphite [NG, SP-2(C>99%, D=5 μm)] was purchased from Tianjin Dengke Reagent Company, China; KMnO4 (C.P.) was purchased from Tianjin Ruijinte Reagent Company, China; copolymer-polyamide (PSGN150, containing nylon 6, nylon 66 and nylon 1010; with a mass ratio of 7:2:1) was purchased from Shanghai Xinhao Chemical Company, China; NaNO3 (C.P.) was purchased from Tianjin Damao Reagent Factory, China; H2SO4 (>98%), hydrochloric acid and N,N-dimethylformamide (DMF) were purchased from Tianjin Kemiou Reagent Company, China; hydrazine hydrate (80 wt%) was purchased from Tianjin Dengke Reagent Company, China; hydrogen peroxide (30 wt%) was purchased from Tianjin Dingshengxin Chemical Company, China. GO was prepared by the improved hummers method (20).
2.2 Synthesis of GO
In this study, GO was synthesized from NG by graphite oxidation with KMnO4 in concentrated H2SO4, using the following steps: NG (5 g) and NaNO3 (3 g) were loaded into a glass beaker (1000 ml) in an ice water bath. The concentrated H2SO4 (120 ml) and KMnO4 (22.5 g) were loaded into the glass beaker at room temperature for ~2 h. Meanwhile, the solution was stirred constantly and KMnO4 was added slowly over half an hour. Then the diluted H2SO4 was added drop by drop until the mixture was stable. Later, the rest of diluted H2SO4 (a total of 700 ml) was loaded slowly and the mixture was stirred at 98°C for ~2 h. H2O2 (30 wt%, 15 ml) was added into the mixture at 60°C after 2 h. The end product was washed with hydrochloric acid (5 wt%) and distilled water twice; and the GO was centrifuged with a high speed centrifuge until it neutralized. Finally the GO was dried in a vacuum environment at 60°C until it reached a stable weight.
2.3 Synthesis of graphene nanoplatelets
GO (0.3 g) was dispersed uniformly in DMF (200 ml) in a beaker using ultrasonic treatment (power, 99 W; Shanghai Zhi Sun Instrument Corporation, China), and a GO/DMF dispersion was obtained. The GO/DMF dispersion was heated to 130°C using an oil bath, then hydrazine hydrate (0.3 g) was added into the dispersion at 130°C and the mixture was stirred constantly for ~1 h. Lastly the dispersion was filtered and dried and the product was assigned as CRGO nanoplatelets. The preparation process of CRGO nanoplatelets is shown in Figure 1.
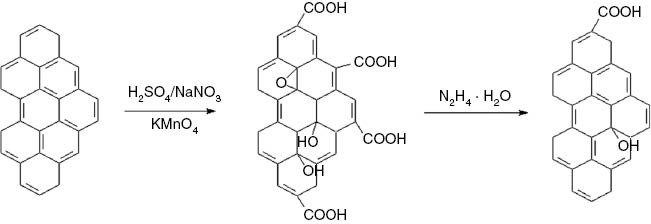
Schematic diagram of the preparation process of CRGO.
2.4 Fabrication of CRGO/CO-PA nanocomposites
Individually, specific amounts of GO (0 g, 0.1 g, 0.2 g, 0.3 g, 0.4 g, 0.8 g, 1.20 g) were dispersed in DMF (200 ml) in a beaker (250 ml), and all of the mixtures received an ultrasonic treatment (power, 99 W; Shanghai Zhi Sun Instrument Corporation, China) for ~2 h. Then, CO-PA (8.0 g) was added into each dispersion, and each mixture was stirred and heated to ~130°C in an oil bath. When the CO-PA was dissolved completely and the GO was dispersed uniformly in the CO-PA matrix, an amount of hydrazine hydrate equal to the starting amount of the GO was added into the mixture and the mixture was continuously stirred at 130°C for 1 h. Finally, the mixture was poured into a culture dish and dried in a vacuum environment at 60°C until its weight stabilized, and the CRGO/CO-PA master batch with different levels of the CRGO nanoplatelets was obtained.
The CRGO/CO-PA master batch containing different content levels of CRGO (0 wt%, 0.25 wt%, 0.50 wt%, 0.75 wt%, 1.00 wt%, 2.00 wt% and 3.00 wt%) and CO-PA (32 g) were mixed by melt-blending using a torque rheometer (XSS-300, Shanghai KeChuang Rubber Plastic Mechanical Equipment Co. Ltd, China). The blending condition was: 180°C temperature, 60 r/min rotor speed, 8 min blending time. Then the CRGO/CO-PA blends were preheated for 10 min and molded on a platen press at 180°C and 10 MPa for 5 min. After that, the blends were cooled under the press of 5 MPa at room temperature for 10 min. The proportion of experiment recipes is shown in Table 1.
Experiment recipes.
| CRGO/CO-PA (wt%) | CRGO (g) | Masterbatch (CRGO/CO-PA) (g) | CO-PA (g) |
|---|---|---|---|
| 0 wt% | 0 | 0/8.00 | 32.00 |
| 0.25 wt% | 0.10 | 0.10/8.00 | 32.00 |
| 0.50 wt% | 0.20 | 0.20/8.00 | 32.00 |
| 0.75 wt% | 0.30 | 0.30/8.00 | 32.00 |
| 1.00 wt% | 0.40 | 0.40/8.00 | 32.00 |
| 2.00 wt% | 0.80 | 0.80/8.00 | 32.00 |
| 3.00 wt% | 1.20 | 1.20/8.00 | 32.00 |
2.5 Characterization
2.5.1 X-ray diffraction (XRD)
These tests were carried out on a D/Max2500PC (Rigaku Co. Ltd, Japan) Diffractometer (40 kV, 30 mA, Cu kα, λ=0.154 nm) at room temperature. The goniometer scanned diffracted X-rays in the range 2θ=3°–30°. The NG, GO and CRGO samples were in a fine powder form, while CO-PA and CRGO/CO-PA composites samples were hot-compressed specimens.
2.5.2 Fourier transform infrared (FTIR) spectroscopy
The structure and functional groups of NG, GO and CRGO nanoplatelets were characterized on a Nicolet 380 spectroscopy (Shanghai Thermo Fisher Scientific, China). The powder specimens (1~2 mg) were dispersed into KBr powder (dried at 100°C for 30 min, 200 mg) by grinding, and then compressed to form disks (10 MPa). The spectra were collected from 400~4000 cm-1.
2.5.3 Atomic force microscopy (AFM)
The AFM technique was used to characterize the topography of the GO. AFM observation was carried out in tapping mode on a Nano Scope III A (Veeco Company, USA). The suspension of GO with a concentration of 0.01 mg·ml-1 was prepared by dispersing GO powder in DMF. The sample was prepared by spin-coated on a mica substrate (rotation speed 2000 rpm-1) and dried under vacuum conditions at 80°C.
2.5.4 Transmission electron microscope (TEM)
TEM observation was used to observe the microstructure and the dispersion of GO in the solution. GO was dispersed in DMF to form the solution of 0.01 mg·ml-1, dropped on a copper grid and dried at 60°C for 1 h. The observation was performed on a JEM-2100 (Japan Electron Optics Laboratory Co. Ltd) transmission electron microscope, operating at an accelerating voltage of 200 kV.
2.5.5 Scanning electron microscope (SEM)
The microscopic images and structure of GO, CRGO nanoplatelets and the dispersion of CRGO nanoplatelets in the CO-PA matrix were collected using electron probe microanalysis (JXA-8230, Japan Electron Optics Laboratory Co. Ltd).
2.5.6 Thermogravimetric analysis (TGA)
The thermal stability of CRGO/CO-PA nanaocomposites was investigated using a TGA (1600LF, Shanghai Mettler Toledo Co. Ltd, China). CRGO/CO-PA specimens were heated from 50°C to 600°C at a heating rate of 10°C/min-1 under a nitrogen atmosphere.
2.5.7 Different scanning calorimetric analysis (DSC)
The thermal properties and crystallization behaviors of the CRGO/CO-PA nanocomposites were analyzed by a DSC analyzer (1600LF, Shanghai Mettler Toledo Co. Ltd, China) under an N2 environment. The samples (10~20 mg) were heated from room temperature to 200°C at a heating rate of 20°C/min-1 and kept at 200°C for 3 min, and then cooled to -20°C at a rate of 10°C/min-1, and kept at -20°C for 5 min. Finally the samples were heated to 200°C at a heating rate of 10°C/min-1.
2.5.8 Polarizing microscope (POM)
The crystallization morphology and microstructure of CRGO/CO-PA nanocomposites were analyzed using a polarizing microscope (XSZ-N107, Changchun Kexin Experiment Equipment Co. Ltd, China). CRGO/CO-PA nanocomposites containing various CRGO nanoplatelets contents (0, 0.5 wt%) were melted and pressed in cover slips, then placed in a drying oven to crystallize at 100°C for 12 h of observation.
2.5.9 Measurement of mechanical properties
The test of mechanical properties was conducted at room temperature on a universal testing machine (AI-7000M, Dongguan Gaotie Testing Instrument Co. Ltd, China). The tensile strength test was performed by stretching the dumbbell-shaped specimens to the breaking point at a cross-head rate of 50 mm/min-1 according to China Standard GB/T1040-92. The tensile strength, elongation at break, and yield strength were tested with the average of five specimens taken as the final value.
2.5.10 Electrical conductivity
The electrical conductivity of CRGO/CO-PA nanocomposites was tested using an electrochemical workstation (PC40B, Shanghai An Biao Electronics Co. Ltd, China) at room temperature. Then, the electrical conductivity was calculated. The resistivity test standard of the plastic material was interpreted according to GB/T 1410-89 (volume resistivity calculation formula: ρv=RvA/h; conductivity calculation formula: 1/ρv=L/RvS. ρv, volume resistivity, Ω·cm; Rv, the measured sample volume resistance, Ω; A, the effective area of electrode, m2; h, the average thickness of samples, m).
3 Results and discussion
3.1 Structure and morphology of fillers and nanocomposites
The microtopography of GO was observed using TEM. As shown in Figure 2, the layered structures of the GO flakes were exfoliated, a single layer was observed and the length of the GO flakes was larger than 1 μm. The stacked, curly platelets of the GO were dispersed well in DMF. The wrinkled or fold morphology can be observed in some areas, which steadily reduces the surface energy to make GO exist (21).
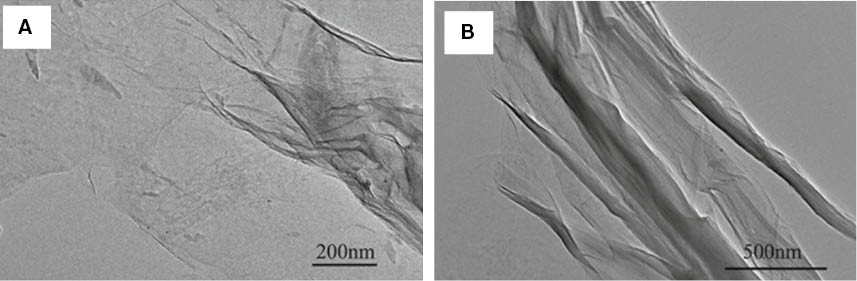
TEM images of GO dispersed in DMF (A) magnified 40,000 times and (B) magnified 25,000 times.
For the purpose of showing the size of GO sheets and estimating the aspect ratio, AFM images of GO were obtained as shown in Figure 3. In Figure 3A, GO sheets have been exfoliated with cross-section cross-measurements indicating a sheet width, length, and thickness of ~500 nm, ~1000 nm, ~0.9 nm, respectively. There were a lot of oxygen-containing functional groups in the surface of GO and the GO sheets had a tendency to fold in order to prevent stacking and reduction. The large special surface area remained when the folded GO sheets were dried for constant weight. These were all indicators that NG was oxidized and exfoliated by ultra-sonication to achieve the GO sheets.
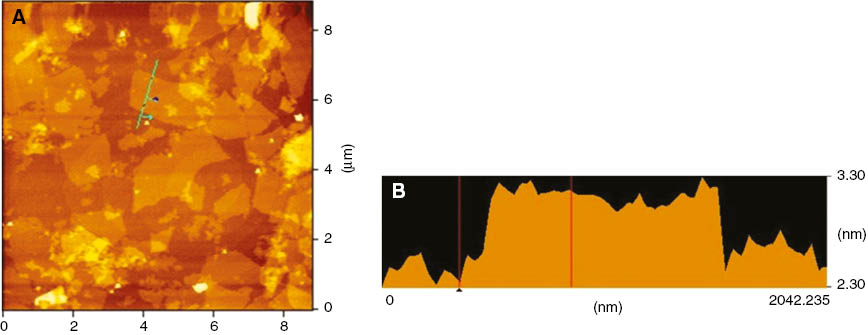
(A) AFM image of GO sheets (B) AFM image of the outline of the thickness of GO sheet.
The diffractograms of the NG, GO, GRGO nanoplatelets and the dispersion of the CRGO nanoplatelets in the CO-PA were investigated using XRD with results shown in Figure 4A and B. In Figure 4A, the original NG shows a diffraction peak at 2θ=26.4°, which corresponds to d-spacing of 0.336 nm, which is the representative interlayer spacing of stacked graphene sheets in graphite; this shows that the original graphite flakes had well-ordered structures. Upon oxidation with concentrated H2SO4, NaNO3, KMnO4, the peak at 2θ=26.4° disappeared and the GO sheets had a broad peak at about 2θ=10.7°. This peak corresponded to the X-ray reflection from the planes and indicated that the interlayer spacing had expanded to 0.83 nm through accommodating various oxygen-containing functional groups on the graphene (22). At the same time, the diffractogram of CRGO nanoplatelets was smoother than those of NG and GO. There was a small diffraction peak of about 22.5° and the interlayer spacing of CRGO nanoplatelets was 0.396 nm through the Bragg equation calculation, which was larger than NG. The diffraction peak of CRGO nanoplatelets at <3° was clearly visible, and the interlayer spacing of CRGO nanoplatelets for this part was larger than NG and GO (23), (24). This is because of a reduction in the size of the graphite layers, a decrease in the integrity of crystal structure, and an increase in the degree of disorder after GO reduction. This suggested that the layer spacing of reduced GO nanoplatelets was larger than natural graphite, but it was smaller than GO as a result of the oxygen containing functional groups decreasing.
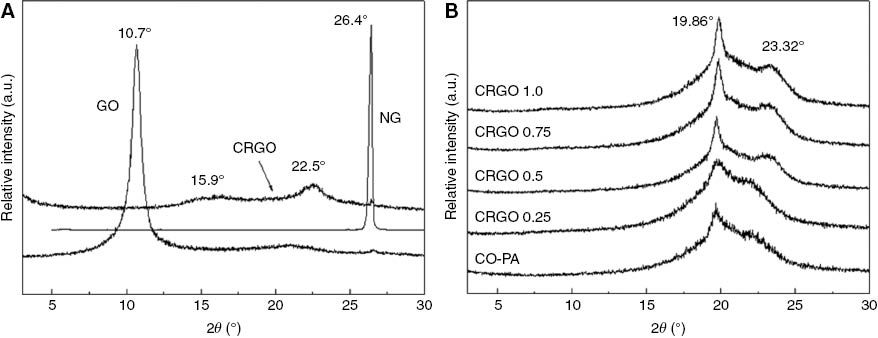
XRD images of (A) NG, GO and CRGO and (B) CRGO/PA composites with different addition of CRGO.
The diffractograms of CRGO/CO-PA nanocomposites containing various CRGO nanoplatelets contents are shown in Figure 4B. The pure CO-PA matrix showed a very strong broad peak at about 2θ=19.86° and the peak at about 22° was not obvious. The diffraction peak of nanocomposites at 2θ=19.86° became sharp and the intensity at 2θ=22° increased with the addition of CRGO nanoplatelets increasing, and the peak shifted toward 23.32°. This implied that CRGO nanoplatelets served as nucleating sites present in the CO-PA matrix and promoted the crystallization of the CRGO/CO-PA nanocomposite. The peak at 22.5° and 3° did not appear in the CRGO/CO-PA nanocomposites XRD diffractograms. This demonstrated that CRGO nanoplatelets dispersed very well in the CO-PA matrix.
Figure 5 shows the FTIR spectra of NG, GO and CRGO nanoplatelets fillers. As shown in Figure 5, the FTIR spectra were smooth and absorbance peaks were not detected for NG. For GO, the broad and strong absorption band centered at 3000 cm-1~3700 cm-1 was attributed to the hydroxyl (-OH). This is for two reasons, sample absorption of moisture and carboxylic acid (-COOH) containing -OH. The peak at 1627 cm-1 is referred to as the C=C stretching vibration. The peaks at 1724 cm-1, 1399 cm-1, 1070 cm-1 responded to the stretching vibrations of C=O in the carboxylic acid groups, carboxylic acid (-COOH) groups, and alkoxy groups (C-O), respectively. The results indicated that NG was oxidized and these functional groups were attached to the surface of GO. Compared with GO, the absorption peak at 3467 cm-1 was low and narrow for CRGO nanoplatelets. This is due to the fact that a small amount of residual -OH in the surface of CRGO nanoplatelets was not reduced and samples absorbed moisture. The C=O and C-O stretching vibrations at 1724 cm-1 and 1399 cm-1, respectively, disappeared. This indicated that the carboxyl and carbonyl groups were reduced completely through hydrazine hydrate reduction. The peaks at 1630 cm-1 weakened significantly, which suggested that the bulk of the oxygen containing functional groups were reduced. Though the content of the oxygen containing functional groups can only be analyzed qualitatively and the specific content cannot be calculated accurately, it still demonstrated that GO was reduced to some degree.
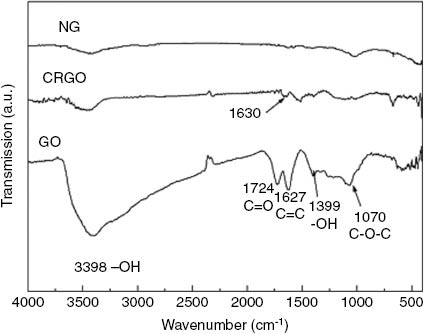
FT-IR spectra of NG, GO and CRGO.
The structural and morphological characterization of GO and CRGO nanoplatelets are shown in Figure 6. As shown in Figure 6, the structure of CRGO nanoplatelets was much looser than GO and the single layer structure of CRGO nanoplatelets was clearly visible. The sheet structure for CRGO nanoplatelets was more wrinkled than GO. This is primarily due to the fact that the oxygen containing functional groups on the surface of GO were removed in the process of ultrasonic treatment and reduction, and the strong van der Waals force made the lamella structure of the CRGO nanoplatelets become curlier and more wrinkled, which led to easy agglomeration.
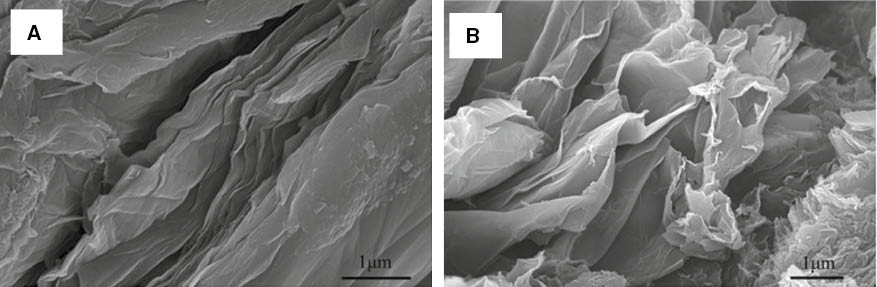
SEM images of GO (A) and CRGO (B).
In order to further examine the CRGO nanoplatelets dispersion in the CO-PA matrix and the microstructure of CRGO/CO-PA nanocomposites, CRGO/CO-PA nanocomposites were analyzed by SEM (25). As shown in Figure 7A, the cross-section of pure CO-PA was uniform in addition to the stress mark. Figure 7B shows the cross-section of CRGO/CO-PA nanocomposites containing the CRGO nanoplatelets content (0.25 wt%). In the image, the CRGO nanoplatelets sheets can be dispersed in CO-PA matrix uniformly and easily observed in comparison to pure CO-PA. The CRGO nanoplatelets were tightly combined with the CO-PA substrate and the reunion phenomenon did not appear obvious. This is because the CRGO nanoplatelets has a larger specific surface area, and, the strong interface interaction and the hydrogen bonding interaction took place between a small amount of oxygen containing functional group and the amide bond in the molecular chain of the nylon.
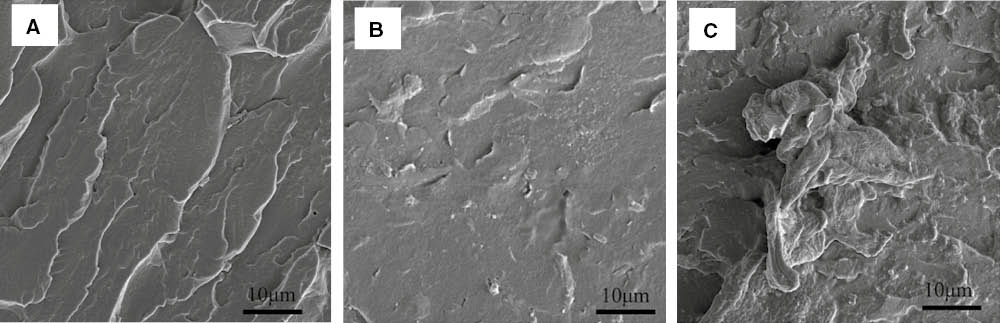
SEM image of the section of (A) CO-PA (B) 0.25 wt% CRGO/CO-PA and (C) 1.0 wt% CRGO/CO-PA composites 5000 times.
Figure 7C shows the cross-section of CRGO/CO-PA nanocomposites containing CRGO nanoplatelets content (1.0 wt%). It can be seen in the image, that the cross-section of composites was much rougher compared with the pure nylon and the CO-PA nanocomposites containing the CRGO nanoplatelets content (0.25 wt%), and the whole CRGO nanoplatelets lamella can be observed clearly. Agglomeration and the interface binding force between CRGO and nylon matrix weakened leading to stress concentration. The mechanical properties of the nanocomposites declined.
3.2 Thermogravimetric analysis (TGA)
Graphene has been applied widely to different materials as a filler to improve the thermal stability of the polymer matrix. In this study, TGA was used to research the thermal degradation of the CO-PA nanocomposites. The detailed experimental results are shown in Table 2 and Figure 8. As shown in Figure 8A and Table 2, the thermal degradation temperature of pure CO-PA and CRGO/CO-PA nanocomposites is between 400°C and 500°C. The thermal decomposition curves of CRGO/CO-PA nanocomposites shifted towards higher temperatures, compared to the pure CO-PA matrix with increasing CRGO content. The 50% weight loss temperatures (T-50%) of pure CO-PA was 437.8°C, while at 0.5 wt%, 1.0 wt%, 2.0 wt% CRGO content, it increased to 442.3°C, 446.2°C and 450.6°C, respectively. Compared to pure CO-PA, the T-50% of CRGO/CO-PA composites was increased by 12.8°C at the extreme.
TG and DTG analysis of CRGO/CO-PA composites.
| Samples | T-50% (°C) | Td,max (°C) |
|---|---|---|
| CO-PA | 437.8 | 442 |
| 0.5 wt% CRGO/CO-PA | 442.3 | 445 |
| 1.0 wt% CRGO/CO-PA | 446.2 | 451 |
| 2.0 wt% CRGO/CO-PA | 450.6 | 454 |
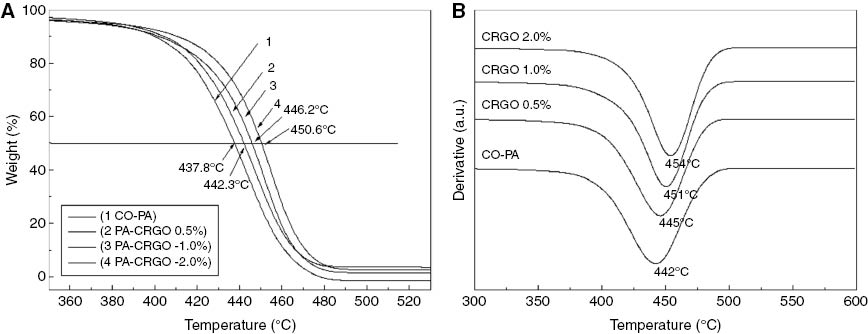
(A) TG and (B) DTG analysis of CRGO/CO-PA composites with different additions of CRGO.
Figure 8B and Table 2 show that the weight loss peak velocity of the composites (Td,max) also shifted towards higher temperatures with increasing CRGO content, and the Td,max=454°C of composites was increased by 12°C at the 2.0 wt% CRGO nanoplatelets content compared to pure CO-PA.
This suggests that CRGO nanoplatelets can improve the thermal stability of the CRGO/CO-PA nanocomposites as well as T-50% and Td,max. This is mainly due to the fact that CRGO nanoplatelets have excellent thermal stability and can be dispersed uniformly in the nylon matrix. At the same time, the strong interaction between the molecular chains of the nylon hindered the movement of the molecular chains (26). As a two-dimension lamellar structure the graphene has excellent heat conducting properties, which can form a barrier to block the degradation products of composites substrate permeating into the composites, thus delaying the degradation process.
3.3 Crystallization properties of CRGO/CO-PA nanocomposites
Figure 9 shows the DSC thermograms of the CRGO/CO-PA nanocomposites. Figure 9A is the temperature-rise period curve and B is the temperature-fall period. As shown in Table 3, the glass transition temperature (Tg) of pure CO-PA was 26.10°C. When the CRGO nanoplatelets content was 0.5 wt%, 1.0 wt%, 2.0 wt%, the Tg of composites was 27°C, 26.5°C and 28.10°C, respectively. This suggests that the Tg of the composites increased with the increment of the CRGO nanoplatelets content. This is because the strong interfacial interaction between the molecular chains of nylon and CRGO nanoplatelets restricted the movement of the molecular chain. Therefore, it was necessary to absorb more heat to create nylon chain movement; this led to Tg moving towards higher temperatures. For pure CO-PA, it shows the cold crystallization peak at 72°C, while the peak did not appear for CRGO/CO-PA composites. This indicates that crystallization of the composites was completed in the process of cooling, which is due to the fact that the nylon chain was unfrozen and then continued to crystallize when the temperature was above Tg. But, the CRGO nanoplatelets filler in the nanocomposites hindered the movement of the molecular chain, so there was no cold crystallization phenomenon. In Figure 9A and Table 3, the composites with various CRGO nanoplatelets content at 0, 0.5 wt%, 1.0 wt%, 2.0 wt% showed the melting peak (Tm) at 152.7°C, 153.4°C, 153.7°C and 153.6°C, respectively, and the tendency moved towards higher temperatures. This attributed to α (monoclinic system) crystalline structure of the nylon melting for the melt peak. However, the composites with various CRGO nanoplatelets content at 0.5 wt%, 1.0 wt%, 2.0 wt% showed the small melting peak (Tm) at 144.8°C, 143.7°C and 143.7°C, respectively. This is shown in Table 3. That is γ (hexagonal system) melting peak. This suggests that CRGO can promote the formation of γ crystal.
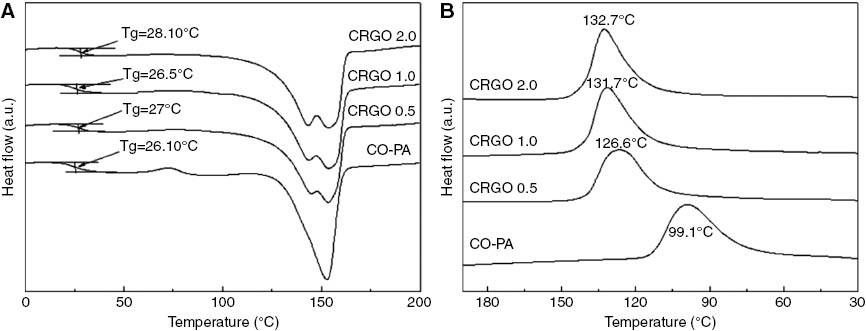
DSC curve of (A) temperature rising and (B) temperature decreasing for the CRGO/CO-PA composites with different addition level of CRGO.
DSC results of CRGO/CO-PA composites.
| Samples | Tg (°C) | Tmγ (°C) | Tmα (°C) | Tc (°C) | ΔHc (J/g) |
|---|---|---|---|---|---|
| CO-PA | 26.10 | – | 152.7 | 99.1 | 5.36 |
| 0.5 wt% CRGO/CO-PA | 27.0 | 144.8 | 153.4 | 126.6 | 4.70 |
| 1.0 wt% CRGO/CO-PA | 26.5 | 143.7 | 153.7 | 131.7 | 5.20 |
| 2.0 wt% CRGO/CO-PA | 28.10 | 143.7 | 153.6 | 132.7 | 5.19 |
Figure 9B represents the non-isothermal crystallization behavior of the pure CO-PA and CRGO/CO-PA nanocomposites. The pure CO-PA showed a wide and low crystallization exothermic peak. This indicated poor crystallization ability and a slow crystallization process. The crystallization exothermic peak of the composites moved towards high temperatures with the increment of CRGO nanoplatelets content. The peak appeared at 126.7°C, 131.7°C and 132.8°C, respectively, and the peak narrowed and sharpened gradually. This suggested that CRGO nanoplatelets can accelerate the crystallization process of the CRGO/CO-PA nanocomposites and improve the crystallization degree. This is due to the fact that the CRGO nanoplatelets dispersed in the CO-PA acted as the heterogeneous nucleating agent, which improved the crystallization rate. The non-isothermal crystallization behavior of CRGO/CO-PA nanocomposites is more significant than the GO/CO-PA nanocomposites (27). It can be seen in Table 3 that the change of ΔHc value is not obvious, which suggests that CRGO nanoplatelets did not improve the crystallinity of CRGO/CO-PA composites.
3.4 Polarizing microscope analysis
The crystal morphology of pure CO-PA and CRGO/CO-PA nanocomposites was observed with a polarized light microscope. Figure 10 shows the crystallization diagram of the pure CO-PA and CRGO/CO-PA composites with 0.5 wt% CRGO nanoplatelets content. It can be seen that the crystallization of the pure CO-PA was relatively perfect and sparse. However, the crystallization of the composites with 0.5 wt% CRGO nanoplatelets content was much smaller and the crystallization density was greater than pure CO-PA. This is mainly because the CRGO nanoplatelets can improve the crystallization nucleation density of the composites and promote its nucleation.
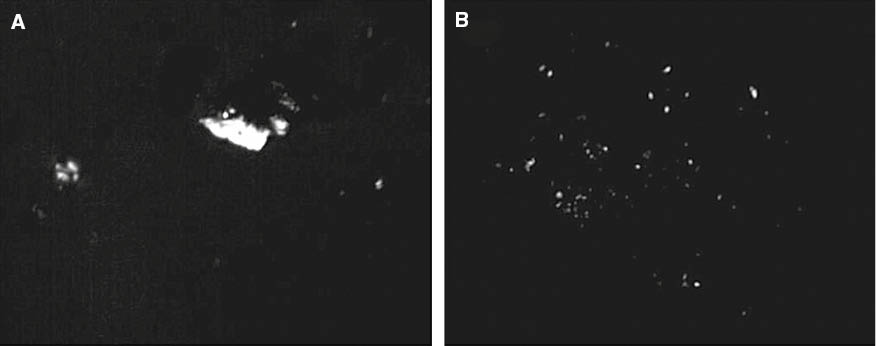
POM image of CO-PA (A) and 0.5 wt% CRGO composites (B) (10×10 times).
3.5 Mechanical properties
The yield strength, tensile strength, and elongation at break of the pure CO-PA and composites with various CRGO nanoplatelets content are shown in Figure 11 and Table 4. Table 4 shows that the tensile strength of the composites with 0.25 wt% CRGO nanoplatelets content was 56.26 MPa, which reached the maximum and was enhanced by 45.7% over pure CO-PA. However, the tensile strength of GO/CO-PA nanocomposites with 0.6% GO nanoplatelets content was 49.85 MPa, which was lower than CRGO/CO-PA nanocomposites (27). However, with an increment of CGRO nanoplatelets content, the tensile strength of the composites decreased and was not as strong as the pure CO-PA. The yield strength of the composites with 0.5 wt% CRGO nanoplatelets content was 34.90 MPa and reached the maximum; this changed little with an increment of CRGO nanoplatelets content. This is mainly because a low CRGO nanoplatelets content can be dispersed in CO-PA uniformly in the process of blending the solution, and the oxygen containing functional groups on the surface of CRGO nanoplatelets can react with the amino bond of the nylon to form a strong interface interaction and a hydrogen-bond interaction. However, the agglomeration happened easily with an increment of CRGO nanoplatelets content in the process of situ reduction, which led to defects and stress concentration, leading to a decrease in tensile strength. SEM analysis strongly proved the existence of agglomeration; however, the influence on yield strength was not obvious with an increment of CRGO nanoplatelets content. This is because the effective interaction force between the nylon molecular chains and CRGO nanoplatelets changed very little. The yield strength happened before the plastic deformation, and the stress concentration was not obvious. Therefore, the existence of agglomeration had a small impact on the yield strength, which was improved to some extent. Figure 11B shows that the elongation at the break of the composites decreased with the increase of CRGO nanoplatelets content and this detailed data is listed in Table 4 – this is because that CRGO nanoplatelets hinder the molecular chains from slipping.
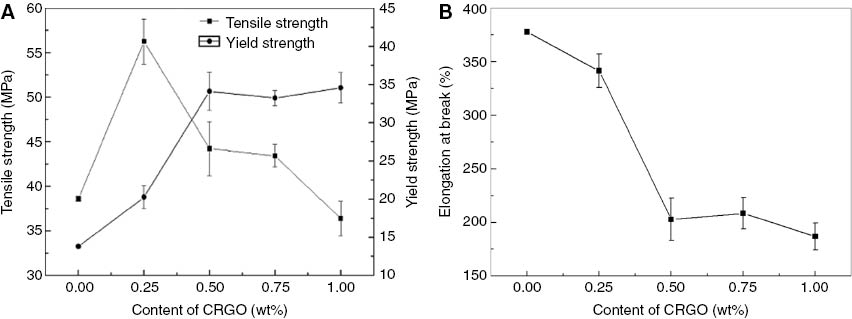
(A) Yield strength and tensile strength (B) elongation at break of CRGO/CO-PA.
Tensile property of CRGO/CO-PA composites.
| Sample/properties | Yield strength (MPa) | Tensile strength (MPa) | Elongation at break (%) |
|---|---|---|---|
| CO-PA | 13.80 | 38.60 | 377.65 |
| 0.25 wt% CRGO/CO-PA | 20.25 (±1.6) | 56.26 (±2.7) | 341.35 (±14.9) |
| 0.50 wt% CRGO/CO-PA | 34.09 (±2.5) | 44.23 (±3.3) | 202.75 (±17.6) |
| 0.75 wt% CRGO/CO-PA | 33.20 (±0.9) | 43.43 (±1.4) | 208.53 (±13.8) |
| 1.00 wt% CRGO/CO-PA | 34.56 (±1.8) | 36.38 (±2.2) | 186.69 (±12.1) |
3.6 Electrical properties analysis
Figure 12 displays the electrical conductivity of the CRGO/CO-PA nanocomposites as a function of the CRGO nanoplatelets content. The electrical conductivity of pure CO-PA was found to be about ~10-12 S/m, indicating that CO-PA was an electrically insulating material. The electrical conductivity of the nanocomposites increased slightly, to 0.25 wt%, as the increment of the CRGO nanoplatelets content increased to 0.5 wt%. This is because the low CRGO content in the CO-PA cannot form a stable electrical conduction path. Therefore, the electrical conductivity changed slightly. However, there was an attractive enhancement in electrical conductivity at 1.0 wt% and 2.0 wt%, which was found to be 10-8 S/m and 10-6 S/m, respectively. This extensive increase in the electrical conductivity was associated with the formation of the stable electrical conduction path. When the CRGO nanoplatelets content was 3.0 wt%, the electrical conductivity of the composites reached saturation. Therefore, when the CRGO nanoplatelets content reached a percolation threshold value of 1.0 wt%, the distance among CRGO nanoplatelets platelets in the matrix was close enough in a few nanometer ranges for electrical conduction via the electron hopping mechanism (28), (29).
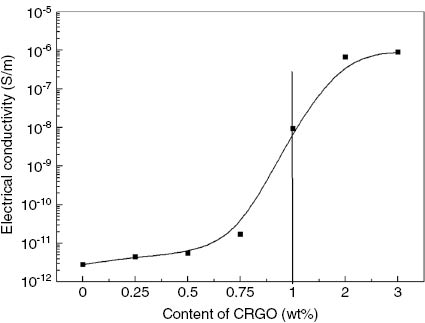
Conductivity of different mass fraction CRGO/CO-PA composite.
4 Conclusion
A series of CO-PA nanocomposites enhanced with CRGO nanoplatelets content were prepared via in-situ reduction in solution. FTIR, XRD, and SEM images confirmed that there was a small amount of oxygen containing functional groups in the surface of the CRGO nanoplatelets, and the CRGO nanoplatelets were well dispersed in the CO-PA matrix, which can form strong interfacial interaction with the nylon chains and improve the mechanical and thermal properties. CRGO nanoplatelets can promote the heterogeneous nucleation crystallization. The TGA analysis showed that the CRGO nanoplatelets can improve the thermal stability of the composites significantly. DSC analysis confirmed that CRGO nanoplatelets can improve the glass-transition temperature (Tg) and crystallization temperature (Tc) of the composites significantly. POM tests suggested that CRGO nanoplatelets can promote the crystallization nucleation efficiency of the composites.
Both tensile strength and yield strength were enhanced with appropriate CRGO nanoplatelets content as a result of the united distribution and good interfacial adhesion of CRGO nanoplatelets in the CO-PA matrix. The elongation at break of the composites decreased with the increment of CRGO nanoplatelets content. Additionally, the percolation threshold value electrical conduction in the CRGO/CO-PA nanocomposites was found to be at 1.0 wt% CRGO nanoplatelets content, which was up to 10-6 S/m.
Therefore, it can be inferred that the use of CRGO nanoplatelets in CO-PA matrix provide a good combination of mechanical, thermal and electrical properties, and it is expected to be used in areas that require improved physical properties.
References
1. Novoselov KS, Geim AK, Morozov SV, Jiang D, Zhang Y, Dubonos SA, Firsov AA. Electric field effect in atomically thin carbon films. Science. 2004;306(5696):666–9.10.1126/science.1102896Suche in Google Scholar PubMed
2. Mao Y, Wen S, Chen Y, Zhang F, Panine P, Chan TW, Liu L. High performance graphene oxide based rubber composites. Sci Rep. 2013;3:2508.10.1038/srep02508Suche in Google Scholar PubMed PubMed Central
3. Huang Y, Liang J, Chen Y. An overview of the applications of graphene-based materials in supercapacitors. Small 2012;8(12):1805–34.10.1002/smll.201102635Suche in Google Scholar PubMed
4. Bai X, Wan C, Zhang Y, Zhai Y. Reinforcement of hydrogenated carboxylated nitrile–butadiene rubber with exfoliated graphene oxide. Carbon 2011;49(5):1608–13.10.1016/j.carbon.2010.12.043Suche in Google Scholar
5. Chen B, Ma N, Bai X, Zhang H, Zhang Y. Effects of graphene oxide on surface energy, mechanical, damping and thermal properties of ethylene-propylene-diene rubber/petroleum resin blends. RSC Adv. 2012;2(11):4683–9.10.1039/c2ra01212jSuche in Google Scholar
6. Bai X, Zhai Y, Zhang Y. Green approach to prepare graphene-based composites with high microwave absorption capacity. J Phys Chem C. 2011;115(23):11673–7.10.1021/jp202475mSuche in Google Scholar
7. Balandin AA, Ghosh S, Bao W, Calizo I, Teweldebrhan D, Miao F, Lau CN. Superior thermal conductivity of single-layer graphene. Nano Lett. 2008;8(3):902–7.10.1021/nl0731872Suche in Google Scholar PubMed
8. Cai W, Moore AL, Zhu Y, Li X, Chen S, Shi L, Ruoff RS. Thermal transport in suspended and supported monolayer graphene grown by chemical vapor deposition. Nano Lett. 2010;10(5):1645–51.10.1021/nl9041966Suche in Google Scholar PubMed
9. Seol JH, Jo I, Moore AL, Lindsay L, Aitken ZH, Pettes MT, Mingo N. Two-dimensional phonon transport in supported graphene. Science 2010;328(5975):213–6.10.1126/science.1184014Suche in Google Scholar PubMed
10. Geim AK, Novoselov KS. The rise of graphene. Nat Mater. 2007;6(3):183–91.10.1142/9789814287005_0002Suche in Google Scholar
11. Roy S, Tang X, Das T, Zhang L, Li Y, Ting S, Yue CY. Enhanced molecular level dispersion and interface bonding at low loading of modified graphene oxide to fabricate super nylon 12 composites. ACS Appl Mater Interfaces. 2015;7(5): 3142–51.10.1021/am5074408Suche in Google Scholar PubMed
12. Liu H, Hou L, Peng W, Zhang L, Li Y, Ting S, Yue CY. Fabrication and characterization of polyamide 6-functionalized graphene nanocomposite fiber. J Mater Sci. 2012;47(23):8052–60.10.1007/s10853-012-6695-5Suche in Google Scholar
13. Liang J, Huang Y, Zhang L, Wang Y, Ma Y, Guo T, Chen Y. Molecular level dispersion of graphene into poly (vinyl alcohol) and effective reinforcement of their nanocomposites. Adv Funct Mater. 2009;19(14):2297–302.10.1002/adfm.200801776Suche in Google Scholar
14. Guo HL, Wang XF, Qian QY, Wang FB, Xia XH. A green approach to the synthesis of graphene nanosheets. ACS Nano. 2009;3(9):2653–9.10.1021/nn900227dSuche in Google Scholar PubMed
15. Bai S, Shen X. Graphene-inorganic nanocomposites. Rsc Adv. 2012;2(1):64–98.10.1039/C1RA00260KSuche in Google Scholar
16. Villar-Rodil S, Paredes JI, Martínez-Alonso A, Tascón JM. Preparation of graphene dispersions and graphene-polymer composites in organic media. J Mater Chem. 2009;19(22):3591–3.10.1039/b904935eSuche in Google Scholar
17. Rafiq R, Cai D, Jin J, Song M. Increasing the toughness of nylon 12 by the incorporation of functionalized graphene. Carbon. 2010;48(15):4309–14.10.1016/j.carbon.2010.07.043Suche in Google Scholar
18. Jin J, Rafiq R, Gill YQ, Song M. Preparation and characterization of high performance of graphene/nylon nanocomposites. Eur Polym J. 2013;49(9):2617–26.10.1016/j.eurpolymj.2013.06.004Suche in Google Scholar
19. Al-Jabareen A, Al-Bustami H, Harel H, Marom G. Improving the oxygen barrier properties of polyethylene terephthalate by graphite nanoplatelets. J Appl Polym Sci. 2013;128(3):1534–9.10.1002/app.38302Suche in Google Scholar
20. Hummers WS Jr, Offeman RE. Preparation of graphitic oxide. J Am Chem Soc. 1958;80(6):1339–1339.10.1021/ja01539a017Suche in Google Scholar
21. Meyer JC, Geim AK, Katsnelson MI, Novoselov KS, Booth TJ, Roth S. The structure of suspended graphene sheets. Nature 2007;446(7131):60.10.1038/nature05545Suche in Google Scholar PubMed
22. Li X, Zhang G, Bai X, Sun X, Wang X, Wang E, Dai H. Highly conducting graphene sheets and Langmuir–Blodgett films. Nat Nanotechnol. 2008;3(9):538–42.10.1038/nnano.2008.210Suche in Google Scholar PubMed
23. Xu-Yu Y, Xian-Bao W, Jing L, Jia Y, Li W, Jing-Chao W. Controllable reduction and structural characterization of graphene oxides. Chem J Chinese U. 2012;33(9):1902–7.Suche in Google Scholar
24. Chen R, Wang H, Han Y, Wang X, Wang X, Liu W, Yao N. Synthesis and characterization of graphene via oxidation reduction. Mater Rev. 2012;26(12):114–7.Suche in Google Scholar
25. Stankovich S, Dikin DA, Dommett GH, Kohlhaas KM, Zimney EJ, Stach EA, Ruoff RS. Graphene-based composite materials. Nature. 2006;442(7100):282–6.10.1038/nature04969Suche in Google Scholar PubMed
26. Bian J, Lin HL, He FX, Wei XW, Chang IT, Sancaktar E. Fabrication of microwave exfoliated graphite oxide reinforced thermoplastic polyurethane nanocomposites: effects of filler on morphology, mechanical, thermal and conductive properties. Compos Part A-Appl S. 2013;47:72–82.10.1016/j.compositesa.2012.12.009Suche in Google Scholar
27. Liu X, Guan Y, Shao XY, Zhao LF, He HF. Preparation and properties of graphene oxide/nylon nanocomposites. Polym Mater Sci Eng. 2015;31(10):165–9.Suche in Google Scholar
28. Li C, Thostenson ET, Chou TW. Dominant role of tunneling resistance in the electrical conductivity of carbon nanotube–based composites. Appl Phys Lett. 2007;91(22):223114.10.1063/1.2819690Suche in Google Scholar
29. Pötschke P, Abdel-Goad M, Pegel S, Jehnichen D, Mark JE, Zhou D, Heinrich G. Comparisons among electrical and rheological properties of melt-mixed composites containing various carbon nanostructures. J Macromol Sci, Pure Appl Chem. 2009;47(1):12–9.10.1080/10601320903394397Suche in Google Scholar
©2017 Walter de Gruyter GmbH, Berlin/Boston
Artikel in diesem Heft
- Frontmatter
- In this Issue
- Editorial
- Innovations in polymers and composite materials
- Full length articles
- Preparation and properties of chemically reduced graphene oxide/copolymer-polyamide nanocomposites
- Synthesis and properties of well-defined carbazole-containing fluorescent star polymers of different arms
- The effect of high-current pulsed electron beam modification on the surface wetting property of polyamide 6
- Synthesis and application of waterborne polyurethane fluorescent composite
- Medicated structural PVP/PEG composites fabricated using coaxial electrospinning
- Research of the thermal aging mechanism of polycarbonate and polyester film
- Damage indication of 2′, 7′-dichlorofluorescein for epoxy polymer and the effect of water on its damage indicating ability
- Synthesis and characterization of thermosensitive and polarity-sensitive fluorescent PNIPAM-coated gold nanoparticles
- Comparative study of crystallization and lamellae orientation of isotactic polypropylene by rapid heat cycle molding and conventional injection molding
- Determination of deformation of a highly oriented polymer under three-point bending using finite element analysis
- Kinetic studies on the cure reaction of hydroxyl-terminated polybutadiene based polyurethane with variable catalysts by differential scanning calorimetry
- Preparation and swelling properties of poly(acrylic acid-co-acrylamide) composite hydrogels