Acid dissociation constants in selected dipolar non-hydrogen-bond-donor solvents (IUPAC Technical Report)
-
Ivo Leito

 ,
Ivari Kaljurand
,
Ivari Kaljurand

Abstract
This compilation includes more than 9000 pK a values determined in seven dipolar non-hydrogen-bond-donor solvents {dimethyl sulfoxide, acetonitrile, N,N-dimethylformamide, pyridine, acetone, 4-methyl-1,3-dioxolan-2-one (propylene carbonate), oxolane (tetrahydrofuran)} for close to 5000 acids collected from around 800 original works published during the last 60 years. The data have been critically evaluated on the basis of defined quality criteria and depending on situation, kept as they were originally published, marked as doubtful/unreliable (around 2700 values) or corrected (around 2400 values). To enable automated processing and mining, the data are presented as a set of spreadsheets, together with structural codes (SMILES and InChI strings), compound class qualifiers, and comments. The document contains also comprehensive educational background information on the acid-base processes in non-aqueous media, as well as brief descriptions of the main measurement methods, with focus on the reliability of the data and sources of uncertainty. The full dataset is available at the permanent address https://doi.org/10.5281/zenodo.12608876.
List of abbreviations and acronyms
- 9PF
-
9-phenyl-9H-fluorene
- AcOH
-
Acetic acid; ethanoic acid
- CAS RN
-
Chemical Abstracts Service Registry Number
- DMF
-
N,N-Dimethylformamide
- DMSO
-
Dimethyl sulfoxide; (methanesulfinyl)methane
- HBD
-
Hydrogen bond donor
- InChI
-
International Chemical Identifier
- IUPAC
-
International Union of Pure and Applied Chemistry
- MeCN
-
Acetonitrile; ethanenitrile
- ND
-
No data
- NF
-
Not found
- NMR
-
Nuclear magnetic resonance
- PC
-
Propylene carbonate; 4-methyl-1,3-dioxolan-2-one
- RSC
-
Royal Society of Chemistry
- SMILES
-
Simplified Molecular Input Line Entry System
- THF
-
Tetrahydrofuran; oxolane; 1-oxacyclopentane
- TNP
-
2,4,6-Trinitrophenol; picric acid
- UV–VIS
-
Ultraviolet–visible
- VIS
-
Visible
1 Introduction
Hydrogen ion[a] transfer in solvents (referred to as ionization or dissociation of acids and bases in the present context) is ubiquitous, 2 affecting a myriad of processes in many fields of science and technology. Accurate quantitative information on the ionization and dissociation (see below for more detailed explanations of these terms) is essential for understanding and utilizing processes involving acid-base interactions. Dissociation constants K a or their negative base-10 logarithms (−log10 K a = pK a) are widely used as quantitative descriptors of the “strength” of acids and bases (see below for more details). Of all chemical reaction types, the dissociation of acids and bases has been arguably the most extensively studied. In consequence, a large pool of pK a data is available in the scientific literature. 3 , 4 , 5
The processes and interactions involved in ionization are strongly solvent-dependent. Consequently, pK a values are also solvent-dependent, often differing by many pK a units. 5 , 6 , 7 , 8 , 9 Also the orders of acidities and basicities sometimes change when moving from one solvent to another. 7 Thus, for practical use, the pK a value is needed in the same solvent where the system/process under investigation takes place. This requirement is to some extent eased by good correlations of pK a values between some (but not all) solvents. 8 , 10
As expected for historical reasons, the largest body of pK a values exists for water. A number of pK a compilations are available, ranging from the classical stability constants handbooks by the Royal Society of Chemistry (RSC), 11 , 12 , 13 , 14 as well as collections by Kortüm et al. 3 and Perrin 4 to more recent collections 15 , 16 , 17 and prediction engines. 18 However, in some areas – such as organic synthesis, acid-base catalysis, process chemistry, electrochemical power sources, etc. – knowledge of pK a values in non-aqueous solvents is needed. In addition, the pK a values of very strong or very weak acids or bases cannot be experimentally determined in water with reasonable reliability and for such compounds reliable experimental pK a data can be obtained only in non-aqueous solvents. Furthermore, many acids and bases are too sparingly soluble in water to be measured reliably.
In contrast to water, the data available in non-aqueous solvents are less abundant. 8 Probably the most voluminous and user-friendly compilation currently available is the internet iBonD database of the group of J.-P. Cheng. 15 The most recent comprehensive multi-solvent compilation from International Union of Pure and Applied Chemistry (IUPAC) is that of K. Izutsu. 5 The Tables of Rate and Equilibrium Constants of Heterolytic Organic Reactions edited by V.A. Palm 19 , 20 are another extensive compilation, but are already quite old and not easily accessible. Good pK a collections are available in DMSO, 21 , 22 although a significant amount of data is not included.
In broad terms, there are three aspects where the currently available compilations of non-aqueous pK a values do not fully meet the needs of users.
Coverage : Many of the easily accessible compilations have numerous omissions. For example, many do not include all of the pK a values published by groups from the former Soviet Union (A.I. Shatenshtein, M.I. Kabachnik, to name a few), typically published in Russian language in journals not widely available.
Traceability : In non-aqueous solvents, pK a values are often presented on different “scales” (for examples, see comments below about DMSO, MeCN, and THF). In metrology terms this means that they have different origins of traceability, 23 which makes their direct comparison problematic (in some cases meaningless). In the above-mentioned collections, the presented values are neither brought to a single scale nor supplemented with comments as to which scale they belong to, leaving the reader without guidance on what can and cannot be compared.
Reliability : The above-mentioned collections (with few exceptions) present values without assessing their reliability. There are often serious discrepancies between values (even if belonging to the same scale) from different groups. For example, the pK a values of chloroacetic acid at 25 °C found in literature lie within the range 6.2–9.0 in DMSO, 15.3–20.3 in acetonitrile, and 4.2–11.5 in N,N-dimethylformamide. The reader is left without guidance as to which values are the most reliable.
The present compilation of dissociation constants of neutral (uncharged) acids in dipolar non-hydrogen-bond-donor (non-HBD) solvents (also known as dipolar aprotic/non-protogenic solvents) has been prepared under the auspices of the International Union of Pure and Applied Chemistry. Its main aim is to provide a comprehensive and critically evaluated pool of pK a data of acids and bases in selected non-aqueous solvents. This is the first part of a planned series of four compilations, which are planned as follows:
Uncharged acids in dipolar non-HBD solvents.
Uncharged bases (cationic acids) in dipolar non-HBD solvents.
Uncharged acids in protogenic solvents.
Uncharged bases (cationic acids) in protogenic solvents.
Dissociation constants (pK a values) of neutral acids in the following solvents have been collected in this part of the compilation.
Dimethyl sulfoxide (DMSO, (methanesulfinyl)methane), ca. 4700 values
Acetonitrile (MeCN), ca. 1600 values
N,N-Dimethylformamide (DMF), ca. 1700 values
Pyridine, ca. 300 values
Acetone (propan-2-one), ca. 600 values
Propylene carbonate (PC, 4-methyl-1,3-dioxolan-2-one), ca. 80 values
Tetrahydrofuran (THF, oxolane, 1-oxacyclopentane), ca. 500 values
Some properties of these solvents are collected in Table 1. Figure 1 shows the structures of the solvents and their basicity centers.
Relevant Properties of the Solvents Selected for this Compilation. Data from ref. 24] unless indicated otherwise. a
| Solvent (S) | ε r | E T N | Δtr G°(H+, H2O → S) 25 , 26 / (kJ mol−1) | β 27 | α 27 | pK auto | pK a values of selected acids c | |||
|---|---|---|---|---|---|---|---|---|---|---|
| HCl | TNP | AcOH | Phenol | |||||||
| DMSO | 47 | 0.444 | −19 | 0.71 | 0.00 | 34 21 | −2.0 | −0.3 | 12.3 | 18.0 |
| MeCN | 36 | 0.460 | 46 | 0.37 | 0.23 | 43 d | 10.3 | 11.0 | 23.5 | 29.2 |
| DMF | 37 | 0.386 | −14 | 0.69 | 0.00 | 29 6 | 1.4 | ca.1 | 13.5 | 18.4 |
| Pyridine | 13 | 0.302 | −28 | 0.69 | 0.00 | Very high b | 5.7 | 3.0 | 12 | – |
| Acetone | 21 | 0.355 | 29 e | 0.49 | 0.04 | 33 6 | 9.9 | 9.2 | 21.2 | – |
| PC | 63 | 0.472 | 50 | 0.40 | 0.00 | Very high b | 10.9 | 11.4 | 22.7 | – |
| THF | 7.5 | 0.207 | 13 e | 0.58 | 0.00 | Very high b | – | 11.8 f | 24.4 f | 29.2 f |
| Water 6 | 78 | 1.000 | 0 | 0.37 | 1.54 | 14 | −5.9 | 0.4 | 4.76 | 10.0 |
-
a ε r – relative permittivity; E T N – normalized E T(30) parameter 6 ; Δtr G°(H+, H2O → S) – standard molar Gibbs energy of transfer of H+ from water to the solvent S, based on the tetraphenylarsonium/tetraphenylborate (TATB) assumption, postulating that for the reference electrolyte Ph4As+/Ph4B−, the standard Gibbs energies of transfer for the electrolyte from one solvent to another are equal for the cation Ph4As+ and the anion Ph4B− 25 , 26 ; β, α – Kamlet–Taft solvatochromic parameters for hydrogen-bond-acceptor (HBA) basicity and hydrogen-bond-donor (HBD) acidity, respectively 6 ; pK auto – negative base-10 logarithm of autoprotolysis constant. b A very high pK auto does not necessarily mean a very wide pK a range is available. In practice it means that the limits of the pK a scale in the solvent are determined by impurities (most often water) rather than the solvent itself. c The values presented are the most probable according to the current knowledge of the present authors. See also specific comments on the different solvents. TNP is 2,4,6-trinitrophenol (picric acid), AcOH is acetic acid. “–” means that no data are available. d Value estimated on the basis of pK a of MeCN in DMSO (31.3 21 ) and correlation of pK a values between DMSO and MeCN. e The estimated Δtr G° values were obtained from the observation of a linear trend between the experimental values (refs. 25], 26]) and the β values (ref. 27]) for the short set of non-HBD solvents of this Table with the additional data for nitromethane for extending the range of Δtr G° values. f Overall pK a value (equation (6)).
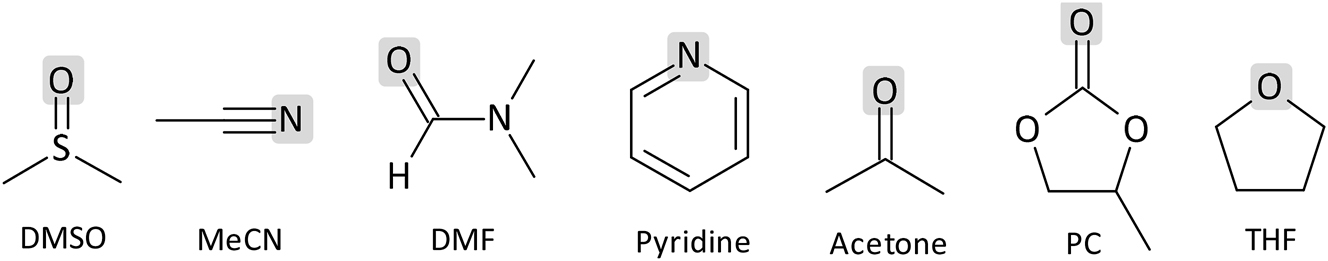
Structures of the solvents included in the compilation. The most basic atoms are highlighted.
For these solvents, the present authors have attempted to include, as far as possible, all available pK a data up to 2023 (with some additions from 2024). The choice of solvents was governed by the following criteria: (1) the solvent is non-HBD and (preferably) has a high relative permittivity (ε r); (2) a reasonably large amount of reliable pK a data are available and have been reasonably widely used. Five out of seven solvents have ε r > 20 and support dissociation of ion pairs into free ions such that ion pairing is under most experimental conditions not an issue in them. Pyridine and tetrahydrofuran have ε r < 20 and ion pairing is often encountered in them.
The dipolar non-hydrogen-bond-donor solvents considered have very low hydrogen ion donor ability (i.e., they are weak Brønsted acids), but their hydrogen ion acceptor abilities differ widely. Acetonitrile, acetone, 4-methyl-1,3-dioxolan-2-one (propylene carbonate), and oxolane (tetrahydrofuran) are weak hydrogen ion acceptors (relative to water) and are classified as protophobic dipolar non-HBD solvents. 6 , 28 Pyridine, DMSO, and DMF are strong hydrogen ion acceptors (i.e., as solvents they are relatively strong Brønsted bases) and are called protophilic dipolar non-HBD solvents.
In the context of hydrogen ion transfer in non-HBD solvents, we will use the terms permittivity and polarity as follows.
Permittivity refers strictly to the relative permittivity ε r (formerly dielectric constant). Dipolar solvents, i.e., those having a substantial molecular dipole moment, tend to have also a high relative permittivity. This property depends also on strong intermolecular interactions, first of all hydrogen bonding, like in water. In the context of weakly associated, non-hydrogen-bond-donor solvents, changes in dipole moment and relative permittivity are correlated. The term permittivity is used here to characterize the power of a medium to screen the electrostatic attraction between ions of opposite charges and hence to promote dissociation of oppositely charged ions.
Polarity of a solvent is defined as the overall solvation capability (solvation power) of a solvent toward solutes, which depends on the action of all possible intermolecular interactions between solute ions or molecules and solvent molecules, excluding interactions leading to definite chemical alterations of the ions or molecules of the solute. 29 In our context, polarity includes, in addition to permittivity, first of all the ability of the solvent to provide solvation shell for anions and cations, thereby easing the separation of ions of opposite charges and dissociation of ion pairs.
2 The physico-chemical meaning of the tabulated pK a values
Brønsted acidity constants pK a of an uncharged acid HA in solvent S are listed in this compilation. In solvents of sufficient polarity, acid HA dissociates according to reaction 1:
The subscripts “S” indicate that the participating species are solvated by the solvent molecules. The same is true for the species in the subsequent equations but the subscripts “S” are omitted for simplicity. The equilibrium constant of reaction 1 is the acidity constant K a of acid HA defined via equation (2).
The terms a in this definition are the activities of the respective species. In dilute solutions, the activity of the solvent S approaches unity and can be omitted from the expression. In practice, activities are often approximated by equilibrium concentrations, typically using molar concentrations and 1 M (equivalent to mol dm−3) as the standard state.
The pK a value is defined as the negative base-10 logarithm of the equilibrium constant K a:
In solvents of sufficient polarity (DMSO, MeCN, DMF, PC, and most of the time acetone), this is the typical definition of “absolute”[b] pK a.
In the case of uncharged diacids H2A, the pK a of the first acid dissociation step (pK a1) corresponds to the above equation and pK a of the second dissociation step (pK a2) corresponds to the pK a value of the anionic acid HA−:
In less polar non-aqueous solvents, acids do not always dissociate according to the simple Brønsted scheme (reaction 1). Two additional processes should be considered: ion pairing and homoconjugation.
Ion pairing. In somewhat simplified form, the consecutive equilibria that occur in solution when a neutral acid HA reacts with a base B (which can be a solvent molecule or some other base) to release a hydrogen ion can be represented by the general scheme involving ionization and dissociation of the formed ion pair: 6
In this case, the product of these consecutive equilibrium constants – the ionization constant of the acid K i and the dissociation constant of the ion pair K d – is the K a value: K a = K i K d (where the activity of the solvent S is omitted).
Depending on the properties and concentrations of the acid HA, the base B, the formed ions, as well as the solvent S, the hydrogen ion transfer from the acid molecule to a base or the solvent may be complete. That is, the Brønsted scheme of reaction 1 and equation (2) is realized (polar solvents) or may stop at the stage of ion pair (weakly polar solvents) or give a mixture of ion pairs and free ions (medium-polarity solvents). The actual picture is determined by a complex interplay of factors:
Solvent properties. K i is (mostly) determined by the hydrogen-bond-donor and hydrogen-bond-acceptor properties of the solvent and the solutes (determining the ability to form solvation shells for ions, thereby screening them form each other). The value of K d is determined (mostly) by the solvent’s ε r.
The size and charge distribution of the formed solvated ions BH+ and A−. The larger the ions and the more their charge is delocalized, the more is the acid-base equilibrium (reaction 5) shifted toward formation of the free solvated ions.
Concentrations of the species. Formation of free ions (dissociation of ion pairs BH+A−) is favored by low overall acid concentration – the lower it is, the less extensive is ion pairing.
If a solvent’s relative permittivity ε r > 30, ion pairing is often insignificant unless high concentrations are used. 30 Low concentrations of ionic compounds (below 1 mM, equivalent to mmol dm−3) are advisable if ion pairing is to be minimized. Because of this, techniques that work at low concentrations (e.g., spectrophotometry) have an advantage. For relative permittivities between 20 and 30, the formation of ion pairs will depend on the nature of the ions and their concentration. The higher the concentration, the higher the probability of ion pairing. For relative permittivities less than 20, the formation of ion pairs has to be considered under most measurement conditions.
In low permittivity solvents, because some of the most common measuring techniques (potentiometry, conductometry) cannot distinguish between the unionized acid (HA) and undissociated ion pairs (SH+A−), the overall dissociation constant (
Analyzing the published pK a values in low permittivity solvents reveals that in many cases possible ion pairing is simply neglected, i.e., some fraction of the anions A− is free while some fraction is paired with a counterion, either SH+ or BH+ (B being the basic titrant). This means that instead of K a (as often claimed by authors) essentially the following “constant” is obtained (equation (7)):
This “constant” is sometimes – especially if the ions in solution exist almost exclusively as ion pairs – termed an “ion-pair K a”. It is important to stress that K aip cannot be called a true constant because it depends on the counter-ion and its concentration. However, if the difference in pK aip values between two acids is measured (as is often done, for example, in spectrophotometry, see below) then the counterion effect largely cancels out. 31 Values of pK aip are especially common in oxolane (THF) where essentially all anions are ion-paired. The counter-ion is usually a solvated cation such as Li+, Cs+, etc. (denoted as M+ below) rather than the conjugate acid SH+ of the solvent S or the conjugate acid BH+ of the base B, so that under most measurement conditions, K aip is better represented as:
To avoid having to measure the (negligible and hence difficult to measure) value of a(SH+), relative measurements are almost always used in such solvents (see equation (10)) and the results are combined into “scales” of values. Such scales are typically anchored to arbitrarily chosen reference values. A good illustration of this situation is provided in the oxolane (THF) section below.
Homoconjugation. Solvents with poor hydrogen-bond-donor capabilities cannot efficiently solvate and hence stabilize the conjugate base of the acid (A−). As a result, A− interacts with other HBDs in the medium, such as its conjugate neutral acid HA (homoconjugation) or other acids present (heteroconjugation).[c] Homoconjugation 33 , 34 refers to the hydrogen-bonded (HB) adduct formation between an acid molecule HA (HB donor) with its anion A− (HB acceptor):
This reaction can be regarded as selective solvation of the anion A− by HA. 33 Homoconjugation becomes important primarily in non-HBD solvents that solvate anions poorly and especially for OH acids, particularly those that produce anions with poor charge delocalization and no steric hindrance of the anionic center. So, for example, almost all carboxylic acids and most phenols undergo homoconjugation in acetonitrile, at least to some extent. At the same time, homoconjugation of 2-substituted and 2,6-disubstituted phenols is often insignificant. 10 As for ion pairing, low acid (and anion) concentrations suppress homoconjugation. If homoconjugation cannot be suppressed by dilution, then to obtain pK a values according to equation (2), homoconjugation has to be accounted for. 10
Some generalizations. In protophilic dipolar non-hydrogen-bond-donor solvents with ε r > 30 (in this compilation: DMSO and DMF), the acid/base interaction generally produces free ions. Homoconjugation is not extensive in these solvents 5 because the HA molecules are efficiently solvated, reducing their HBD ability.
In protophobic dipolar non-HBD solvents with ε r > 30 (in this compilation: MeCN and PC), homoconjugation is often significant. 5 , 33 Its extent is strongly dependent on the nature of the acid and its anion, as well as on concentration.
Acid-base equilibria in dipolar non-HBD solvents are often significantly influenced by trace amounts of water and other acidic or basic impurities. The presence of uncontrolled amounts of water may shift the acid-base equilibrium and can cause considerable enhancement of the apparent acidity of HA corresponding to a decrease in pK a. The effect of water is especially prominent in the case of weak acids and if the formed anions have a strongly localized charge. The influence of water can be significantly suppressed if relative instead of absolute measurement is used (see the Measurement techniques section).
Efforts have been made in this review to ensure that the listed pK a values correspond to equation (2) in the specific solvent. However, this is not always possible in all solvents: particularly in oxolane (THF) and partly in pyridine and acetone. The situation with respect to ion pairing and homoconjugation in the selected solvents is described below. In oxolane (THF), pyridine, and acetone, different definitions of pK a are given in some cases (see below).
3 Measurement techniques
This section aims to help the user of this compilation to better understand the physico-chemical meaning of the tabulated pK a values. We have avoided a comprehensive coverage of pK a measurement methods, which can be found in the literature. 10 , 35 , 36 , 37 , 38 Here we describe the four most-used techniques: conductometry, potentiometry, UV–VIS spectrophotometry, and Nuclear Magnetic Resonance (NMR) spectrometry. Figure 2 shows the prevalence of these techniques in pK a studies covered in this work.

Distribution of pK a values in this compilation by measurement technique.
3.1 Conductometry
Conductometry utilizes the fact that when a neutral acid molecule dissociates into free ions, the conductivity of the solution increases. Measuring conductivity at different acid concentrations and relating the conductivity data to acid concentration data enables calculation of the pK a value. The technique is by its nature “absolute”, i.e., it does not need to use a reference acid. Conductometry works best with medium to strong monoprotic acids, corresponding to a pK a range of about 3–6. To limit the number of conducting species in solution, conductometric measurements are usually performed by changing only the acid concentration (e.g., by dilution).
Conductometry is unable to distinguish between neutral HA and ion pairs SH+A−. Thus, in principle, rather than pK a as defined by equation (2), conductometry yields the overall dissociation constant pK a d (equation (6)). In solvents of sufficiently high permittivity (here DMSO, MeCN, DMF, PC and usually acetone) ion pairing is negligible and pK a values as defined by equation (2) can be measured by conductometry.
In non-HBD solvents, a key drawback of conductometry is that moisture in solvents makes acids seem stronger. This is because water molecules are efficient in selectively solvating the anions (and in some solvents also the hydrogen ions) thereby promoting ionization/dissociation. A second drawback is that if a relatively weak acid contains a strong acid as an impurity, then the conductivity can increase markedly because of the more extensive dissociation of the stronger acid. In extreme cases, essentially all the observed conductivity can be caused by impurities, leading to meaningless results. These drawbacks become more serious as the measured acid becomes weaker. The second drawback points to a more general limitation of the technique: conductometry provides no direct evidence of the origin of the conductance, be it the extent of the acid dissociation in the solution, or the presence of impurities, or some other source. In conductometry of acid solutions alone, homoconjugation is mostly not a problem because there are no acid/conjugate base (salt) mixtures. Upon partial dissociation, there are both HA and A− in the solution and the degree of dissociation of HA increases upon dilution. However, dilution also suppresses homoconjugation.
3.2 Potentiometry
Potentiometry enables direct measurement of the solvated hydrogen ion activity a(H+) (subject to the usual Bates–Guggenheim convention 39 ). It is mostly used in the potentiometric titration mode.
In a potentiometric titration, if the titrated acid is strong enough (or if correction for incomplete reaction is applied), then the concentrations/activities of HA and A− in solution for use with equation (2) can be obtained from the amounts and concentrations of the solutions involved (the so-called Henderson–Hasselbalch equation 40 ). However, potentiometric titration is unable to detect whether the formed A− is free or ion-paired with SH+ or BH+. So, while in high permittivity solvents potentiometric titration gives the pK a directly according to equation (2), in less polar solvents the presence of ion pairs of A− with the conjugate acid BH+ of the basic titrant B (BH+A−) or other counter-cation may complicate direct calculation of the activity of HA.
One possibility is to group the ion pair with the neutral acid. In this case, the so-called overall dissociation constant (equation (6)) is obtained. For that, the formation constant of the salt ion pairs must be known (usually measured by conductometry) to calculate the overall dissociation constant (equation (6)). The other possibility is grouping the ion pair(s) with A−, which leads to the apparent constant K aip (equation (7)).
Homoconjugation, if it occurs to a noticeable extent (which is favored by the relatively high concentrations used in potentiometric titrations), also has effects: it decreases pH before and increases pH after the half-neutralization point from that expected from the Henderson–Hasselbalch equation. To calculate the pK a from the titration curve in such solvents, the homoconjugation constant must be measured first. An exception is the half-neutralization point of the titration where homoconjugation has no effect. According to the Henderson–Hasselbalch equation, the pH of the half-neutralization point of the titration corresponds to the pK a value. Therefore, potentiometric half-neutralization points are often directly given as good estimates of pK a, even neglecting the significant extent of homoconjugation. Of course, this approach is not applicable to low permittivity solvents where salts are not dissociated.
Potentiometric pH measurement can in principle be an absolute technique. However, usually it is used as a relative technique, especially in non-aqueous solutions. This means that the pH-sensitive electrode (typically a glass membrane electrode) is calibrated by buffer solutions composed of a reference acid with a well-known pK a and its salt in the same solvent where the pK a is measured. It is important that the pK a of the reference acid(s) used for calibration is not too different from the expected pK a value of the acid to be measured. Such calibration is often carried out as a potentiometric titration of the reference acid with a strong base. Such calibration, if correctly done, brings, besides the ability to obtain an estimate of a(H+), the advantage that the influence of some uncertainty sources that affect both the acid used for calibration and the acid for which pK a is measured, most notably, the water content of the solvent, will decrease by partial cancellation.
Potentiometry has the same general limitation as conductometry: there is no way to directly monitor the process that occurs in solution during titration and whether it corresponds to the expected acid-base reaction. Only limited insights can be obtained from the shape of the titration curve. This limitation makes impurities quite dangerous, as for conductometry. It becomes especially noticeable with high and low pK a values that are near the limits of the solvent under investigation. Another disadvantage of the technique is the relatively high concentrations that must be used, typically in the order of 10−3 to 10−2 M. At this concentration level, homoconjugation and ion pairing become non-negligible in several solvents.
3.3 UV–VIS spectrophotometry
Direct UV–VIS spectrophotometry means that the relative amounts of the uncharged acid HA and its anion A− in solution can be measured using their UV–VIS spectra. There are two important conditions: (1) the UV–VIS spectra of HA and A− must differ measurably and (2) at least one of them must absorb at wavelengths where the solvent is sufficiently transparent. 6 The concentration/activity of the solvated hydrogen ion is found either (a) from the overall acid concentration and the [A−]/[HA] ratio; (b) from potentiometry or (c) from the dissociation ratio of a reference acid HAref, which is simultaneously present in the same solution. 10 In the first case, the technique is “absolute”, in the remaining two cases, it is “relative”. As in potentiometry, the relative way of measuring enables (at least partial but often substantial) canceling of some sources of uncertainty. If a measurement is carried out against a reference acid, then the difference of their pK a values (ΔpK a, equation (10)) is obtained and a rather complex data treatment is necessary because of the (almost inevitable) overlap of the UV–VIS spectra of the four species involved. 10 In the majority of cases, it can be assumed that activity coefficients of the species of the same charge type cancel so that equilibrium concentrations can be used in equation (10) instead of activities.
At the same time, in that case, since both acids are in the same solution and are influenced by the same factors, some uncertainty sources cancel either partially (e.g., water in the solvent) or fully (most importantly the uncertainty of measuring the activity of solvated hydrogen ion). Furthermore, depending on the exact procedure, concentration errors may also cancel. If this advantage is combined with measuring against different reference acids, then highly accurate results can be obtained.
In general, UV–VIS spectrophotometry cannot distinguish between free anions A− and ion pairs BH+A−. Thus, in low permittivity solvents, UV–VIS spectrophotometry works according to equations (7) or (8). In fact, the large majority of ion-pair pK a values have been measured this way (the rest have been measured mostly with NMR). However, the low concentration that can be used in spectrophotometry – typically 10−5 to 10−4 M – means that in most solvents of sufficiently high permittivity, (here: DMSO, MeCN, DMF, PC, acetone, and occasionally pyridine) ion pairing and homoconjugation are (usually) negligible and pK a values corresponding to equation (2) are measured. The low concentration also enables use of ratios of equilibrium concentrations instead of ratios of activities in equation (10). 10 The possibility of working at low concentrations is a distinct advantage of direct UV–VIS spectrophotometry along with the possibility of directly monitoring the dissociation process. In most cases it is possible to detect side processes, such as decomposition, often also homoconjugation, from the spectra, by monitoring the shapes of the absorption bands and the sharpness of isosbestic points. Because of the possibility of directly observing the processes taking place in solution, UV–VIS spectrophotometry is more suitable than conductometry or potentiometry for determining pK a values that are close to the solvent limits. Impurities that do not absorb in the used spectral range do not disturb direct UV–VIS measurements, even if they are acids or bases.
Important downsides of direct UV–VIS spectrophotometry are that (1) it is not applicable to all compounds; the compound needs to absorb radiation in a suitable range (typically at wavelengths longer than 230 nm) and the spectra of HA and A− have to differ significantly and (2) it is not well suited to solvents with long-wavelength ultraviolet cutoffs (see Table A-4 in Reichardt and Welton 6 ).
Indirect UV–VIS spectrophotometry operates similarly to direct UV–VIS spectrophotometry when the acid HA and a reference acid HAref are titrated simultaneously in the same solution. However, it differs from the direct mode because the spectra of HA or A− are not used. Instead, the [HA]/[A−] ratio is found using the amounts of HAref and Aref − in solution (found from spectra), as well as the concentrations of the solutions and the amounts of titrant added. Indirect UV–VIS spectrophotometry has a broader applicability, both in terms of which HA can be measured (since its spectral properties are not important) and what solvents can be used (if HAref has changes in the UV–VIS spectrum at sufficiently long wavelengths). The obvious downside of indirect spectrophotometry is that the actual dissociation process of HA in the solution is not monitored, and information about side reactions is not obtained. The requirements with respect to the purity of the solvent and substrate are also much higher than with direct UV–VIS spectrophotometry.
3.4 NMR spectrometry
NMR spectrometry observes changes in the NMR spectrum of the acid HA upon its ionization. Usually 1H–, 13C–, 31P–, or 19F-NMR are used. NMR is almost always used as a relative technique, similar to the relative mode of direct UV–VIS spectrophotometry. Under fast exchange conditions (which is the preferred way of working), the [A−]/[HA] ratio is found from the displacement of the chemical shift of a selected atom (reporter atom) in the molecule, where the chemical shift is influenced by ionization. In relative measurements, a reference acid HAref is added to the solution and the chemical shifts of its reporter atom are also recorded. As a result, the difference of the pK a values of HA and HAref (ΔpK a) is obtained. Because of the much higher resolution and discriminating power of NMR compared with UV–VIS spectrophotometry, it is almost always possible to find an HAref whose NMR signals do not overlap with those of HA. Even more, it is often possible to measure ΔpK a simultaneously in the same solution against two different reference acids.
In general, NMR does not distinguish between free anions and BH+A−. 41 Thus, it works according to equation (7). However, when sufficiently low concentrations can be used, ion pairing, as well as homoconjugation can be negligible and pK a values corresponding to equation (2) can be measured directly.
NMR is a more widely applicable technique than direct UV–VIS spectrophotometry, because almost all organic compounds have NMR spectra with at least one of the above-mentioned nuclei, and it is almost always possible to find a suitable reporter atom (which does not necessarily need to be in the immediate vicinity of the acid center 42 ).
NMR is similar to (but more informative than) UV–VIS spectrophotometry in that it “sees” processes occurring in solution. Chemical shifts can be measured with good accuracy, concentrations of compounds are not important (under fast exchange conditions) as long as signals can be measured, and in most cases, impurities do not hinder measurements. These things, put together, enable good accuracy and reasonable results are often obtained, even with impure compounds or when partial decomposition occurs, as long as the signals of the measured compounds are still present and distinguishable. For these reasons, NMR has become increasingly popular for pK a determination, especially by research groups active in organic synthesis.
The main drawback of NMR is that in general it needs higher concentrations than UV–VIS spectrophotometry, which increases the probability of side reactions in low-polarity solvents. Depending on the used nucleus, the concentrations are usually in the range of 10−4 to 10−2 M.
4 Data overview
4.1 General
This compilation is available at the permanent address https://doi.org/10.5281/zenodo.12608876.
At the time of publication, it includes more than 9000 pK a values for close to 5000 uncharged acids collected from around 800 original works published since the middle of the 20th century (the earliest included publication is from 1941).
Although the vast majority of acids included in this compilation are uncharged, ionic acids have been included in some special cases.
Second (in a few cases also third and fourth) ionization constants, i.e., pK a2 values of acids, which are effectively the pK a values of anionic acids, i.e., acids having a negative charge.
Compounds that are generally perceived as acids, although they actually have both acidic and basic properties. Typical examples are amino acids, for which all available data have been included, irrespective of the charge type (e.g., the pK a value corresponding to ionization of the COOH group of most amino acids in DMSO refers actually to a cationic acid, i.e., an acid with a positive charge).
Acids that are cationic, but by their structures are best represented as “acids with charged substituents”. An example is (3-carboxyphenyl)trimethylammonium ion, which can be viewed as benzoic acid carrying the –N(CH3)3 + substituent in the position 3.
Most of the compiled pK a values are experimental. As a rule, computational values have been omitted except where the following conditions were satisfied: (1) the tabulated pK a value is a combination of several values obtained by different routes, e.g., from a number of high-level calculations (possibly combined with experimental evidence) and where the values obtained via different routes agree satisfactorily; (2) the acids are particularly important and (3) there is a reason to believe that for these acids, no reliable experimental value in the respective solvent can be obtained in the foreseeable future. The main reasons for the latter are too high acidity (e.g., the hydrogen halides in DMSO) or too low acidity (e.g., molecular hydrogen).
4.2 Order of data
The acids have been ordered according to the classification algorithm that is based on a structural identifier (see below) and is presented in the “Comments” tab of the data file (see Section 5). The two highest levels of ordering are presented here.
OH acids:
carboxylic acids; aromatic OH compounds; alcohols; NOH acids; SOH acids; POH acids; AsOH acids; other OH acids.
NH acids:
carboxamides, thiocarboxamides; amidines; sulfonamides; phosphonamides; aliphatic amines; aromatic amines; other amines; hydrazines/hydrazones; imines; aromatic heterocycles; other heterocycles; other NH acids.
CH acids:
monosubstituted methanes; disubstituted methanes; trisubstituted methanes; ethynes; carbocyclic CH acids; heterocyclic CH acids; other cyclic CH acids; other CH acids.
SH acids
PH acids
Metal hydrides
Other acids
The presentation follows chemical logic, starting off from the acid center (in compounds with several acid centers: the most acidic one) as the key feature and then splitting the body of data into further groups and subgroups based on their structure. There are 4 classification levels leading to altogether around 200 classes or subclasses. Within subclasses, the compounds are loosely ordered according to their structure.
There are some special situations. The two most important ones are: (1) compounds that markedly tautomerize and (2) compounds that have different acid centers of comparable strengths. Such compounds are located in the tables on the basis of the following considerations.
If there is experimental tautomeric equilibrium data available for a given compound in a given solvent, then the compound is positioned in the group of the most abundant tautomer and other tautomers are listed in the order of decreasing abundance. For example, the extensively enolized 1,3-diketones are typically positioned among alcohols (enols), not ketones. This information refers to solutions in a specific solvent, not to neat compounds.
All forms of amino acids are placed under OH acids, even though the acid center is often –NH3 +.
If there are experimental data in some other solvent or there is some other consideration (e.g., computational data or experimental data for similar compounds), the compound is placed in the group of the most abundant tautomer. However, this is not necessarily the most abundant tautomer in the specific solvent where the pK a is determined. In such cases, the order of tautomers does not necessarily reflect their order of abundance.
In cases when there are no experimental data on tautomer abundance, the compound is positioned to the group where the original authors have deemed it to be. In such cases, the order of tautomers does not necessarily reflect their order of abundance.
Compounds that have different acid centers have typically been positioned according to the acid center indicated by the authors of the original work. Compounds for which there was no such indication were positioned according to the common chemical knowledge and experience of the present authors.
For most compounds, the Chemical Abstracts Service Registry Numbers (CAS RNs; serial numbers assigned to chemical substances), Simplified Molecular Input Line Entry System (SMILES; a text sequence that describes a molecule’s structure) and International Chemical Identifier (InChI; a unique text identifier for a chemical substance) are given and in the majority of cases, for all tautomers. Nevertheless, in some cases, compounds have been placed into groups where they are most commonly anticipated to belong, even if the actual acid center is different from the “canonical” one (e.g., amino acids, as indicated above). However, the names, acid types, CAS RNs, SMILES and InChI strings are given for both tautomers.
Importantly, in the case of compounds that can be present in the solution as mixtures of tautomers, the pK a values correspond to the mixture, not to the individual tautomers, unless specifically indicated otherwise. All in all, in spite of the efforts to give as reliable as possible data on tautomer abundance, such data in this collection should be considered as approximate and mistakes are possible.
4.3 References
All listed pK a values are from the original literature and are supplied with references to the respective original publications. The pK a values initially found from compilations were verified with the original publications. As a special case, the large body of unpublished DMSO pK a data from the F.G. Bordwell group (approximately 300 values, some of which are available at the website compiled by H.J. Reich 22 ) has been included in this compilation, although those pK a values have not been published in peer-reviewed publications.
If the same pK a value from same author(s) is given in several publications, then usually the earliest publication – where the experiments were actually performed – is cited in the compilation. If author(s) have corrected the earlier value without performing new experiments, e.g., due to the change of pK a values of reference or calibration compounds, modification of data treatment model, taking into account association or counter-ion effects, then this new value is included as a separate entry.
References that contain only tautomer abundance data are given in parentheses.
4.4 Critical evaluation of data
The collected pK a values have been critically evaluated. In some cases, corrections have been made (see below). In cases when the original publication presented insufficient detail but there is evidence that the presented pK a values may be inaccurate, the values are marked as “doubtful”. If the evidence is very strong (i.e., the present authors are essentially convinced the reported value is inaccurate), then it is marked as “unreliable”. Unreliable values are typically thought to be in error by several pK a units.
Although obviously inaccurate, we have retained the unreliable values in the table, mainly for two reasons. (1) Although these data are of low quality, they can still be of some help if one knows how to use them. For example, the relative order of strength of acids determined in the same work may still be correct, even if all the values are biased by several units. (2) Even more importantly, having the article cited and the reported values flagged as “unreliable” gives the potential user a clear warning and should minimize time-wasting “rediscovery”.
It is important to note that in spite of the critical approach and corrections, it is not always possible to reach a firm conclusion as to which of the published pK a values of a compound is the most reliable.
Consistent with the present critical evaluation, approximate or less reliable data are flagged and pK a values in a given solvent are mutually comparable (except in tetrahydrofuran, see below). We considered the following aspects during our critical evaluations.
Does the presented pK a value have the claimed physico-chemical meaning? For example, if dissociation according to reaction 1 is claimed, is there evidence that ion pairs are not involved (or have been taken into account)? In cases when there is a reason to doubt this, the corresponding values are marked as “doubtful”. Specifically, if in low-permittivity solvents ion pairing was neglected, then the obtained values are typically marked as “doubtful”, unless there was evidence that neglect of ion pairing was justified.
How has the measurement system been calibrated in terms of a(H + )? Estimation (usually using the Bates–Guggenheim convention) of a(H+) in non-aqueous media is difficult and is one of the largest uncertainty sources of non-aqueous pK a values. Therefore, usually reference compounds with known pK a values are used for calibration. If none was mentioned or no information was given about calibration we almost always considered the values as “doubtful”. The selection of the reference compounds and their pK a values served to determine the traceability – based on which “scale” values are presented. A good example is in DMSO where 9-phenyl-9H-fluorene (9PF) is frequently used as a standard by both the Bordwell 36 and Petrov–Shatenshtein 43 groups. However, the pK a values that these groups use are different (17.9 and 18.5, respectively) due to different definitions. Such situations were typically handled by corrections, as explained below, separately for individual solvents. A special case is using reference compounds of different charge type, e.g., cationic acids for the calibration of pK a measurements of uncharged acids or for direct comparison with pK a values of uncharged acids. If the charge types do not match and activity coefficients are not explicitly used, we have typically marked such values as “approximate”. In some works, the potentiometric system was calibrated in water and thereafter measurements were carried out in non-aqueous solvents with the same electrode system. The pK a values obtained in such works often differ from other authors by several units. Such values were marked as “doubtful” or “unreliable”.
Are the pK a values of the reference compounds close to the measured values? A frequent problem that occurs with, e.g., potentiometric measurements is that the electrode system is calibrated in a narrow pa(H+) range, e.g., 1 to 5, and thereafter pK a values are measured in a much wider range (up to, e.g., 20), requiring a lengthy extrapolation. Such a situation was usually considered a valid reason for marking the affected values as “doubtful”. Exceptions were occasionally made if the acids in question were measured more reliably in other work(s) and the results were either in good agreement with those from the work under question or could be used after correction.
Was the ionization ratio for the pK a calculation measured directly (from UV–VIS spectra, NMR shifts, or similar approaches)? Direct monitoring of the ionization ratio, as opposed to obtaining it indirectly (as the ionization ratio of a reference compound via ΔpK a measurements or pH measurements in solutions of very strong acids or bases in given solvent, or conductance), is generally more reliable. Indirectly obtained ionization ratios may be affected, to an unknown extent by the solvent impurities (e.g., acidic or basic impurities in the compound of interest or titrants), incorrect assumptions, etc. As an example, several sulfonic acids, HCl, and HBr have been measured in DMSO 44 using conductance, without monitoring the actual ionization state of the molecules. pK a values well above zero were obtained. At the same time, there is strong evidence that most of these compounds are strong acids in DMSO with pK a values below zero. 45
Was the concentration used sufficiently low (given the polarity of the solvent)? As discussed above, low concentrations are important for suppressing ion association and/or homoconjugation processes. 33 The importance increases with decreasing solvent polarity. If such association processes have been considered appropriately when calculating the pK a values from the measured data then that is of course fully acceptable.
Was the solvent appropriately purified and dried? Water strongly influences acid-base properties in non-HBD solvents, even if present in trace amounts. The two main effects of traces of water are (1) selective solvation/stabilization of H+ and (2) selective solvation/stabilization of the anion. The typical effects of using insufficiently dried solvents are (1) lowering the pK a values (water supports acid dissociation) and (2) compression of the pK a scale.
Is the pK a value within the conveniently accessible range of the chosen solvent? The conveniently accessible pK a ranges of the individual solvents (if available) are given below. Values of pK a can be measured (or estimated) outside these ranges but are typically less reliable. This criterion was in some cases further supported by looking at the odd behavior of particular values in inter-solvent correlations. Examples of this are the reported pK a values between 1 and 3 above zero. In several cases, the actual pK a values of such acids are in fact around or less than zero.
Is difference between pK a values of the same compound in different solvents consistent with available knowledge of the solvation energies of the species present in those solvents? In some cases, solvation energies of the species present in different solvents 46 , 47 or the transfer energies of the acid or anion of interest between solvents 25 are available. Such data enable approximate estimates of differences in the pK a values of a given compound between these solvents. The uncertainties of solvation energies are typically high compared to good-quality pK a values, but solvation energies can still offer useful insights (e.g., see the MeCN, DMF, and PC sections below). For example, the pK a values in MeCN are usually by 9 to 12 pK a units higher than those in DMSO. Values outside that range can be found, but it is highly unlikely for any acid to have similar pK a values in MeCN and DMSO.
Does the pK a value follow common chemical intuition? If the compound under question is part of a family of compounds with similar structure (e.g., phenols, benzoic acids, sulfonamides, etc.,) and if pK a values are available for some other members of the family, then inference can be made as to whether the pK a value follows the general chemical logic. For instance, introducing electron-withdrawing substituents into acid molecules is unlikely to make pK a higher. Obviously, care is needed with such inference because situations where the common chemical intuition does not hold (e.g., due to steric reasons) do exist.
If the experiments appear to have been made correctly but the pK a values of reference compounds or calibrants used differed significantly from our “best estimates” (see below), then we give the corrected pK a value but include the original pK a with the comment (<original value>, corrected by < correction value>). For example, the (relative) pK a of 9PF in DMSO, frequently used as a reference acid, is often taken to be 18.5. 43 However, the “best estimate” is 17.9 (see below), so such values have been adjusted by −0.6 to make them comparable. In some cases, we have used correlation analysis within a series of substituted compounds to obtain a corrected pK a value for an aberrant value. This is possible when a series of independent reliably-determined pK a values exist. Reasons for choosing particular reference pK a values are given below for specific solvents. It is important to note that in spite of our effort, this critical evaluation did not always lead to clarity as to which of the several published pK a values for the same compound in the same solvent is closest to the true value.
The number of significant figures for pK a values are typically those claimed by the original authors. Some special cases are explained below with individual solvents.
5 Description of the data tables
The data are presented in Microsoft Excel Workbook (XLSX) files. The XLSX “pKa_Data_Table” data file consists of six sheets: “pKa Data”, “Comments”, “References”, “Measurement uncertainty”, “How to cite”, and “Statistics”. The contents of the pK a Data sheet are explained here (with brief comments on measurement uncertainty in the comments to “labels related to reliability”). The remaining sheets are self-explanatory. We have also provided an XLSX file “pKa_Dictionary”, which lists all of the unique acids that are in the data table. The dictionary includes chemical identifiers for each compound and an image of their molecular graphs, with acid centers highlighted wherever applicable. These images were generated using RDKit version 2023.03.3 48 based on the structures encoded by the SMILES strings provided in the dataset.
Columns in the pK a Data sheet :
For a given compound, the table lists the pK a values in all of the selected solvents, where available. The order of solvents is that shown on page 1 of this review: DMSO, MeCN, DMF, pyridine, acetone, PC, and THF.
Column “Number” – Order number.
Column “Compound” – The names of the acids HA. The used names were typically those proposed by SciFinder. If the main name given in SciFinder according to the CAS RN was too long or complicated, then one of the alternative names was used. In the case of compounds with chiral centers, the optical configurations are reported as given by the authors of the original reports. No attempt was made to establish whether they are absolute or relative configurations or to convert them in any way.
Column “CAS” – Chemical Abstracts Service (CAS) Registry Number (RN) for acid HA listed in column “Compound”. The ultimate basis for identifying the compounds was the CAS RN, whenever possible.
Column “Canonical_SMILES” – SMILES strings are widely used chemical identifiers that encode the structures of molecules as 2D graphs. The SMILES strings are not unique, i.e., several different strings can correspond to the same molecular graph and are therefore not intended for compound look-up. However, they present a compact and descriptive way for describing structure and are commonly used in cheminformatics. The “Canonical” label here indicates that the SMILES strings have been standardized according to cheminformatics package RDKit. 48 However, note that several different standards exist for canonicalization, and this label is not intended to suggest a universally-accepted standardization. The majority of these strings was generated programmatically by translating the compound names using rules-based algorithm OPSIN 49 (implemented in Python wrapper py2opsin 50 ), ChemAxon’s Molconvert software, and the PubChem database, checking for agreement among all three of them. These were further checked for consistency with the identifier information corresponding to the CAS RNs obtained from CAS SciFinder. In the case where there was not full agreement among the methods, we manually checked the SMILES structures for accuracy.
Column “Isomeric_SMILES” – These are SMILES strings as above, but include stereochemical information if applicable.
Column “Atom-mapped_SMILES” – These are variants of canonical SMILES strings that also include numerical labels for all non-hydrogen atoms.
Column “Acid_center_index” – It indicates which atom is the acid center and corresponds to the atom index in the atom-mapped SMILES. When combined with atom-mapped SMILES, this information allows for convenient indexing of the acid centers using cheminformatics software. Note that such sites cannot be always determined, in which case the label “NF” is provided.
Column “InChI” – InChI strings, which are chemical identifiers developed by IUPAC that encode chemical structures in a unique searchable format. In this work, standard InChI strings are presented, which by default do not distinguish between tautomers.
Column “InChIKey” – InChI keys are compact alternatives to InChI strings. Similar to InChI strings, these are intended to be unique identifiers that allow for species look-up. Both the InChI strings and InChI keys were generated from their canonical SMILES strings using RDKit.
Column “Internal_ID” – An internal ID corresponding to each unique compound.
Columns “Main”, “L1”, “L2 and “L3” – Class and subclass identifiers.
Column “XYZ_pK a ” – pK a value for the acid HA in solvent XYZ.
Column “XYZ_Ref” – literature source for the pK a value of the acid HA in solvent XYZ.
Column “XYZ_Comments” – Conditions, comments: method, temperature in °C, water content, ionic strength used for the pK a measurement and, where relevant, corrections and reliability in solvent XYZ (see details below). In many cases not all of these data are available.
Some compounds in the data table include multiple tautomers - for instance, “4-Hydroxytetrafluoropyridine + 2,3,5,6-Tetrafluoro-1H-pyridin-4-one”. In these cases, SMILES strings, acid center indices, InChI strings, and InChIKeys for all tautomers are provided, wherever possible.
At the time of submission, not all compounds have had their SMILES strings and acid centers elucidated. Approximately 150 SMILES strings and 500 acid centers have not yet been determined. Such missing structure codes are indicated by “ND” in the dataset. On the other hand, acid centers that correspond to valid SMILES but could not be unambiguously determined include “NF”. Future versions of this work will focus on clarifying these values.
Columns “Ref”:
All data included in the table are supplied with references to the relevant original publication(s) listed in the “References” sheet. Each reference is characterized by two symbols denoted by the capital letter of the surname of the first author and by number showing the reference sequence of names of the first authors with the same capital letter. For example: Ref C1 is M.K. Chantooni, Jr., I.M. Kolthoff, J. Phys. Chem. 79 (1975) 1176.
Columns “Comments” :
In the third column for each solvent, a range of additional information is given.
Technique: the technique by which the dissociation constants were measured is shown by the following abbreviations:
- C
-
Conductometry
- Pot
-
Potentiometry
- UV
-
UV–VIS spectrophotometry
- IR
-
Infrared spectrophotometry
- V
-
Voltammetry
- Cal
-
Calorimetry
- DVP
-
Differential vapor pressure
- X NMR
-
Nuclear magnetic resonance with nucleus X
- CE
-
Capillary electrophoresis
- EPR
-
Electron paramagnetic resonance
- PMV
-
Photomodulation voltammetry
Some other approaches (estimated, combined, etc.) have also been used and their designations are self-explanatory.
Temperature: Temperature is expressed in °C but is listed only when it differs from 25 °C.
Water content: Water content in solution, if determined by Karl Fischer titration, gas chromatography, or some other appropriate method and was between 1 and 2 mM (i.e., between 15 to 20 and 30–45 mg kg−1, depending on the solvent density) was considered acceptable for pK a measurements in the present solvents and for pK a measurements in non-aqueous solvents in general. Water content is shown in the table only when the reported value was greater than 2 mM or less than 1 mM. In many cases, water content was not explicitly determined but solvent drying was described or the reader was referred to an earlier publication from the same group describing the drying. If the drying procedure was convincing, then water content was not indicated. If the description was not convincing or no information was provided, this is indicated by “ND”.
Ionic strength: The ionic strength, denoted as “I”, is shown in mmol dm−3 (mM). In the case of approximate ionic strength, the “∼” symbol is used instead of “ = ”. When the ionic strength was close to zero or the pK a was corrected to zero ionic strength using the Debye–Hückel or similar equation, then the value of the ionic strength is either not shown or denoted as “→ 0”.
XX corrected by YY: This comment means that the reported pK a value was obtained from the original value XX by correcting it with a correction of YY, as explained above.
Label “Combined value”: values obtained by combining different approaches (e.g., quantum chemical calculations, solvation energies, bond dissociation energies).
Label “per hydrogen”: This label indicates that pK a values of acids that have n equivalent acidic hydrogen atoms (e.g., 9H-fluorene or benzene-1,2-dicarboxylic acid (phthalic acid) have n = 2; toluene has n = 3) have been corrected in order to eliminate the “statistical advantage” – higher probability of acid dissociation because of higher number of such hydrogen atoms – of such acids compared to similar acids where there is only one such hydrogen atom (e.g., 9-methyl-9H-fluorene or 2-(ethoxycarbonyl)benzoic acid (phthalic acid monoethylester), respectively). Such correction makes sense if the pK a values are used for elucidating substituent effects.
Labels related to reliability of the values. It is impossible to assign concrete uncertainty estimates to specific pK a values in the collection just on the basis of the data available in the original publications. Thus, we have instead opted for labeling values with reliability above or below the average (values with average reliability carry no label) with “preferred”, “doubtful” and “unreliable” as described below. In addition, the sheet “Measurement uncertainty” in the data file presents possible average uncertainty estimates (actual uncertainties of individual published values can be either lower or higher) of the pK a values with different labels in different solvents.
Label “preferred”: Denotes the pK a value, which, according to the judgement of the present authors, is currently the most reliable of the available values. See additional comments below in the sections of specific solvents.
Label “doubtful”: Denotes a doubtful value, i.e., such, where it is likely that the value is seriously in error (typically by more than one pK a unit) and that this likelihood is not recognized by the original authors.
Label “unreliable”: Denotes a value which is very likely dramatically erroneous, by several pK a units. Such values have been kept in this collection mainly for warning the users not to use them.
Labels “estimated value”, “approximate”, “extrapolated”: values obtained using different estimation or approximation approaches. These can be of low accuracy, but the authors of the values have recognized that the accuracy is low.
There are some other comments in this column, which are self-explanatory.
Filtering the data
The table can be easily filtered in commonly-used spreadsheet programs via any of the columns using the filter buttons (often displayed as “▾”) beside the column titles. Some examples:
Filtering via column “L2” by typing “ketone” into the search box enables all compounds that have been classified as ketones to be seen.
Filtering column “DMSO_Ref” by typing “B21” into the search box enables all values from ref. B21 to be seen.
Using the MeCN pK a column numerical filter “less than” and typing 7 enables all MeCN pK a values that are below 7 to be seen.
6 Information about specific solvents
6.1 Dimethyl sulfoxide (DMSO)
Because of the relatively high permittivity and solvating ability of DMSO, acid dissociations in this solvent proceed according to equation (2), essentially without side processes. The Bordwell pK a scale, termed as “absolute” in Matthews et al., 36 serves as the primary reference for pK a values in DMSO in this compilation. That scale has been built on the basis of a set of reference compounds (Table V in Matthews et al. 36 ) assuming fixed pK a values. In general, the pK a values measured by the Bordwell group were considered the most reliable throughout this compilation. However, not all of Bordwell’s data have been denoted as preferred. If values from the Bordwell group were not available, then those of other groups related directly to the Bordwell scale were considered the most reliable. Values measured against references with explicitly different pK a values (see below) were adjusted to be comparable with the Bordwell values.
The pK a values of the Bordwell scale have been published as a rule with one decimal place. Thus, acids measured against (or corrected using those values) cannot have a better accuracy, especially as most reported measurements are less accurate than those made by the Bordwell group. Accordingly, such values are listed with just one decimal place.
The reliable range of pK a values in DMSO is approximately between 2 and 30. As a solvent DMSO has a high basicity (electron-pair donor ability). This is evidenced by, among other factors, the highly negative transfer Gibbs energies of H+ from water to DMSO (−19 kJ mol−1) or from MeCN to DMSO (−65 kJ mol−1). 25 DMSO is thus well suited for pK a measurements of weak acids. Strong acids are fully ionized in DMSO. Nevertheless, several literature sources claim pK a values around or above zero for acids such as HCl, HBr, and even trifluoromethanesulfonic acid (CF3SO3H). 21 In the light of a recent study on the acidities of strong acids in solution, 45 it is possible to state that the pK a values of all such acids in DMSO are negative. This is also supported by looking at the pK a values of such acids in acetonitrile and the transfer Gibbs energies from acetonitrile to DMSO of H+ (see above) and of some anions (mostly up to few kJ mol−1 25 ).
Thus, similar to water, accurate measurement of near-zero pK a values in non-aqueous solvents is difficult and any reported “near-zero” pK a values of such acids, for which alternative evidence points to negative pK a values, have been marked as doubtful or unreliable.
Specific comments on the works of some groups
As noted above, the “absolute” spectrophotometric pK a scale from the Bordwell group is the primary reference for pK a values in DMSO, both because of the very large number of pK a values determined using the same approach and because of the high quality of their data. The potentiometric values of a number of groups (Pytela, Kulhanek, Koppel, etc.) are considered consistent with the Bordwell scale since they use Bordwell’s pK a values to calibrate their potentiometric systems.
The pK a values from the Kolthoff group have generally been obtained either conductometrically, potentiometrically (with glass electrodes) or (sometimes) spectrophotometrically. 51 , 52 In some cases, several techniques were used to increase the reliability. Some of the pK a values from the Kolthoff group were corrected to align them with the Bordwell scale.
The Petrov–Shatenshtein group take the pK a value of 9-phenyl-9H-fluorene (9PF) as 18.49, which is based on the H– scale (measured in mixtures of DMSO and aqueous tetramethylammonium hydroxide), 53 as their primary reference. The H– concept was an attempt to expand the aqueous pK a scale by successively adding more organic solvent to the aqueous solution of tetramethylammonium hydroxide acting as an OH− source. By means of a series of indicator acids, apparent pH values were derived from the acid dissociation equilibria of appropriate indicators. Thereby, the estimates of aqueous pK a values for weak indicator acids like 9PF (practically insoluble in pure water) could be obtained by extrapolation of aqueous solvent acid dissociation equilibria. The Petrov–Shatenshtein group used the extrapolated aqueous pK a for 9PF 18.49 as the definition value for the “relative” pK a values in all solvents. The rationale behind this is that this compound has good UV-spectral properties, and its anion has highly delocalized charge. For more detail on the H– scale, see Stewart and O’Donnell 54 and Shatenshtein and Shapiro. 55 The absolute pK a of 9PF in DMSO according to Bordwell is 17.9. The pK a values obtained by the Petrov–Shatenshtein group are generally of high quality and were in this compilation typically adjusted by −0.6 or in some cases by the pK a difference of some reference acid that is included in both the Bordwell and Petrov–Shatenshtein DMSO pK a scales in order to align them with the Bordwell scale.
6.2 Acetonitrile (MeCN)
Because of the reasonably high polarity of acetonitrile, acid dissociation in this solvent proceeds according to equation (2) without significant interference from side processes, provided: (1) concentrations are below 10−2 M 56 and (2) the anion formed upon dissociation does not have a highly localized charge. As mentioned above, acetonitrile is significantly less basic (lower electron-pair donating ability) than DMSO. As noted above Δtr G°(H+ MeCN→DMSO) is −65 kJ mol−1, 25 which corresponds to roughly 11 orders of magnitude difference. This implies that the pK a value for the same acid in acetonitrile should be, depending on anion solvation effects, greater by 9–12 than in DMSO. This is indeed what is mostly observed. As a result, acetonitrile is well suited for studies of relatively strong acids.
The primary standard substance for the pK a values of acids in acetonitrile is 2,4,6-trinitrophenol (TNP, picric acid) with pK a = 11.0 as determined using three independent approaches (conductometry, potentiometry, and spectrophotometry). 57 As a result, the pK a value of TNP can be considered reliable, which, together with good spectral properties, justifies its use as reference compound. Values either directly related to TNP or measured in reference to a pK a scale set up using TNP, most recently revised in 2021, 58 are considered the most reliable and not needing revision. The pK a values of acids in ref. 58] range from 3 to 28. These values were regarded as reference values when evaluating data from other authors, which were revised if needed.
A pK a range between 0 and 34 can be considered experimentally accessible in acetonitrile, with the range of 1–30 considered to be reasonably reliable. The upper limit of accessible pK a values in acetonitrile is caused by the self-condensation (Thorpe reaction) of acetonitrile. 59 This reaction leads to the formation of dimer 3-aminobutenenitrile, to trimer 2-amino-4,6-dimethylpyrimidine and to a tetramer 60 which can act as buffer substances in the high pK a range. It seems that these condensation reactions are dependent on the counterion. Soft cations like phosphazenium ions allow pK a measurements of reasonable quality up to at least 33. 61
6.3 N,N-Dimethylformamide (DMF)
The Gibbs transfer energy of H+ from water to DMF is −14 kJ mol−1, 26 which is less negative than but still similar to the value from water to DMSO. Transfer energies of anions between water and these two solvents are also similar. DMF is thus well suited for acidity measurements of weak acids, and the pK a values measured in DMF are not expected to be very different from DMSO and are usually somewhat higher.
One should be cautious when evaluating pK a values of strong acids (hydrogen halides, 2,4,6-trinitrophenol, etc.) in DMF. In particular, 2,4,6-trinitrophenol (picric acid) is too strong an acid in DMF to be a reliable anchor compound or calibrant in potentiometry. Its published pK a values in DMF range from 3.7 to complete dissociation (i.e., with pK a ≲ 1). Nitro- and dinitro-phenols have pK a values that are more convenient and these are preferred as calibrants (reference compounds) for potentiometry and for evaluating the need for corrections of the data from particular literature sources. Quite common calibrants in DMF are benzoic acid (pK a ≈ 12.3) and 2-hydroxybenzoic (salicylic) acid (pK a ≈ 8.2). Acetic acid (AcOH) pK a ≈ 13.5 is close to the 13.2 obtained by combining its pK a in water (4.8) with Δtr G°(H+ H2O → DMF)(−18 kJ mol−1) and Δtr G°(AcO− H2O → DMF)(66 kJ mol−1). Using transfer Gibbs energies of ions for hydrohalic acids (aqueous hydrogen halides) yields pK a estimates of −0.6 for HCl (published values 1.4 to 8), −5.6 for HBr (published values 1.8 to complete dissociation), and −9.1 for HI, all being much lower than the published experimental values. These estimates are approximate and rely on the assumption that the neutrals are solvated equally in water and DMF, but they should be treated as a warning sign with respect to the pK a values of hydrohalic acids in DMF.
Data on weak acids from the groups of Kolthoff, Juillard, Demange-Guerin, Pytela, Ludwig, Bartnicka and Petrov are considered reliable and consistent by the present authors and do not need adjusting. The preferred values in DMF typically come from these groups. Values published by several authors from the former USSR (Butin, Aksenenko, etc.) and some others can be corrected in a reasonable way.
6.4 Pyridine
Pyridine is the most basic of the solvents being considered in this review and at the same time the second-least polar (Table 1). Because of its high basicity, pyridine favors the ionization of acids (HA). However, because of its low permittivity, some of the A− produced, depending on concentration, can be in the form of ion pairs SH+A− or BH+A− instead of free ions. There are very few works that separately determined K i and K d. It has, nevertheless, been demonstrated by careful measurements using three independent techniques (potentiometry, differential vapor pressure, and UV–VIS spectrophotometry) 62 that TNP and dinitrophenols dissociate to free ions at sufficiently low concentrations (suitable for spectrophotometry). In part, this may be because the SH+ (pyridinium) ion is large and has a delocalized charge (compared with, e.g., conjugate acids of acetone or acetonitrile), which to some extent suppresses ion pairing. The pK a value of TNP was determined by three independent methods as 3.0 and was demonstrated to be a free-ion pK a (equation (2)). 62 This pK a value of TNP can be regarded as the primary reference pK a value in pyridine.
When looking at transfer Gibbs energies of ions from water to pyridine then it is useful to compare them with DMSO. Thus Δtr G°(H+, H2O → pyridine) is by approximately 9 kJ mol−1 more negative than in the case of H2O → DMSO. At the same time, Δtr G°(A−, H2O → pyridine) are sometimes lower and sometimes higher than from water to DMSO. Note however that transfer Gibbs energies are less reliable in low-permittivity solvents, such as pyridine, because low permittivity hinders dissociation of ion pairs to free ions. Nevertheless, assuming Δtr G° of neutrals are small compared with those of ions, and that at low concentrations ion pairs in pyridine dissociate, the pK a values in pyridine and DMSO are expected to be not too different. This is what is mostly observed when looking at the data.
6.5 Acetone
The transfer Gibbs energy value Δtr G°(H+ H2O → acetone) of the hydrogen ion and its Gibbs energy of solvation in acetone are not known but an estimate of Δtr G°(H+ H2O → acetone) 29 kJ mol−1 is presented in Table 1. This is by ca. 17 kJ mol−1 less positive than in the case of acetonitrile. Basicity (electron-pair donor) parameters, such as β, 24 also suggest that acetone is somewhat more basic than acetonitrile. At the same time, its relative permittivity (Table 1) and anion-solvating ability 25 are lower. Thus, Δtr G°(X− H2O → acetone) are on an average 6 kJ mol−1 more positive for the halide ions, compared to acetonitrile. Consequently, pK a values in acetone are expected to be similar or somewhat lower than those in acetonitrile. This is indeed observed in most cases.
pK a of 2,4,6-trinitrophenol (TNP) in acetone has been determined with great care 63 using a similar approach to that adopted for acetonitrile, 57 with two methods (UV–VIS spectrophotometry and potentiometry). The pK a values obtained were 9.26 (UV–VIS spectrophotometry) and 9.2 (potentiometry). Most of the data from Czech authors (Ludwig, Pytela, etc.) are related to the average TNP pK a value of 9.2 and this pK a value of TNP can be considered as the primary reference pK a value in acetone. Whenever possible, the data from other works were corrected, to be consistent with these Czech authors. The same authors have determined the pK a of benzoic acid as 18.2. However, in a number of works, the pK a of benzoic acid was found to be much lower. Such a systematic shift can be corrected by adjustments ranging from +5 to +8, these corrections are very large and we do not have information on the possible contraction of the obtained pK a ranges. Accordingly, such values, even if corrected, were typically marked as doubtful or unreliable.
6.6 4-Methyl-1,3-dioxolan-2-one (propylene carbonate, PC)
PC and acetonitrile are rather similar solvents from the point of view of acid dissociation. Both have sufficiently high permittivities to support dissociation of ion pairs to free ions, although that of PC is markedly higher. Their basicities are similar. The transfer Gibbs energy Δtr G°(H+ MeCN → PC) is ca. 4 kJ mol−1, 25 indicating that MeCN is slightly more basic. Their β parameters are also very similar: MeCN 0.37 versus PC 0.40. The values of Δtr G°(X− MeCN → PC) are just a few kJ mol−1 negative 25 for most anions. These things put together mean that unless there is a significant difference in solvation of some anions or neutral species, the pK a values in acetonitrile and PC are expected to be similar.
In most reports, the primary reference for the pK a measurements in PC has been the pK a value of TNP 9.3. 64 However, there is another serious work reporting the pK a of TNP as 11.4. 65 Given the pK a of TNP in MeCN (11.0) and the similar properties of the two solvents, both of these values are realistic (a third value 6.9 published in Srivastava and Mukherjee 66 is unrealistic). There are factors that support either value. In Talarmin et al. 65 the solvent was drier {20 mg (H2O) kg−1 (PC) as opposed to 50 mg (H2O) kg−1 (PC) in Izutsu et al. 64 }, and the pK a value is higher (water content tends to lower pK a values in non-protogenic solvents, especially in those having low basicity). If the basicities of these solvents are similar, then the pK a values can also be expected to be similar. On the other hand, in Izutsu et al., 64 the experiment is much more carefully described, while in Talarmin et al., 65 the description of the measurement of pK a(TNP) is essentially missing. The same group who published “Acid-Base Equilibria of Some Acids in Propylene Carbonate” 64 has previously determined pK a(TNP) = 11.0 in MeCN. The pK a of 9.3 for TNP in PC is additionally verified by 3,5-dichloro-2,4,6-trinitrophenol (with pK a measured using two independent methods). It is also unlikely for an increase in the water content from 20 to 50 mg (H2O) kg−1 (PC) to decrease of pK a by 2 units.
Thus, both pK a values 9.3 and 11.4 have some support and at this time, we are unable to prefer either. Accordingly, we did not make changes to the values of other authors who used the pK a value of 9.3 as the reference value for their measurements.
6.7 Oxolane (tetrahydrofuran, THF)
Of the solvents included in this compilation, THF has the lowest permittivity (Table 1). As a result, the deviation of the physico-chemical meaning of the measured values from equation (2) is the largest in THF. Only a handful of reports took specific care to ensure and demonstrate that the published values corresponded to equation (2). Another set of values, reported mostly by the Barbosa group are the so-called “overall dissociation constants” K a d, corresponding to equation (6).
The majority of the reported values in THF are relative ion-pair pK a values (pK aip values), measured relative to specified indicator acids, and belonging to certain “scales”. Such scales differ not only by their points of origin but also by the fundamental meaning of the values. They are anchored in different ways, sometimes to pK a values from other solvents (e.g., DMSO). Not all authors discuss whether ion pairing is accounted for or not. If (1) the pK a of the reference acid is a free-ion value, (2) the measured and reference acid are not too different and (3) the counterion is inert and has a delocalized charge, then the differences between free-ion pK a values and pK aip values are similar, because the ion pairing largely cancels out. The counterion does, however, have an influence on pK aip values. The most frequently encountered counterions are Cs+, the [2.1.1] cryptate complex of Li+ (CAS RN 31250-06-3) and the 18-Crown-6 complex of K+ (CAS RN 17455-13-9).
The most important ion-pair pK a (pK aip) scales are:
Streitwieser’s Li+ 67 and Cs+ 68 scales. Most of the work has been done according to the revised scales 67 , 68 that are anchored to the pK aip of 9H-fluorene, defined as 22.90 for both scales. 69 In earlier works, different anchoring was used. In the present data table, where possible, the values have been corrected to align them with the revised scales. 67 , 68 Importantly, the Streitwieser group often reports the acidity values on “per hydrogen” basis and wherever this is the case, the values are labeled as “per hydrogen” in the present data table.
Antipin’s Li+ cryptate scale (see Antipin et al. 31 for a summary). Earlier values were anchored to the pK a of 9PF in DMSO (18.5). More recent values are anchored to 9PF relative to DMSO (pK a = 17.9 21 ). The earlier values have been adjusted in this compilation to align them with the revised values. It has been established that ionized acids in THF exist almost exclusively as 1:1 ion pairs with the lithium cryptate ions. Monomeric 1:1 ion pairs are the main species under the experimental conditions. 31
Fraser’s Li+ scale is based on the pK a values of 35.7 and 37.3 of diisopropylamine and 2,2,6,6-tetramethylpiperidine as acids. 70 In principle, the scale could be aligned with the Streitwieser Li+ scale (by subtracting 1.5 from all values), but it was decided not to do that in this compilation as there is only one common compound (9H-fluorene) between the two scales.
The Morris group reports estimates of free-ion pK a values (denoted in their works as pK α). These values are derived from measured relative ion-pair values (using different counterions) and corrected for ion pairing using the Fuoss equation (with computationally estimated ionic radii). 71 The pK α = 9.7 of tricyclohexylphosphanium tetraphenylborate {[HPCy3]BPh4} is used as anchor value. Such corrections are certainly approximate but facilitate development of a consistent set of values.
The values from Streitwieser (Li+, revised) and Antipin (Li+, revised) scales are similar and can be used interchangeably for practical applications not needing high accuracy. However, as a general rule, the shift between values from different scales is not constant and depends on the nature of the anions. Therefore, in this compilation, no translation was attempted between the scales in THF and the scale is indicated in the comments column of the pK a table.
7 Summary
The present compilation of dissociation constants of neutral acids in dipolar non-hydrogen-bond-donor (non-HBD) solvents (also known as dipolar aprotic/non-protogenic solvents) has been prepared under the auspices of the International Union of Pure and Applied Chemistry (IUPAC). Its main aim is to provide a comprehensive and critically evaluated pool of pK a data of acids and bases in selected non-aqueous solvents. This paper on pK a data of uncharged acids in dipolar non-HBD solvents is the first part of a planned series of four compilations. Planned are also compilation of data on i) uncharged bases (cationic acids) in dipolar non-HBD solvents, ii) uncharged acids in protogenic solvents, and iii) uncharged bases (cationic acids) in protogenic solvents.
Membership of the Sponsoring Bodies
Membership of IUPAC Analytical Chemistry Division
President: Derek Craston. Past President: David Shaw. Secretary: Luisa Torsi. Titular Members: Jiri Barek; Raychelle Burks; Franziska Emmerling; Hongmei Li; Vanessa Peterson; Slavica Ražić; Aura Tintaru. Associate Members: Erico Marlon de Moraes Flores; Ivo Leito; Fabiana Piscitelli; Thalappil Pradeep; Malarvili Ramalingam; Takae Takeuchi. National Representatives: Resat Apak; Vasilisa B. Baranovskaia; Patricia Forbes; Gábor Galbács; Nives Galic; Purim Jarujamrus; Ilya Kuselman; Mariela Pistón; Danny van Oevelen; Susanne Wiedmer. Emeritus Fellows: D. Brynn Hibbert; Jan Labuda; M. Clara F. Magalhães.
Funding source: Eesti Teadusagentuur
Award Identifier / Grant number: PRG690
Funding source: European Metrology Programme for Innovation and Research
Award Identifier / Grant number: 17FUN09
Funding source: Haridus- ja Teadusministeerium
Award Identifier / Grant number: TK21
Funding source: International Union of Pure and Applied Chemistry
Award Identifier / Grant number: 2015-020-2-500
Acknowledgments
This work was carried out using the instrumentation at the Estonian Center of Analytical Chemistry (www.akki.ee). We acknowledge ChemAxon for providing a free academic license to their molconvert software. We are deeply indebted to an outstanding chemist, who did not wish to be included among the authors or be named in Acknowledgments, for his significant contributions to this collection. We thank Prof. Glenn T. Hefter for his numerous suggestions regarding the manuscript, Dr. Leah R. McEwen for her help with data management issues and Ivika Pall for her help with finding some literature references.
-
Research ethics: Not applicable.
-
Informed consent: Not applicable.
-
Author contributions: All authors have accepted responsibility for the entire content of this manuscript and approved its submission.
-
Use of Large Language Models, AI and Machine Learning Tools: Large Language Models, AI and Machine Learning Tools were not used.
-
Conflict of interest: Authors state no conflict of interest.
-
Research funding: This research was initiated and supported by IUPAC in the framework of the project 2015-020-2-500. It was additionally funded from the EMPIR programme (project 17FUN09 “UnipHied”, www.uniphied.eu) co-financed by the Participating States and from the European Union’s Horizon 2020 research and innovation programme, by the Estonian Research Council grant (PRG690) and by the Estonian Ministry of Education and Research (TK210). JFG acknowledges the Université Côte d’Azur and CNRS for continuous support. JWZ acknowledges financial support from a Takeda Fellowship. MR acknowledges continuous support during the project by grants CTQ2014-56253-P, CTQ2017-88179-P, PID2020-115374GB-I00, PID2023-150245NB-I00 funded by MICIU/AEI/10.13039/501100011033 and by “ERDF A way of making Europe”.
-
Data availability: The data are available at the permanent address https://doi.org/10.5281/zenodo.12608876.
References
1. Hibbert, D. B., Ed.; Compendium of Terminology in Analytical Chemistry, 4th ed; The Royal Society of Chemistry: London, 2023.10.1039/9781788012881Search in Google Scholar
2. Bell, R. P. The Proton in Chemistry; Cornell University Press: Ithaca, N.Y., 1973.Search in Google Scholar
3. Kortüm, G.; Vogel, W.; Andrussow, K. Dissociation Constants of Organic Acids in Aqueous Solution; Butterworths: London, 1961.Search in Google Scholar
4. Perrin, D. D. Dissociation Constants of Organic Bases in Aqueous Solution; Butterworths: London, 1965.Search in Google Scholar
5. Izutsu, K. Acid-Base Dissociation Constants in Dipolar Aprotic Solvents; Chemical Data Series; Blackwell Scientific Publications: Distributors, USA, Publishers’ Business Services: Oxford ; Boston : Brookline Village, Mass, 1990.Search in Google Scholar
6. Reichardt, C.; Welton, T. Solvents and Solvent Effects in Organic Chemistry, 4th ed.; Wiley: Weinheim, 2011.10.1002/9783527632220Search in Google Scholar
7. Raamat, E.; Kaupmees, K.; Ovsjannikov, G.; Trummal, A.; Kütt, A.; Saame, J.; Koppel, I.; Kaljurand, I.; Lipping, L.; Rodima, T.; Pihl, V.; Koppel, I. A.; Leito, I. Acidities of Strong Neutral Brønsted Acids in Different Media. J. Phys. Org. Chem. 2013, 26 (2), 162–170. https://doi.org/10.1002/poc.2946.Search in Google Scholar
8. Kütt, A.; Selberg, S.; Kaljurand, I.; Tshepelevitsh, S.; Heering, A.; Darnell, A.; Kaupmees, K.; Piirsalu, M.; Leito, I. pKa Values in Organic Chemistry – Making Maximum Use of the Available Data. Tetrahedron Lett. 2018, 59 (42), 3738–3748. https://doi.org/10.1016/j.tetlet.2018.08.054.Search in Google Scholar
9. Cox, B. G. Acids and Bases: Solvent Effects on Acid-Base Strength; Oxford University Press: Oxford, 2013.10.1093/acprof:oso/9780199670512.001.0001Search in Google Scholar
10. Kütt, A.; Leito, I.; Kaljurand, I.; Sooväli, L.; Vlasov, V. M.; Yagupolskii, L. M.; Koppel, I. A. A Comprehensive Self-Consistent Spectrophotometric Acidity Scale of Neutral Brønsted Acids in Acetonitrile. J. Org. Chem. 2006, 71 (7), 2829–2838. https://doi.org/10.1021/jo060031y.Search in Google Scholar PubMed
11. Smith, R. M.; Martell, A. E. Critical Stability Constants; Springer US: Boston, MA, 1975.10.1007/978-1-4613-4452-0Search in Google Scholar
12. Smith, R. M.; Martell, A. E. Critical Stability Constants; Springer US: Boston, MA, 1976.10.1007/978-1-4757-5506-0Search in Google Scholar
13. Martell, A. E.; Smith, R. M. Critical Stability Constants: First Supplement; Springer US: Boston, MA, 1982.10.1007/978-1-4615-6761-5Search in Google Scholar
14. Smith, R. M.; Martell, A. E. Critical Stability Constants; Springer US: Boston, MA, 1989.10.1007/978-1-4615-6764-6Search in Google Scholar
15. Yang, J.-D.; Cheng, J.-P. Internet Bond-Energy Databank (pKa and BDE) -- iBonD, v2.0. http://ibond.nankai.edu.cn.Search in Google Scholar
16. Brittain, H. G. Profiles of Drug Substances, Excipients, and Related Methodology, Vol. 33; Elsevier/Academic Press: New York, 2007.Search in Google Scholar
17. Slater, A. M. The IUPAC Aqueous and Non-Aqueous Experimental pKa Data Repositories of Organic Acids and Bases. J. Comput. Aided Mol. Des. 2014, 28 (10), 1031–1034. https://doi.org/10.1007/s10822-014-9764-9.Search in Google Scholar PubMed
18. Balogh, G. T.; Gyarmati, B.; Nagy, B.; Molnár, L.; Keserű, G. M. Comparative Evaluation of in Silico pKa Prediction Tools on the Gold Standard Dataset. QSAR Comb. Sci. 2009, 28 (10), 1148–1155. https://doi.org/10.1002/qsar.200960036.Search in Google Scholar
19. Palm, V. A. Tables of Rate and Equilibrium Constants of Heterolytic Organic Reactions, Vol. 1; Publishing House of VINITI: Moscow, 1975.Search in Google Scholar
20. Palm, V. A. Tables of Rate and Equilibrium Constants of Heterolytic Organic Reactions; Publishing House of VINITI: Moscow, 1984; Vol. Supplementary volume 1.Search in Google Scholar
21. Bordwell, F. G. Equilibrium Acidities in Dimethyl Sulfoxide Solution. Acc. Chem. Res. 1988, 21 (12), 456–463. https://doi.org/10.1021/ar00156a004.Search in Google Scholar
22. Reich, H. J. Bordwell pKa Table (Acidity in DMSO), 2007. http://www.chem.wisc.edu/areas/reich/pkatable/ (accessed 09 26, 2024).Search in Google Scholar
23. BIPM, IEC, IFCC, ILAC, ISO, IUPAC, IUPAP and OIML. JCGM 200:2012 International Vocabulary of Metrology – Basic and General Concepts and Associated Terms (VIM), 3rd ed.; Sèvres, 2012.Search in Google Scholar
24. Abboud, J.-L. M.; Notario, R. Critical Compilation of Scales of Solvent Parameters. Part I. Pure, Non-Hydrogen Bond Donor Solvents. Pure Appl. Chem. 1999, 71 (4), 645–718. https://doi.org/10.1351/pac199971040645.Search in Google Scholar
25. Marcus, Y.; Kamlet, M. J.; Taft, R. W. Linear Solvation Energy Relationships: Standard Molar Gibbs Free Energies and Enthalpies of Transfer of Ions from Water into Nonaqueous Solvents. J. Phys. Chem. 1988, 92 (12), 3613–3622. https://doi.org/10.1021/j100323a057.Search in Google Scholar
26. Kalidas, C.; Hefter, G.; Marcus, Y. Gibbs Energies of Transfer of Cations from Water to Mixed Aqueous Organic Solvents. Chem. Rev. 2000, 100 (3), 819–852. https://doi.org/10.1021/cr980144k.Search in Google Scholar PubMed
27. Laurence, C.; Legros, J.; Chantzis, A.; Planchat, A.; Jacquemin, D. A Database of Dispersion-Induction DI, Electrostatic ES, and Hydrogen Bonding α1 and β1 Solvent Parameters and Some Applications to the Multiparameter Correlation Analysis of Solvent Effects. J. Phys. Chem. B 2015, 119 (7), 3174–3184. https://doi.org/10.1021/jp512372c.Search in Google Scholar PubMed
28. Kolthoff, I. M. Acid-Base Equilibria in Dipolar Aprotic Solvents. Anal. Chem. 1974, 46 (13), 1992–2003. https://doi.org/10.1021/ac60349a005.Search in Google Scholar
29. Perrin, C. L.; Agranat, I.; Bagno, A.; Braslavsky, S. E.; Fernandes, P. A.; Gal, J.-F.; Lloyd-Jones, G. C.; Mayr, H.; Murdoch, J. R.; Nudelman, N. S.; Radom, L.; Rappoport, Z.; Ruasse, M.-F.; Siehl, H.-U.; Takeuchi, Y.; Tidwell, T. T.; Uggerud, E.; Williams, I. H. Glossary of Terms Used in Physical Organic Chemistry (IUPAC Recommendations 2021). Pure Appl. Chem. 2022, 94 (4), 353–534. https://doi.org/10.1515/pac-2018-1010.Search in Google Scholar
30. Chantooni, M. K.; Kolthoff, I. M. Electronic Absorption Spectra of Ion Pairs Composed of Substituted Amine Picrates in Acetonitrile. J. Am. Chem. Soc. 1968, 90 (12), 3005–3009. https://doi.org/10.1021/ja01014a002.Search in Google Scholar
31. Antipin, I. S.; Gareyev, R. F.; Vedernikov, A. N.; Konovalov, A. I. Cryptate Acidity Scales. Solvent Polarity Effect on Ion-Pair and Free Ion Acidity of Organic Compounds. J. Phys. Org. Chem. 1994, 7 (4), 181–191. https://doi.org/10.1002/poc.610070404.Search in Google Scholar
32. Müller, P. Glossary of Terms Used in Physical Organic Chemistry (IUPAC Recommendations 1994). Pure Appl. Chem. 1994, 66 (5), 1077–1184. https://doi.org/10.1351/pac199466051077.Search in Google Scholar
33. Coetzee, J. F. Ionic Reactions in Acetonitrile. In Progress in Physical Organic Chemistry; Streitwieser, A.; Taft, R. W., Eds.; John Wiley & Sons, Inc.: Hoboken, NJ, USA, 2007; pp. 45–92.10.1002/9780470171837.ch2Search in Google Scholar
34. Gold, V.; McNaught, A. D.; Wilkinson, A., Eds.; The IUPAC Compendium of Chemical Terminology: The Gold Book; International Union of Pure and Applied Chemistry (IUPAC): Research Triangle Park, NC, 4th ed., 2019.Search in Google Scholar
35. Cookson, R. F. Determination of Acidity Constants. Chem. Rev. 1974, 74 (1), 5–28. https://doi.org/10.1021/cr60287a002.Search in Google Scholar
36. Matthews, W. S.; Bares, J. E.; Bartmess, J. E.; Bordwell, F. G.; Cornforth, F. J.; Drucker, G. E.; Margolin, Z.; McCallum, R. J.; McCollum, G. J.; Vanier, N. R. Equilibrium Acidities of Carbon Acids. VI. Establishment of an Absolute Scale of Acidities in Dimethyl Sulfoxide Solution. J. Am. Chem. Soc. 1975, 97 (24), 7006–7014. https://doi.org/10.1021/ja00857a010.Search in Google Scholar
37. Rosés, M. Ionic Equilibria in Non-aqueous Solvents. Anal. Chim. Acta 1993, 276 (1), 211–221. https://doi.org/10.1016/0003-2670(93)85058-R.Search in Google Scholar
38. Rosés, M. Ionic Equilibria in Non-aqueous Solvents. Anal. Chim. Acta 1994, 285 (3), 391–399. https://doi.org/10.1016/0003-2670(94)80080-4.Search in Google Scholar
39. Rondinini, S. P. H. Measurements in Non-aqueous and Aqueous-Organic Solvents - Definition of Standard Procedures. Anal. Bioanal. Chem. 2002, 374 (5), 813–816. https://doi.org/10.1007/s00216-002-1455-z.Search in Google Scholar PubMed
40. Po, H. N.; Senozan, N. M. The Henderson-Hasselbalch Equation: Its History and Limitations. J. Chem. Educ. 2001, 78 (11), 1499. https://doi.org/10.1021/ed078p1499.Search in Google Scholar
41. Hefter, G. When Spectroscopy Fails: The Measurement of Ion Pairing. Pure Appl. Chem. 2006, 78 (8), 1571–1586. https://doi.org/10.1351/pac200678081571.Search in Google Scholar
42. Parman, E.; Toom, L.; Selberg, S.; Leito, I. Determination of pKa Values of Fluorocompounds in Water Using 19F NMR. J. Phys. Org. Chem. 2019, 32 (6), e3940. https://doi.org/10.1002/poc.3940.Search in Google Scholar
43. Terekhova, M. I.; Petrov, E. S.; Rokhlina, E. M.; Kravtsov, D. N.; Shatenshtein, A. I. Equilibrium NH Acidity of Nitrogen Heterocycles. Chem. Heterocycl. Compd. 1979, 15 (8), 904–908. https://doi.org/10.1007/BF00509802.Search in Google Scholar
44. McCallum, C.; Pethybridge, A. D. Conductance of Acids in Dimethyl-Sulphoxide—II. Conductance of Some Strong Acids in DMSO at 25°C. Electrochim. Acta 1975, 20 (11), 815–818. https://doi.org/10.1016/0013-4686(75)87002-2.Search in Google Scholar
45. Trummal, A.; Lipping, L.; Kaljurand, I.; Koppel, I. A.; Leito, I. Acidity of Strong Acids in Water and Dimethyl Sulfoxide. J. Phys. Chem. A 2016, 120 (20), 3663–3669. https://doi.org/10.1021/acs.jpca.6b02253.Search in Google Scholar PubMed
46. Marenich, A. V.; Kelly, C. P.; Thompson, J. D.; Hawkins, G. D.; Chambers, C. C.; Giesen, D. J.; Winget, P.; Cramer, C. J.; Truhlar, D. G. Minnesota Solvation Database. Minnesota Solvation Database. https://comp.chem.umn.edu/mnsol/ (accessed 04 22, 2020).Search in Google Scholar
47. Marenich, A. V.; Cramer, C. J.; Truhlar, D. G. Generalized Born Solvation Model SM12. J. Chem. Theory Comput. 2013, 9 (1), 609–620. https://doi.org/10.1021/ct300900e.Search in Google Scholar PubMed
48. Landrum, Greg; Tosco, Paolo; Brian, Kelley; Rodriguez, Ricardo; Cosgrove, David; Sriniker; Vianello, Riccardo; gedeck, NadineSchneider; Jones, Gareth; Kawashima, Eisuke; Nealschneider, Dan; Dalke, Andrew; Cole, Brian; Swain, Matt; Turk, Samo; Savelev, Aleksandr; Vaucher, Alain; Wójcikowski, Maciej; Take, Ichiru; Scalfani, Vincent F.; Walker, Rachel; Ujihara, Kazuya; Probst, Daniel; godin, guillaume; Pahl, Axel; Lehtivarjo, Juuso; Berenger, Francois jasondbiggs; strets123. Rdkit/Rdkit: 2024_03_1 (Q1 2024) Release, 2024. https://doi.org/10.5281/ZENODO.591637.Search in Google Scholar
49. Lowe, D. M.; Corbett, P. T.; Murray-Rust, P.; Glen, R. C. Chemical Name to Structure: OPSIN, an Open Source Solution. J. Chem. Inf. Model. 2011, 51 (3), 739–753. https://doi.org/10.1021/ci100384d.Search in Google Scholar PubMed
50. Burns, J.; Zheng, J. Py2opsin, 2024. https://github.com/JacksonBurns/py2opsin (accessed 2024-04-01).10.1109/CISA60639.2024.10576333Search in Google Scholar
51. Kolthoff, I. M.; Chantooni, M. K.; Bhowmik, Sadhana Dissociation Constants of Uncharged and Monovalent Cation Acids in Dimethyl Sulfoxide. J. Am. Chem. Soc. 1968, 90 (1), 23–28. https://doi.org/10.1021/ja01003a005.Search in Google Scholar
52. Kolthoff, I. M.; Chantooni, M. K. Substituent Effects on Dissociation of Benzoic Acids and Heteroconjugation of Benzoates with P-Bromophenol in Acetonitrile, N,N-Dimethylformamide, and Dimethyl Sulfoxide. Intramolecular Hydrogen Bonding in O-Hydroxybenzoic Acids and Their Anions. J. Am. Chem. Soc. 1971, 93 (16), 3843–3849. https://doi.org/10.1021/ja00745a001.Search in Google Scholar
53. Terekhova, M. I.; Petrov, E. S.; Mesyats, S. P.; Shatenshtein, A. I. Equilibrium Acidity Scale of CH-Indicators in Dimethyl Sulfoxide. Zhurnal Obshchei Khimii 1975, 45, 1529–1533.Search in Google Scholar
54. Stewart, R.; O’Donnell, J. P. The H_ Scale and the Acidity of Aromatic Amines. J. Am. Chem. Soc. 1962, 84 (3), 493–494. https://doi.org/10.1021/ja00862a036.Search in Google Scholar
55. Shatenshtein, A. I.; Shapiro, I. O. Relative Strength of CH Acids. Russ. Chem. Rev. 1968, 37 (11), 845–854. https://doi.org/10.1070/RC1968v037n11ABEH001709.Search in Google Scholar
56. Kolthoff, I. M.; Bruckenstein, S.; Chantooni, M. K. Acid-Base Equilibria in Acetonitrile. Spectrophotometric and Conductometric Determination of the Dissociation of Various Acids. J. Am. Chem. Soc. 1961, 83 (19), 3927–3935. https://doi.org/10.1021/ja01480a001.Search in Google Scholar
57. Kolthoff, I. M.; Chantooni, M. K. Calibration of the Glass Electrode in Acetonitrile. Shape of Potentiometric Titration Curves. Dissociation Constant of Picric Acid. J. Am. Chem. Soc. 1965, 87 (20), 4428–4436. https://doi.org/10.1021/ja00948a004.Search in Google Scholar
58. Kütt, A.; Tshepelevitsh, S.; Saame, J.; Lõkov, M.; Kaljurand, I.; Selberg, S.; Leito, I. Strengths of Acids in Acetonitrile. Eur. J. Org Chem. 2021. ejoc.202001649 https://doi.org/10.1002/ejoc.202001649.Search in Google Scholar
59. Yoshizawa, K.; Toyota, S.; Toda, F. Efficient Solvent-free Thorpe Reactions. Green Chem. 2002, 4 (1), 68–70. https://doi.org/10.1039/b110437n.Search in Google Scholar
60. Li, Y.; Zhu, Y.; Xiang, S.; Fan, W.; Jin, J.; Huang, D. Temperature Controlled Condensation of Nitriles: Efficient and Convenient Synthesis of β-Enaminonitriles, 4-Aminopyrimidines and 4-Amidinopyrimidines in One System. RSC Adv. 2020, 10 (11), 6576–6583. https://doi.org/10.1039/C9RA10866A.Search in Google Scholar PubMed PubMed Central
61. Tshepelevitsh, S.; Kütt, A.; Lõkov, M.; Kaljurand, I.; Saame, J.; Heering, A.; Plieger, P. G.; Vianello, R.; Leito, I. On the Basicity of Organic Bases in Different Media. Eur. J. Org Chem. 2019, 2019 (40), 6735–6748. https://doi.org/10.1002/ejoc.201900956.Search in Google Scholar
62. Bos, M.; Dahmen, E. A. M. F. Acid-Base Strengths in Pyridine. Anal. Chim. Acta 1971, 53 (1), 39–46. https://doi.org/10.1016/S0003-2670(01)80068-4.Search in Google Scholar
63. Foltin, M.; Majer, P. Determination of Dissociation Constant of Picric Acid and Calibration of Potentiometric Cell in Acetone. Collect. Czechoslov. Chem. Commun. 1978, 43 (1), 95–102. https://doi.org/10.1135/cccc19780095.Search in Google Scholar
64. Izutsu, K.; Kolthoff, I. M.; Fujinaga, T.; Hattori, M.; Chantooni, M. K. Acid-Base Equilibria of Some Acids in Propylene Carbonate. Anal. Chem. 1977, 49 (3), 503–508. https://doi.org/10.1021/ac50011a042.Search in Google Scholar
65. Talarmin, J.; L’Her, M.; Laouenan, A.; Courtot-Coupez, J. Calibration of the Hydrogen Electrode in Propylene Carbonate Potentiometric Studies of Acid-Base Reactions. J. Electroanal. Chem. Interfacial Electrochem. 1979, 103 (2), 203–216. https://doi.org/10.1016/S0022-0728(79)80441-6.Search in Google Scholar
66. Srivastava, A. K.; Mukherjee, L. M. Behavior of Acids in Propylene Carbonate: A Conductance Study of Certain Substituted Benzoic Acids, 2,4,6-Trinitrophenol, and Phenylacetic Acid. J. Electroanal. Chem. Interfacial Electrochem. 1983, 157 (1), 53–58. https://doi.org/10.1016/S0022-0728(83)80375-1.Search in Google Scholar
67. Streitwieser, A.; Wang, D. Z.; Stratakis, M.; Facchetti, A.; Gareyev, R.; Abbotto, A.; Krom, J. A.; Kilway, K. V. Extended Lithium Ion Pair Indicator Scale in Tetrahydrofuran. Can. J. Chem. 1998, 76 (6), 765–769. https://doi.org/10.1139/v98-069.Search in Google Scholar
68. Streitwieser, A.; Ciula, J. C.; Krom, J. A.; Thiele, G. Carbon Acidity. 78. Extended Cesium Ion Pair Indicator Scale in Tetrahydrofuran. J. Org. Chem. 1991, 56 (3), 1074–1076. https://doi.org/10.1021/jo00003a031.Search in Google Scholar
69. Kaufman, M. J.; Gronert, Scott.; Streitwieser, Andrew. Carbon Acidity. 73. Conductimetric Study of Lithium and Cesium Salts of Hydrocarbon Acids. A Scale of Free Ion Acidities in Tetrahydrofuran. Revision of the Ion Pair Scales. J. Am. Chem. Soc. 1988, 110 (9), 2829–2835. https://doi.org/10.1021/ja00217a023.Search in Google Scholar
70. Fraser, R. R.; Bresse, M.; Mansour, T. S. pKa Measurements in Tetrahydrofuran. J. Chem. Soc. Chem. Commun. 1983, 11, 620. https://doi.org/10.1039/c39830000620.Search in Google Scholar
71. Abdur-Rashid, K.; Fong, T. P.; Greaves, B.; Gusev, D. G.; Hinman, J. G.; Landau, S. E.; Lough, A. J.; Morris, R. H. An Acidity Scale for Phosphorus-Containing Compounds Including Metal Hydrides and Dihydrogen Complexes in THF: Toward the Unification of Acidity Scales. J. Am. Chem. Soc. 2000, 122 (38), 9155–9171. https://doi.org/10.1021/ja994428d.Search in Google Scholar
© 2025 IUPAC & De Gruyter
This work is licensed under the Creative Commons Attribution-NonCommercial-NoDerivatives 4.0 International License.
Articles in the same Issue
- Frontmatter
- IUPAC Technical Report
- Acid dissociation constants in selected dipolar non-hydrogen-bond-donor solvents (IUPAC Technical Report)
- Preface
- Introduction to the Special Issue of “The International Year of Quantum”
- Review Articles
- Quantum chemistry of molecules in solution. A brief historical perspective
- From Hückel to Clar: a block-localized description of aromatic systems
- Exploring potential energy surfaces
- Unlocking the chemistry facilitated by enzymes that process nucleic acids using quantum mechanical and combined quantum mechanics–molecular mechanics techniques
- Hypothetical heterocyclic carbenes
- Is relativistic quantum chemistry a good theory of everything?
- When theory came first: a review of theoretical chemical predictions ahead of experiments
- Research Articles
- Exploring reaction dynamics involving post-transition state bifurcations based on quantum mechanical ambimodal transition states
- Molecular aromaticity: a quantum phenomenon
- Using topology for understanding your computational results
- The role of ion-pair on the olefin polymerization reactivity of zirconium bis(phenoxy-imine) catalyst: quantum mechanical study and its beyond
- Theoretical insights on the structure and stability of the [C2, H3, P, O] isomeric family