Soundscape maps of pleasantness in a university campus by crowd-sourced measurements interpolation
-
Aurora Mascolo


Abstract
A university campus is a complex environment, as it comprises many areas, each with distinctive acoustic characteristics. There are zones where a quiet environment is crucial for work and study, parking lots and internal road networks, as well as vibrant spaces where students and personnel stay during leisure time. Thus, university campuses clearly offer a remarkable opportunity for the evaluation of soundscape analysis tools and the exploration of new methodologies for assessing and mapping soundscapes. In this work, the Fisciano campus of the University of Salerno (Italy) has been depicted as a case study. Specifically, the outcomes of a soundwalk conducted following ISO/TS 12913 standards will be presented, together with data gathered through crowd-sourcing during NoiseCapture parties. The data from NoiseCapture parties have been used to test and validate an innovative methodology based on an inverse distance weighting interpolation to produce soundscapes’ attributes maps, using the mean pleasantness as an example and exploring the relative influence of the maximum distance used to characterize an homogeneous sound environment to build the maps themselves. The results will offer valuable insights into the proposed methodology.
1 Introduction
The soundscape research is becoming more and more relevant in the scientific literature, thanks to a large awareness of the damages and risks deriving from living in noisy and annoying environments. Beside the development of new techniques for noise assessment and modelling, in fact, there is a large part of the acoustic community that is now turning on soundscape analyses to involve the subjective perception in their studies.
However, such studies and analyses should not remain at a theoretical level, and indeed, in recent years, one of the main lines of research has been to bring these notions to a practical and valid level for planning and designing more livable and pleasant cities and urban environments. This is due also to the impulse coming from national and international institutions that ask to combine the standard noise mapping strategies with the soundscape approach, as affirmed by the European environmental agency (EEA) in the Good Practice Guide on Quiet Areas [1]. Thus, the assessment and understanding of soundscapes has become increasingly important as it provides a distinctive point of view into the social and cultural dimensions of urban settings. By paying attention to the combination of sounds that collectively define a particular place, researchers can learn more about how people actually experience and understand their surroundings. This exploration provides details not only about how deep people engage with the environment but also about how the places they are in affect their well-being and quality of life, furnishing useful information that could be used into the design of urban areas. In this perspective, it must be taken into account that nowadays people occupy different types of environments while working or simply spending time on a daily basis. All of them are characterized by the presence of several sound sources and by their characteristic combination. In this framework, the study of particular locations such as schools, universities, workplaces, vibrant areas, and sport facilities is very important to highlight possible peculiarities in the soundscape, according to the land use and the activities pursued in the site under study.
Yang and Kang [2] investigated the acoustic comfort in urban open public space finding out that the subjective evaluation of sound level generally relates well with the mean
Moreover, there are several studies devoted to the investigation of the natural soundscape in parks or green areas. Uebel et al. provided more evidence to the idea that natural sounds can improve the quality of the perceived acoustic environment and even mask urban noises. In particular, their studies proved that the increase of natural sounds levels does not reduce the positive perception of the environment, differently from anthropic kinds of sounds [4]. Liu et al. proposed questionnaire surveys to assess the relationship between soundscape perception and public visiting experience in the city parks, focusing on the changing of sound source characteristics in the urbanization process [5]. Jeon et al. [6] confirmed that natural environments had higher restorative effects than urban environments, and that visually attractive and spatial-natural landscapes and acoustically supportive and tranquil soundscapes should be created to improve restoration response. Similar conclusions were drawn from the work of Chen and Kang [7].
Furthermore, a study by Masullo et al. assessed the possibility that even being surrounded by historical-artistic art forms could be just as relevant as a natural component for people’s restorative capacity [8]. The perceptive side was combined with the physical one in the research of Can and Gauvreau that proposed a procedure to physically describe and to categorize urban sound environments making it possible to determine particular areas and periods remarkably suitable for stress recovery [9]. Also, the ecoacoustic soundscape studies are more and more developed, using sound recordings to calculate ecoacoustic indexes and to infer details about health quality of the natural area under study [10,11].
As for university campuses, some studies can be found in the literature. Puspagarini et al. reported how the soundscape in the campus of Yogyakarta, in Indonesia, was influenced by both anthrophony and natural sound sources, as any urban park. With respect to different locations, different sources were analyzed and found to be dominant, including animals and in particular insects, water sounds, road traffic noise, and even human voices [12]. Moreover, it needs to be taken into account that university campuses are often located in urban areas, and thus, they are often surrounded by streets with high traffic flow volume, which affect the overall quality of the external spaces. This is the case of several Italian Universities, for example, the Roma TRE University analyzed by D’Alessandro et al. [13]. In their research, the investigation on how natural features, visual aspects and thermal conditions can affect the users’ judgment of the environment was carried out. Other studies in university campuses have been carried out, with particular attention to indoor soundscape such as in the study by Indrani et al. [14] finding out that even work behaviour depend on the acoustic characteristics of the workplace and on its perception, which is influenced by physiological, psychological, and social-cultural characteristics in the local environment. Aletta et al. [15] estimated the willingness of users to stay in an open public space at the University of Sheffield (UK), measuring people staying time under different music stimuli and in a controlled condition. Margaritis et al. [16] presented a smartphone-based method for noise and soundscape analysis in a university campus that underwent a renovation plan. The authors used statistical and geographic information system (GIS) tools to examine the spatiotemporal variability of noise and soundscape and the influence of landscape features, and also presented some maps of several perceptual factors of these areas. Anyway, Margaritis and van Herry [16] performed soundscape mapping via the ordinary Kriging interpolation technique, while in this article, the inverse distance weighting (IDW) is used, as suggested in the study by Hong and Jeon [17].
In the study by Mascolo et al. [18], the soundscape of the campus of Fisciano of the University of Salerno, Italy, was assessed by means of a soundwalk organized by some of the authors, using the recommendation reported in the ISO 12913-2 [19]. This site has been previously used as case study for testing a methodology for noise mapping by means of crowdsourced data in university campus [20]. The results confirmed the expectations that the vibrant areas, as well as the small park in the campus, were the locations with the best soundscape in terms of appropriateness and willingness to return. In the study by Mancini et al. [21], the same data have been used for a deeper investigation, including also a circumplex model 2D plane plot, that relates all the soundscape attributes and shows the relations among them.
In this article, the authors propose a soundscape mapping of the campus of Fisciano, University of Salerno, based on pleasantness data recorded with a trained crowdsourcing technique. The data, in fact, are provided by students of the Engineering Departments, trained by some of the authors to provide reliable sound level measurements and assessment of the soundscape quality [20]. Results are compared with the data collected during the soundwalk activity and presented in studies by Mascolo et al. [18] and Mancini et al. [21], respectively, to validate the mapping procedure and to highlight strength points and/or possible shortcoming of the proposed methodology. The aim of this work is to provide a methodology useful in similar applications to obtain a detailed mapping of the soundscape over a wide area, with different features and different prevailing sound sources.
2 Materials and methods
In this article a methodology to draw a soundscape map of the campus under study is presented, starting from the sound perception rating provided by the participants to four events at the University of Salerno (Figure 1), named after “NoiseCapture parties.”
![Figure 1
Location of the campus of Fisciano, University of Salerno [21]. Red line in the left plot is the Campus border.](/document/doi/10.1515/noise-2022-0178/asset/graphic/j_noise-2022-0178_fig_001.jpg)
Location of the campus of Fisciano, University of Salerno [21]. Red line in the left plot is the Campus border.
These parties have been organized by some of the coauthors, under the patronage of the Noise-Planet project team, with the aim of spreading the noise awareness among future engineers (all the participants were students of engineering disciplines) and promoting the tools for environmental noise assessment developed within the project. Among these tools, in fact, the colleagues from Université Gustave Eiffel, CEREMA, UMRAE, France, developed the NoiseCapture app for Android, for measuring the sound levels with the mobile phone’s microphone [22]. At the end of each measurement, the user can provide a rating of the pleasantness, on a five-point unipolar continuous-category scale, together with the identification of the predominant sources operating during the measurement (Figure 2). The measurement is embedded with the device identifier and the GPS position and, once stopped, can be uploaded on a cloud that feeds the online and real-time map available at the Noise-Planet project website. The pleasantness rated by the user is assigned to the measurement and averaged with all the pleasantness recorded in the same hexagonal area.
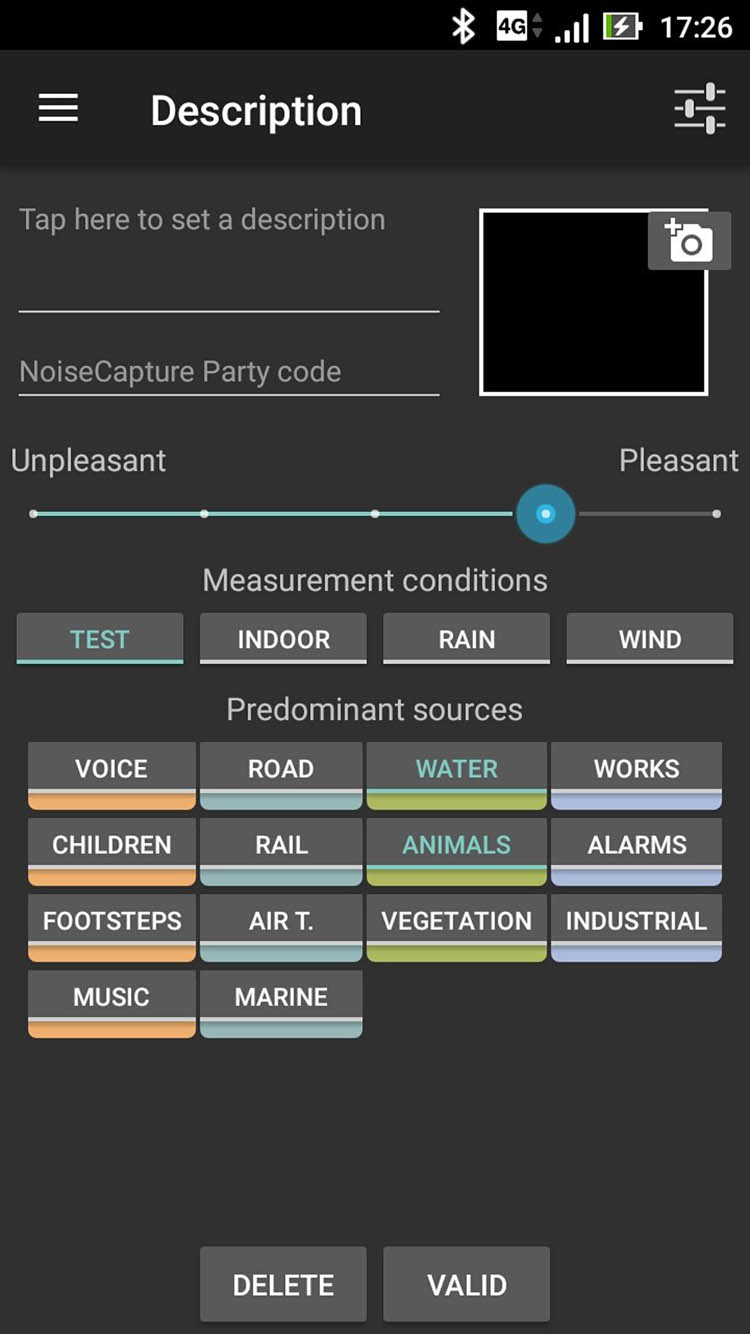
Screen of the app NoiseCapture at the end of measurement, with a five-point unipolar scale to provide pleasantness rating and predominant sources.
The raw data packages are updated on a daily basis and can be downloaded from a repository, selecting the country, in a compressed folder including points, areas, and trajectories files of the measurements uploaded by the users. Once downloaded, the data can be imported and handled in any GIS software. The idea presented in this article is to use the mean pleasantness recorded by trained users during selected sessions of NoiseCapture measurements, which are the NoiseCapture parties, to draw soundscape maps of the area under study. During a NoiseCapture party the participants are first asked to calibrate their mobile phone’s microphone with one of the several possible techniques listed in the app itself. The NoiseCapture app allows to calibrate smartphones in four ways, namely, with the help of road traffic, by manually calibrating from a reference device or from a calibrator device (in this case, a plug-in external microphone is needed) and by automatic estimating the correction factor from a calibrated smartphone. In the University of Salerno’s events, the smartphones of the team members have been calibrated in laboratory by manual comparison with a first-class sound level meter (reference device) and then the participants devices have been calibrated by automatic sharing of the correction factors. The latter operation has been performed in the classroom, measuring the background sound levels (approximately around 60–70 dBA due mostly to Heating, Ventilation and Air Conditioning, HVAC, system and to students chatting) with the two calibrated devices and the smartphones of the students. Via wireless connection, the app provides the correction factors to the smartphones under calibration, considering the levels measured by the calibrated devices.
The students have been divided in five teams, each of them including at least three calibrated mobile phones, and they have been asked to walk along the route assigned to each group, as in Figure 3a, measuring the environmental sound level. The students have been asked to stop the measurement each time a relevant variation of the soundscape occurred, in order to provide homogeneous information about pleasantness and predominant sources. This rule leads to many short measurements that can be handled in a GIS environment and can be used for mapping purposes. In this case, the authors used QGIS (C).

(a) Paths of the NoiseCapture parties (modified from Google Maps©) and (b) route of the soundwalk.
In addition to the NoiseCapture parties, the authors organized a soundwalk, performed following the ISO 12913-2 [19], using questionnaires proposed in method A and method B reported in Annex C3 of the same document [19]. The soundwalk was carried out on March 8, 2019, with the participation of 22 students, most of them attending the Physics class of the first year of the Bachelor in Civil and Environmental Engineering at the University of Salerno. Part of the participants were students working in the Applied Physics Engineering Laboratory for the bachelor or master thesis. All the students were all in the range of 19–26 years and the process selection was made to achieve a gender balance. The participants were asked in anonymous way if they had any hearing impairments, and they were trained before starting the soundwalk, resuming the main concepts of acoustic perception, the soundscape subjective evaluation approach, and the questionnaire structure. The selected students regularly frequented the campus and, thus, have been considered local experts of the area under study. This kind of contribution is crucial to collect and analyze ecologically valid acoustical and perceptual data [19]. The soundwalk was performed following the route and the points reported in Figure 3b. More details about the soundwalk can be found in the study by Mancini et al. [21], in which a comprehensive description of the activity is reported, together with a detailed data analysis.
Table 1 presents a summary of the main features of the selected points, as well as the sound continuous equivalent levels measured in each point, with a calibrated class 1 sound level meter (Fusion, 01 dB). The six location points are influenced by different noise sources that characterize them. More specifically, for point 1, the main noise source is the traffic in the internal campus roads network; for point 2, the main source is road traffic flowing in the highway. For points 3 and 6, the main noise source is chatting. In point 3, moreover, noise coming from the temporary work in progress is also affecting the Soundscape. Additional sources for point 4 and point 5 are, respectively, noise coming from water fountain and from plants
Description of the six measurement points and
| Location | Description |
|
|---|---|---|
| Point 1 | Vehicles entrance and parking lots | 55.2 |
| Point 2 | Main park, close to the scientific library | 53.3 |
| Point 3 | Rectorate square, close to the main library | 48.3 |
| Point 4 | Central square, close to a fountain and a bar | 57.0 |
| Point 5 | External area, close to HCVA plants | 68.2 |
| Point 6 | Pedestrian road to the bus station and canteen | 55.4 |
This soundwalk provided robust subjective data about the soundscape of the campus that will be used for comparison with the pleasantness map produced in this article, to validate the methodology proposed. It is worthy to notice that the pleasantness provided by the NoiseCapture data is given in percentage, rating from 0 to 100%, respectively, from unpleasant to pleasant, with steps of 25%. On the other hand, the data collected according to method A of the ISO standard are given in a scale from 5 to 1, from “strongly agree” to “strongly disagree” about how pleasant the soundscape of each point is. The two scales are not directly comparable; thus, the authors converted the 5–1 scale of method A to 100–0%. This was possible because of the availability of the single questionnaire results. As for method B results, since they refer to the soundscape unpleasantness rating, they have been converted into the mean pleasantness by assuming that “non unpleasant” is “pleasant.” This procedure, of course, can lead to a misestimation of the pleasantness, since the subjective rating of how much a location is unpleasant may be affected by the question structure. Asking about the unpleasantness, in fact, may influence the participant and let her/him focus on the negative factors more than on the positive ones, and vice versa. This peculiarity of method B will be confirmed by a general underestimation in the pleasantness results presented in the next section and will lead the authors to use method A results for validation of the mapping, adopting the scale in percentage, as proposed in the NoiseCapture application. The app, in fact, asks to rate the unpleasantness/pleasantness perception in a more neutral way, using a five-point unipolar scale (Figure 2). This approach is also consistent with other studies in the literature, such as in the study by Aletta et al. [23]. In this particular research, Aletta et al. analyzing the results of Method A and Method B questionnaires during a soundwalk through the Department of Engineering of the University of Roma Tre, observed how choosing a protocol over another one could have an effect on the soundscape data that is being gathered, confirming the necessity of perform a comparison between the two methods.
3 Case study results
The case study presented in this article is the campus of Fisciano of the University of Salerno (UNISA). The authors downloaded the data related to Italy and to Salerno province, in which the campus is located. A filter on the date and on the hour has been implemented, to select only the measurements performed during the NoiseCapture party events, celebrated in the dates reported in Table 2. The noise maps resulting from the events and published in the noise-planet.org platform are reported in Figure 4.
Details of the NoiseCapture parties@UNISA events
| Year | Date | Participants |
|---|---|---|
| 2018 | May 17, morning | 25 |
| 2019 | May 24, morning | 29 |
| 2022 spring ed | May 16, afternoon | 40 |
| 2022 fall ed | November 9, afternoon | 113 |
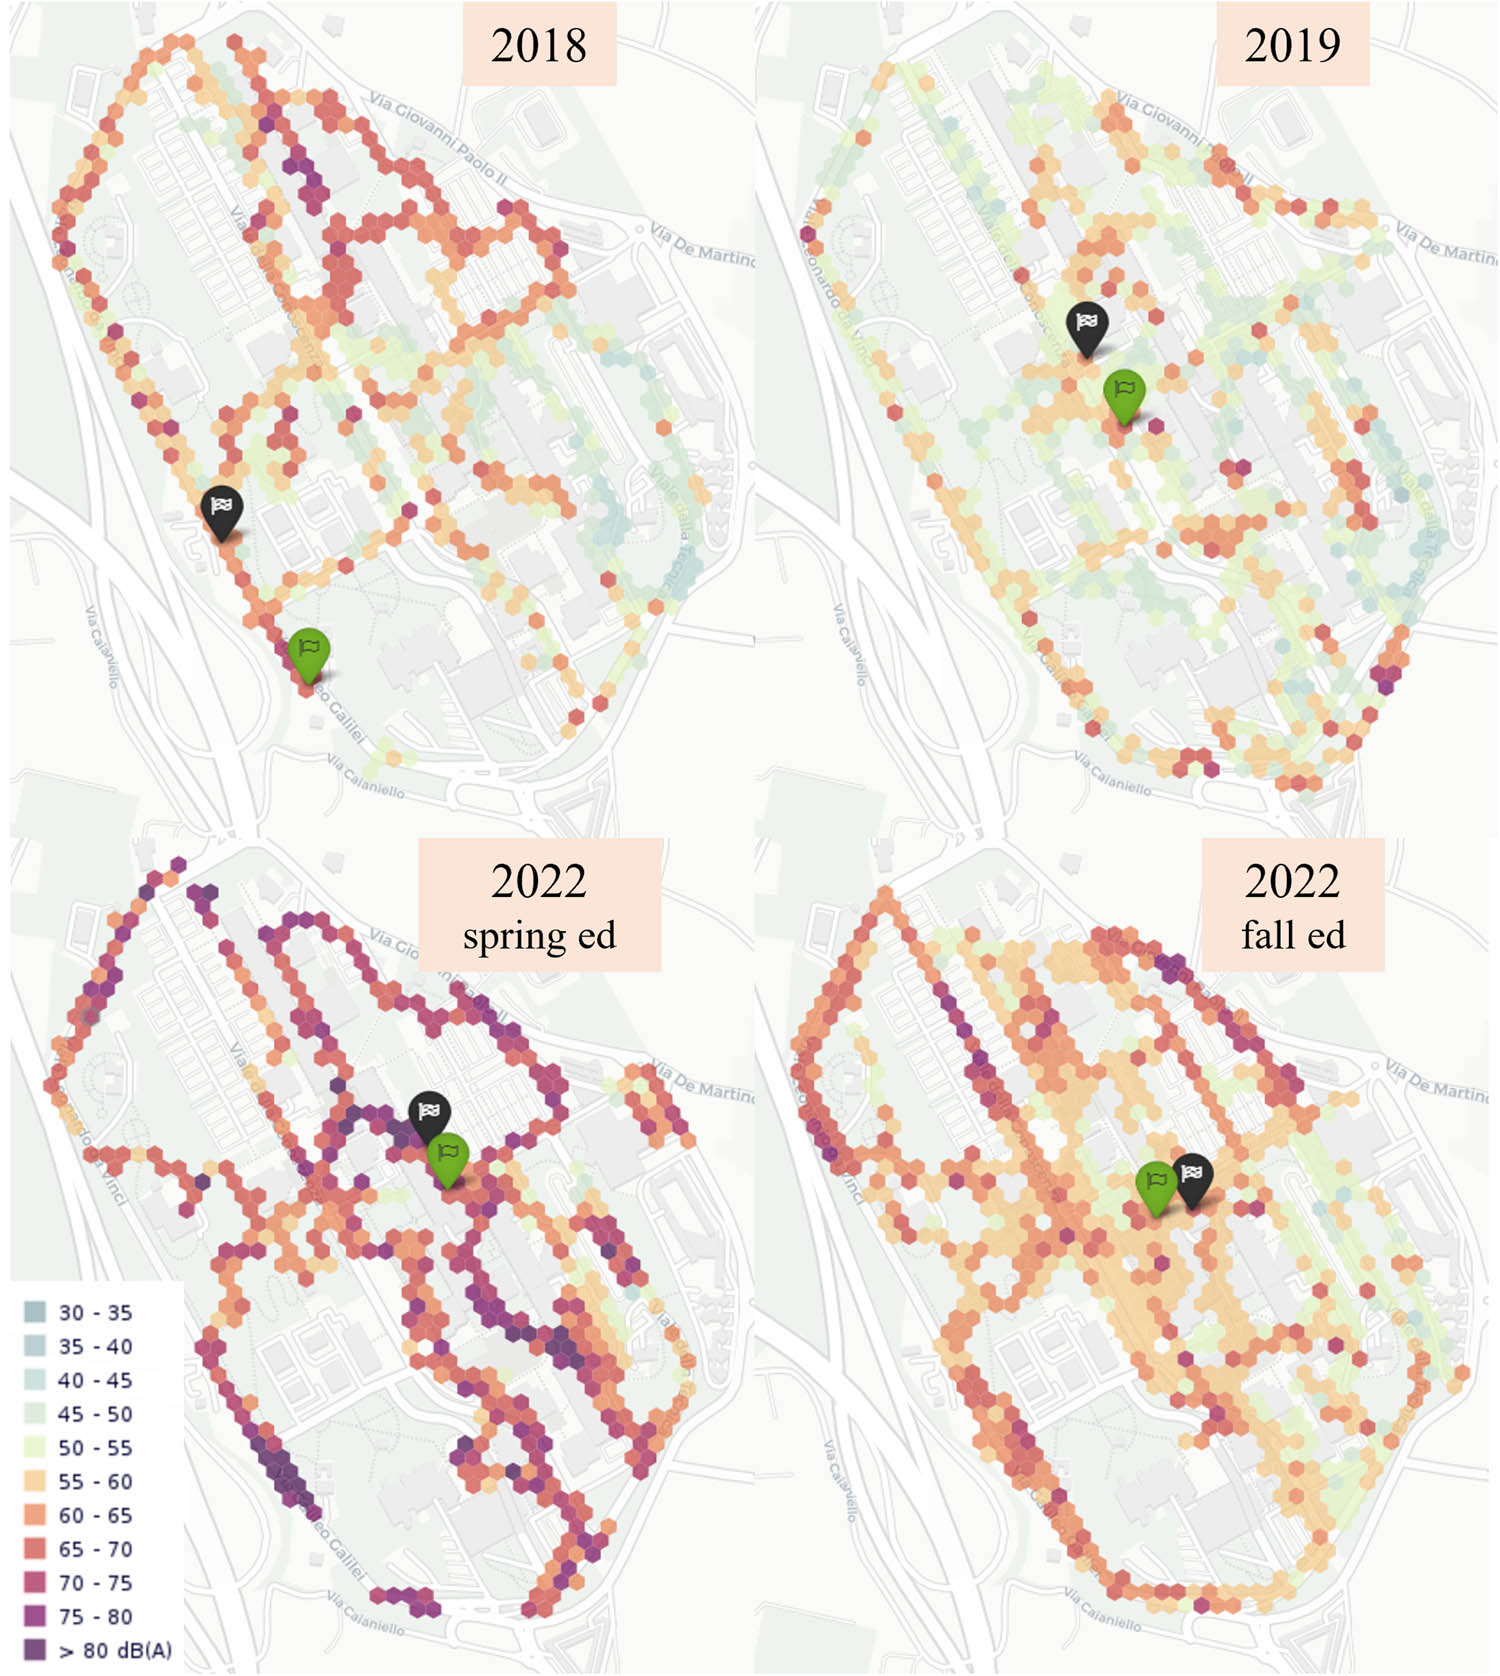
Noise maps obtained during the NoiseCapture parties, published in the Noise-Planet webpage.
This allowed to work with controlled data, recorded by trained users, that are the students involved in the events, thus reducing the probability of corrupted data uploading. Firstly, the mean pleasantness attribute present in each hexagonal area of the campus, with respect to the entire dataset collected during all the NoiseCapture parties described earlier, has been plotted with a colour gradient scale (Figure 5). At this stage, the map does not include any spatial interpolation of the data, but only serves as a “guide for the eye” and represents the database used for the following analysis.

Mean pleasantness measured during the NoiseCapture parties, aggregated on the centroids of the hexagonal grid elements of the OnoMap used for Noise-Planet project.
Preliminary comments have been drawn, noting that the areas in which the mean pleasantness is low correspond to those locations in which there is a relevant noise coming from heating/cooling systems or from the nearby roads. On the contrary, the areas with higher pleasantness in the map correspond to locations generally with a better soundscape, for instance, the parks and the vibrant areas. Starting from the mean pleasantness recorded during the NoiseCapture parties in each hexagonal area, the authors decided to perform an IDW interpolation to produce a map of the campus pleasantness.
When performing an IDW interpolation, one of the most important parameters is the search radius. This radius influences the amount of data included in the interpolation and, in this specific analysis, from the physical point of view, it expresses the distance among data that can be considered somehow related to an homogeneous soundscape. It is useful to underline that this distance can change according to the areas and the sources occurring within the site under study. Moving inside a big parking lot or along a main road of the campus, such as the path that goes from point 1 to point 2 of the soundwalk performed at UNISA (Figure 3(b)), allows to use a quite large search radius, since this path is approximately 450 m and has a quite homogeneous soundscape. The main sources in fact are vehicles moving along the road and inside the parking lot, as well as people walking out from the parking lot to reach the University buildings. When approaching point 2, the soundscape changes quickly over space, since the path enters the main park of the campus, that is lying below the main campus road level and is characterized by natural sounds. Anyway, the highway in front of the campus is a relevant noise source affecting the appropriateness of the park soundscape. At the conjunction of the two areas (road and park), the search radius should be much lower than before, to consider the sharp variations in the soundscape and the different perception of it by people staying in those areas. To address this issue of nonhomogeneous soundscapes, in the next section, the authors present a sensitivity analysis performed by varying the search radius of the IDW interpolation, to find if an optimal choice for the case under study exists, postponing the possibility of further investigations on variable search radius to a forthcoming article. The first map showed in Figure 6 is obtained by selecting a search radius for the IDW interpolation of 50 m. The classification has been obtained with natural break method.

IDW interpolation map of the mean pleasantness in the Campus of Fisciano. The green points are the soundwalk measurement points. The search radius is fixed at 50 m.
The map built with the aforementioned procedure has been then compared with the pleasantness recorded during the soundwalk performed by a group of students, as described in Section 2. In particular, the pleasantness measured during the soundwalk, according to method A and method B, has been compared with the results obtained by the IDW interpolation in the six points of the soundwalk. These data are resumed in Table 3 and Figure 7.
Mean pleasantness measured with the soundwalk methods and simulated with IDW mapping, with 50 m as search radius
| Point | Method A (%) | Method B (%) | IDW map (%) |
|---|---|---|---|
| Point 1 | 52.3 | 50.9 | 75.0 |
| Point 2 | 72.7 | 58.6 | 77.5 |
| Point 3 | 67.1 | 57.2 | 60.3 |
| Point 4 | 61.4 | 52.8 | 61.0 |
| Point 5 | 2.3 | 9.0 | 4.9 |
| Point 6 | 54.4 | 46.0 | 46.6 |
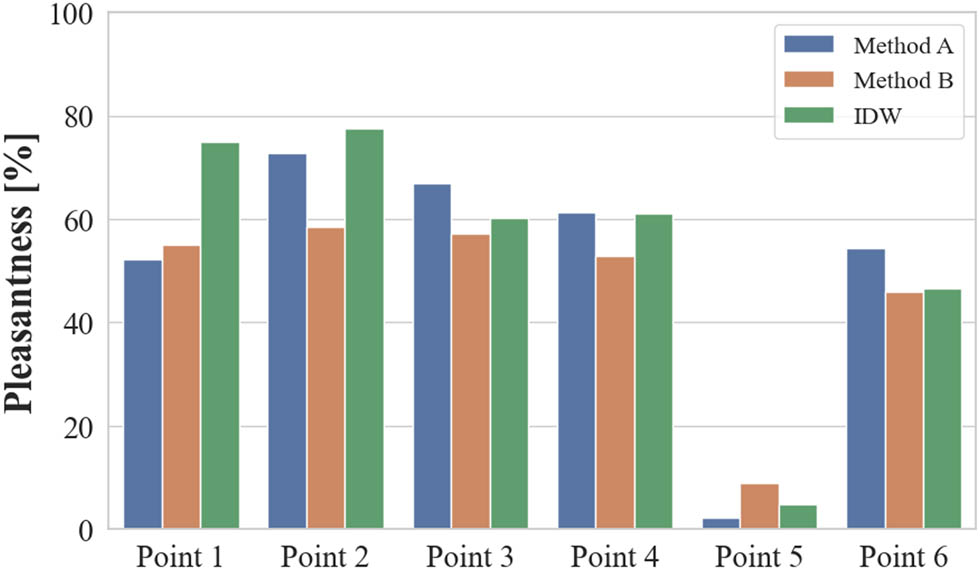
Comparison of mean pleasantness measured with the two methods during the soundwalk and simulated with the IDW interpolation of the NoiseCapture parties data, with 50 m as search radius.
3.1 Search radius variation analysis
To investigate how search radius could have effects on the interpolated soundscape map and on its goodness, the procedure described earlier has been repeated, varying the search radius from 50 to 300 m, with smaller steps when closer to the point and larger ones going further from it. In each simulation, the values of the mean pleasantness in the six points under study have been retrieved from the maps and the variations have been evaluated. This has been done to compare the results with the measurements of the soundwalk, considered as benchmark values, with the aim of performing a sensitivity analysis of the search radius parameter. The obtained results are reported in Table 4 and Figure 8, while an example of a different mean pleasantness map, obtained using as a search radius a value of 150 m, is shown in Figure 9.
IDW pleasantness in the six considered points with different search radius
| Radius (m) | Point | |||||
|---|---|---|---|---|---|---|
| 1 | 2 | 3 | 4 | 5 | 6 | |
| 50 | 75.00 | 77.52 | 60.28 | 62.68 | 4.86 | 46.59 |
| 60 | 66.95 | 77.02 | 60.03 | 62.91 | 6.19 | 52.74 |
| 70 | 68.17 | 76.26 | 59.61 | 62.37 | 7.17 | 50.54 |
| 80 | 62.87 | 75.70 | 59.85 | 63.08 | 8.89 | 52.91 |
| 90 | 63.03 | 75.31 | 59.91 | 63.26 | 9.54 | 51.72 |
| 100 | 60.79 | 74.99 | 60.35 | 63.72 | 9.94 | 53.91 |
| 150 | 59.68 | 74.15 | 60.24 | 59.78 | 11.69 | 53.62 |
| 200 | 55.65 | 73.58 | 59.66 | 59.34 | 12.46 | 53.42 |
| 300 | 53.06 | 73.06 | 59.18 | 59.92 | 13.43 | 52.20 |

Mean pleasantness values versus IDW search radius.

IDW interpolation map of the mean pleasantness in the Campus of Fisciano. The green points are the soundwalk measurement points. The search radius is fixed at 150 m.
4 Discussion
The comparison reported in Table 3 highlights that the IDW interpolation is in a quite good agreement with method A in almost all the points, except for point 1. It is important to note that this point is affected by lack of surrounding measured data (Figure 5). The influence of the selected radius, which, when larger, allows to include additional measurements, has been reported in Section 3.1 and will be discussed in details in the following. As already discussed in Section 2, method B is affected by the formulation of the question during the survey, since it asks to rate from 1 to 5 how much unpleasant the location under study is, influencing the participant to focus on the negative factors of the site. Point 2 result is a good example of this comment. It is located in a green park of the campus, full of natural sounds and greenery. Anyway, the soundscape of this point is affected by the highway that runs very close to the campus border, a few hundreds of meters away from the park. For this reason, the same participants gave a high rating in method A questionnaires about how much pleasant this site is, including also the visual factors and the presence of the natural sounds. However, when they concentrated about the unpleasantness, they focused on the presence of the annoying noise coming from the highway and the overall results were worse than the one measured with method A. This effect is not included in the NoiseCapture parties data, in which the question about pleasant-unpleasant soundscape is given in a more neutral way. Despite the comments reported earlier, the agreement between the IDW interpolated map with 50 m as search radius and the results of the soundwalk is reasonable. The mean pleasantness errors, calculated as IDW simulations minus soundwalk measurements, are about 2.5 and 8.5%, respectively, for method A and method B. The general overestimation of the IDW map is influenced by the results in point 1. Excluding this point from the calculation of the error, because of the bad interpolation due to missing measured data, the mean errors are, respectively,
Moving to the search radius analysis discussion, the results reported in Section 3.1 provide several insights that can be underlined. First, looking at Figure 8, it is noticeable that the choice of the radius implies obviously obtaining different values of pleasantness. All the curves present some variations in a closer range (less than 100 m), exhibiting a flat slope increasing the search radius.
The pleasantness error, calculated as the difference between IDW simulation results and the mean pleasantness obtained during the soundwalk with method-A, considered as a benchmark, is presented in Table 5 and Figure 10.
Difference between IDW simulated values and soundwalk measurements (method A), i.e., pleasantness error
| Radius (m) | Point | |||||
|---|---|---|---|---|---|---|
| 1 | 2 | 3 | 4 | 5 | 6 | |
| 50 | 22.73 | 4.79 |
|
1.32 | 2.59 |
|
| 60 | 14.68 | 4.30 |
|
1.54 | 3.92 |
|
| 70 | 15.90 | 3.54 |
|
1.01 | 4.90 |
|
| 80 | 10.60 | 2.98 |
|
1.72 | 6.62 |
|
| 90 | 10.76 | 2.58 |
|
1.89 | 7.27 |
|
| 100 | 8.52 | 2.26 |
|
2.35 | 7.66 |
|
| 150 | 7.41 | 1.43 |
|
|
9.41 |
|
| 200 | 3.38 | 0.86 |
|
|
10.19 |
|
| 300 | 0.79 | 0.34 |
|
|
11.15 |
|

Difference between the pleasantness values obtained with IDW and from soundwalk experience.
The error between IDW and the soundwalk values presents different characteristics at the six different measurement points. Point 1 shows the highest variability of the error at varying of the search radius, by diminishing at increasing of the distance. Point 6 also shows a decreasing of the error. Point 5, on the contrary, presents an increasingly higher value of error when increasing the search radius. The other points have smaller oscillation as it can be noticed for point 3 error line, for instance, that is basically flat. These results indicate how the soundscape homogeneity is variable within the area under study and how hard is to find a single values usable for a bigger area, such as the whole campus.
Going more in details, the specific features of each point are relevant to understand the slope of the errors curves. Point 2, for example, is a quite large green area, where people goes for walking and spending free time, and no crowds nor activities are present. Considering the common features of the entire soundscape, the perception of a quiet and pleasant environment is basically maintained through the whole area. As a consequence of that, the mean IDW pleasantness value is quite stable even if considering larger and larger space, leading to a stable error when increasing the search radius. Similar conclusions can be drawn for point 1. Here, a remarkable variation of the pleasantness error is visible, with lower errors as the search radius increases. This is consequential, as in point 2, to the homogeneity of the soundscape under investigation. By taking this homogeneity into account and enlarging the radius used to compute the IDW interpolation, more data were included to estimate and map the mean perceived pleasantness at this point, enabling a better fit with the results obtained during the soundwalk. However, if point 5 is taken into consideration, the opposite effect can be noticed. This area, as reported earlier, is characterized by its proximity to several very noisy HVAC plants. Such plants affect a very limited area of the campus, being surrounded by buildings that prevent the full propagation of noise to the adjacent areas. The nonhomogeneity of the soundscape in this area can be noticed by examining the values of the errors in it, which increase as the search radius increases. Since larger search radius leads to the inclusion of information that cannot be associated with the actual soundscape under investigation, the error value tends to increase.
Another remark is that the pleasantness error variation is more evident for search radius between 50 and 150 m, but at greater distance, the values remain more or less constant. A crucial output of this analysis is that it is very difficult to find a fixed value for the search radius, that can be considered acceptable in the entire area of the site under study, since the influence distance should be estimated in terms of soundscape homogeneity. Consequently, it is not possible to define a unique search radius that can be used in different contexts because of each site peculiarities.
Nevertheless, the size of the area under study is a relevant parameter. The campus presented in this article has a surface of about 1.200.000 mq, with many facilities and natural areas; thus, it presents a large variability of soundscape and it does not allow to identify a unique search radius. Smaller areas, with homogeneous facilities and activities within, such as for instance urban parks, industrial or residential areas, and areas along main transportation infrastructures, can allow the usage of a single value for the search radius, which will be strictly related to the dimension of the area, as well as to the soundscape features. In the latter case, in fact, an average value of the search radius can be selected, providing robust soundscape maps, consistent with the perceived sound environment, that can be used for multiple applications. For instance, the pleasantness maps provided in this case study can be replicated for other perceptual attributes and can be used for combining multiple attributes, such as in the study by Margaritis and Kang [24]. Margaritis and Kang [24], in fact, provided the maps of perceptual attributes in two UK cities using a 0–10 range scale and combined attributes values in a single map, fixing thresholds for the attributes and highlighting the areas that fulfil these thresholds.
5 Conclusions
The need to map soundscape attributes and indices is becoming more and more important. In this article, the authors proposed a methodology to map the pleasantness of a university campus, by using crowdsourced data, provided by the NoiseCapture app during the celebration of “NoiseCapture parties at UNISA,” with a selected group of trained students. These data, averaged in a hexagonal grid, have been used for building a IDW interpolation map. The results of the mapping have been validated on six points included in a soundwalk carried out by some of the authors in the same campus, according to the ISO standards. When considering 50 m as a search radius for the IDW interpolation, the validation showed that the mean pleasantness obtained by the IDW mapping in the six points was comparable with the values measured with method A of the ISO, assumed as benchmark, with a slight overestimation and a mean error of 2.5%.
A further analysis of the IDW mapping, with variable search radius, revealed that a proper tuning of this parameter can indicate how the surroundings of the measurements points can be considered as homogeneous in terms of pleasantness, and which is the spatial limit or “influence radius” until which a sound environmental analysis can be performed being sure the soundscape is not changing. The main outcome of this analysis is that this radius cannot be fixed for the entire site, since it differs greatly from one area to another.
More in general, it can be concluded that the map of the pleasantness obtained with the IDW interpolation of the NoiseCapture parties data is a reliable tool to provide information about the spatial distribution of the phenomenon.
The main limitation of the study is that results can be affected by the homogeneity of the soundscape of the site, which influences the search radius choice. However, a proper choice of the simulation parameters and the possibility to merge results from nearby points, as well as a knowledge of the area under study main sources, may be useful to finely tune the mapping procedure and to produce even more robust outcomes.
Acknowledgments
The authors are grateful to all the students that took part in the NoiseCapture parties along the years. The authors also acknowledge the contribution of the bachelor and master students that worked on this project during their thesis activity. A special thank goes to the students Antonio Marino, Valentina Pepe, David Vuto, Simone Toscano, and Francesca Castella who voluntarily realized the short videos of the NoiseCapture parties events.
-
Funding information: This research was partially funded by the Ministery of University and Research, with the PRIN 2022 grant number 2022ZLE8HC.
-
Author contributions: All authors have accepted responsibility for the entire content of this manuscript and approved its submission.
-
Conflict of interest: Authors state no conflict of interest.
-
Data availability statement: The dataset of pleasantness analysed during the current study is available in the NoiseCapture repository, https://noise-planet.org/map_noisecapture/noisecapture_party.html. The dataset regarding the soundwalk generated and analysed during the current study is available from the corresponding author on reasonable request.
References
[1] European Environment Agency. Technical Report, Good practice guide on quiet areas. Copenhagen, Denmark: EEA; 2014. Suche in Google Scholar
[2] Yang W, Kang J. Acoustic comfort evaluation in Urban open public spaces. Appl Acoust. 2005;66(2):211–29. 10.1016/j.apacoust.2004.07.011Suche in Google Scholar
[3] Aletta F, Oberman T, Mitchell A, Erfanian M, Kang J. Soundscape experience of public spaces in different world regions: A comparison between the European and Chinese contexts via a large-scale on-site survey. J Acoust Soc. 2023;154(3):1710–34. 10.1121/10.0020842Suche in Google Scholar PubMed
[4] Uebel K, Marselle M, Dean M, Rhodes JR, Bonn A. Urban green space soundscapes and their perceived restorativeness. People Nat. 2021;3(3):756–69. 10.1002/pan3.10215Suche in Google Scholar
[5] Liu J, Xiong Y, Wang Y, Luo T. Soundscape effects on visiting experience in city park: A case study in Fuzhou, China. Urban For Urban Green. 2018;31:38–47. 10.1016/j.ufug.2018.01.022Suche in Google Scholar
[6] Jeon JY, Jo HI, Lee K. Psycho-physiological restoration with audio-visual interactions through virtual reality simulations of soundscape and landscape experiences in urban, waterfront, and green environments. Sustain Cities Soc. 2023:99;104929. 10.1016/j.scs.2023.104929Suche in Google Scholar
[7] Chen X, Kang J. Natural sounds can encourage social interactions in urban parks. Landsc Urban Plan. 2023;239:104870. 10.1016/j.landurbplan.2023.104870Suche in Google Scholar
[8] Masullo M, Ozcevik Bilen A, Toma RA, Akin Guler G, Maffei L, The restorativeness of outdoor historical sites in urban areas: physical and perceptual correlations. Sustainability. 2021;13(10):1–23. 10.3390/su13105603Suche in Google Scholar
[9] Can A, Gauvreau B. Describing and classifying urban sound environments with a relevant set of physical indicators. J Acoust. 2015;137(1):208–18. 10.1121/1.4904555Suche in Google Scholar PubMed
[10] Benocci R, Roman HE, Bisceglie A, Angelini F, Brambilla G, Zambon G. Auto-correlations and long time memory of environment sound: The case of an Urban Park in the city of Milan (Italy). Ecol Indic. 2022;134:108492. 10.1016/j.ecolind.2021.108492Suche in Google Scholar
[11] Farina A, Righini R, Fuller S, Li P, Pavan G. Acoustic complexity indices reveal the acoustic communities of the old-growth Mediterranean forest of Sasso Fratino Integral Natural Reserve (Central Italy). Ecol Indic. 2021;120:106927. 10.1016/j.ecolind.2020.106927Suche in Google Scholar
[12] Puspagarini DA, Utami SS, Sudarsono AS, Fela RF. Soundscape study of an urban campus park. Proceedings of the 2nd Engineering Physics International Conference EPIC; 2018 31 Oct-2 Nov; Surabaya, Indonesia. AIP Conference Proceedings, 2019. 10.1063/1.5095345Suche in Google Scholar
[13] D’Alessandro F, Evangelisti C, Guattari G, Grazieschi G, Orsini F. Influence of visual aspects and other features on the soundscape assessment of a university external area. Build Acoust. 2018;25(3):199–217. 10.1177/1351010X18778759Suche in Google Scholar
[14] Indrani HC, Ekasiwi SNN, Arifianto D. Indoor soundscape model: assessing contextual factors in open-plan offices on university campuses in Surabaya, Indonesia. Build Environ. 2023;237:110267. 10.1016/j.buildenv.2023.110267Suche in Google Scholar
[15] Aletta F, Lepore F, Kostara-Konstantinou E, Kang J, Astolfi A. An experimental study on the influence of soundscapes on peopleas behaviour in an open public space. Appl Sci. 2016;6(10):276. 10.3390/app6100276Suche in Google Scholar
[16] Margaritis E, van Herry F. Combining mobile measurements on noise and soundscape evaluation in a University Campus after a renovation plan. Proceedings of the 51st International Congress and Exposition on Noise Control Engineering Inter-Noise; 2022 Aug 21–24; Glasgow, UK. Institute of Noise Control and Engineering, 2022. Suche in Google Scholar
[17] Hong JY and Jeon JY. Exploring spatial relationships among soundscape variables in urban areas: A spatial statistical modelling approach. Landsc Urban Plan. 2017;157:352–64. 10.1016/j.landurbplan.2016.08.006Suche in Google Scholar
[18] Mascolo A, Mancini S, Graziuso G, Quartieri J, Guarnaccia C. Comparison between sound pressure levels and perception: a soundscape application in a university campus. J Phys: Conf Ser. 2020;1603:012026. 10.1088/1742-6596/1603/1/012026Suche in Google Scholar
[19] International Organization for Standardization. ISO/TS 12913-2:2018 acoustics “ soundscape” part 2: data collection and reporting requirements. Geneva, Switzerland: ISO; 2018. Suche in Google Scholar
[20] Graziuso G, Grimaldi M, Mancini S, Quartieri J, Guarnaccia C. Crowdsourcing data for the elaboration of noise maps: A methodological proposal. J Phys: Conf Ser. 2020;1603:012030 10.1088/1742-6596/1603/1/012030Suche in Google Scholar
[21] Mancini S, Mascolo A, Graziuso G, Guarnaccia C. Soundwalk, questionnaires and noise measurements in a university campus: A soundscape study. Sustainability. 2021;13(2):841. 10.3390/su13020841Suche in Google Scholar
[22] Guillaume G, Aumond P, Bocher E, Can A, Écotiére D, Fortin N, et al. NoiseCapture smartphone application as pedagogical support for education and public awareness. J Acoust. 2022;151(5):3255–65. 10.1121/10.0010531Suche in Google Scholar PubMed
[23] Aletta F, Guattieri C, Evangelisti L, Asdrubali F, Oberman T, Kang J. Exploring the compatibility of “Method A” and “Method B” data collection protocols reported in the ISO/TS 12913-2: 2018 for urban soundscape via a soundwalk. Appl Acoust. 2019;155:190–203. 10.1016/j.apacoust.2019.05.024Suche in Google Scholar
[24] Margaritis E, Kang J. Soundscape mapping in environmental noise management and urban planning: case studies in two UK cities. Noise Mapp. 2017;4(1):87–103. 10.1515/noise-2017-0007Suche in Google Scholar
© 2024 the author(s), published by De Gruyter
This work is licensed under the Creative Commons Attribution 4.0 International License.
Artikel in diesem Heft
- Regular Articles
- Low-frequency cabin noise of rapid transit trains
- Utilizing the phenomenon of diffraction for noise protection of roadside objects
- Benchmarking the aircraft noise mapping package developed for a unified urban environmental modelling tool
- Acoustical analysis and optimization design of the hair dryers
- Methodologies for the prediction of future aircraft noise level
- Basics of meteorology for outdoor sound propagation and related modelling issues
- Predictive noise annoyance and noise-induced health effects models for road traffic noise in NCT of Delhi, India
- Modeling and mapping of traffic noise pollution by ArcGIS and TNM2.5 techniques
- A novel method for constructing large-scale industrial noise maps based on open source data
- Understanding perceived tranquillity in urban Woonerf streets: case studies in two Dutch cities
- Review Article
- A comprehensive review of noise pollution monitoring studies at bus transit terminals
- Rapid Communication
- The Environment (Air Quality and Soundscapes) (Wales) Act 2024
- Erratum
- Erratum to “Comparing pre- and post-pandemic greenhouse gas and noise emissions from road traffic in Rome (Italy): a multi-step approach”
- Special Issue: Latest Advances in Soundscape - Part II
- Soundscape maps of pleasantness in a university campus by crowd-sourced measurements interpolation
- Conscious walk assessment for the joint evaluation of the soundscape, air quality, biodiversity, and comfort in Barcelona
- A framework to characterize and classify soundscape design practices based on grounded theory
- Perceived quality of a nighttime hospital soundscape
- Relating 2D isovists to audiovisual assessments of two urban spaces in a neighbourhood
- Special Issue: Strategic noise mapping in the CNOSSOS-EU era - Part I
- Analysis of road traffic noise in an urban area in Croatia using different noise prediction models
- Citizens’ exposure to predominant noise sources in agglomerations