Perceived quality of a nighttime hospital soundscape
-
 ,
,

Abstract
The hospital soundscape is known for high noise levels and a perception of chaos, leading to concerns about its impact on patients, families, professionals, and other hospital staff. This study investigates the relationship between sound, Annoyance, and sleep quality in a multi-patient neurology ward. A mixed-methods approach was employed. Interviews were conducted with medical staff (n = 7) to understand their experiences with sound. Questionnaires and sleep tracking devices (n = 20) assessed patient sleep quality and Annoyance caused by sound events. In addition, listeners (n = 28) annotated 429 nighttime audio recordings to identify sound sources and rate Annoyance level, which we considered the key emotional descriptor for patients. Over 9,200 sound events were analysed. While snoring, a patient-generated sound dominated the nighttime soundscape and was highly rated for Annoyance, and staff-generated sounds such as speech and footsteps were found to contribute more to accumulated Annoyance due to their extended duration. This study suggests that patient sleep quality can be improved by focusing on design interventions that reduce the impact of specific sounds. These might include raising awareness among staff about activities that might produce annoying sounds and implementing strategies to mitigate their disruptive effects.
1 Introduction
There is increased awareness not only in the scientific world but also among the general public and political decision-makers on the negative impact of a poor soundscape quality on human life [1] and on other species [2,3]. The World Health Organization estimates that one in five residents of a European city is exposed to a harmful level of environmental noise responsible for an increased risk of cardiovascular diseases and hearing problems [4]. Numerous studies investigated how the restrictions imposed by the COVID pandemic radically changed the perceived quality of the urban soundscape [5,6,7] in the prolonged absence of human-generated sounds. Prominent sound sources in the urban soundscape, usually masked by continuous background sounds (such as traffic), were brought to our attention, highlighting the relation between sound events, Annoyance, and, ultimately, adverse health consequences [8]. Recent studies [9,10] show that sound pollution has adverse effects ranging from cardiovascular diseases, sleep disorders, chronic stress, and post-traumatic stress disorder to hearing loss on many populations, from infants to older adults in a variety of contexts both outdoors and indoors.
The hospital environment is particularly sensitive as a poor quality of the acoustic environment has the potential to both worsen patients’ health and lower the performance of professionals [11,12]. Bliefnick et al. [13] showed how patients generally perceive the hospital’s soundscape as poor mainly due to the continuous presence of sounds produced not only by alarms and other medical equipment [14,15,16] but also by human activity within units. Specifically, speech (i.e., staff conversations) is identified as the most disturbing sound source in hospital care in several studies [17,18,19] along with other mechanical and human-generated sounds such as phone calls and delivery trolleys [20]. Scientific literature ([21] for a comprehensive review) shows how from 1960 to the present day sound levels in hospitals have risen consistently by ∼0.38 dB/year in daytime [22] in spite of efforts to reduce it. Previous studies indicate how increasing nurses’ awareness and providing training on how to limit unwanted sounds (i.e., noxious sounds that negatively affect health and well-being or lead to other harmful consequences) has a clear positive impact [23,24]. However, research from the authors of this article [25,26] shows that caretakers are often unaware of the role of different sound sources and feel they have no control to improve the overall acoustic quality of the ward.
Several solutions have been developed in the hospital context to provide information on the quality of the soundscape. Generally, such technological solutions collect and measure the sound pressure level (SPL), expressed in decibels and typically A-weighted), and numerically represent its peak values on a display [27]. Nonetheless, SPL measurements are difficult for lay users to interpret [8] and do not describe the affective quality of sounds as perceived by humans [28]. Moreover, SPL measurements do not allow for the identification of the sound source, which is crucial to increase awareness and work towards the active improvement of the hospital soundscape.
This article presents the results of a study that explored the following research questions: What sounds are found in hospital wards, what are their sources (e.g., speech, mechanical sounds, snoring), and by what actions and interactions are they generated? Under which conditions and how do specific sound types within the context of hospital wards cause Annoyance and sleep disturbances? In order to explore these questions, we used a set of mixed methods including interviews with medical staff, patients’ questionnaires, sleep-tracking devices, and soundscape data collection and analysis. We apply these methods through the lenses of a soundscape studies approach as a perspective that offers us a distinction between noise as unwanted sound, and sound as a resource [29]. Our aim is ultimately to mitigate unwanted sound (i.e., commonly known as noise) in a way that the remaining sounds have a distinct ecological role in an acoustic environment. In order to create such sonic hygiene free of noise in a hospital context, we will need to rely on identifying sound sources and discovering their impact on patient sleep. Thus, our focus is on improving conditions for indoor soundscapes and developing new noise mapping strategies [30]. In this sense, our case study does not only focus on noise mitigation but also on holistically evaluating the impact of sound towards the possibility of predicting the quality of the soundscape and increasing awareness towards its active improvement.
The results of the study aim to contribute to the definition of novel solutions that integrate computational models and design-driven interventions for the monitoring and mitigation of sound-induced sleep disturbances, and the improvement of the ward’s soundscape. Towards these ends, the new solutions should be able to provide healthcare professionals with relevant information on the “footprint” of the ward’s sounds, i.e., the impact of different sound sources [27,30], so that they can take action to improve the hospital soundscape and consequently the wellbeing of patients.
1.1 Context: hospital sound and sleep
Since humans subconsciously perceive and react to sound even while asleep [31], sound events are a significant environmental factor that can interfere with our regular sleep patterns. Sound can act as an external stressor, inducing neurophysiological changes in brain regions linked to cognition and emotion, particularly the prefrontal cortex, amygdala, and hippocampus [32]. Sudden foreground sounds trigger the listener’s directed attention reorientation reflex; chaotic soundscapes further disrupt recovery by preventing arousal from returning to baseline between sound events [33]. Sleep interruptions by sound elevate physiological and cardiovascular activity, leading to sleep disturbances and increased risk of stress, fatigue, and even mental health problems [34]. The detrimental impact of sound on sleep is particularly relevant for hospitalised patients, whose well-being is already compromised [35,36,37]. Among other sound sources, snoring has been recently identified as a major contributor to sleep disruption [38]. Muzet’s [39] review underscores the influence of the sound type (e.g., continuous, impulsive, intermittent) and the frequency spectrum on sleep quality in exposed patients. There are correlations between disruption and Annoyance; that is being disrupted by (unwanted) sound causes sound Annoyance (Marquis-Favre et al.) [40]. We define an annoying sound event as a sound that has the potential to intrude and impede the listener’s activity, in our case, sleeping.
As shared acoustic biotopes [12] in which multiple actors and multiple interactions take place, hospitals present an ambiguity of functions, which can change over the time of the day. For example, a patient room should be conducive to caregiving activities as well as resting and sleeping. Consequently, the hospital soundscape is characterised by potentially colliding sound events of which nurses should be aware to prevent their negative consequences. However, mitigating the sleep disruption problem by sound is still an ongoing effort in the field of sound-driven design for healthcare [41,42]. With this study, we aim to contribute to this ongoing research by specifically investigating the Annoyance caused by sound events and its association with disturbed sleep. As a following step, we will use data collected in the study to define a computational model of sound-induced sleep disturbances in hospital wards.
2 Methods
This research started in the Neurology Department of Reinier de Graaf hospital in Delft, the Netherlands [25]. The hospital has been interested in addressing noise-induced sleep disturbances through design solutions. All the experimental activities described in this study took place in this specific context, with the final goal of designing an intervention that would allow for an environment conducive to sleep. Reinier de Graaf hospital’s neurological ward consists of 4 four-patient rooms and nine single-patient rooms connected by a long corridor. The hospital, opened in 2015, is about 2 km from the centre of Delft in a residential area with a two-lane busy road on one side of the hospital. Windows, which cannot be opened, are three layered and have Integrated blinds. The exterior wall of the hospital meets the highest requirements for sound insulation (G ak = 38 dB(A), where G ak is the Dutch equivalent for D2m,nT,w, i.e., the weighted standardised façade level difference for buildings acoustic insulation (see ISO 717-1:2020 [43]) as established in the ISO 12354-3:2017 [44] and the Dutch Noise control in buildings standard (NEN-EN 12354-3 [45]).
In an earlier study [25], the hospital and the authors conducted semi-structured expert interviews with nurses to see whether sound was an issue for patient sleep in the ward. The thematic analysis of the interviews [46] suggested that the nurses collectively believe that while most sound events in a single-patient room are unlikely to disrupt sleep, patients may not get enough sleep due to the periodic check-ups which require waking. Conversely, patients residing in the four-patient rooms may not be getting enough sleep mostly due to other patients’ influence. Upon compiling all of the sound sources that the nurses had described, various sound categories were identified that characterise the acoustic environment of the ward under study, including sounds produced by hospital employees, patients, visitors, the environment, and medical equipment [25]. The keywords and sound source categories we identified determined the design of the quantitative study presented in this article which aimed to identify the sound sources potentially disrupting patients’ sleep. The study employed several different methods and notably questionnaires to patients, collection of patient sleep data through Fitbit devices, and collection of soundscape data (sound recordings). The study was approved by the Medical Ethics Review Committee (in Dutch, METC) for the Leiden – Den Haag – Delft area (ref. no. N20.148).
2.1 Patient sleep study
Twenty patients participated in the experiment. Each provided their informed consent, and the patients who also slept in the same rooms, without being monitored (see further below), also provided their informed consent. Patients were sleeping in different yet structurally identical four-bed rooms of the neurological ward, between March 15 and April 4, 2021. Data were collected from each patient on two different nights. Depending on patient occupancy and availability, the “start” and “end” of nighttime were slightly variable. We included data collected between 9:30 pm and 7:30 am, i.e., a duration of 10 h.
2.1.1 Patient questionnaire
The patients filled out a questionnaire in the morning after each night they participated in the experiment. Complete data were obtained from 32 observations. The questionnaire was conducted in the Dutch language, and for convenience, terms are translated into English. It included five self-ratings of sleep quality, eight ratings of disturbing sounds, and one overall assessment. The patients’ questionnaires used Likert scales with four levels: self-ratings: completely disagree – disagree – agree – completely agree; Environment ratings: never – sometimes – often – always; General rating: very annoying – somewhat annoying – somewhat pleasant – very pleasant. In the present exploratory analysis, we interpret the Likert scales as interval scales, with values 1, 2, 3, and 4.
2.1.2 Arousal detection
For an objective measurement of sleep quality, we employed Fitbit Inspire HR health tracking bracelets. In the sleep experiment, they were worn by three of the patients in each room. To prevent the “first-night effect” [47], bracelets were worn solely by patients who had been hospitalised for at least one night before the data collection. The device gathers time-stamped data at a 30 s resolution regarding the user’s four sleep stages – i.e., awake, rapid eye movement sleep, light sleep, and deep sleep. Fitbit technology has demonstrated a high degree of reliability in identifying transitions from deeper sleep stages to awake when compared to polysomnography, the gold-standard (although intrusive) scientific method for tracking sleep. On the other hand, it is largely ineffective at differentiating between deep and light sleep stages [48]. Consequently, starting from the raw Fitbit data, we filtered only and exclusively the events corresponding to a transition from a deep or light sleep stage to an awake state and labelled them as arousals. Data were captured from 19 patients in 30 observations, totalling 474 arousal events.
2.1.3 Statistical methods
In the post hoc analysis of data, we employed only standard statistical methods: first, multivariate analysis of variance (MANOVA) and univariate analyses of variance (ANOVAs), with assumptions tested in cases of significance; second, exploratory factor analysis (EFA) to identify latent factors in the patients’ questionnaire responses (Section 3.1.1); third, comparison between dependent (latent factors) and independent (measured) variables in a cross-correlation analysis, using a non-parametric statistic (Section 3.3).
2.2 Hospital soundscape analysis
2.2.1 Sound recordings
In parallel with capturing the sleep quality state of patients using Fitbit devices, we recorded the room’s acoustic environment using an Audio-Technica AT2020 cardioid microphone (mono, 16 bits, 48 kHz). For the microphone stand not to encumber normal movement and activities in the room, it was placed adjacent to the wall facing the entrance door (Figure 1). The microphone, powered by a Blue Icicle preamplifier, was controlled by a MATLAB script running on a common laptop. The software recorded continuously over the course of the whole night, i.e., approximately for 10 h, using the same audio recording equipment and level settings.

Layout of a four-patient room with microphone placement, as seen from above.
All the captured data, sleep tracking and audio recordings, were time stamped and synchronised. When triggered by a Fitbit-detected arousal, the software extracted a 30 s audio file capturing the room soundscape immediately preceding the disturbance. In 45 out of the 474 detected arousals, there was a short silent gap in the recording due to technical issues, and they were therefore excluded. The remaining 429 excerpts had a total duration of 3 h, 42 min, and 30 s. In the next step (see Section 3), this set of soundscape recordings was tagged and analysed, with the purpose of identifying which sounds and events may have acted as external causes for the detected sleep disturbances.
2.2.2 Annotation procedure
The procedure of sound source annotations had been developed by two of the authors of this article for the evaluation of recordings of urban soundscapes during the COVID lockdown [5], and it was adapted for the present study. Thirty participants, here referred to as “annotators” were recruited to evaluate the 429 soundscape recordings, all confirmed being in normal health and having no hearing loss at the time of the task. In a first round, 18 participants were recruited by snowball sampling among undergraduate and research students currently in or having completed a sound-focused class. Their mean age was 26 years, with a range between 18 and 40, and consisted of 11 females and 7 males. Their work lasted approximately 90 min. Two of them were excluded due to low consistency in performing the task. The average number of soundscape recordings by each annotator was 5.5. To assure high quality in ratings, we then recruited a second round of 12 annotators considered as expert raters (research students and assistants in the authors’ labs, together with the authors themselves). Their mean age was 30 years, ranging between 24 and 55, and comprised 10 females and 2 males. The average number of soundscape recordings by each expert was 27.5, taking 3–4 h.
Each file was opened using the Audacity® software with settings as follows: spectrogram (80–8,000 Hz Mel scale), grayscale, and full-width and full-height display. The annotators wore headphones (Audio Technica ATH-M70X or a similar closed-back monitor headphone). Annotators were instructed to mark as many sound sources as they could (aiming at around 6–15 in each 30 s recording), focusing on “sounds that you think could disturb somebody’s sleep.” In the Audacity® interface, they would select the start and end points of the sound event in the corresponding spectrogram using the “Label” function (Figure 2). A set of nine labels, notably “beep,” “breath,” “clothes,” “cough,” “footstep,” “furniture,” “mechanical,” “snore,” and “speech,” extracted from the thematic analysis of the medical staff’s interviews (Section 2.1) were provided to annotators to be used in the labelling task. A “other” category was added. The annotators were then asked to label each selected sound event using the nine categories provided (or the “other”) and to rate the Annoyance that each annotated sound source might cause.
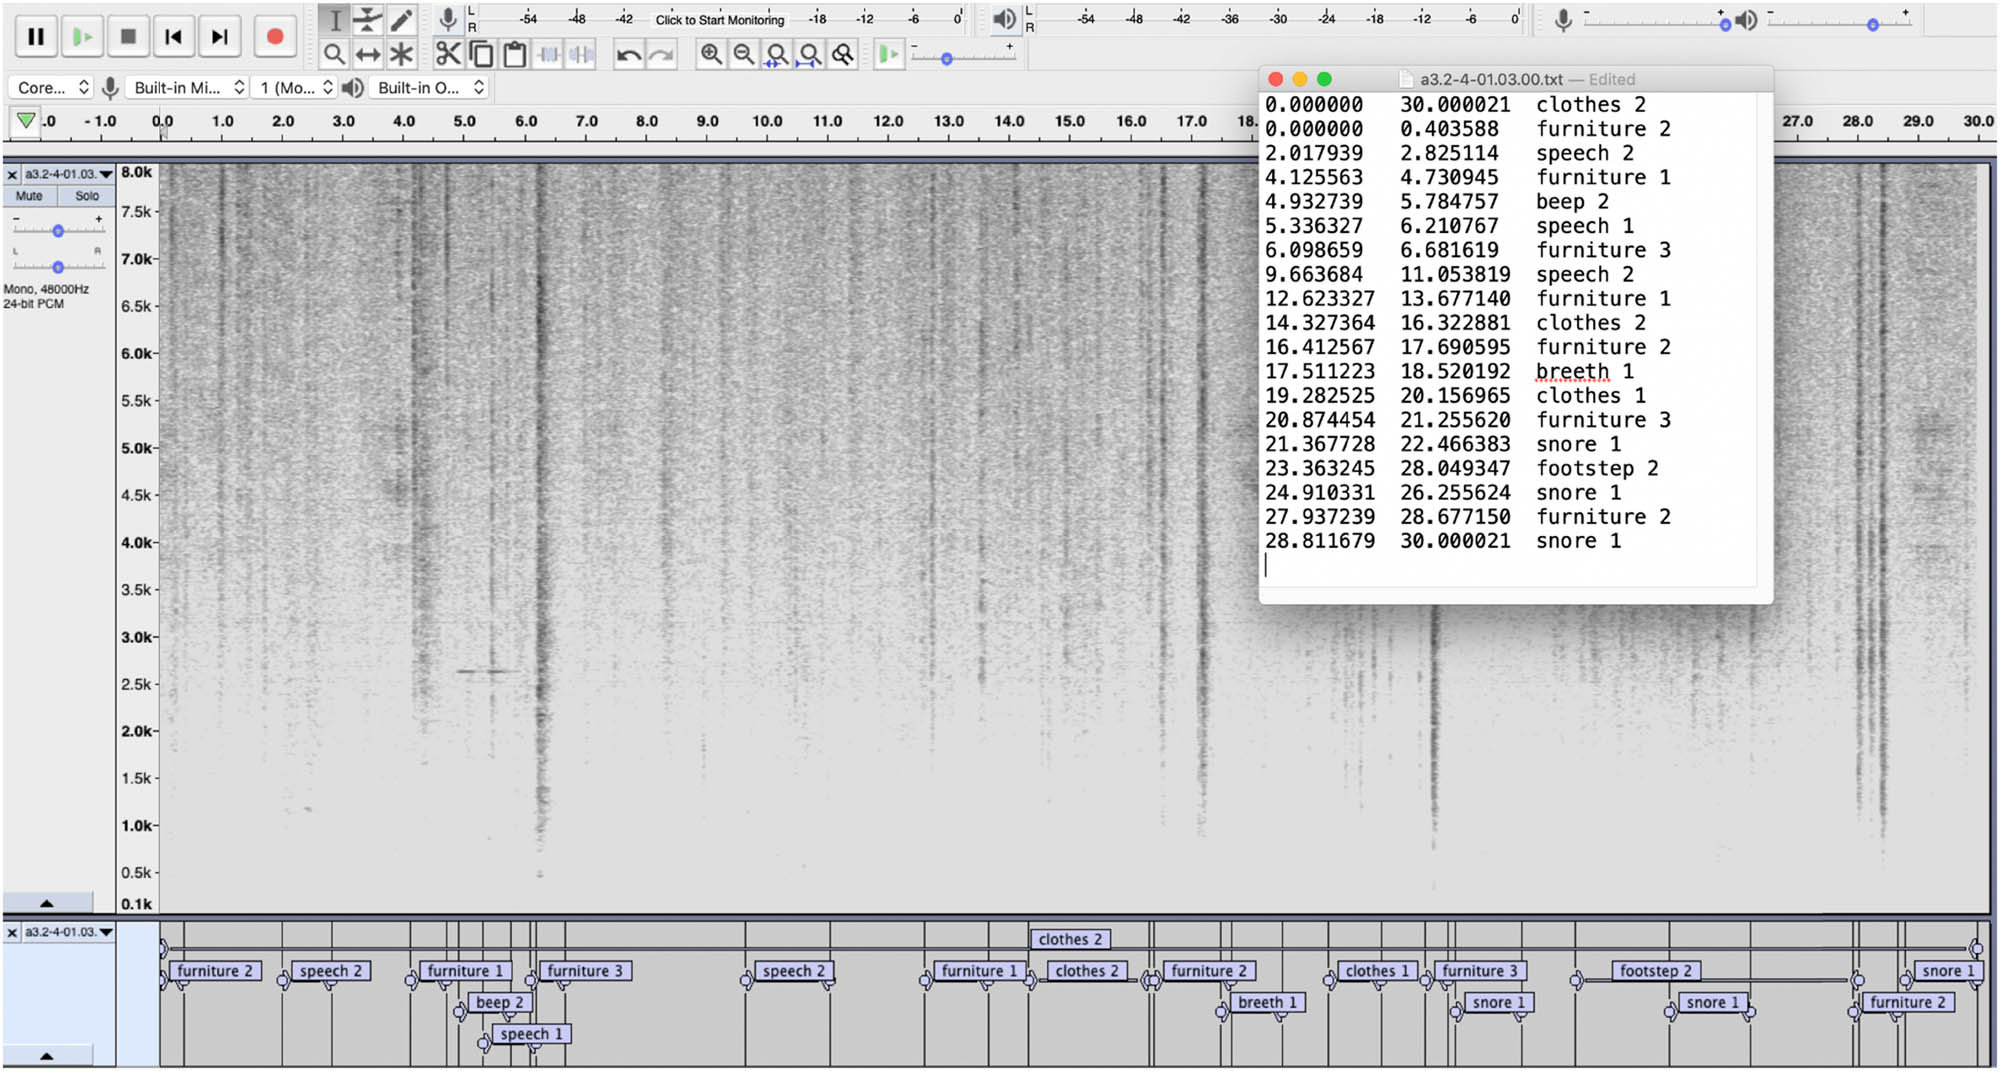
Screenshot of Audacity® interface showing a spectrogram of a sound file with several labelled annotations, and a window with the exported text file. Note that one label was misspelt in this example.
A three-step Likert scale was employed, with numerals 1, 2, and 3 referring to low, medium, and high perceived Annoyance, respectively. In the instructions given to the annotators, it was stressed that Annoyance should be rated within the given category of sound and independently of loudness and duration. Hence, for example, “breath 3” would indicate a highly annoying sound event, and more annoying than “snore 2” even if the latter might very well be louder than the former; meanwhile, duration was captured by the label’s end and start points. The three-step scale was adapted from the protocol developed by one of the authors in the study by Lindborg [49] to assess an estimate of the liking (where “dislike,” “neutral,” “like” were coded as numerical −1, 0, and 1, respectively) of sound sources in indoor (restaurant) soundscapes. Thus, in the present study, annotators were instructed to add a number from 1 to 3 to the word label for each sound event in the Audacity® software and export all labels in text form.
3 Results
We present the comprehensive findings and analyses derived from our experiments, with the aim of shedding light on the research questions of this study.
3.1 Analysis of the patient sleep study
3.1.1 Analysis of patient questionnaires
The means for self-ratings across patients, in order from agreeing more to less, were “Quiet falling asleep” (mean = 2.88), “Sleep satisfaction” (2.62), “restless sleep” (2.59), “awoken by sounds” (2.47), and “difficulty falling asleep” (2.22). The differences in means were very small between these scales. Among the environment ratings, we retained six for further analysis. In order of higher to lower frequency of causing disturbance (to the patients), they were: “Snoring [by other patients]” (mean = 2.03), “Actions of medical staff” (1.78), “Voices of medical staff” (1.62), “Personal medical devices” (1.47), “Voices of other patients or visitors” (1.47), and “Trolleys” (1.44). Here as well the differences are rather small, but there are intriguing patterns that will be investigated further below. The mean general assessment of “Soundscape quality” was 2.84. Please note that these means are reported here for the convenience of making an initial comparison. See Figure 3 for distributions on questionnaire responses. See also Datafile 1 for aggregated patient data.
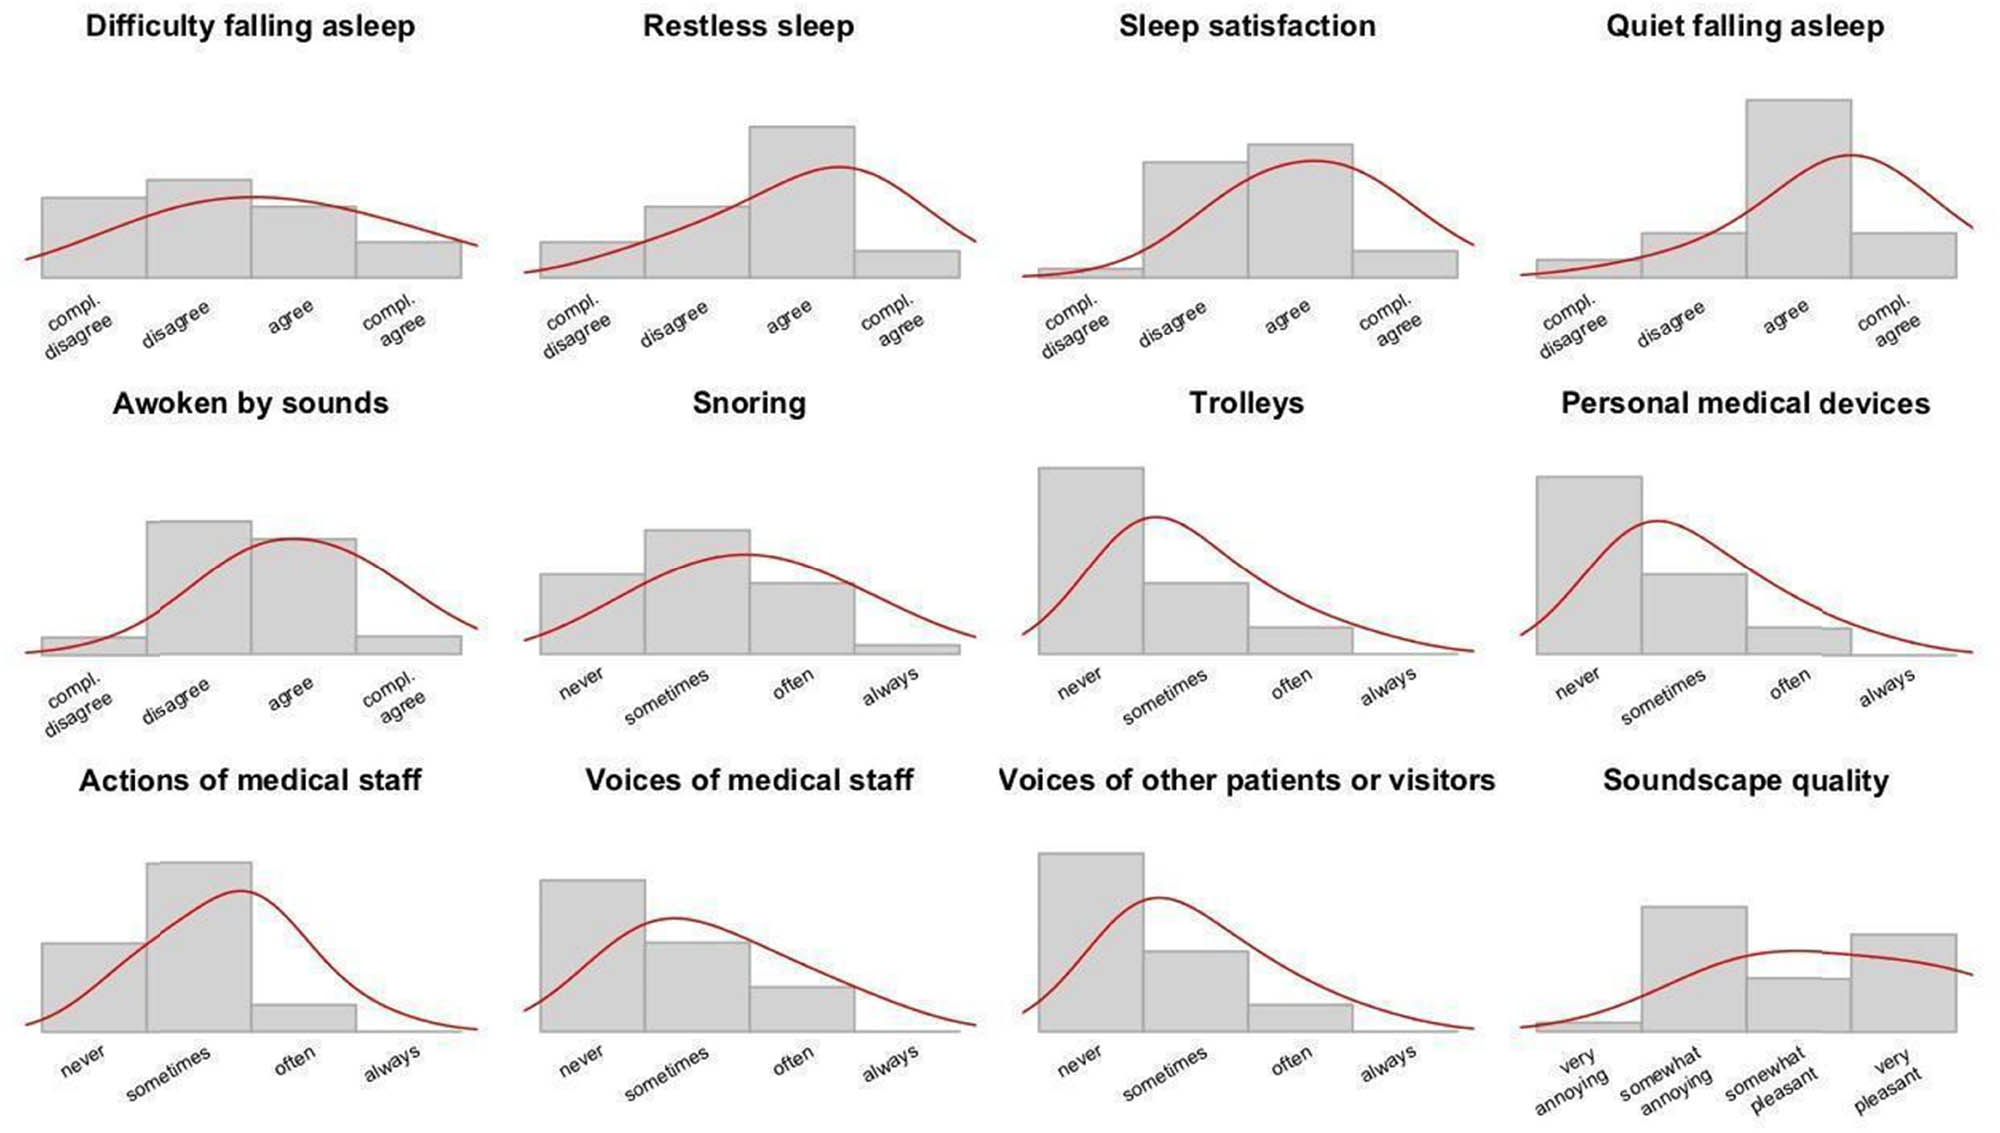
Responses on the patient questionnaire. Histograms in top row: self-ratings; middle and bottom rows: room ratings; bottom right: overall assessment of the sonic environment. X-axes are Likert scale labels; Y-axes represent the density of response alternatives.
To explore whether the questionnaire responses depended on the experimental conditions, we conducted a MANOVA taking the questionnaire scales as dependent variables, and night, room, and patient as the independent factorial variables (with 2, 7, and 20 levels, respectively). Results revealed that responses did not significantly differ between nights (Pillai = 0.93, F = 2.3, p = 0.33) or patients (Pillai = 6.2, F = 1.3, p = 0.073), but did so between rooms (Pillai = 4.4, F = 1.6, p = 0.044*). To find out in what way, we conducted a series of univariate ANOVA, taking in turn each of the questionnaire responses as the dependent variable and only room as the independent variable. For three scales, responses varied significantly between rooms: “Soundscape quality,” “Quiet falling asleep,” and “Voices of medical staff.” For each of the three, the standard ANOVA assumptions were met: observations were independent (i.e., separate patients in separate rooms); residuals were normally distributed according to Shapiro-Wilk’s test; and there was homogeneity of variance according to Levene’s test. Furthermore, plots revealed no systematic bias between scale responses, depending on room. These results reflect the subjective experience of the patients during a night of sleep.
The 12 rating scales in the questionnaire were developed with the assumption that they would cover essential aspects of the patients’ sleeping experience. They can be understood as latent factors in the data, and EFA provides an estimate of the correlations between rating scales and the latent factor(s). In the present study, we used the nfactors() function in the psych package [50] running in R [51], specifically the output of VSS analysis [52] to identify three optimal factors. This supports the questionnaire’s division into three sections. The fa() function from the same library, with settings for ordinary least squares regression and promax rotation, then yielded a minimum residual solution explaining 59% of the variance in the data with factors that lent themselves to a straightforward interpretation (Table 1).
Factor analysis of responses on the patient questionnaire. For clarity, only loadings >0.5 are shown
| Room | Objects | Self | ||
|---|---|---|---|---|
| Self-ratings | Difficulty to fall asleep | 0.82 | ||
| I slept restlessly | 0.71 | |||
| I was satisfied with my sleep quality | ||||
| Quiet enough to fall asleep | −0.51 | |||
| I woke up to sounds around me | 0.66 | |||
| Environment ratings | Snoring of other patients | |||
| Trolleys | 1.07 | |||
| Personal medical devices | 0.77 | |||
| Actions of medical staff | 0.72 | |||
| Voices of medical staff | 0.95 | |||
| Voices of other patients or visitors | 0.66 | |||
| General | Overall assessment of sonic environment | −0.78 | ||
| Proportion variance | 0.26 | 0.19 | 0.14 | |
| Cumulative variance | 0.26 | 0.45 | 0.59 |
The first factor, explaining 26% of the data, loaded onto “Voices of medical staff,” “Actions of medical staff,” and negatively onto “Soundscape quality.” It also captured two aspects of self-ratings, “Awoken by sounds” and negatively by “Quiet falling asleep.” It appears that the underlying factors capture sound events happening in the room, and the patients’ evaluation of the resulting quality. We labelled the latent factor “Room.” The second factor, explaining 19% of the data, loaded onto “Trolleys,” “Personal medical devices,” and “Voices of others,” and we labelled it “Objects.” The intriguing case of voices by non-staff is further discussed in the section on sound source classification. Finally, the third latent factor, explaining 14% of the data, loaded onto “Difficulty falling asleep” and “Restless sleep,” thus quite clearly capturing a negative evaluation of the sleep as experienced by the patient himself or herself.
In summary, the factor analysis suggests that the nighttime soundscape, as evaluated by patients, was negatively affected by voices and actions produced by medical staff. They also noted sounds from specific objects and voices from others. Several questionnaire responses reflect that patients were disturbed during the night (in particular, “Restless sleep” and “Awoken by sounds”). To support these subjectively based findings, we also measured sleep quality in an objective way, described in the next section.
3.1.2 Analysis of arousal data
Similar to the analysis of questionnaire data described in the previous section, we conducted an ANOVA by taking the number of arousals per observation as the dependent variable and the experimental conditions as independent factors. Results revealed that arousals did not significantly differ among nights, rooms, and patients (p > 0.3 in all cases). This should be interpreted to say that sleep quality did not depend on experimental conditions.
However, the patients did report different experiences, in regards to “Soundscape quality,” “Quiet falling asleep,” and “Voices of medical staff,” which is not reflected in the Fitbit data. It might be that the multifaceted questionnaire was able to capture subjective and more subtle nuances in the sleep experience. Or, it might be that the patients’ awareness of reduced sleep quality did not come from memories (the following morning) of how many times they had been disturbed during the night, and most certainly not by what exact sound. Rather, the questionnaire responses would be more easily explained as based on observations patients had consciously made before falling asleep, such as being annoyed by the lack of quiet or staff voices or experiencing such incidents upon awakening in the morning. This is not a fault of the observational acuity of questionnaire respondents, but simply reflecting that it is unusual, to say the least, to be rational about sounds we perceive while sleeping [31] and extremely hard to remember anything external at all that might have happened during sleep. So how could we find out which noises might have contributed to nighttime arousals, stirring patients and half-waking them up? To investigate the potential causes of sleep disturbances, recordings of the sonic environment were analysed.
3.2 Analysis of the hospital soundscape study
3.2.1 Sound source classification
The semi-structured interviews with medical staff pointed towards a rather large number of potential sources for disturbing noises. This information was used in the development of the patient questionnaire. In addition, we conducted an initial analysis of sound recordings, which yielded six categories (plus “other”) of sound sources and events [25]. These analyses constituted the starting point for a detailed classification of the sound sources, and their Annoyance level, at the nighttime hospital wards. Going from the patient questionnaire, via the initial analysis, to the second (soundscape) analysis, the following section explains how we interpreted sources and events in the sleeping environment. See Figure 4 for a schematic overview of the process of classification. Note that in the context of the present study, “sound source” and “sound event” are considered to be the same thing.

Schematic representation of the classification of sound sources used in the case study, integrating terms and labels from three successive steps: (1) patient questionnaire, (2) initial analysis of soundscape recordings, and (3) detailed annotations and analysis of recordings.
The overall most prevalent kind of sound was “snoring.” This category in the patient questionnaire was split into “snoring” and “coughing” in the initial analysis and then in the soundscape analysis further detailed to include “breath” as a separate category. The questionnaire’s categories for “staff voices” and “other voices” were merged in “speech,” and through detailed listening. it was determined that all voices were in fact made by personnel and categorised accordingly. The “staff actions” that the patients rated might refer to different actions and sound sources. It appeared that the most common source directly attributable to personnel actions was “footsteps.” Meanwhile, the patient questionnaire rated “trolleys,” which in the initial would be “incidental sounds” and as such fairly common in the soundscape analysis, where they were divided into two distinct categories, “mechanical” (typically, trolley sounds, also metal plates, etc.) and “furniture” (doors closing, beds creaking, etc.). The two categories “TV, telephone” and “Liquids (toilet flushing)” in the patient questionnaire were in the initial analysis merged under the “other sounds” label but were not present to the ear in the soundscape analysis. Finally, “medical devices” or “alarms” (heard as “beeps”) retained a distinct category throughout the process.
This yielded nine categories for the soundscape analysis. They were labelled as follows: beep, breath, clothes, cough, footstep, furniture, mechanical, snore, and speech. In addition, a rest category was included as: “other (specify),” though eventually, no annotated sound needed to use it. The nine basic categories were allocated to two higher-level and non-overlapping categories (i.e., forming a taxonomic clade) following a procedure previously used by the authors [49,5].
Sounds labelled as “breath,” “cough,” and “snore” were all produced by patients. Note that they are mouth-made sounds rather than voices. So, what about “patient voices”? Based on annotations and subsequent careful re-listening by the authors, there was no sound event that could clearly be understood as “patient voices,” for example, either a patient talking in their sleep, or patients chatting between themselves. There would have been events where a staff member speaking with a patient (perhaps the staff responding to a call from the latter or administering medicine); however, in the present analysis, it appeared reasonable to group such sound events under “staff actions.” Sound labelled as “footstep” and “speech” were put under “actions” by medical staff, while “mechanical,” “beep,” and “furniture” were considered “objects” that are also under the control of medical staff. Finally, sounds labelled as “clothes” could have been generated by movements either by personnel or patients. Since it was impossible to know which, “clothes” was not included either.
3.2.2 Results from annotations
In total, annotators identified 9,296 sound events in the recordings. See Datafile 2 for the complete annotations data. Raw annotations were tidied up (changing to lowercase, removing trailing blank spaces and non-letter symbols, correcting spelling mistakes, grouping by synonyms, e.g., snore-snoring or breath-breathing, and so forth) and allocated to the nine predetermined categories. In a small number of cases, the annotator had used the “other” category. These were individually listened to by the researchers and either interpreted in one of the predetermined nine categories or removed. After this, the repartition among categories was as follows: “snore” (47.0%), “breath” (25.0%), “furniture” (6.4%), “mechanical” (5.9%), “speech” (5.7%), “clothes” (4.4%), “footsteps” (2.3%), “beep” (2.1%), and “cough” (1.2%). See Table 2 for an overview of all the statistics that were derived.
Overall statistics for 9,296 sound events labels in 429 nighttime recordings
| Count | Frequency (%) | Duration | Annoyance (raw) | Annoyance (scaled) | Integrated Annoyance | Cumulative Annoyance | |
|---|---|---|---|---|---|---|---|
| Beep | 193 | 2.1 | 2.34 (1.67 to 3.00) | 1.86 (1.74 to 1.98) | 0.13 (−0.01 to 0.26) | 0.97 (0.67 to 1.27) | 187 |
| Breath | 2,322 | 25.0 | 1.90 (1.78 to 2.02) | 1.34 (1.32 to 1.37) | −0.43 (−0.46 to 0.39) | 0.56 (0.51 to 0.60) | 1,289 |
| Clothes | 408 | 4.4 | 2.53 (2.23 to 2.84) | 1.34 (1.28 to 1.39) | −0.49 (−0.56 to 0.41) | 0.92 (0.74 to 1.10) | 375 |
| Cough | 111 | 1.2 | 1.42 (1.27 to 1.57) | 2.18 (2.04 to 2.32) | 0.91 (0.63 to 1.20) | 0.65 (0.32 to 0.99) | 72 |
| Footstep | 216 | 2.3 | 2.57 (2.23 to 2.92) | 1.47 (1.39 to 1.55) | −0.32 (−0.43 to 0.22) | 0.94 (0.66 to 1.22) | 203 |
| Furniture | 599 | 6.4 | 1.46 (1.29 to 1.62) | 1.62 (1.56 to 1.68) | −0.17 (−0.24 to 0.09) | 0.10 (−0.04 to 0.24) | 62 |
| Mechanical | 551 | 5.9 | 8.21 (7.22 to 9.19) | 1.49 (1.44 to 1.55) | −0.36 (−0.43 to 0.29) | 1.41 (1.19 to 1.63) | 775 |
| Snore | 4,365 | 47.0 | 2.22 (2.14 to 2.30) | 2.09 (2.07 to 2.11) | 0.33 (0.30 to 0.35) | 1.48 (1.43 to 1.53) | 6,442 |
| Speech | 531 | 5.7 | 3.65 (3.20 to 4.10) | 1.77 (1.70 to 1.83) | 0.02 (−0.06 to 0.11) | 1.64 (1.42 to 1.86) | 870 |
| Patients | 6,798 | 73.1 | 2.10 (2.03 to 2.16) | 1.84 (1.82 to 1.86) | 2.08 (2.05 to 2.10) | 1.15 (1.11 to 1.19) | 7,804 |
| Behaviours | 747 | 8.0 | 3.34 (3.00 to 3.68) | 1.68 (1.63 to 1.73) | 1.92 (1.85 to 1.99) | 1.44 (1.26 to 1.62) | 1,073 |
| Objects | 1,343 | 14.4 | 4.35 (3.90 to 4.81) | 1.60 (1.56 to 1.64) | 1.80 (1.75 to 1.85) | 0.76 (0.64 to 0.88) | 1,024 |
Means, with limits for a 95% confidence interval, are given for durations and three different Annoyance estimates. Integrated Annoyance is the product of Annoyance (scaled) and the logarithm of the sounds’ duration; Cumulative Annoyance is Integrated Annoyance summed over all occurrences. The first nine rows are for the predetermined sound types, and the last three are for the higher categories, as defined in the text. We did not distinguish between inhalatory and exhalatory snoring; this might be the focus of another study.
From counts and percentages in the sound categories, two estimates of inter-rater agreement among the annotators (N = 28) could be calculated. For each annotator, we extracted the number of labels in each of the nine sound source categories relative to the total, and their Cumulative duration relative to the total, as captured by the labels. We then tested agreement in two ways: first, by using functions in the DescTools package [53], Krippendorff’s alpha was found to be 0.79 for label counts and 0.71 for label durations, and second, by calculating Spearman’s rho on the vectors pairwise. For the number of labels, the median correlation was 0.85 in a range [0.54, 0.90], and for durations, it was 0.80 in a range [0.37, 0.85]. While the evaluation of the Krippendorff statistic is context sensitive [54], we found that the overall level of agreement among annotators was good and decided to keep data from all 28 annotators.
Recall that the annotators gave each labelled sound a value (1, 2, or 3) to indicate its level of Annoyance (low, medium, or high) within that category of sound. We treated the three levels as numerical values on an interval scale. Error bars are plotted in Figure 5.

Annoyance (raw) rated by annotators (N = 28) in nine sound source categories; means with 95% confidence intervals. Compare with classification in Figure 4.
Looking at means within categories (see Datafile 2), the highest Annoyance estimates were for “cough” (mean = 2.80) and “snore” (2.09). However, these kinds of sounds were of different character: coughing appeared less frequently (1.2% of annotations) and were of shorter duration (1.42 s on average) than the very prevalent snoring (47%) that were typically longer (2.22 s). Slightly less annoying were “beep” (alarms and other signals) and “speech” (almost exclusively communication amongst the nursing personnel). Similar to the previous pair, their occurrence was different: beeps were less frequent and shorter than speech. The Annoyance levels of sounds under “furniture,” “footsteps,” and “mechanical” were comparable, but the durations differed greatly. In fact, the “furniture” category included intermittent sounds such as the closing of doors, while “mechanical” included several occurrences of continuous background noise from air conditioners. Finally, the least annoying (yet still a potential cause for sleep disturbance) were sounds from breathing and the rustling of clothes, which were similar in terms of duration and frequency. These observations caused us to carefully consider the duration of potentially disturbing sound events. As mentioned earlier, Annoyance was rated for each sound event on a scale 1–3. Noting that the annotators used this scale slightly differently, we z-scaled the values within each annotator, putting the centre at 2 (corresponding to ‘medium’ Annoyance) and giving the distribution a standard deviation of 1. Since the distribution of Raw Annoyance ratings within the annotator was always positively skewed, the variable scaled this way did not have a range of [1, 3] but instead [0.26, 10.9]. However, and importantly, the interquartile range was [1.1, 2.9], which is indeed close to [1, 3]. This motivates employing the z-scaled variable to operationally define two indices of the negative impact that sounds of different types might have on sleep. They are defined as follows:
Normalised Annoyance, A z is the z-scaled Annoyance, A raw, within each Annotator centred on 2:
Integrated Annoyance, A
int, is Normalised Annoyance, A
z
, multiplied by the logarithm of the sound’s duration,
Cumulative Annoyance, A
cum, is the sum of A
int for all sound annotations within a given time interval,
See Table 2 for an overview of the results, listing mean values for raw, scaled, Integrated, and Cumulative (total) Annoyance for each sound category and the three higher-level categories (as described in Section 3.3.2) in the annotations data. First, looking at the raw counts (or frequency), we note that almost half (47%) of the annotated events were “snoring.” Note that each individual snore was separately labelled and that they most often appeared in a series of three or more, sometimes but not always with more or less intensive “breaths” (25%) in between snores. “Furniture,” “mechanical,” and “speech” followed at around 6% of the annotations. Second, taking duration and rated Annoyance into account might produce a more nuanced picture of sleep disturbances. We note that “speech” had the highest Integrated Annoyance (because voices tended to be present for a longer time) followed by “mechanical,” which had the longest average duration, and “snore.” The last column in Table 2, Cumulative Annoyance, gives a measure for how much, in the whole dataset, the Integrated Annoyance for each sound category amounted to. Again, “snore” is clearly the primary culprit, followed by “breath,” “speech,” and “mechanical”; the remaining four categories, including “beep,” might be safely given less attention in future research.
3.2.3 To modelling a “typical night”
Second, we gathered information on the distribution of annoying sounds to chart out a “typical” night to identify sleep-disturbing sound sources. Estimates for Annoyance were obtained for pre-determined sound categories and post-determined higher-level categories. The number of occurrences and duration of the annotated sounds, and their Annoyance levels, were calculated to obtain Integrated and Cumulative Annoyance levels for each category as well as the three higher-level categories. Integrated Annoyance was then calculated in time windows over the nightly recordings (9:30 pm to 7:30 am) to obtain an estimation of the prevalence of sleep-disturbing sound events. Within the three higher-level categories, personnel-generated behavioural sounds have the highest level of Integrated Annoyance (1.44). Recall that Integrated Annoyance depends on the (logarithm of) duration of sound events, as well as their rated Annoyance level (Table 2). This finding is critical in supporting design-driven interventions towards the improvement of patients’ well-being in hospital wards. Sounds belonging to this category are, in fact, actively produced by nursing staff during their work routine (notably, “speech” and “footsteps”), and their potential to disrupt sleep increases as a function of their Cumulative duration over time. As such, they can be actively mitigated to reduce their negative impact. Within the object’s sounds, mechanical sounds have a higher Annoyance level. Even if sounds in this category occur less frequently than, for instance, furniture sounds, they tend to have a longer duration which is responsible for a higher Integrated Annoyance level. This might be due to the presence, within this category, of continuous sounds such as background noise generated by air conditioning and heating systems. Alarm (“beep”) sounds, very often indicated as a critical source of discomfort for hospital patients and nursing staff [55] present low Cumulative Annoyance. This is perhaps not surprising in the context of the ward under study, where alarms occur far less frequently than, for instance, intensive care units in which alarms represent a major health concern. In general, this is yet another evidence supporting the claim that the evaluation of the soundscape quality is highly context dependent [56].
See Figures 6 and 7 for illustrations of how Integrated Annoyance of different sound types developed over the course of a typical night, with “snoring” being by far the most annoying sound event, followed by “breath,” “speech,” and “mechanical.” The reader will recall that the sound samples analysed in this study immediately precede each single arousal as collected by the tracking bracelets. Therefore, the curves can be interpreted as an index of the probability that a given sound type caused a sleep disturbance at that point in time.

Estimated disturbance of sounds in the nine categories over the course of a typical night. Values are accumulated Integrated Annoyance in time windows of 20 min with 50% overlap.

Estimated disturbance by patient-generated sounds set against disturbance by personnel-generated sounds (behaviours and objects) during a typical night. Values are accumulated Integrated Annoyance in time windows of 20 min with 50% overlap.
Preliminary experimental findings highlight an accumulation of snoring sounds rated with the highest Raw Annoyance level in the interval from 12:00 am to 4:00 am. This might be due to contextual and environmental factors, i.e., it is the time of the night when patients are normally in a deeper sleep state, and there is a limited presence of other sound sources, i.e., annotators might have tended to interpret as more annoying those sound sources that “intruded” on the soundscape. This interpretation aligns with one of the co-authors’ previous interpretation that noise sensitivity (a predictor of Annoyance), as a self-report measure, captures an evaluative predisposition towards sounds rather than aspects of auditory processing or noise exposure per se [57]. The highest sound Annoyance is found between 3:00 am and 4:00 am. In this frame, a higher Integrated Annoyance for patient-generated sounds (breathing and snoring) corresponds to higher Annoyance level for speech, which is a sound voluntarily generated by nursing personnel (Table 2). This finding suggests a direct correlation between the increased occurrence of speech sounds and disturbance in patient sleep, and as mentioned, its negative impact could be prevented if nurses are made aware of the consequences of their sound-producing behaviour. Note that this time frame coincides with the last “big” night shift before the last night shift (which takes place around 6 am, see next paragraph). During this shift, nurses are active with major caregiving activities such as administering medicines. In shared patient rooms, this will create awakening and further induce more sound-producing events such as coughing or conversations between patients or patients and nurses. In addition, it is commonly known that nurses do activities to keep themselves busy and active to maintain an awake state. They may socialise in the central nurse station or in the corridor, and these activities may contribute to nocturnal noise.
Towards the end of our data collection timeframe, Cumulative Integrated Annoyance tends to grow for all the sound categories. Between 6:00 am and 7:00 am speech, furniture, beep, footsteps, and cough become more frequent and annoying (Figures 6 and 7). This is most likely due to the progressive awakening of the ward’s activity with the handover from the night shift, breakfast delivery to patients, cleaning, the start of the medical exams, and all activities that will involve more communication and action-generated sounds. It confirms prior findings that hospital patients perceive their sleep to be inadequate mostly in the early morning [58]. As we further discuss towards the end of this paper, a systemic change and a shift in caregiving activities could help postpone early awakenings. Some hospitals, for example, skipped night treatments to facilitate long sleep. Technological solutions which provide systematic knowledge on how work shifts impact on the quality of the ward’s soundscape and thus on patients’ sleep would be able to inform long-term structural interventions on the hospital organisation towards improved patients’ sleep.
3.3 Integrated analysis
We now return to the patient data (questionnaire and Fitbit-detected arousals), to see them in light of results from the soundscape annotations. Recall the same audio recording equipment was used throughout the data collection, in particular using the same microphone and level settings for the preamplifier. In the acoustic analysis of recordings, we calculated the root mean square (RMS) of the audio signal across the duration of each recording. While RMS is not immediately translatable to loudness (which we could not measure due to the limitations explained in Section 4.1), it can be used as a proxy measure. The three latent factors, “room,” “objects,” and “self,” together with the number of “sleep disturbances,” were compared against RMS of whole 30 s recordings preceding an arousal, and three variables obtained from the annotations and ratings of the same recordings, i.e. median RMS, median Annoyance (raw, as rated), and median Integrated Annoyance.
We explored these data with a correlation analysis using Spearman’s rho as the non-parametric statistic. See Figure 8 for variable distributions.
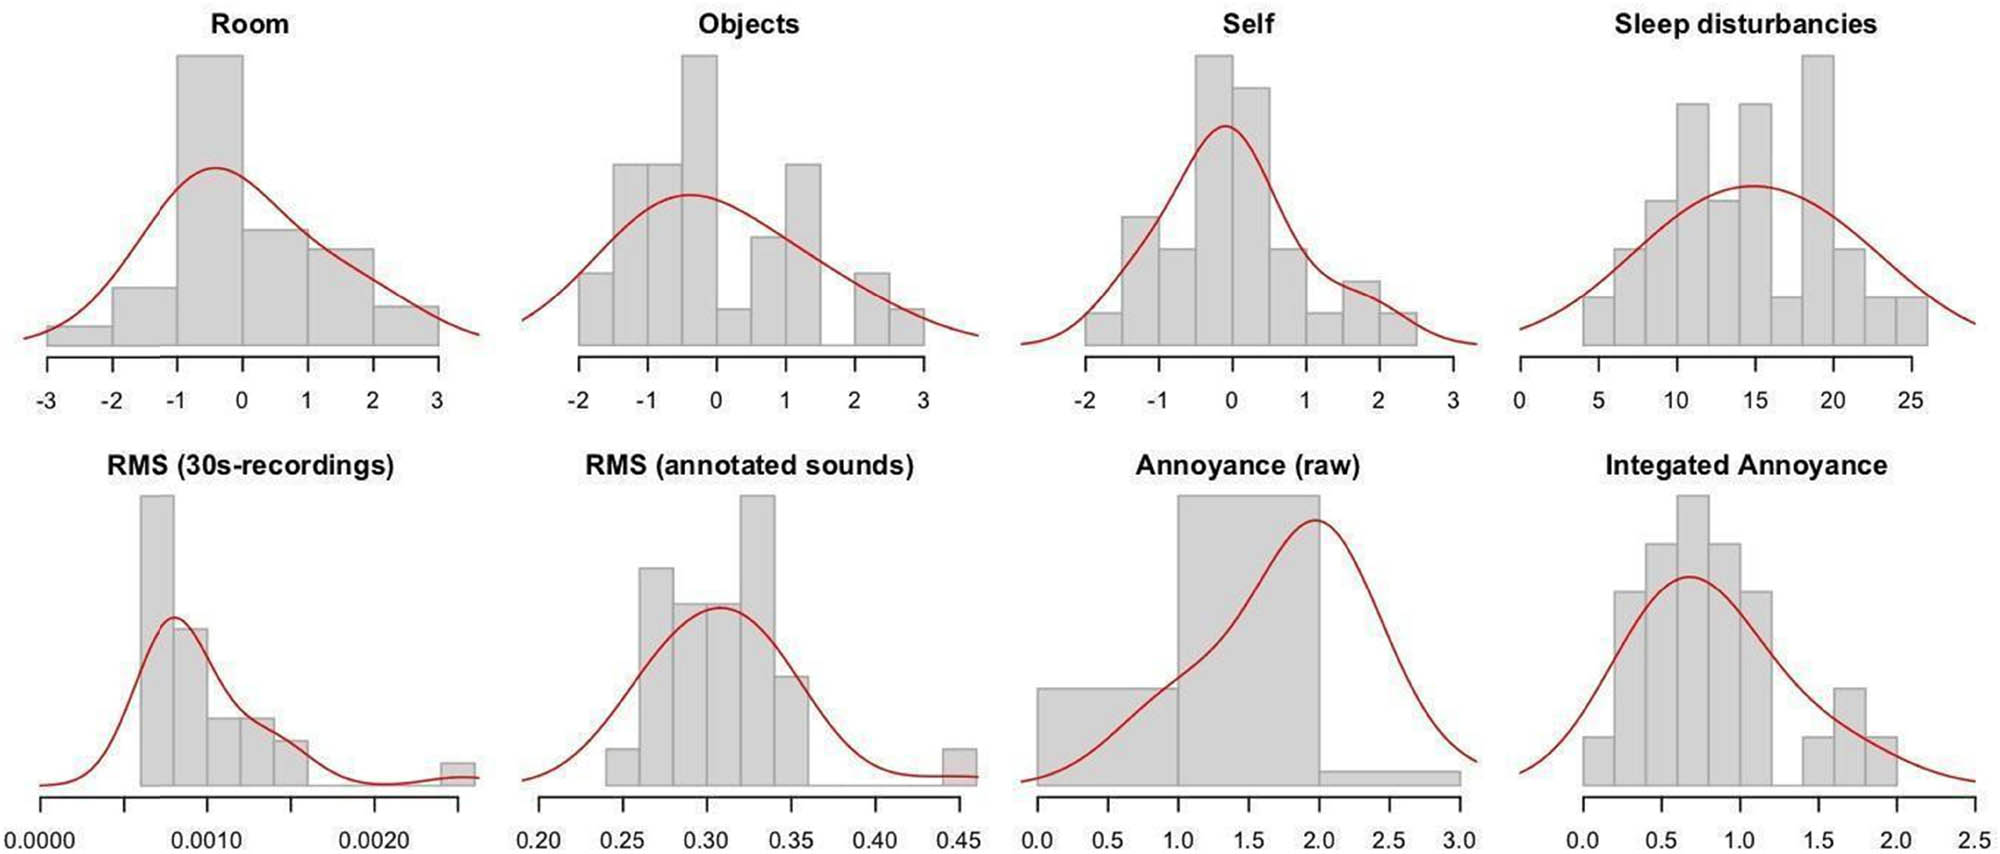
Distributions of variables in the correlation analysis. Histograms in top row: Three latent factors, and detected arousals. Bottom row: RMS and Annoyance variables. Y-axes represent the relative density within bins.
Cross-correlation analysis showed that the number of sound events in the annotations (mean across annotators) did not show any significant relationship with any of the RMS or Annoyance variables. This result suggests that annotations were not systematically made because sounds were loud or annoying: they were simply present and heard. As Table 3 shows, the first latent factor of the EFA, “Room,” was indeed significantly associated with the Raw Annoyance ratings. However, the Integrated Annoyance variable revealed a stronger relation (rho = −0.51, p = 0.0080**), and it might therefore be considered a better candidate for a predictive model. Meanwhile, Raw Annoyance was significantly related to the second factor, “objects” (rho = 0.47, p = 0.016*). The third latent factor, “self,” was not associated with any variable from the soundscape analysis. The number of Fitbit-detected arousals was significantly associated with RMS, a proxy for acoustic intensity (rho = 0.42, p = 0.023*).
Cross-correlations between (rows) RMS and Annoyance variables from the soundscape analysis, and (columns) latent factors from the patient questionnaire and number of Fitbit-detected arousals
| EFA | |||||
|---|---|---|---|---|---|
| Room | Objects | Self | Arousals | ||
| Whole recordings | RMS | ||||
| Annotated events | RMS | (0.331) | 0.42* | ||
| Annoyance, raw | −0.462* | 0.466* | |||
| Annoyance, integrated | −0.513** | ||||
The correlation statistic, Spearman’s rho, is marked with ** if it has a p-value lower than 0.01, i.e., there is less than a 1/100 probability of a value this large appearing spuriously, and * if the p-value is below 0.05, i.e., the probability is less than 1/20. One value in parenthesis shows the correlation for one non-significant association, but with a p-value still less than 0.1. Other non-significant relationships have been blanked out for clarity.
Noting the strong negative relationship between the first latent factor “room” and Integrated Annoyance (−0.513**), we looked more closely at the association between Integrated Annoyance, and each of the two ratings that most strongly contributed to “room.” The correlations were found to be non-significant at the level set for the test (alpha = 0.05), both for “soundscape quality” (rho = 0.27, p = 0.18 ns) and for staff voices (rho = −0.37, p = 0.064. ns). Recall that as already seen in the EFA, ratings of staff voices and soundscape quality were inversely related to one another (rho = −0.71, p < 0.001***). In other words, patients found that higher “soundscape quality” was associated with lower (or fewer) “staff voices.” Then the first latent factor “room” was associated negatively with soundscape quality (rho = −0.77***) and positively with “staff voices” (rho = 0.81, p < 0.001***).
The RMS measurements of the whole 30 s recordings as a whole were also considered in the analysis, but showed no significant relationship to the latent factors or detected arousal. This underlines what we have already seen that a detailed analysis of the specific sound events preceding an arousal has a better chance at predicting sleep disturbances. Our present study has only employed RMS as a proxy for loudness and no other sound descriptors. As the significant correlation between RMS and arousal in Table 3 suggests, median RMS of the specific sound events preceding an arousal would probably be a valid predictor of sleep disturbances, while a general RMS that does not take event detection into account would not. Going further, we propose that a predictive model should emulate a deeper description of sound events in the given environment. Such a model should, like the human annotators in our case study, be able to determine (1) onset and offset of potential events, and (2) their characteristics, via sonic information retrieval, and from there, (3) estimate events by relevant categories, and taking these factors into account produce an estimate of (4) the Integrated Annoyance. Exactly how to design this model will be the focus of future work.
4 Discussion
This study investigated the relationship between sound events and perceived Annoyance levels within a hospital ward during nighttime as part of patients’ sleep routine. The primary objective was to categorise sound events, assess their association with Annoyance, and relate them to the subjective evaluation of the ward’s soundscape obtained through patient questionnaires.
The analysis revealed that nighttime sounds in a typical hospital ward primarily originated from patients (snoring, coughing, breathing) and nursing personnel (talking, footsteps, medical alarms during procedures, interaction sounds like moving trolleys). In addition, rustling of clothes (patient movement) and activities related to patient care (changing bed sheets) were identified as potential sleep disruptors. To model the varying likelihood of these sound events disrupting sleep, we focused on three key factors: perceived Annoyance level, duration, and frequency of occurrence throughout a typical night.
Our analysis identified patient-generated sounds, particularly snoring and breathing, as presenting the highest Cumulative Annoyance. Speech generated by nursing staff – which is an actively produced sound that could be purposely controlled by the sound producer – also ranked high in Annoyance. Notably, snoring emerged as the single most annoying sound due to its frequent occurrence within the dataset, thus confirming existing literature [38]. Interestingly, both the patients who participated in the study (i.e., hospitalised listeners that hear the sound source at nighttime) and the annotators, who listened to the sounds “off-context” and during daytime, concurred in identifying snoring as the most annoying type of sound. This may be due to the fact that patients who participated in the study were not affected by serious pathologies but rather hospitalised for a short period of time to carry out medical tests or similar. A further iteration of the study should, however, investigate this point further and ideally involve patients in the labelling task as “expert listeners.”
Reducing heavy snoring might be probably beneficial for the snorer, but doing this is a hard nut to crack. Mitigating the disturbance created for other patients in the room would most easily be fixed by giving the heavy snorer(s) a separate room, or giving the most snore-sensitive a separate room. However, this would be a costly solution, and it is not always the case that patients snore equally hard every night, and furthermore, occasionally a light snorer might turn into a nighttime lumberjack. Therefore, our analysis highlights that it is towards the reduction of nursing personnel behaviour sounds, primarily speech, that a sound-driven technological solution should focus, to sustain short- and medium-term mitigation strategies among the hospital staff. Nevertheless, in a forthcoming study, acoustic and psychoacoustic descriptors of sound events (e.g., loudness and frequency spectrum) will be Integrated in the analysis to further explore the role (and potential masking effects) that snoring sound has in the ward’s soundscape.
Personnel behaviour sounds (primarily speech) followed by patient sounds (notably snoring) and personnel object sounds (mechanical) exhibited the highest Integrated Annoyance levels. These findings align with prior research on the influence of both speech and mechanical sounds on the hospital acoustic environments [20,24,17]. This is a crucial result because, while snoring is an involuntary patient behaviour during sleep, personnel-generated speech and mechanical sounds are actively produced, primarily by hospital staff during their work. Our previous research [41,26] suggests that hospital professionals are often unaware of their contribution to the overall soundscape and feel powerless to change it. This highlights the need for long-term solutions to raise nurses’ awareness of the sound environment. Furthermore, a potential correlation exists between speech by nursing personnel and snoring/breathing sounds from patients: Increased speaking by staff could contribute to a more disruptive sleep environment for patients, leading to lighter and lower-quality sleep.
A lower soundscape quality could also be responsible for the patient’s difficulty in falling asleep or being in deep sleep, as answers to the patients’ questionnaires highlight. Again, both patients’ questionnaires and the analysis of a “typical night” point at the same sound sources as having the highest potential to disrupt sleep. While these results confirm the literature on sound-induced sleep disturbances [35,59,60], this assumption will have to be further explored by collecting new data within the specific timeframes and observations and interviews with the hospital’s personnel.
4.1 Limitations of the present study and future studies
More research is needed on defining the sound sources that disturb sleep and what conditions are there for these sound events to be salient enough to cause perceived Annoyance. For example, we need to take a closer look at masking effects, such as when snoring (a broad-band noisy sound with a low-frequency centroid) masks breathing (which typically has a higher centroid). Due to the restrictions imposed by the hospital organisation on access to patients’ rooms and data collection, in this study, we were unable to evaluate the role of loudness since it was not possible to access an empty patient’s room to collect baseline measurements. However, we are interested in studying loudness as a predictor for sound Annoyance in the context of nighttime sleep. In a new iteration of the study, we are planning to investigate the correlation between the level of Annoyance by snoring sounds and loudness during the identified time slot, the Annoyance level and loudness of co-occurring sounds, and other factors already identified in the literature that characterise sounds that tend to disturb sleepers (e.g., continuous, impulsive, intermittent sound morphology, and frequency spectrum [38,39]). Individual noise sensitivity would also need to be further taken into account in a new iteration of the study (e.g., by including Weinstein’s index [61,62]) as previously applied by one of the authors [57]. In this study, we engaged human annotators to label sound sources recorded in the hospital ward at nighttime. In a forthcoming work, we will be looking into automatic sound event detection [63] with machine listening methods, for example, evaluating different pre-trained audio neural networks [64] against the ground truth that we have established.
Sound is an invisible phenomenon which makes it difficult for the people to be able to understand and assess cause and effect. Any technological intervention to make sound and its contextual knowledge accessible to users will rely on computational models that are able to not only measure the acoustic quality but also provide actionable information. The fields of sound and music computing, and acoustics engineering, provide some insights regarding speech recognition, but there are currently little to support recognition of everyday sound events; especially predicting those that can be harmful to people’s basic needs such as sensory comfort and sleep [65]. The insights gained from this study on Annoyance caused by everyday sounds during sleep will inform the development of an algorithm for the automatic detection of sleep-disturbing events in multi-patient hospital wards. This algorithm will be Integrated into a comprehensive, design-driven solution aimed at raising awareness among healthcare staff about the impact of specific sound sources on patient sleep quality. In addition, it will support the development of interventions to mitigate the negative effects of sound-induced sleep disruption.
5 Conclusion and implications for design
Our aim in this article was to understand which sound sources in a hospital ward at nighttime are perceived as annoying, and how such perceived Annoyance may underlie disturbed patient sleep. For that, we investigated what types of sounds are there in the hospital and what causes them (e.g., actions, people) through qualitative and quantitative approaches. First, we identified and classified sound sources causing disturbance to sleep. We also explored the possibility to model a “typical night” and estimated disturbance by sound types. In light of our findings and discussions, we will now explore how such an outcome can be effectively incorporated in the design of a human-centred and data-centric system that maps sleep-relevant sound sources and communicates the level of collective and individual Annoyance caused by such sounds.
Ideally, we would recommend a novel technological solution that aims to increase the nurses’ awareness of unwanted sounds (i.e., sounds that can disrupt patients’ sleep) by providing easy to understand information on what sounds are generated by nurses’ behaviour that can be acted upon. However, for such a system to be Integrated into the daily lives of nurses and patients, the system must have extensions and concrete presence in the hospital wards. However, hospital wards might not need to have permanent installation of microphones. Instead, we suggest the aim should be a flexible kit with several networked small devices that can be deployed when and where this information is most needed. Each device might be a small box that contains microphones, environmental sensors, a micro-computer, a network shield, and a battery. They would continuously measure, pre-process, and relay information about the acoustic quality, current “mix” of sound events, and estimate patients’ sleep quality. Medical staff would receive low-density (i.e., background), information in normal situations, that would increase to foreground alerts before any potential harm to an individual patient or the general environmental quality arises. This would provide relevant actionable information for nurses to be proactive in maintaining sonic hygiene in the ward. Thus, such a system would be able to mitigate sound-induced harm in the short term.
To inform the design of such a technological solution, a computational model of Annoyance by sound in hospital wards need to be developed. This model can output specific footprints [27,30] of sound events that are harmful to sleep in the context of hospital wards at night. The model is meant to be Integrated in a sound-driven design solution to increase awareness of the nursing staff so that they can take action to mitigate the negative impact on patients’ sleep. This model can provide the background for real-world applications that motivate sound-conscious behaviour change on different levels.
So far, we learnt that human speech, alarms, snoring, running taps or toilet routines, medical devices, and medical alarms, human interactions and footsteps or hand movements are likely to disturb sleep. For example, excessive speech can be actively mitigated through behavioural-change interventions and training of nursing staff [20,24], provided that nursing staff can be motivated to do so; crucially, by having access to information on the footprint of each sound category. Personnel-generated object sounds such as furniture moving (e.g., doors opening and closing; compare the discussion in the study by Lindborg [49] about improving restaurant environments) can be similarly addressed on the spot as part of behavioural change process. Knowing more about sound also offers a platform for conversation regarding expectations, preferences, and possibilities. More interestingly, the system could also be used to engage the hospital management and industry stakeholders in defining broader guidelines that include the redesign of the architectural indoor space of hospital wards, the tools used by staff (such as delivery trolleys), and medical alarms. The actionable information provided by the system would be valuable to hospital managers as they seek a better patient experience, hence can make informed decisions on the following:
Optimising nighttime routines (e.g., timing of medical interventions).
Medical device purchases (e.g., equipment with alarms that can be silenced at the patient’s bedside).
Reorganising and refurbishing interior design of wards for improved acoustic comfort.
Optimising on a daily basis the equal allocation of rooms according to needs (e.g., grouping patients with high noise sensitivity together with “silent sleepers,” or separating patients with sleep apnea who are likely to snore and disturb others).
Such measures, based on a sound-informed rationale, would answer several issues related to sleep and sound. However, a more comprehensive approach is needed to support patient sleep. The inpatients’ feeling of unfamiliarity or even hostility when placed in a hospital environment will always be a problem, and the acoustic reality plays no little part. When possible, before a pre-planned admission (e.g., giving birth or having a major surgery), patients could be gently and gradually familiarised with the hospital soundscape already while at home: for example, getting a certain dose of hyper-sensitization training towards sounds that are likely to disturb their sleep when they are in convalescence. Our research already provides insights into what type of sounds incoming patients would need to be familiarised with. Sometimes it will be difficult to control sonic nuisances, such as other patients’ snoring or nurses providing care-giving activities for other patients. In such cases, masking could be used as a band-aid to make highly annoying sounds less audible and to reduce their impact. Masking can be done in many ways: through passive acoustics (e.g., absorbent room dividers) or using active (semantic) maskers (e.g., playback of music or soundscape elements such as birdsong). Acoustic interventions can be made in shared, social acoustic spaces such as wards, or for individualised spaces (e.g., nearfield surround sound, headphones, earbuds, earplugs, earmuffs; either passive or with active noise cancelling). The ideal recipe might be a combination of both. It will be especially important during nighttime to provide a technical solution that is appropriate to a patient’s sleep routine (i.e., falling asleep, light sleep, and deep sleep). In this study, we only showed that it is possible to detect and identify sound sources and that it is important to integrate Annoyance as a basic response. More research is needed to further develop an understanding of how patients in hospital wards are affected by sound.
Acknowledgments
This paper is based on a previous conference presentation/paper by the authors at the 10th Convention of the European Acoustics Association, Forum Acusticum 2023 – Turin, Italy, 11–15 September 2023. The authors thank all the annotators for their time and effort. MSc student Yiling Liu (TU Delft) and PhD candidate Ningze Han (City University HK) also contributed to the data collection as part of their studies.
-
Funding information: The work presented in this paper was partially supported by a grant from the Research Grants Council of the Hong Kong Special Administrative Region, China, to the second author (Project No. 11612124). Reinier de Graaf hospital in Delft (NL) donated the fitbits and contributed financially to the original study in collaboration with Critical Alarms Lab.
-
Author contributions: All authors have accepted responsibility for the entire content of this manuscript and consented to its submission to the journal, reviewed all the results and approved the final version of the manuscript. SL: concept, writing, analysis, discussion, coordination; PML: concept, software, writing, analysis, discussion, visualization; SS: concept, software, writing, discussion; DK: data collection, discussion; EÖ: concept, writing, discussion, supervision.
-
Conflict of interest: Authors state no conflict of interest.
References
[1] European Environmental Agency. Health risks caused by environmental noise in Europe. Copenhagen, Denmark: European Environment Agency. [cited 2024 Mar 20]. https://www.eea.europa.eu/publications/health-risks-caused-by-environmental.Search in Google Scholar
[2] Duarte CM, Chapuis L, Collin SP, Costa DP, Devassy RP, Eguiluz VM, et al. The soundscape of the Anthropocene ocean. Science. 2021;371(6529):1–11. 10.1126/science.aba4658.Search in Google Scholar PubMed
[3] Phillips JN, Termondt SE, Clinton FD. Long-term noise pollution affects seedling recruitment and community composition, with negative effects persisting after removal. Proc R Soc B. 2021;288:20202906. 10.1098/rspb.2020.2906.Search in Google Scholar PubMed PubMed Central
[4] World Health Organisation (WHO). Compendium of WHO and other UN guidance on health and environment. 2022 update. Chapter 11. Environmental noise. Geneva, Switzerland: World Health Organisation. [cited 2024 Mar 20]. https://www.who.int/publications/i/item/WHO-HEP-ECH-EHD-22.01.Search in Google Scholar
[5] Lenzi S, Sádaba J, Lindborg PM. Soundscape in Times of change: case study of a city neighbourhood during the COVID-19 lockdown. Front Psychol. 2021;12(412):1–24. 10.3389/fpsyg.2021.570741.Search in Google Scholar PubMed PubMed Central
[6] Aletta F, Oberman T, Mitchell A, Tong H, Kang J. Assessing the changing urban sound environment during the COVID-19 lockdown period using short-term acoustic measurements. Noise Mapp. 2020;7(1):123–34. 10.1515/noise-2020-0011.Search in Google Scholar
[7] Manzano JV, Pastor JAA, Quesada RG, Aletta F, Oberman T, Mitchell A, et al. The “sound of silence” in Granada during the COVID-19 lockdown. Noise Mapp. 2021;8(1):1–31. 10.1515/noise-2021-0002.Search in Google Scholar
[8] Alsina-Pagès RM, Benocci R, Brambilla G, Zambon G. Methods for noise event detection and assessment of the sonic environment by the harmonica index. Appl Sci. 2021;11(8031):1–18. 10.3390/app11178031.Search in Google Scholar
[9] Teixeira LR, Pega F, Dzhambov AM, Bortkiewicz A, da Silva D, de Andrade C, et al. The effect of occupational exposure to noise on ischaemic heart disease, stroke and hypertension: a systematic review and meta-analysis from the WHO/ILO Joint Estimates of the work-related burden of disease and injury. Environ Int. 2021;154(106387):1–34. 10.1016/j.envint.2021.106387.Search in Google Scholar PubMed PubMed Central
[10] Gupta A, Gupta A, Jain K, Gupta S. Noise pollution and impact on children health. Indian J Pediatr. 2018;85:300–6. 10.1007/s12098-017-2579-7.Search in Google Scholar PubMed
[11] de Lima Andrade E, da Cunha e Silva DC, de Lima EA, de Oliveira RA, Zannin P, Martins A. Environmental noise in hospitals: a systematic review. Environ Sci Pollut Res Int. 2021;28:19629–42. 10.1007/s11356-021-13211-2.Search in Google Scholar PubMed PubMed Central
[12] Özcan E, Broekmeulen CLH, Luck AZ, van Velzen M, Stappers PJ, Edworthy JR. Acoustic Biotopes, listeners and sound-induced action: a case study of operating rooms. Int J Environ Res Public Health. 2022;19(24):16674.10.3390/ijerph192416674Search in Google Scholar PubMed PubMed Central
[13] Bliefnick JM, Ryherd EE, Jackson R. Evaluating hospital soundscapes to improve patient experience. J Acoust Soc Am. 2019;145(1117):1–14. 10.1121/1.5090493.Search in Google Scholar PubMed
[14] Lasky RE, Williams AL. Noise and light exposures for extremely low birth weight newborns during their stay in the neonatal intensive care unit. Pediatrics. 2009;123:540–6. 10.1542/peds.2007-3418.Search in Google Scholar PubMed
[15] Liu WF. Comparing sound measurements in the single-family room with open-unit design neonatal intensive care unit: the impact of equipment noise. J Perinatol. 2012;32:368–73. 10.1038/jp.2011.103.Search in Google Scholar PubMed
[16] Restin T, Gaspar M, Bassler D, Kurtcuoglu V, Scholkmann F, Haslbeck FB. Newborn incubators do not protect from high noise levels in the neonatal intensive care unit and are relevant noise sources by themselves. Children. 2021;8(704):1–13. 10.3390/children8080704.Search in Google Scholar PubMed PubMed Central
[17] MacKenzie DJ, Galbrun L. Noise levels and noise sources in acute care hospital wards. Build Serv Eng Res Technol. 2007;28(2):117–31.10.1177/0143624406074468Search in Google Scholar
[18] Lahav A. Questionable sound exposure outside of the womb: frequency analysis of environmental noise in the neonatal intensive care unit. Acta Paediatr. 2015;104:14–9. 10.1111/apa.12816.Search in Google Scholar PubMed
[19] Hernández-Salazar AD, Gallegos-Martínez J, Reyes-Hernández J. Level and noise sources in the neonatal intensive care unit of a reference hospital. Invest. Educ Enferm. 2020;38:3. 10.17533/udea.iee.v38n3e13.Search in Google Scholar PubMed PubMed Central
[20] Konkani A, Oakley B, Penprase B. Reducing hospital ICU Noise: a behavior-based approach. J Healthc Eng. 2014;5(2):229–46.10.1260/2040-2295.5.2.229Search in Google Scholar PubMed
[21] Busch-Vishniac IJ, Ryherd E. Hospital soundscapes: characterization, impacts, and interventions. Acoust Today. 2019;15:11–8. 0.1121/AT.2019.15.3.11.Search in Google Scholar
[22] Busch-Vishniac IJ, West JE, Barnhill C, Hunter T, Orellana D, Chivukula R. Noise levels in johns hopkins hospital. J Acoust Soc Am. 2005;118:3629–45. 10.1121/1.2118327.Search in Google Scholar PubMed
[23] Ahamed MF, Campbell D, Horan S, Rosen O. Noise reduction in the neonatal intensive care unit: a quality improvement initiative. Am J Med Qual. 2018;33:177–84. 10.1177/1062860617711563.Search in Google Scholar PubMed
[24] Carvalhais C, Santos J, da Silva MV, Xavier A. Is there sufficient training of health care staff on noise reduction in neonatal intensive care units? A pilot study from Neonoise project. J Toxicol Environ Health. 2015;78(13–14):897–903.10.1080/15287394.2015.1051204Search in Google Scholar PubMed
[25] Özcan E, Liu Y, Vroon J, Kamphuis D, Spagnol S. Doplor Sleep: Monitoring hospital soundscapes for better sleep hygiene. Proceedings of the 6th International Conference on Medical and Health Informatics. Kyoto, Japan: 2022 May.10.1145/3545729.3545745Search in Google Scholar
[26] Spagnol S, Viñas Vila N, Akdag Salah A, Goos TG, Reiss I, Özcan E. Towards a quieter neonatal intensive care unit: Current approaches and design opportunities. Proceedings of the 2022 International Conference of the Design Research Society. Bilbao, Spain; 2022, 24 June – 3 July.10.21606/drs.2022.258Search in Google Scholar
[27] Lenzi S, Spagnol S, Özcan E. Improving the quality of the acoustic environment in neonatal intensive care units (NICU): A review of scientific literature and technological solutions. Front Comput Sci Sec Human-Media Interact. 2023;5:1–18. 10.3389/fcomp.2023.1156693.Search in Google Scholar
[28] Aletta F, Kang J, Axelsson Ö. Soundscape descriptors and a conceptual framework for developing predictive soundscape models. Landsc Urban Plan. 2016;149:65–74. 10.1016/j.landurbplan.2016.02.001.Search in Google Scholar
[29] COST TUD Action. Soundscape of European cities and landscapes. Merano, Italy: European Cooperation in Science and Technology; 2013.Search in Google Scholar
[30] Torresin S, Maracchini G, Albatici R, Aletta F. A noise footprint calculator as a tool for education and practice. J Acoust Soc Am. 2023;154:101–2. 10.1121/10.0022932.Search in Google Scholar
[31] Truax B. Acoustic communication. 2nd edn. London: Ablex Publishing; 2000.10.5040/9798216955412Search in Google Scholar
[32] Hill EM. Noise sensitivity and diminished health: the role of stress-related factors. Phd thesis. Auckland, New Zealand: Auckland University of Technology; 2012. p. 1–329.Search in Google Scholar
[33] Andringa TC. Soundscape and core affect regulation. Assen, The Netherlands: University of Gronineng. [cited 24 Apr 2023]. https://www.researchgate.net/publication/228411828_Soundscape_and_core_affect_regulation/citations.Search in Google Scholar
[34] Davies H, Van Kamp I. Noise and cardiovascular disease: A review of the literature 2008-2011. Noise Health. 2012;14(61):287–91.10.4103/1463-1741.104895Search in Google Scholar PubMed
[35] Fillary J, Chaplin H, Jones G, Thompson A, Wilson P. Noise at night in hospital general wards: A mapping of the literature. Br J Nurs. 2015;24(10):536–40.10.12968/bjon.2015.24.10.536Search in Google Scholar PubMed
[36] Grossman MN. Awakenings? Patient and hospital staff perceptions of nighttime disruptions and their effect on patient sleep. J Clin Sleep Med. 2017;13(2):301–6.10.5664/jcsm.6468Search in Google Scholar PubMed PubMed Central
[37] Wesselius HM, Van Den Ende ES, Alsma J, Ter Maaten JC, Schuit SC, Stassen PM, et al. Quality and quantity of sleep and factors associated with sleep disturbance in hospitalized patients. JAMA Intern Med. 2018;178(9):1201–8.10.1001/jamainternmed.2018.2669Search in Google Scholar PubMed PubMed Central
[38] de Meyer M. Fundamentals of snoring pathophysiology, diagnosis and treatment. Phd thesis. Belgium: Vrije Universiteit Brussel; 2021.Search in Google Scholar
[39] Muzet A. Environmental noise, sleep and health. Sleep Med Rev. 2007;11(2):135–42. 10.1016/j.smrv.2006.09.00.Search in Google Scholar
[40] Marquis-Favre C, Premat E, Aubrée D. Noise and its effects–a review on qualitative aspects of sound. Part II: Noise and annoyance. Acta Acust U Acust. 2005;91(4):626–42.Search in Google Scholar
[41] Delle Monache S, Jia D, Kamphuis D, Özcan E. Exploring profiling and personalisation in sleep music design: towards conceptualising musical sleep aids for hospital use. Proceedings of the 17th International Audio Mostly Conference. St. Pölten, Austria; Sep 6–9 2022.10.1145/3561212.3561245Search in Google Scholar
[42] Birdja D, Özcan E. Better sleep experience for the critically Ill: a comprehensive strategy for designing hospital soundscapes. Multimodal Technol Interact. 2019;3(2):36.10.3390/mti3020036Search in Google Scholar
[43] ISO 12354:3:2017. Building acoustics estimation of acoustic performance of buildings from the performance of elements Part 3: Airborne sound insulation against outdoor sound. Geneva, Switzerland: International Organization for Standardization. [Cited 2 Apr 2024]. https://www.iso.org/standard/70244.html.Search in Google Scholar
[44] ISO 717-1:2020. Acoustics rating of sound insulation in buildings and of building elements Part 1: Airborne sound insulation. Geneva, Switzerland: International Organization for Standardization. [Cited 18 Apr 2024]. https://www.iso.org/standard/77435.html.Search in Google Scholar
[45] NEN-NPR 5272:2003. Noise control in buildings – Guidelines for the application of the prediction method for the sound insulation of facades according to NEN-EN 12354-3. Delft, The Netherlands: Royal Netherlands Standardization Institute. [Cited 2 Apr 2024]. https://www.nen.nl/en/npr-5272-2003-nl-83335.Search in Google Scholar
[46] Braun V, Clarke V. Thematic analysis. In: Cooper H, Camic PM, Long DL, Panter AT, Rindskopf D, Sher KJ, editors. APA handbook of research methods in psychology. Research designs: Quantitative, qualitative, neuropsychological, and biological. Vol. 2. Washington, U.S.: American Psychological Association; 2012. p. 57–71. 10.1037/13620-004.Search in Google Scholar
[47] Kis A, Szakadát S, Simor P, Gombos F, Horváth K, Bódizs R. Objective and subjective components of the first-night effect in young nightmare sufferers and healthy participants. Behav Sleep Med. 2014;12(6):469–80. 10.1080/15402002.2013.829062.Search in Google Scholar PubMed
[48] de Zambotti M, Goldstone A, Claudatos S, Colrain IM, Baker FC. A validation study of Fitbit Charge 2™ compared with polysomnography in adults. Chronobiol Int. 2018;35(4):465–76. 10.1080/07420528.2017.1413578.Search in Google Scholar PubMed
[49] Lindborg PM. A taxonomy of sound sources in restaurants. Appl Acoust. 2016;110:297–310.10.1016/j.apacoust.2016.03.032Search in Google Scholar
[50] Revelle W. Psych, Software package for R. Version 1.9.12.31; 2020.Search in Google Scholar
[51] Core Team R. R: A language and environment for statistical computing. Version 4.05. R Foundation for Statistical Computing; 2022.Search in Google Scholar
[52] Revelle W, Rocklin T. Very simple structure: an alternative procedure for estimating the optimal number of interpretable factors. Multivar Behav Res. 1979;14:403–14. 10.1207/s15327906mbr1404_2.Search in Google Scholar PubMed
[53] Signorell A. DescTools, Tools for descriptive statistics [R package], v. 0.99.44. 2021.Search in Google Scholar
[54] Zapf A, Castell S, Morawietz L, Karch A. Measuring inter-rater reliability for nominal data - which coefficients and confidence intervals are appropriate? BMC Med Res Methodol. 2016;16:1–10.10.1186/s12874-016-0200-9Search in Google Scholar PubMed PubMed Central
[55] Johnson KR, Hagadorn JI, Sink DW. Alarm safety and alarm fatigue. ClPerinatology. 2017;44(3):713–28.10.1016/j.clp.2017.05.005Search in Google Scholar PubMed
[56] Axelsson Ö. How to measure soundscape quality. Proceedings of the Euronoise 2015 Conference. Maastricth, Belgium; 2015. p. 1477–81.Search in Google Scholar
[57] Lindborg PM, Friberg A. Personality traits bias the perceived quality of sonic environments. Appl Sci. 2016;6(12):405.10.3390/app6120405Search in Google Scholar
[58] Southwell MT, Wistow G. Sleep in hospitals at night: are patients’ needs being met?. J Adv Nurs. 1995;21(6):1101–9.10.1046/j.1365-2648.1995.21061101.xSearch in Google Scholar PubMed
[59] Lei Z, Qiongjing Y, Qiuli W, Sabrina K, Xiaojing L, Changli W. Sleep quality and sleep disturbing factors of inpatients in a Chinese general hospital. J Clin Nurs. 2009;18(17):2521–9.10.1111/j.1365-2702.2009.02846.xSearch in Google Scholar PubMed
[60] Park HS, Kim KH. Perceived noise in patients and discomfort due to noise. J Korean Acad Soc Nurs Educ. 1997;3(2):150–62. (Korean).Search in Google Scholar
[61] Shepherd D, Heinonen-Guzejev M, Heikkilä K, Landon J, Theadom A. Sensitivity to noise following a mild traumatic brain injury: a longitudinal study. J Head Trauma Rehabil. 2021;36(5):289–301.10.1097/HTR.0000000000000645Search in Google Scholar PubMed
[62] Heinonen-Guzejev M. Noise sensitivity medical, psychological and genetic aspects. Phd thesis. Finland: University of Helsinki; 2009.Search in Google Scholar
[63] Mesaros A, Heittola T, Virtanen T, Plumbley MD. Sound event detection: A tutorial. IEEE Signal Process Mag. 2021;38(5):67–83. 10.1109/MSP.2021.3090678.Search in Google Scholar
[64] Kong Q, Cao Y, Iqbal T, Wang Y, Wang W, Plumbley MD. PANNs: large-scale pretrained audio neural networks for audio pattern recognition. IEEE/ACM Trans Audio, Speech Lang Process. 2020;28:2880–94. 10.1109/TASLP.2020.3030497.Search in Google Scholar
[65] González-Martínez FD, Carabias-Orti JJ, Cañadas-Quesada FJ, Ruiz-Reyes N, Martínez-Muñoz D, García-Galán S. Improving snore detection under limited dataset through harmonic/percussive source separation and convolutional neural networks. Appl Acoust. 2024;216:109811.10.1016/j.apacoust.2023.109811Search in Google Scholar
© 2024 the author(s), published by De Gruyter
This work is licensed under the Creative Commons Attribution 4.0 International License.
Articles in the same Issue
- Regular Articles
- Low-frequency cabin noise of rapid transit trains
- Utilizing the phenomenon of diffraction for noise protection of roadside objects
- Benchmarking the aircraft noise mapping package developed for a unified urban environmental modelling tool
- Acoustical analysis and optimization design of the hair dryers
- Methodologies for the prediction of future aircraft noise level
- Basics of meteorology for outdoor sound propagation and related modelling issues
- Predictive noise annoyance and noise-induced health effects models for road traffic noise in NCT of Delhi, India
- Modeling and mapping of traffic noise pollution by ArcGIS and TNM2.5 techniques
- A novel method for constructing large-scale industrial noise maps based on open source data
- Understanding perceived tranquillity in urban Woonerf streets: case studies in two Dutch cities
- Review Article
- A comprehensive review of noise pollution monitoring studies at bus transit terminals
- Rapid Communication
- The Environment (Air Quality and Soundscapes) (Wales) Act 2024
- Erratum
- Erratum to “Comparing pre- and post-pandemic greenhouse gas and noise emissions from road traffic in Rome (Italy): a multi-step approach”
- Special Issue: Latest Advances in Soundscape - Part II
- Soundscape maps of pleasantness in a university campus by crowd-sourced measurements interpolation
- Conscious walk assessment for the joint evaluation of the soundscape, air quality, biodiversity, and comfort in Barcelona
- A framework to characterize and classify soundscape design practices based on grounded theory
- Perceived quality of a nighttime hospital soundscape
- Relating 2D isovists to audiovisual assessments of two urban spaces in a neighbourhood
- Special Issue: Strategic noise mapping in the CNOSSOS-EU era - Part I
- Analysis of road traffic noise in an urban area in Croatia using different noise prediction models
- Citizens’ exposure to predominant noise sources in agglomerations