Relating 2D isovists to audiovisual assessments of two urban spaces in a neighbourhood
-
 ,
,

Abstract
In the field of urban design assessment, increasing attention to the nonexpert verbalizations is paid to engage social participation in planning processes, especially those not limited to static visual renderings. However, little has been explored on reproducible methods to collect these vocabularies and their relationship with architectural features. This study presents a hierarchical multifactor analysis to extract the main perceptual nonexpert clusters; and a linear correlation analysis to relate them with 2D isovist measures. In an on-line experiment, participants (
1 Introduction
Architectural morphology is an important factor for the soundscape in urban areas [1,2]. In parallel, it has also been shown that it plays a crucial role in the configuration of landscapes in public spaces [3]. Based on these two approaches, two fields of research show to have overlapping perceptual definitions.
On the one hand, soundscape studies aim to study the perception of the acoustic environment by human listeners. This depends on the relative position between the sound sources and the receiver, as well as the reinforcement, occlusion, or masking of certain sound sources due to interference with other sources in context of the built environment. In particular, different building configurations and the urban sound propagation are tightly connected in this regard. This fact opens the door to relate the perception of sound with morphological urban analysis.
On the other hand, there has been a continuous interest in urban and landscape research on examining the relationship between the viewer and the environment [3,4]. From those investigations, the formalization of isovist as the area of space visible from a point [5] was finally adopted as a metric in architecture. Although isovist analysis allow pure geometric comparison between different plan configurations, their relation with human behavior in the public space was subsequently a matter of deep investigations. In this regard, aspects like sense of enclosure, sense of safety, privacy, prospect, and refuge, and many more were linked with several geometric descriptors derived from isovists.
More background concerning the methodologies are explained in the next sections, where the necessity to link soundscape with morphology studies is highlighted, and opportunities and challenges of current standards in collecting nonexperts attributes are discussed.
2 Background
2.1 Soundscape and architectural morphology
Soundscape is defined as the acoustic environment as perceived or experienced and/or understood by a person or people, in context [6]. The term was coined by Schafer [7] as a reaction to the emerging field of environmental noise research that manages sound as waste, rather than as a resource. Following the European Landscape Convention [8], soundscape is defined as the acoustic environment of a place, as perceived by people, whose character is the result of the action and interaction of natural and/or human factors. A review on applications to soundscape planning was published by Brown [9]. A comprehensive book on soundscape in built environment by Kang and Schulte-Fortkamp [10] systematically collects concepts, measurement procedures and different applications to the soundscape approach in planning, design and assessment. Recently, a handbook collects the recent research and appilcations in the field of soundscapes, providing discussion of how it can enhance the quality of life [11]. The soundscape approach is standarized by ISO 12913 [6].
The field of soundscapes overlaps, to various degrees, with fields of acoustics such as sound quality and acoustic comfort in buildings. In this regard, urban sound propagation can be assumed to be a special case of outdoor sound propagation: in addition to the consideration of physical properties of the propagation medium, i.e., of air, it must account for reflection properties (absorption and scattering) and diffraction. All are material dependent with respect to energy loss, and they vary with geometry in respect to frequency, time and direction of sound incidence. In the latest, architectural morphology plays a crucial role.
2.2 Soundscape standards and nonexpert’ attributes
The current ISO 12913 standard framework presents different methods for data collection [12]. The questionnaire-based soundscape assessment (method A) is frequently used in because it provides a mathematical relation among the items of the questionnaire that compose it [13]. The core of this questionnaire is the set of eight perceptual attributes originally derived in the study by Axelsson et al. [14], explaining the biggest variance in a principal components analysis. Aletta et al. conceptually considered the attributes to form a two-dimensional circumplex on
2.3 Isovists
In geometry, an isovist refers to the spatial volume visible from a specific point in space, accompanied by precise information about the location of that point. Coined by Tandy in 1967 [22] and further developed by architect Benedikt [5], isovists are inherently three dimensional, although they can also be studied in two dimensions, either in a horizontal section (referred to as “plan”) or in various vertical sections intersecting the three-dimensional isovist. Each point in physical space is associated with its own isovist.
The isovist serves as one of the two representations of spatial structure, alongside the spatial-envelope representation. This concept offers an approach to describing space from the perspective of an individual within an environment. It involves a polygonal representation covering the visible or reachable area when walking in a straight line from a specific position. The boundary shape of an isovist may remain consistent or vary depending on the location within a room. In convex rooms (e.g., rectangles or circles), the boundary shape and volume (or area in plan) of every isovist are uniform, even though the viewpoint’s location relative to the boundary may differ. In contrast, nonconvex rooms (e.g., L-shaped or partitioned spaces) can result in multiple isovists with varying volumes, some potentially covering the entire room, each with unique shapes such as large, small, narrow, wide, centric, or eccentric. Alternatively, one can conceptualize the isovist as the volume of space illuminated by a point source of light, extending its application to the 3D digital environment by representing the area not in the shadow cast by a single point light source. In this framework, it can be said that area and perimeter deserve a special attention among the isovist metrics, since they are commonly known as the basic geometric properties. In addition, they have been found out to be the most significant metrics in this study. However, other isovist metrics are also relevant; they have been included in the study (compactness, circularity, convex deficiency, occlusivity, minimum radial, maximum radial, standard deviation, variance, skewness, and disperssion). Widely used in architecture, isovists play a crucial role in the analysis of buildings and urban areas, and is one of the basic conceptions of other spatial analysis theories, such as space syntax, which aims to forecast likely effects of architectural and urban space on users [23], prediction of perceived landscape openness [24], or predictors of evacuation route choice [25], among other applications.
3 Materials and methods
In this section, the methods used to investigate both independent variables: 1) individual visual and soundscape attributes and 2) isovist measures are going to be described. First, the selected urban locations are described in Section 3.1. Second, Section 3.2 will describe how the individual soundscape attributes were collected. Third, Section 2.3 will describe how the isovist analysis has been performed. Finally, Section 3.4 describes the statistical analysis to uncover relationships between both independent variables.
3.1 Urban locations
The study focuses on eight public spaces located in the area called Driescher Hof in Aachen, Germany. The public spaces are distributed across two distinct areas, a neighborhood shopping square and a neighborhood park, see Figure 1 (https://maps.app.goo.gl/rZZRpUN4n6sz7ggDA). The square (recording positions 1 to 4) provides services for the basic needs of the neighborhood residents, including a supermarket, pharmacy, a kiosk and a restaurant/café, all open during the recording times. The square is well organized and maintained, ornamented with greenery in its main entrances. In addition, the residents characterize the shopping square as a safe and comfortable place, offering opportunities to meet or to come across with neighbors during the day. The role of the shopping square in the neighborhood social life has been intensified in the lockdown due to the COVID-19 pandemic.
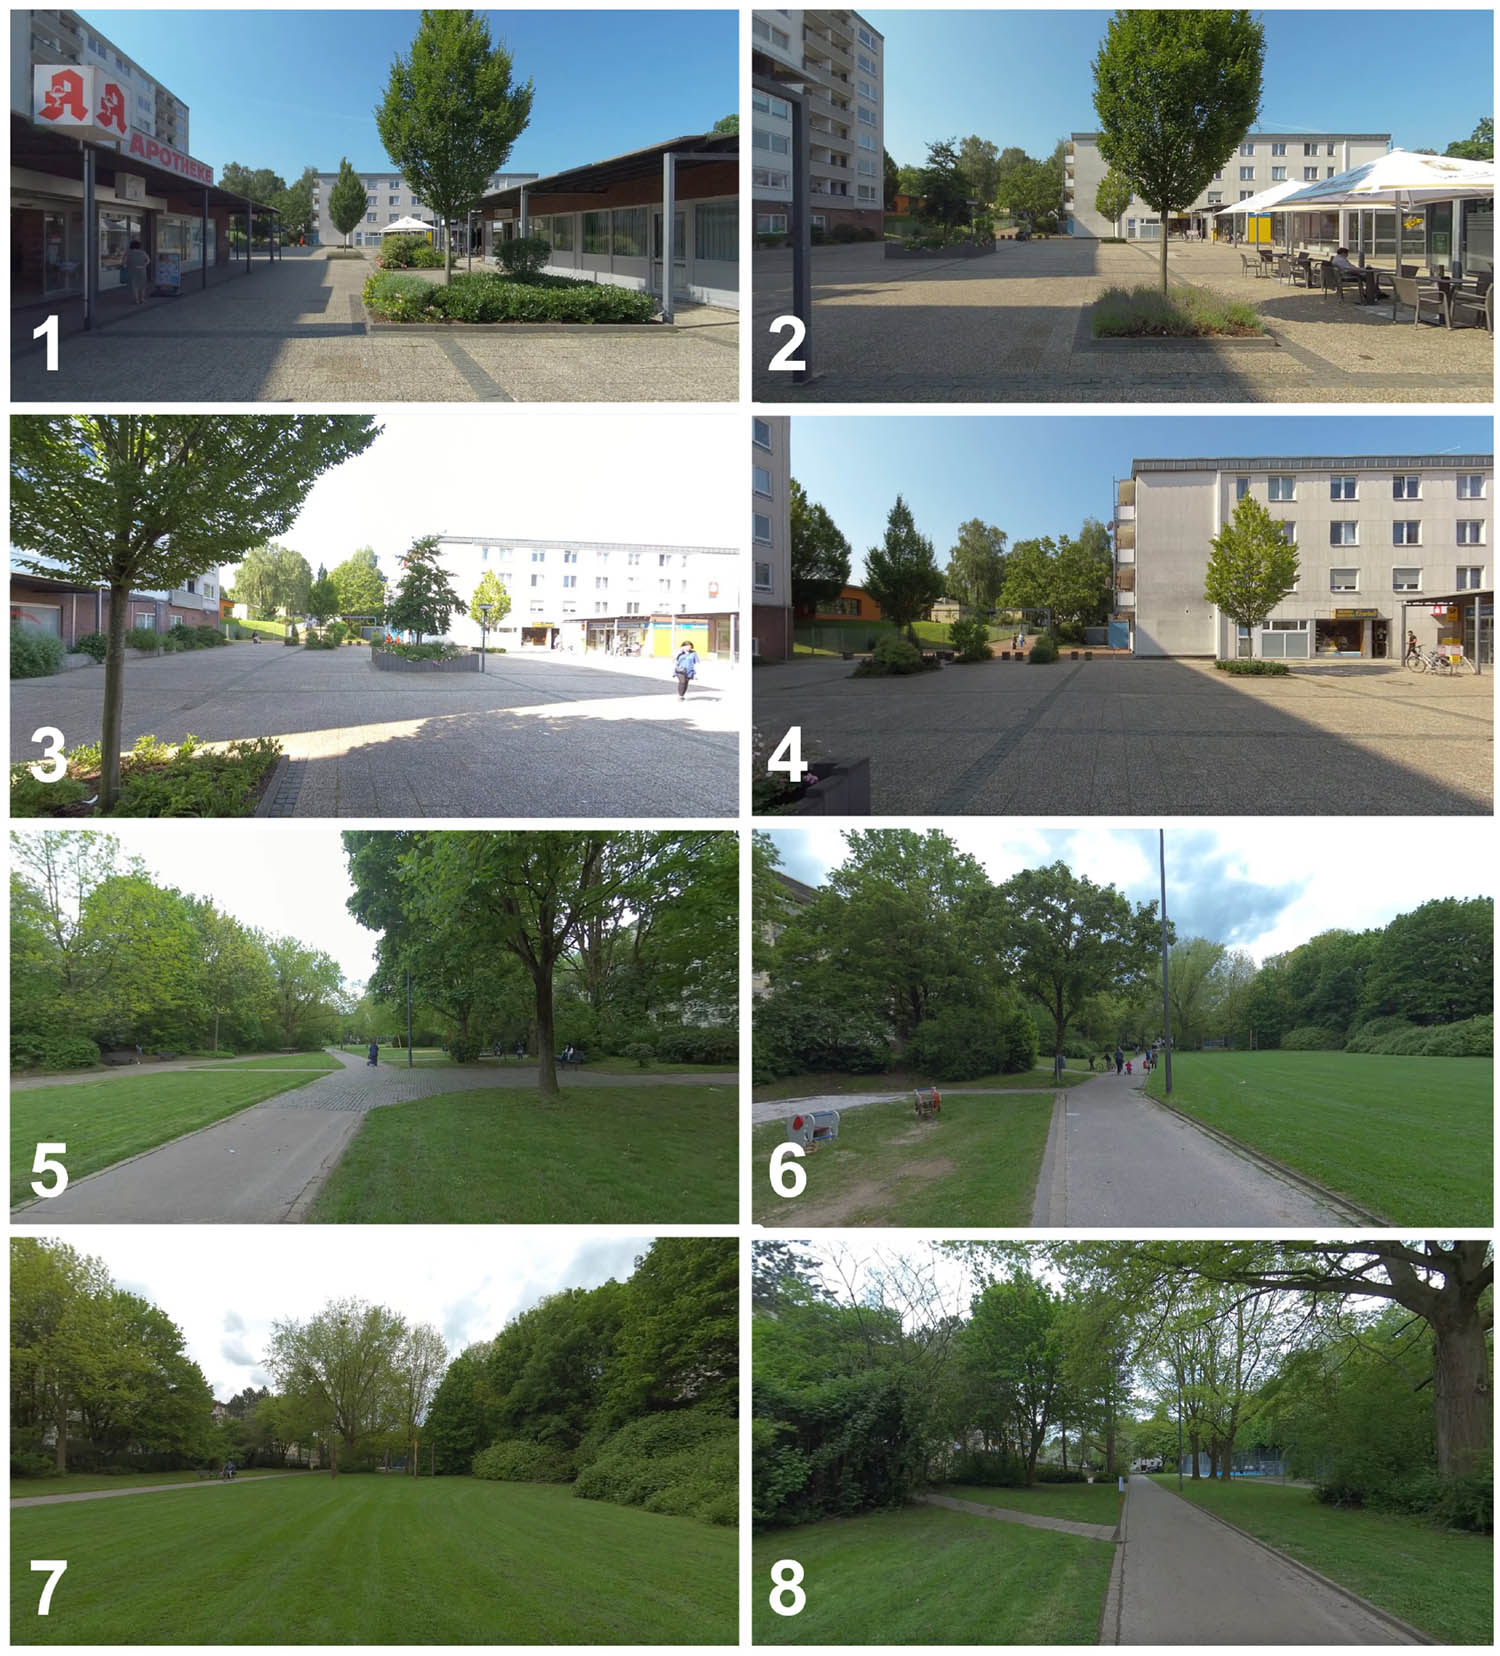
Recording positions 1 to 4 belong to the market place and 5 to 8 to the park.
The neighborhood park (positions 5 to 8) provides various recreational facilities. These include a playground, picnic tables and a basketball field. The park lacks physical and visual permeability to the rest of the district, especially in its north entrance, due to the wide facades of the four-storey residential buildings and high trees. According to informal questionnaires the residents related the feeling of unsafety and discomfort in this park to the lack of permeability with adjacent streets. Despite its pitfalls, the park has many positive characteristics, an attractive gathering place for the neighborhood, and many quiet areas, and it creates a sense of oasis within the residential area. The span on perceptually opposite features condensed in a relatively small area makes Driescher Hof an attractive and functional study case.
3.2 Individual visual and soundscape attributes
In the form of an online experiment, an IVP method was adapted and modified from the Flash profile [26] for the subjective evaluation of urban soundscapes. In IVP, each participant develops his own set of attributes for the evaluation. The implemented urban soundscape evaluation method consisted of one session with three phases for each participant. Each session lasted a maximum of 1.5 hours depending on the individual processing speed of the participant. The first phase was designed for the attribute development and elicitation process. The participants were asked to provide attributes that describe differences between the presented stimuli in the format of nouns. The second phase was designed to revise the attributes, with the option to discard or add nouns. The participants were asked to detail each noun in the format of two adjectives as opposites of a Likert scale. In the third phase, participants used their attributes and scales to rate the stimuli on a scale of 0 to 100. See Figure 2 for an example of the participant’s user interfaces. The sensory nature of the test implies participants comparing instantaneously all scenes for a single attribute, which is set to a maximum of eight scenes as previous literature suggested [26–28].

Online interface with 360-degree videos in YouTube used in first and third phases (up); form for the elicitation and discussion of attributes in the second phase, in red the agreed attributes (left-down); and rating questionnaire for the third phase (right-down).
The setup therefore consists of eight recorded positions (Section 3.1) reproduced via headphones and screen. The audio information is recorded in Ambisonics B format by using the Zoom H3-VR portable battery recorder, with the built-in microphone for first-order Ambisonics recording. All scenes were recorded with adjusted gains to avoid clipping. Afterward, the reproduction levels were compensated accordingly to ensure that the level differences between scenes are kept as in the real scenarios. The video information was recorded in
The experiment was performed online with the support of an instructor in presence or in an online call. This allowed the instructor to check with the participant for a quiet and nondistracting surrounding, as well as for the correct use of headphones and the experience of the full 360 degree range of the videos. To ensure that all participants were exposed to similar acoustic levels, the calibration method offered by https://hearingtest.onlinewas used.
3.2.1 Participants
A total of 20 participants participated in the experiment, mean age of 25.6, aged between 20 and 64. 40% of the participants were female. The participants were recruited from the population of students and staff at the RWTH Aachen Unviersity. Participants were not compensated economically for their time. Every participant was provided with the same playlist in YouTube and one online questionnaire to develop and rate the vocabularies, as explained in a previous study [30], and explained in Section 3.2.2. All the participants spoke English and German; therefore, it was preferred to use the English language in the attribute elicitation. The instructions emphasized using precise and reliable attributes and avoiding affective terms, such as preference or acceptance. It was allowed to consult the online LEO dictionary (https://dict.leo.org/) to find adequate translations between the mother tongue and English words. In phase 1 and 2, the goal was to condense into the four to six most descriptive audiovisual attributes, which could be used to discriminate the stimuli.
This research complied with the RWTH Aachen University Code of Ethics and was approved by the Institute for Hearing Technology and Acoustics at the same university on the 11.05.2022. Informed consent was obtained from each participant.
3.2.2 Individual vocabulary profile
The IVP method consists of a descriptive analysis test, in which the assessors perform individual word elicitation by listening and viewing to the stimuli. While experiencing the reproduced environments, the assessors provide words to describe how they perceive the space quality and the differences between them. Assessors can provide 8 to 12 words as they feel necessary to describe their perception. The assumptions behind this approach considers that assessors will fundamentally perceive the stimuli in a similar manner, but may use different adjectives to express their perception. The test consisted of three phases:
Elicitation of attributes. Assessors are asked to provide attributes that describe the qualities of stimulus and the differences among them. A total of four to eight attributes are required to complete the task, including audio and visual qualities. The assessors are asked to provide for each attribute not only one adjective but also pairs of extremes, which can be used in scale ratings later on.
Revision of attributes. The list of adjectives with their extremes are discussed personally with the testers, to avoid inaccuracies and redundancies. The outcome of this phase is an individual collection of attributes.
Ratings of scenes. The same assessors are asked to rate the stimuli with the collection of attributes they personally developed in Phase A. The outcome of this phase is a personal-weighted attribute collection.
The IVP technique is a laborious and time-consuming technique for data collection. For this reason, the present study has provided results for 20 participants, in line studies using the similar techniques [26,28,31]. This is a feature in exploratory sensory evaluation studies, in which the definition of the perceptual dimensions is under study. In the current study, the question is which visual and soundscape dimensions can be related with isovists. Therefore, the authors aim not to predefine the perceptual dimensions, but rather extract them from the individual vocabulary profiles.
3.2.3 Normalization of individual data
When processing individual datasets, it is important to consider its format to be in a suitable homogenous format appropriate to the postprocessing model. Therefore, data were normalized per participant using a
3.2.4 Multiple factor analysis (MFA)
Factor analysis is a technique used to reduce the dimensionality or number of variables into a fewer set by finding correlations between these variables and representing them as a linear combination of the obtained factors. MFA is a technique developed by [32] around the 1980s. MFA is considered an extension on PCA, which integrates the information of multiple datasets. In this study MFA consisted on the following:
Second, a global matrix was obtained by concatenation of all normalized and weighted matrices from the first step and a second PCA was performed, this time considering the data of all participants at once. This second step provides the final principal components (PCs) with which the resulting data will be explained. A covariance PCA was used at this stage.
Finally, the results are plotted into a common space that visually depicts the variables and observations in the same space. This space corresponds to the dimensions of the PCs.
3.2.5 Agglomerative hierarchical clustering (AHC)
It was decided to group the elicited attributes by AHC. Ward’s minimum variance method was used to generate clusters. It minimizes the variance within clusters. A cutoff value determines the final number of clusters. The AHC input is given by the Euclidean distances between the so-called coefficients, which are obtained in the global (second) PCA [32]. The coefficients represent observations (participants’ ratings) which have been transformed into the new subspace. The first three dimensions of the coefficient matrix were used to calculate the Euclidean distances. The number of clusters was selected manually after inspection of the clusters’ content and distribution for different cutoff values.
A centroid was calculated to represent each cluster, taking the mean coefficient vector of the clustered attributes. The vector pointing toward the centroid indicates the dominant direction of the underlying sensory dimension.
3.2.6 Confidence ellipses
A good method for visualizing the significance of perceived differences between the urban environments is the use of 95% confidence ellipses, which are empirical descriptions of the variability of the sensory evaluations [35]. Such analysis calculates the distributions of the centers of gravity and then deducing a confidence region for each of them [26]. So far, the soundscape analysis results are available. Next is to perform the architectural spatial analysis to allow for a comparison between the two domains.
3.3 Isovist metrics
The calculation of isovist metrics has been performed using the DeCodingSpaces Toolbox for Grasshopper [36]. All metrics have been evaluated using 180 radials. The following isovist measure definitions have been calculated for each of the urban locations (Figure 3):
Area
Distance-weighted area
Perimeter
Compactness, property relative to a circle [37].
Circularity, comparison of the area to the perimeter of the isovist [38].
Convex deficiency: Difference of the areas of the convex hull and the shape divided by the hull area [37].
Minimum radial. Minimum length of isovist radials.
Maximum radial. Maximum length of isovist radials.
Mean radial. Mean length of isovist radials.
Standard deviation, of the length of all radials of an isovist.
Variance of the length of all radials of an isovist.
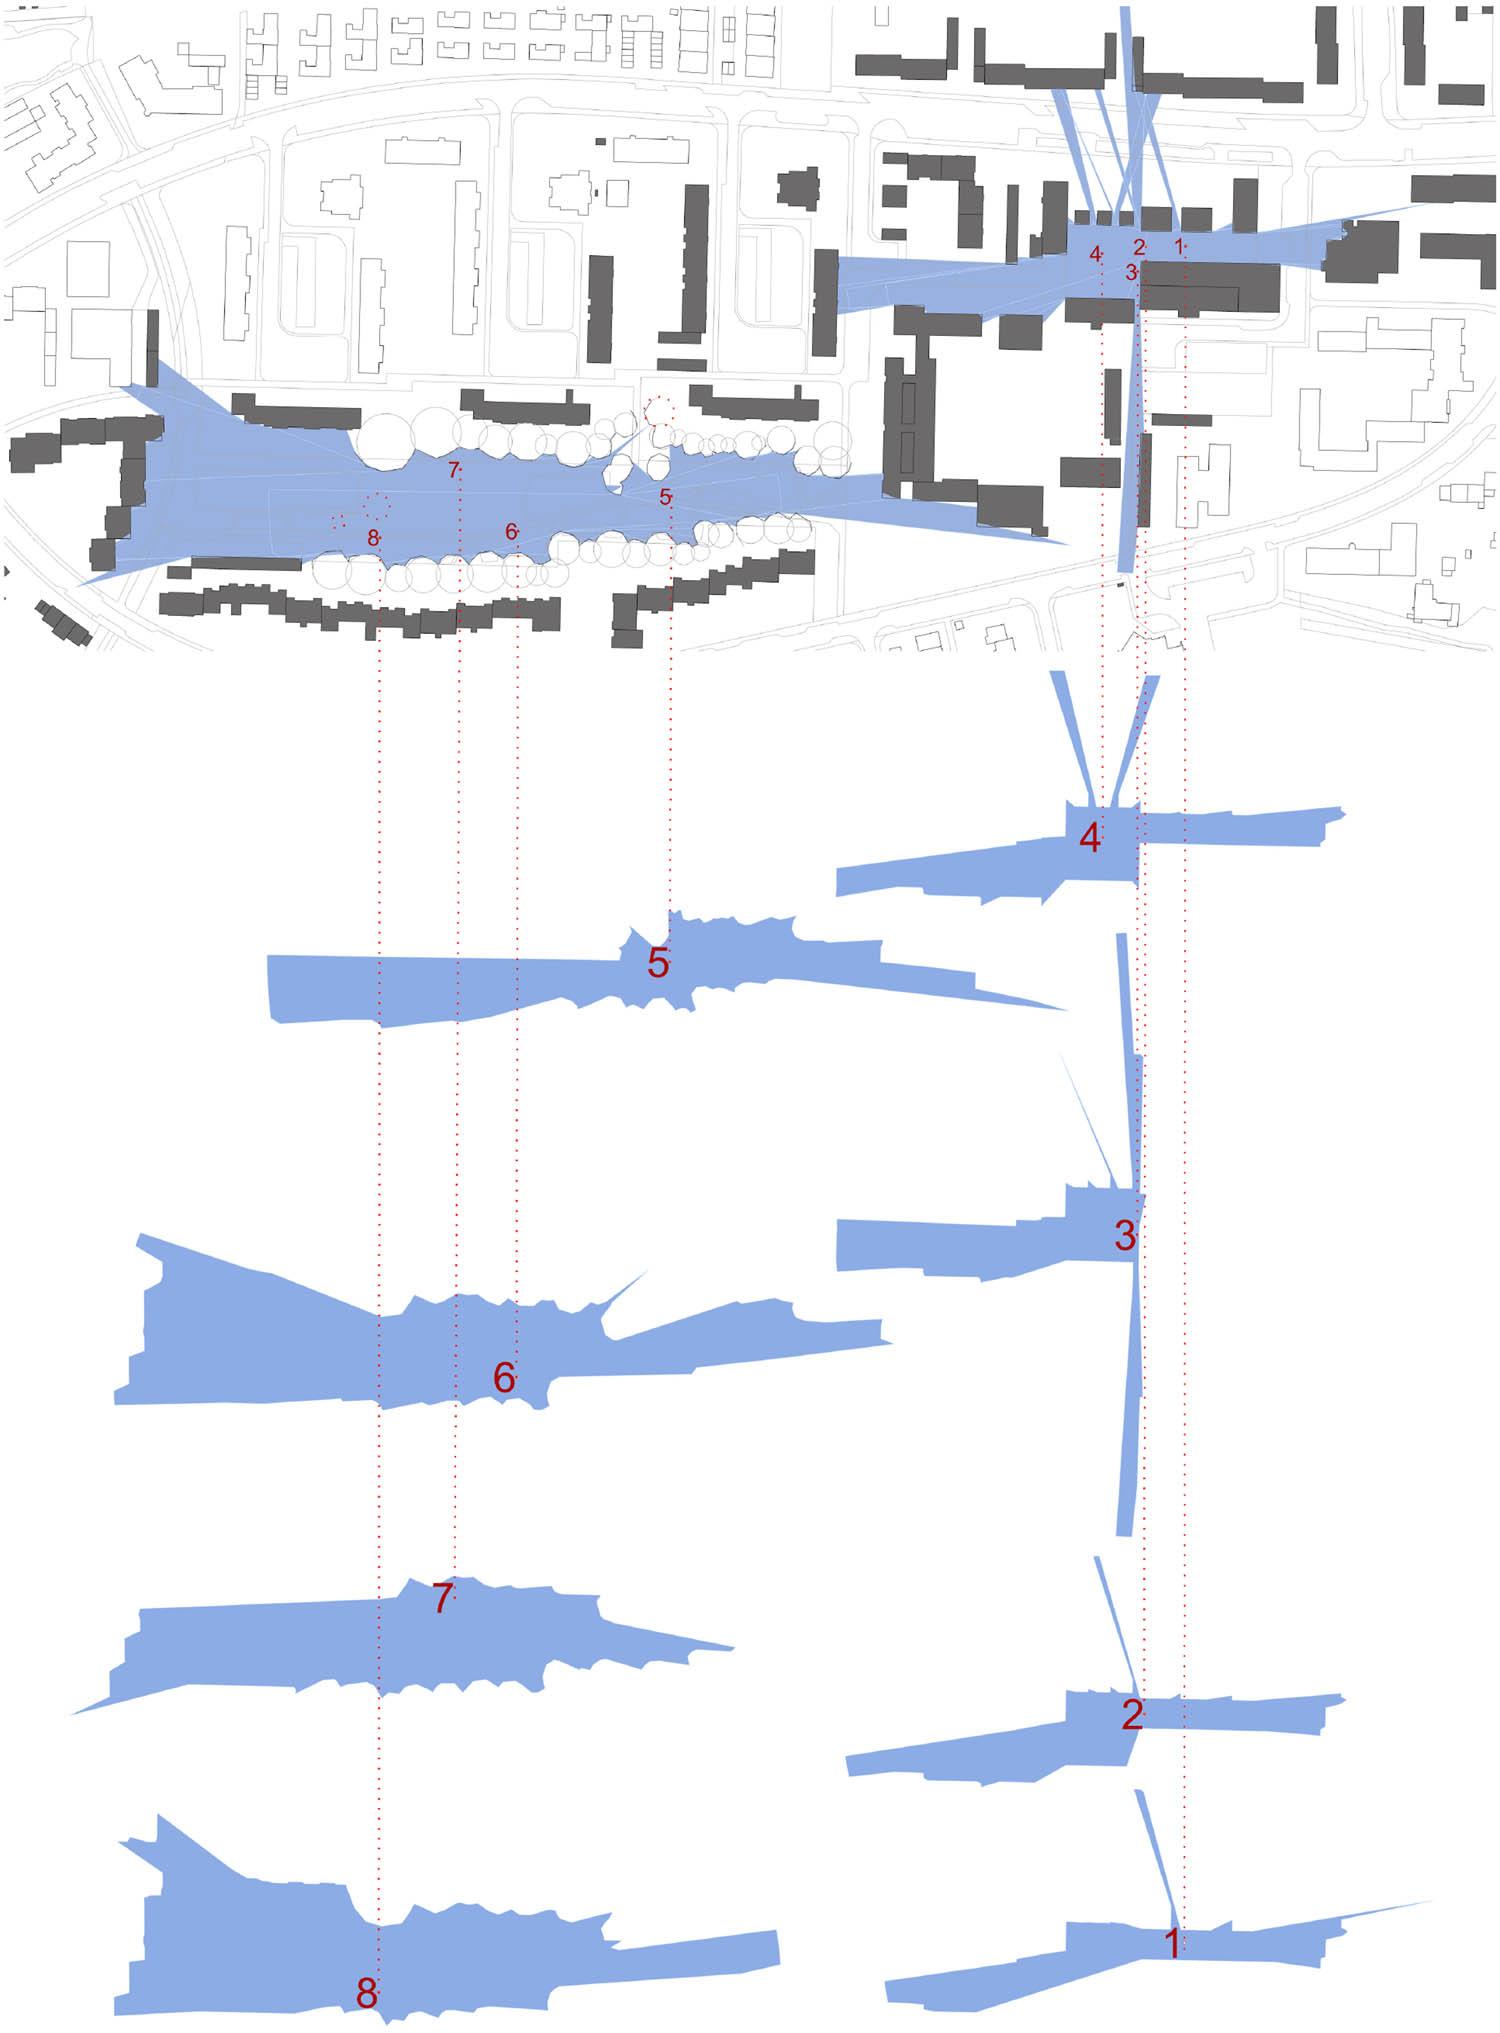
Isovists for each of the studied urban locations.
3.4 Correlation between clustered vocabulary and isovist metrics
Between the rating values from the individual attributes and the isovist metrics, a Spearman correlation analysis has been performed. The low number of observations (eight locations in our case) suggests the use of this type of correlation analysis, rather than a Pearson correlation [42].
4 Results and discussion
4.1 Clustered attributes
In total, 14 different clusters are extracted. Some clusters contain auditory attributes, some contain visual attributes, others contain audiovisual attributes, and others contain mixtures of any. Figure 4 displays the dendogram of the clustering result. The attributes are linked by branches of the tree. The

Dendogram representing the Euclidean distances in the
The centroid is calculated per cluster and is represented by a vector. In the upper row of Figure 5, the superposition of the clustered attributes and the vectors are represented in the first three dimensions of the global PCA. It can be noted that the vectors of the clusters “peacefulness” and “comfort” point in opposite directions to clusters “loudness” and “crowdedness” in PC dimensions 1 and 2. This clearly defines two axes of perception with two opposing poles. Those axes can be seen as perceptual dimensions which have been commonly used by the participants to asses the environments. Furthermore, there are cluster vectors that are very close together, like “chill” and “comfort.” This suggests that both clusters contain similar perceptual dimensions, but it was decided to keep them separate due to possible differences in meaning. Figure 5 (lower row) shows the confidence ellipses grouping the park and market based on the perceptual data. There is also a significant difference between both places. This is clearly visible in the confidence ellipses in the PC dimensions 1–2 and 1–3, as they do not overlap. When represented in the PC dimensions 2–3, the ellipses show an overlap. This is assumed to be due to the variance within PC dimensions 2 and 3, which appears to be higher than for PC dimensions 1–2 and 1–3. A more distinct result would probably require a higher number of participants. The size of the ellipses indicates that the extreme positions (01, 02, 06, 07) have more variability in their perceptual assessment than the rest.

Clustered data points, vector representations of groups, and confidence ellipse of the three first PC dimensions explaining 79% of the variance, for the normalized data. The labels “market” and “park” are added to the lower plots to represent the centroids for the two environments.
4.2 Resulting isovist metrics
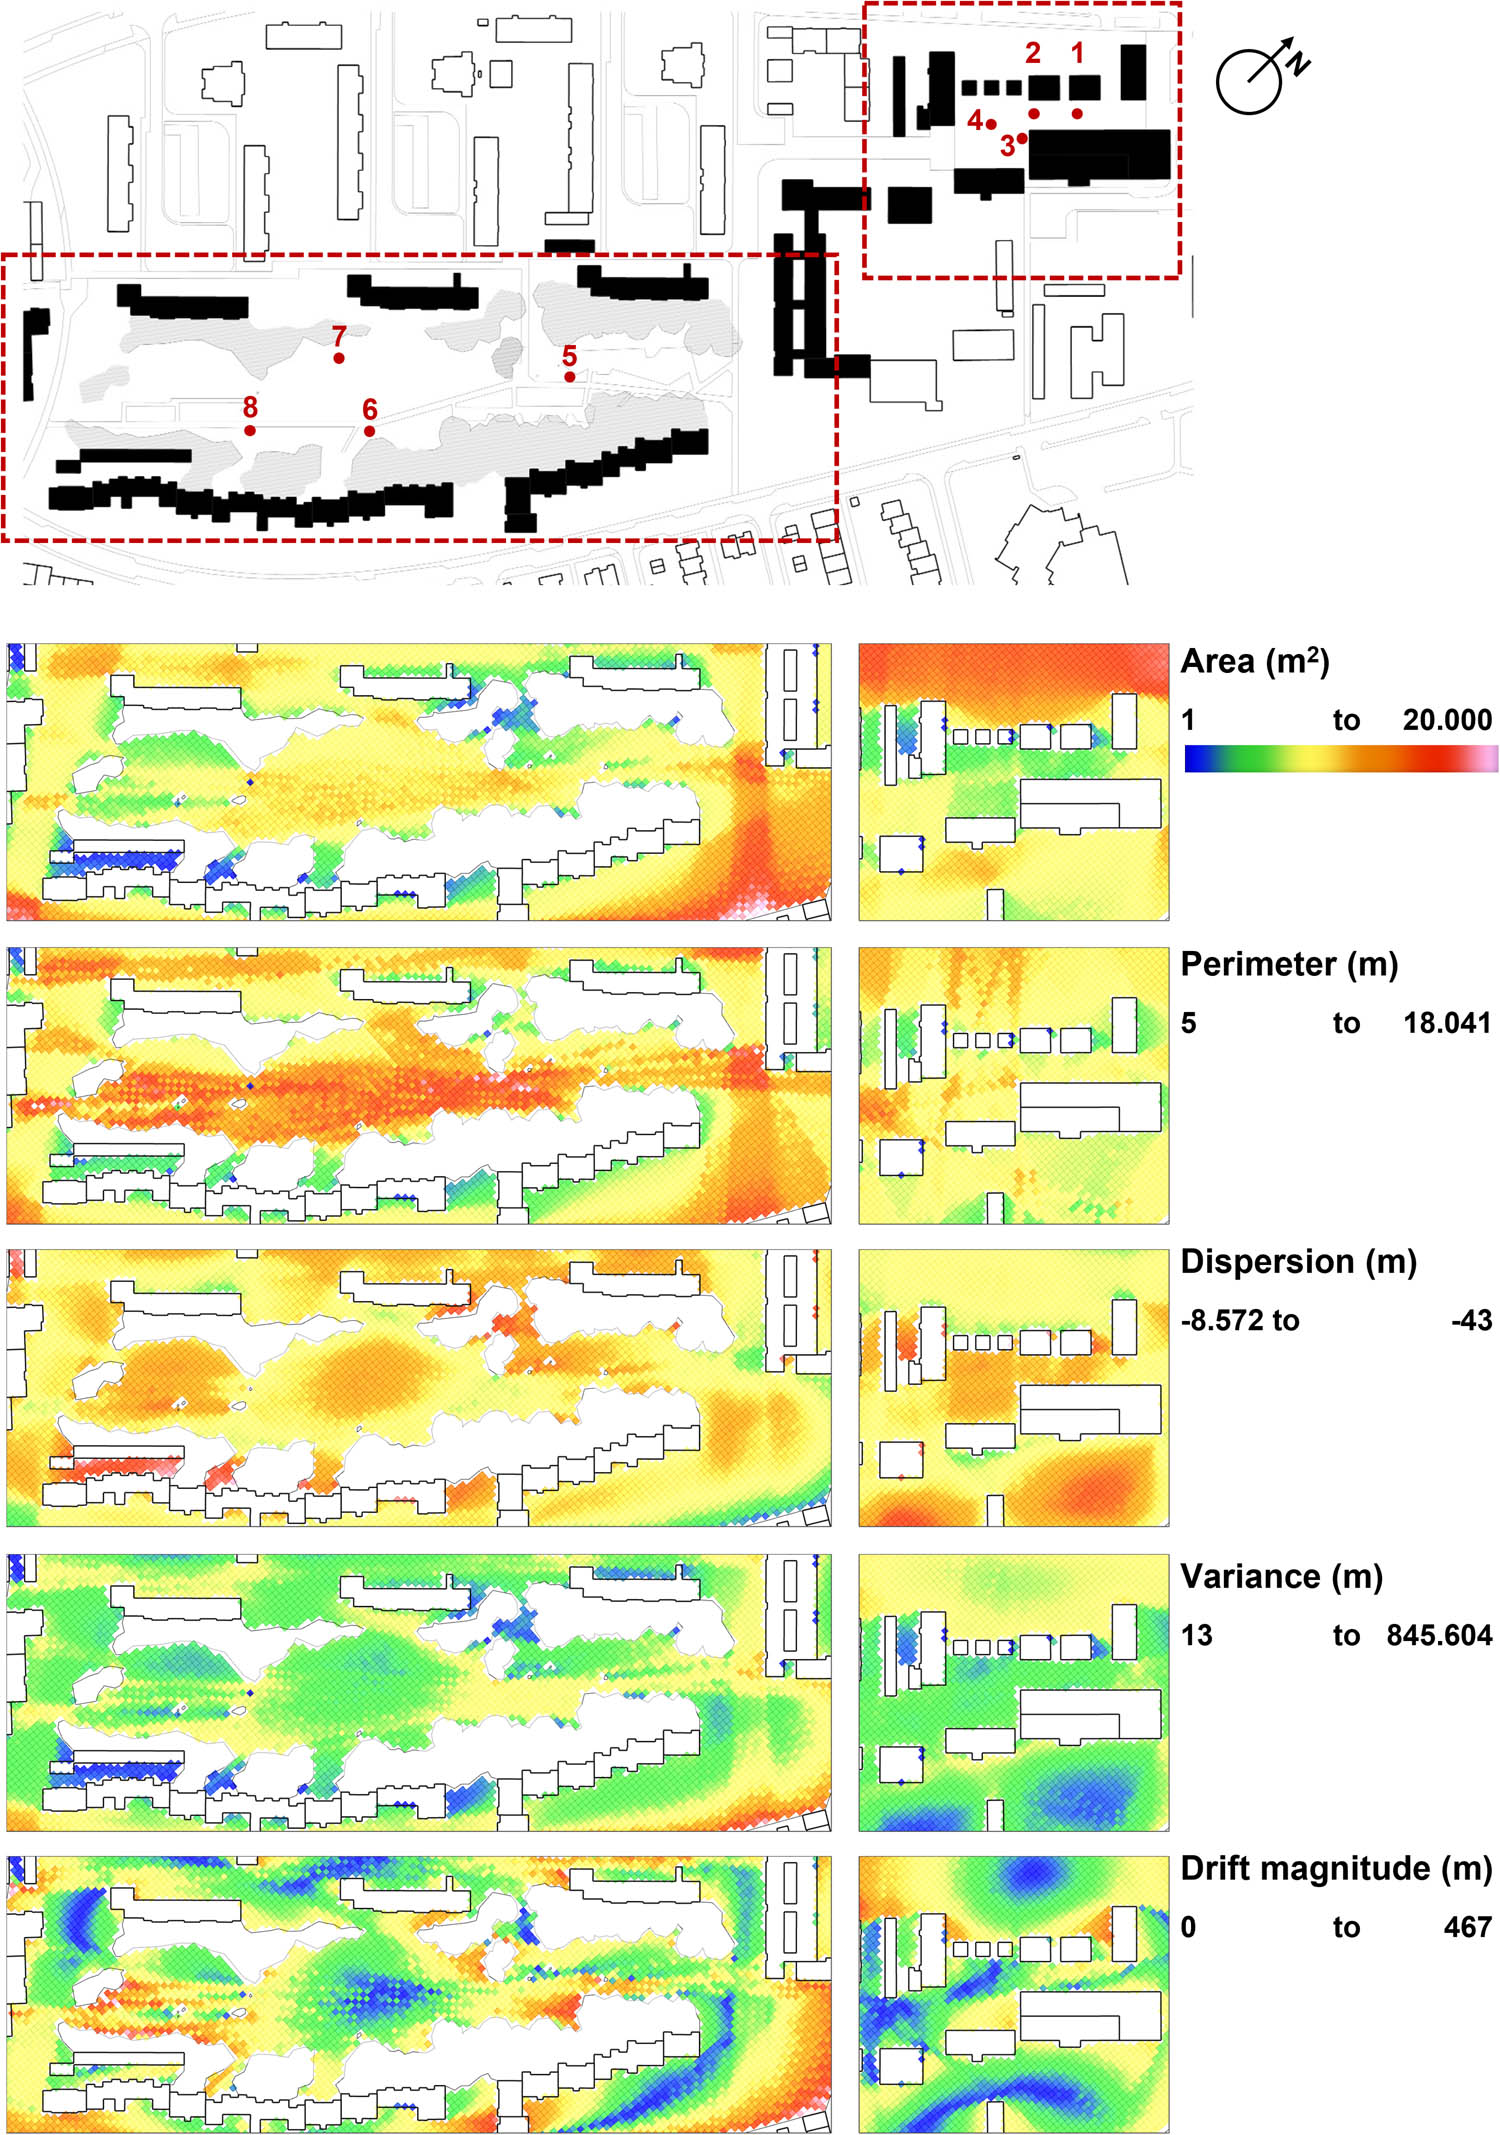
In Table 1, the isovist values for the eight recording positions are displayed (Figure 6).
Isovist values calculated for the eight recording positions
| 1 | 2 | 3 | 4 | 5 | 6 | 7 | 8 | |
|---|---|---|---|---|---|---|---|---|
| Area
|
4488.29 | 5207.98 | 4923.47 | 5725.56 | 8674.77 | 9303.73 | 7801.73 | 9726.54 |
| Distance-weighted area
|
4488.29 | 5207.98 | 4923.47 | 5725.56 | 8674.77 | 9303.73 | 7801.73 | 9726.54 |
| Perimeter (m) | 767.09 | 716.29 | 848.73 | 871.87 | 1420.55 | 1319.82 | 759.60 | 1241.60 |
| Compactness | 0.10 | 0.13 | 0.09 | 0.09 | 0.05 | 0.07 | 0.17 | 0.08 |
| Circularity | 0.43 | 0.50 | 0.40 | 0.65 | 0.53 | 0.68 | 0.72 | 0.59 |
| Convex deficiency | 0.27 | 0.33 | 0.28 | 0.32 | 0.35 | 0.53 | 0.62 | 0.47 |
| Occlusivity | 588.21 | 485.87 | 676.40 | 594.12 | 1237.43 | 1104.74 | 545.34 | 1026.73 |
| MinRadial (m) | 7.07 | 7.14 | 1.49 | 14.18 | 6.38 | 14.88 | 9.84 | 11.48 |
| MaxRadial (m) | 175.60 | 156.71 | 149.76 | 134.52 | 268.87 | 189.06 | 121.35 | 251.01 |
| MeanRadial (m) | 24.67 | 28.75 | 24.89 | 34.34 | 38.18 | 44.87 | 42.42 | 42.71 |
| Standard deviation | 3674.34 | 3828.02 | 4021.02 | 3535.02 | 4243.46 | 4441.52 | 3965.16 | 4863.77 |
| Variance | 165794.95 | 163151.73 | 191047.26 | 132346.50 | 289686.71 | 204654.24 | 129949.88 | 254912.03 |
| Skewness | 1.34 | 1.06 | 1.35 | 7.34 | 3.78 | 1.22 | 0.19 | 2.14 |
| Disperssion |
|
|
|
|
|
|
|
|
| Elongation | 0.14 | 0.18 | 0.17 | 0.26 | 0.14 | 0.24 | 0.35 | 0.17 |
| DriftMagnitude | 37.42 | 30.64 | 53.98 | 6.99 | 54.90 | 21.91 | 24.26 | 46.84 |
| DirftAngle |
|
|
|
|
|
|
4.31 | 2.35 |
Isovist metrics for the five highest correlating isovist metrics. For each metric, the range of values is displayed.
4.3 Correlation between attributes and isovist metrics
In this section, we discuss the results of the correlations. To facilitate the relation between them, some description of the isovist metrics and methods are included alongside the discussion.
High correlation values can be found between pairs of perceptual attributes and isovist parameters in Figure 7. It is worth noting that correlation can be positive or negative. It can also be derived that some clusters of attributes do correlate better than others. The isovist indicators have been grouped accordingly to highlight the highest correlating clusters. The first family of metric isovists is based on the basic property area (

Correlation values between individual attributes and isovist metrics, for AudioVisual attributes. In brackets, the attributes are clustered and a cluster name is given representing the most used word in the cluster or the main meaning.
Area and perimeter are frequently combined as ratio (A:P) [43]. In an isovist, the perimeter has both a number of edges (Pol) and a number of edge changes in direction, known as “jaggedness” (J). Moreover, the perimeter can be made up of two types of edges, “boundaries” (P), being edges which correspond to solid surfaces, and “occluded radials” (O), which are edges that result from part of the environment being obscured by a closer object. These radials are also not congruent with a physical barrier and therefore change as observation points change. From these measures, a range of secondary indices have been developed for architectural analysis, including occluded/perimeter ratio (O:P) and average occluded length/area ratio (AvO:A). [37] argues that the mathematical measures concavity (Con) – which he also calls convex deficiency – and circularity (Circ) are especially useful for comparing isovists. Convex deficiency is the difference of the areas of the convex hull and the shape divided by the hull area [37], while circularity is a comparison of the area of the isovist to the perimeter of the isovist. In the correlation, both circularity and convex deficiency show almost the same behavior, meaning that they are redundant for the isovist analysis, which confirms study by Arthur [37]. Both metrics correlate negatively with C1 (Urbanity light) and C8 (Level annoyance). This has practical implications: the higher the convex deficiency is, the bigger is the area of dents over the convex hull in the isovist. This means that more disturbing objects are placed around the observer and more hidden geometries are visible, so direct view of the sky and the horizon is blocked. Convex deficiency also implies that there are places where enemies could be hiding [37], which could result in an uncomfortable feeling. This observation cannot be confirmed. In contrast, the negative correlation with C1, C3, C7, and C8 shows that higher convex deficiency correlates with a reduction in luminosity and annoying noise, as sound sources are possibly heard at a lower level without being seen. C9 is mostly correlating positively, meaning that convex deficiency is related to the feeling of relaxation and naturalness.
Three additional measures are associated with the visual “enticement” embodied in a space. Drift magnitude (DrM) is the distance from the observation point, d, to the “center of gravity,” c, of the isovist polygon, where the center of the isovist is calculated as a “polygonal lamina” [39]. The distances between observation point and center of gravity in the
Finally, the “statistic” isovist metrics give information on the radials starting in the observer point and arriving to the boundaries of the isovist [41]. Benedikt [5] proposes that the statistical measures variance (variance of the radials’ length) and skewness can also be used to quantify the dispersion of the perimeter around the observation point and the asymmetry of the isovist polygon. Variance (M2) is the second moment of the mean of the radials, and skewness (M3) is the third moment of the mean of the radials. In our dataset, mean radial and standard deviation correlate very similar to area. This is logical since mean radial gives an idea of the size of the perimeter, as well as area does. Variance and max radial, on the other hand, correlates similarly as perimeter.
5 Conclusion
We have proposed to use both 2D isovist as objective and IVP as subjective approach to assess public urban spaces. The individual attributes have been collected in an online experiment with 360-degree videos and audio recordings. Based on these attributes, ratings were generated for every sequence. Afterward, the attributes were clustered into 14 clusters. With the help of MFA, the results have been represented in reduced dimensionality. This allows to identify the main axes that contribute most to the perceptual assessment. The MFA results show four axes that correspond to the main perceptual dimensions in the reduced space: urbanity – naturalness, crowdedness – tranquility, annoyance – comfort, loudness. Furthermore, the results show that both examined places, the market place and the adjacent park, are assessed clearly differently but as two distinct entities. Eventually, the IVP results were correlated with the 2D isovist results to find their relationship. In our study, two isovist definitions showed to be sufficient to characterize the relation with sound attributes: area and perimeter. The other isovist parameters are either highly correlated with one of these or they only correlate very weakly with the perceptual attribute clusters. While area correlates with openness, light, naturalness, and the feeling of relaxation, perimeter correlates more specifically with loudness based on activity and the perceived pleasantness. The results give a first idea of the relationship between isovist measures and soundscape or visual assessments. But they are not sufficient to derive a prediction model. The limitation of the dataset size could be solved by collecting a bigger amount of data for different sites and a larger population. But since isovists do not consider sound sources or sound propagation properties, further investigations are needed to unveil a more detailed relationship and to study how they could be incorporated. The IVP technique is a laborious and time-consuming technique for data collection. For this reason, the present study has provided results for 20 participants, in line of similar studies using the similar techniques [26,31,42]. However, it would be desirable to increase the number of participants for future studies.
Acknowledgement
The authors would like to thank Hyeju Park and María Antonia Ribas Durán for their help in the data collection and analysis.
-
Funding information: This work was developed at the “Person-focused Analysis of Architectural Design - PAAD group,” a Junior Principal Investigator fellowship funded at RWTH Aachen University by the Federal Ministry of Education and Research (BMBF) and the Ministry of Culture and Science of the German State of North Rhine-Westphalia (MKW), under the Excellence Strategy of the Federal Government and the Länder (project number JPI065-20); and the Federal Ministry for Digital and Transport (BMDV), under the funding initiative mFUND (project number 19FS52043A). Additional funding: J-03040 by MICIU/AEI/10.13039/501100011033 and the European Union NextGenerationEU/PRTR.
-
Author contributions: All authors have accepted responsibility for the entire content of this manuscript and consented to its submission to the journal, reviewed all the results and approved the final version of the manuscript. JL-B and JH designed the experiments, carried them out, conducted the analysis and wrote the manuscript. JL-B and MV supervised the work and wrote the manuscript.
-
Conflict of interest: The authors state no conflict of interest.
-
Informed consent: Informed consent has been obtained from all individuals included in this study.
-
Ethical approval: The research related to human use has been complied with all the relevant national regulations, institutional policies and in accordance the tenets of the Helsinki Declaration. This research complied with the RWTH Aachen University Code of Ethics and was approved by the Institute for Hearing Technology and Acoustics at the same university on the May 11, 2022.
References
[1] Margaritis E, Kang J. Relationship between green space-related morphology and noise pollution. Ecol Indicators. 2017;72:921–33. https://www.sciencedirect.com/science/article/pii/S1470160X16305635. 10.1016/j.ecolind.2016.09.032Search in Google Scholar
[2] Kang J. Soundscape in city and built environment: current developments and design potentials. City and Built Environ. 2023;1:1. 10.1007/s44213-022-00005-6Search in Google Scholar
[3] Lynch K. Managing the sense of a region. Cambridge, Massachusetts: MIT Press; 1976. Search in Google Scholar
[4] Gallagher G. In: Brock P, editor. A computer topographic model for determining intervisibility. La Jolla: Academic; 1972. p. 3–16. Search in Google Scholar
[5] Benedikt ML. To take hold of space: isovists and isovist fields. Environ Plan B Plan Design. 1979;6(1):47–65. 10.1068/b060047Search in Google Scholar
[6] Acoustics – Soundscape – Part 1: Definition and conceptual framework. International Organization for Standardization: Geneva, Switzerland, 2014. https://www.iso.org/standard/52161.html. (Last viewed April 19, 2022). Search in Google Scholar
[7] Schafer RM. The tuning of the world: Toward a theory of soundscape design. Philadelphia: University of Pennsylvania Press; 1977. Search in Google Scholar
[8] Information available at https://www.coe.int/en/web/landscape/reference-texts (Last viewed September 14, 2023). Search in Google Scholar
[9] Brown L. A review of progress in soundscapes and approach to soundscape planning. Int J Acoustic Vibrat. 2011;17(2):3164–4. 10.20855/ijav.2012.17.2302Search in Google Scholar
[10] Kang J, Schulte-Fortkamp B. Soundscape and the built environment. Boca Raton, Florida: CRC Press; 2016. Search in Google Scholar
[11] Schulte-Fortkamp B, Fiebig A, Sisneros JA, Popper AN, Fay RR. Soundscapes: humans and their acoustic environment. Cham: Springer International Publishing; 2023. 10.1007/978-3-031-22779-0Search in Google Scholar
[12] Acoustics – Soundscape – Part 2: Data collection and reporting requirements. International Organization for Standardization: Geneva, Switzerland, 2019. https://www.iso.org/standard/75267.html (Last viewed April 19, 2022). Search in Google Scholar
[13] Mitchell A, Aletta F, Kang J. How to analyse and represent quantitative soundscape data. JASA Express Letters. 2022;2(3):037201. 10.1121/10.0009794Search in Google Scholar PubMed
[14] Axelsson S, Nilsson ME, Berglund B. A principal components model of soundscape perceptiona. J Acoustic Soc Amer. 2010;128(5):2836–46. 10.1121/1.3493436Search in Google Scholar PubMed
[15] Aletta F, Kang J, Axelsson O. Soundscape descriptors and a conceptual framework for developing predictive soundscape models. Landscape Urban Plan. 2016;149:65–74. 10.1016/j.landurbplan.2016.02.001Search in Google Scholar
[16] Bild E, Pfeffer K, Coler M, Rubin O, Bertolini L. Public space users soundscape evaluations in relation to their activities. An Amsterdam-based study. Front Psychol. 2018;9:1593. https://api.semanticscholar.org/CorpusID:52112095. 10.3389/fpsyg.2018.01593Search in Google Scholar PubMed PubMed Central
[17] Mitchell A, Oberman T, Aletta F, Erfanian M, Kachlicka M, Lionello M, et al. The soundscape indices (SSID) protocol: A method for urban soundscape surveys - questionnaires with acoustical and contextual information. Appl Sci. 2020;10(7):2397. 10.3390/app10072397Search in Google Scholar
[18] Jeon JY, Hong JY, Lavandier C, Lafon J, Axelsson Ö, Hurtig M. A cross-national comparison in assessment of urban park soundscapes in France, Korea, and Sweden through laboratory experiments. Appl Acoustic. 2018;133:107–17. 10.1016/j.apacoust.2017.12.016Search in Google Scholar
[19] Dreier C, Vorländer M. Aircraft noise–Auralization-based assessment of weather-dependent effects on loudness and sharpness. J Acoustic Soc Amer. 2021;149(5):3565–75. https://doi.org/10.1121/10.0005040. Search in Google Scholar PubMed
[20] Aletta F, Asdrubali F, De Blasis MR, Evangelisti L, Guattari C. Influence of soundscape in the experience of an urban area: a case study in Rome. In: Proceedings on AHFE - 13th International Conference on Applied Human Factors and Ergonomics. vol. 58. New York, USA: AHFE International; 2022. p. 159–64. 10.54941/ahfe1002347Search in Google Scholar
[21] Llorca-Bofi J, Heck J, Vorländer M. Relating individual soundscape attributes with space syntax indices. In: Proceedings - Forum Acusticum. Torino, Italy; 2023. Search in Google Scholar
[22] Tandy C. The isovist method of landscape survey. In: Murray HC, editor. Symposium: Methods of Landscape Analysis; 1967. p. 9–10. Search in Google Scholar
[23] Hillier B, Hanson J. The social logic of space. Cambridge: Cambridge University Press; 1984. 10.1017/CBO9780511597237Search in Google Scholar
[24] Weitkamp G, van Lammeren R, Bregt A. Validation of isovist variables as predictors of perceived landscape openness. Landscape Urban Plan. 2014;125:140–5. 10.1016/j.landurbplan.2014.02.021Search in Google Scholar
[25] Snopková D, De Cock L, Juřík V, Kvarda O, Tancoš M, Herman L., et al. Isovists compactness and stairs as predictors of evacuation route choice. Sci Rep. 2023;13:2970. 10.1038/s41598-023-29944-8Search in Google Scholar PubMed PubMed Central
[26] Lokki T, Paaaatynen J, Kuusinen A, Vertanen H, Tervo S. Concert hall acoustics assessment with individually elicited attributes. J Acoustic Soc Amer. 2011;130(2):835–49. 10.1121/1.3607422Search in Google Scholar PubMed
[27] Rumsey F, Zielinski S, Kassier R, Bech S. Relationships between experienced listener ratings of multichannel audio quality and naiiiive listener preferences. J Acoust Soc Am. 2005;117(6):3832–40. 10.1121/1.1904305Search in Google Scholar PubMed
[28] Zacharov N. (Ed.) Sensory evaluation of sound. Oxfordshire, England: Rouledge Taylor and Francis Group; 2010.Search in Google Scholar
[29] Playlist in Youtube. Last viewed December 15, 2023. https://youtube.com/playlist?list=PLjVMT5BkCe82oEhtiT2Ho5BX3snui4ME-&si=qBAUbleYV8ahPBCu. Search in Google Scholar
[30] Llorca Bofi J, Heck JT, Dreier CG, Vorländer M. Individual assessments of realism in auralization and visualizations of urban environments. In: Proceedings of the 24th International Congres on Acoustics. Gyeongju, South Korea: 24. International Congress on Acoustics, Gyeongju (South Korea), 24 Oct 2022–28 Oct 2022; 2022. p. ABS-0709. https://publications.rwth-aachen.de/record/855244. Search in Google Scholar
[31] Lokki T, Pätynen J, Kuusinen A, Tervo S. Disentangling preference ratings of concert hall acoustics using subjective sensory profiles. J Acoustic Soc Amer. 2012;132(5):3148–61. 10.1121/1.4756826Search in Google Scholar PubMed
[32] Escofier B, Pagäs J. Analyses factorielles simples et multiples. Paris: Dunod; 2016. Search in Google Scholar
[33] Abdi H, Valentin D. Mutliple factor (MFA). 1st ed. Thousand Oaks (CA): Sage Publications, Inc.; 2007. Search in Google Scholar
[34] Abdi H, Williams LJ, Valentin D. Multiple factor analysis: principal component analysis for multitable and multiblock data sets. WIREs Comput Stat. 2013;5(2):149–79. 10.1002/wics.1246Search in Google Scholar
[35] Husson F, Lê S, Pagès J. Confidence ellipse for the sensory profiles obtained by principal component analysis. Food Quality Preference. 2005;16(3):245–50. 10.1016/j.foodqual.2004.04.019Search in Google Scholar
[36] DeCodingSpaces. DeCodingSpaces Toolbox; 2023. https://toolbox.decodingspaces.net/. Search in Google Scholar
[37] Arthur E. Stamps III. Isovists, enclosure, and permeability theory. Environ Plan B Plan Design. 2005;32(5):735–62. 10.1068/b31138. Search in Google Scholar
[38] Arthur E. Stamps III. Effects of area, height, elongation, and color on perceived spaciousness. Environ Behav. 2011;43(2):252–73. 10.1177/0013916509354696Search in Google Scholar
[39] Isovists.org. https://isovists.org/. Search in Google Scholar
[40] Ostwald MJ, Dawes MJ. Isovists: spatio-visual mathematics in architecture. Cham: Springer International Publishing; 2018. p. 1–13. 10.1007/978-3-319-70658-0_5-1Search in Google Scholar
[41] Ostwald MJ, Dawes MJ. Using isovists to analyse architecture: methodological considerations and new approaches. Int J Construct Environ. 2013;3(1):85–106. 10.18848/2154-8587/CGP/v03i01/37373Search in Google Scholar
[42] Kuusinen A, Pätynen J, Tervo S, Lokki T. Relationships between preference ratings, sensory profiles, and acoustical measurements in concert halls. J Acoustic Soc Amer. 2014;135(1):239–50. 10.1121/1.4836335Search in Google Scholar PubMed
[43] Conroy-Dalton RA. Spatial navigation in immersive virtual environments; 2001. https://api.semanticscholar.org/CorpusID:27504556. Search in Google Scholar
© 2024 the author(s), published by De Gruyter
This work is licensed under the Creative Commons Attribution 4.0 International License.
Articles in the same Issue
- Regular Articles
- Low-frequency cabin noise of rapid transit trains
- Utilizing the phenomenon of diffraction for noise protection of roadside objects
- Benchmarking the aircraft noise mapping package developed for a unified urban environmental modelling tool
- Acoustical analysis and optimization design of the hair dryers
- Methodologies for the prediction of future aircraft noise level
- Basics of meteorology for outdoor sound propagation and related modelling issues
- Predictive noise annoyance and noise-induced health effects models for road traffic noise in NCT of Delhi, India
- Modeling and mapping of traffic noise pollution by ArcGIS and TNM2.5 techniques
- A novel method for constructing large-scale industrial noise maps based on open source data
- Understanding perceived tranquillity in urban Woonerf streets: case studies in two Dutch cities
- Review Article
- A comprehensive review of noise pollution monitoring studies at bus transit terminals
- Rapid Communication
- The Environment (Air Quality and Soundscapes) (Wales) Act 2024
- Erratum
- Erratum to “Comparing pre- and post-pandemic greenhouse gas and noise emissions from road traffic in Rome (Italy): a multi-step approach”
- Special Issue: Latest Advances in Soundscape - Part II
- Soundscape maps of pleasantness in a university campus by crowd-sourced measurements interpolation
- Conscious walk assessment for the joint evaluation of the soundscape, air quality, biodiversity, and comfort in Barcelona
- A framework to characterize and classify soundscape design practices based on grounded theory
- Perceived quality of a nighttime hospital soundscape
- Relating 2D isovists to audiovisual assessments of two urban spaces in a neighbourhood
- Special Issue: Strategic noise mapping in the CNOSSOS-EU era - Part I
- Analysis of road traffic noise in an urban area in Croatia using different noise prediction models
- Citizens’ exposure to predominant noise sources in agglomerations