A novel method for constructing large-scale industrial noise maps based on open source data
-
Yubin Wang


Abstract
This study proposed a method of obtaining the type and quantity of equipment in factories by inquiring environmental impact assessment reports, which greatly improves the efficiency of gathering factory information. Thereafter, by combining on-site measurement and numerical modelling, the noise maps of an automobile industrial area were constructed. The exposed population under different noise levels were evaluated using the noise maps. The results indicated that noise pollution at nighttime in the study area was more severe than that during daytime, with 523 people (1.08%) and 1,357 people (2.81%) exposed to excessive noise levels during daytime and nighttime, respectively. In addition, this study also constructed a low-frequency industrial noise map. The methods and results of the present study can provide novel technical path for construction and analysis of large-scale industrial noise map.
1 Introduction
According to global industrial and economic development data released by The World Bank, the world gross industrial product in 2022 was USD 16188.86 billion, increased by 0.66% compared to the previous year [1]. Even after the significant impact of COVID-19, the global industrial development has remained stable. Although the industrial economy is an important factor in promoting and enhancing regional economic development, it also brings a series of noise pollution problems. Industrial noise can cause negative effects such as hearing loss [2–5], decline of memory [6], sleep disorders [7–9], and mental health [10,11]. Therefore, constructing an industrial noise map is particularly important for reducing the harm caused by industrial noise.
With the continuous development of computer technology, more and more researchers are using numerical simulation software to construct industrial noise maps [12–15]. Common environmental noise simulation softwares include CadnaA, SoundPlan and Predictor LimA. For example, Raina et al. [16] studied the impact of hilly terrain on noise attenuation in cement factories and the results showed that noise was attenuated throughout the entire valley and changed according to the terrain of the valley. del Mar Durán del Amor et al. [17] assigned different noise sources into different groups and conducted normalized frequency analysis on the most relevant sources, to determine the contribution of different noise sources. Deaconu and Cican [18] constructed noise maps under the influence of two different turbojet engines and evaluated the impact of turbojet engine noise on adjacent residential areas.
In current scientific open literature, large-scale noise mapping researches were generally conducted in the fields of traffic, aircraft, and railway noise [19,20]. In fact, there is not much research on large-scale industrial noise mapping, mainly because the construction of numerical models for industrial noise maps often requires large amount of factory equipment information, and researchers usually only can obtain these relevant data from the particular factory department. Bozkurt and Demirkale [12] constructed a noise map of an industrial area with different factory’s door opening ratios through on-site observation and investigation. They evaluated the noise exposed population and area based on the industrial noise map. Paschalidou et al. [21] developed the strategic noise maps and action plans for the “agglomeration of Piraeus,” which involved railway, port, road traffic and industrial noises. Licitra et al. [22] proposed predominance maps for the port areas in environmental acoustic, which involved road traffic, railway, port, and industrial noises. In summary, obtaining accurate factory equipment data are a major challenge in constructing industrial noise maps. Based on this challenge, this study adopted a new approach to construct a high precision industrial noise map. Environmental impact assessment reports issued by the government usually listed the models and quantities of various industrial equipment. Based on these information, this study collected the noise parameters of each equipment from open source data to determine their noise levels. Therefore, this approach can construct industrial noise maps effectively at a lower cost.
2 Methodologies
The method used in this study is shown in Figure 1. First, the relevant data of the factory’s equipment were obtained through environmental impact assessment reports and academic papers. Second, information on the buildings and population were obtained through literature review and field observation. Then, a trial traffic and industrial noise model of the study area was constructed using CadnaA software. The accuracy of the trial traffic and industrial noise model was verified through field measurement data. Finally, an industrial noise map was developed based on the validated noise model.
Methodologies for constructing industrial noise map.
2.1 Study area
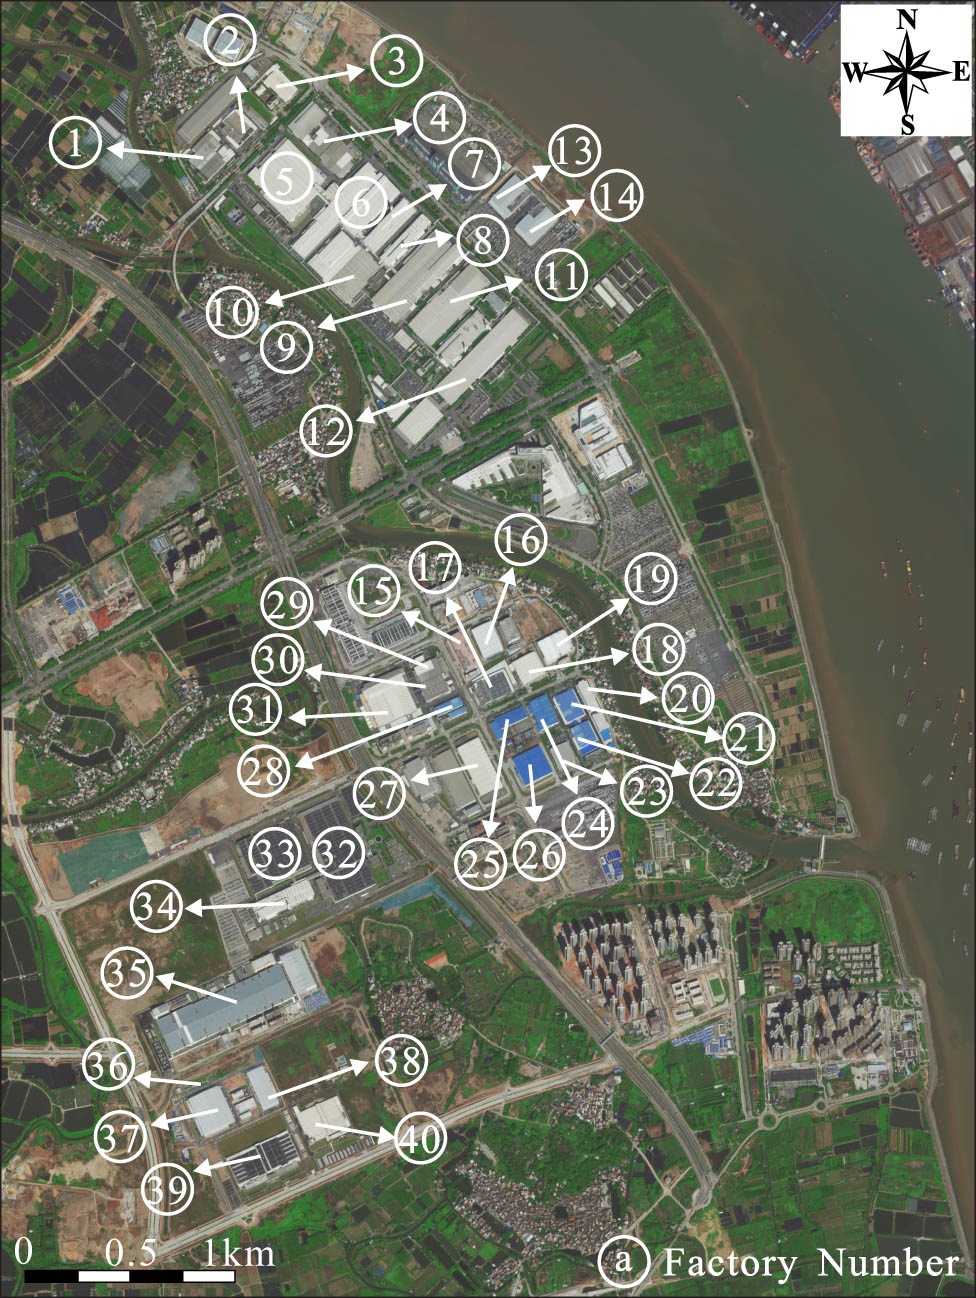
According to a report from the government of Panyu District of Guangzhou City [23], Panyu Automobile City produced 530,000 vehicles with industrial output value of RMB101.9 billion in 2022, where an increment of 37.3% was archieved compared to 2021. Therefore, to reflect the impact of industrial noise in real life and to better control the impact of industrial noise pollution, Panyu Automobile City was selected as the study area in the present study. The factories, residential areas, schools, and other buildings in Panyu Automobile City are shown in Figure 2. Panyu Automobile City is located in the northeast of Panyu District and at the core central of the Guangdong-Hong Kong-Macao Greater Bay Area. It is also one of the four major industrial development platforms in Panyu District. The study area in the present works is approximately 17.8 km2 with total of 40 active factories (Figure 2), 11 villages, and 4 residential areas. The study area belongs to subtropical marine monsoon climate, with annual average temperature of
Study area.
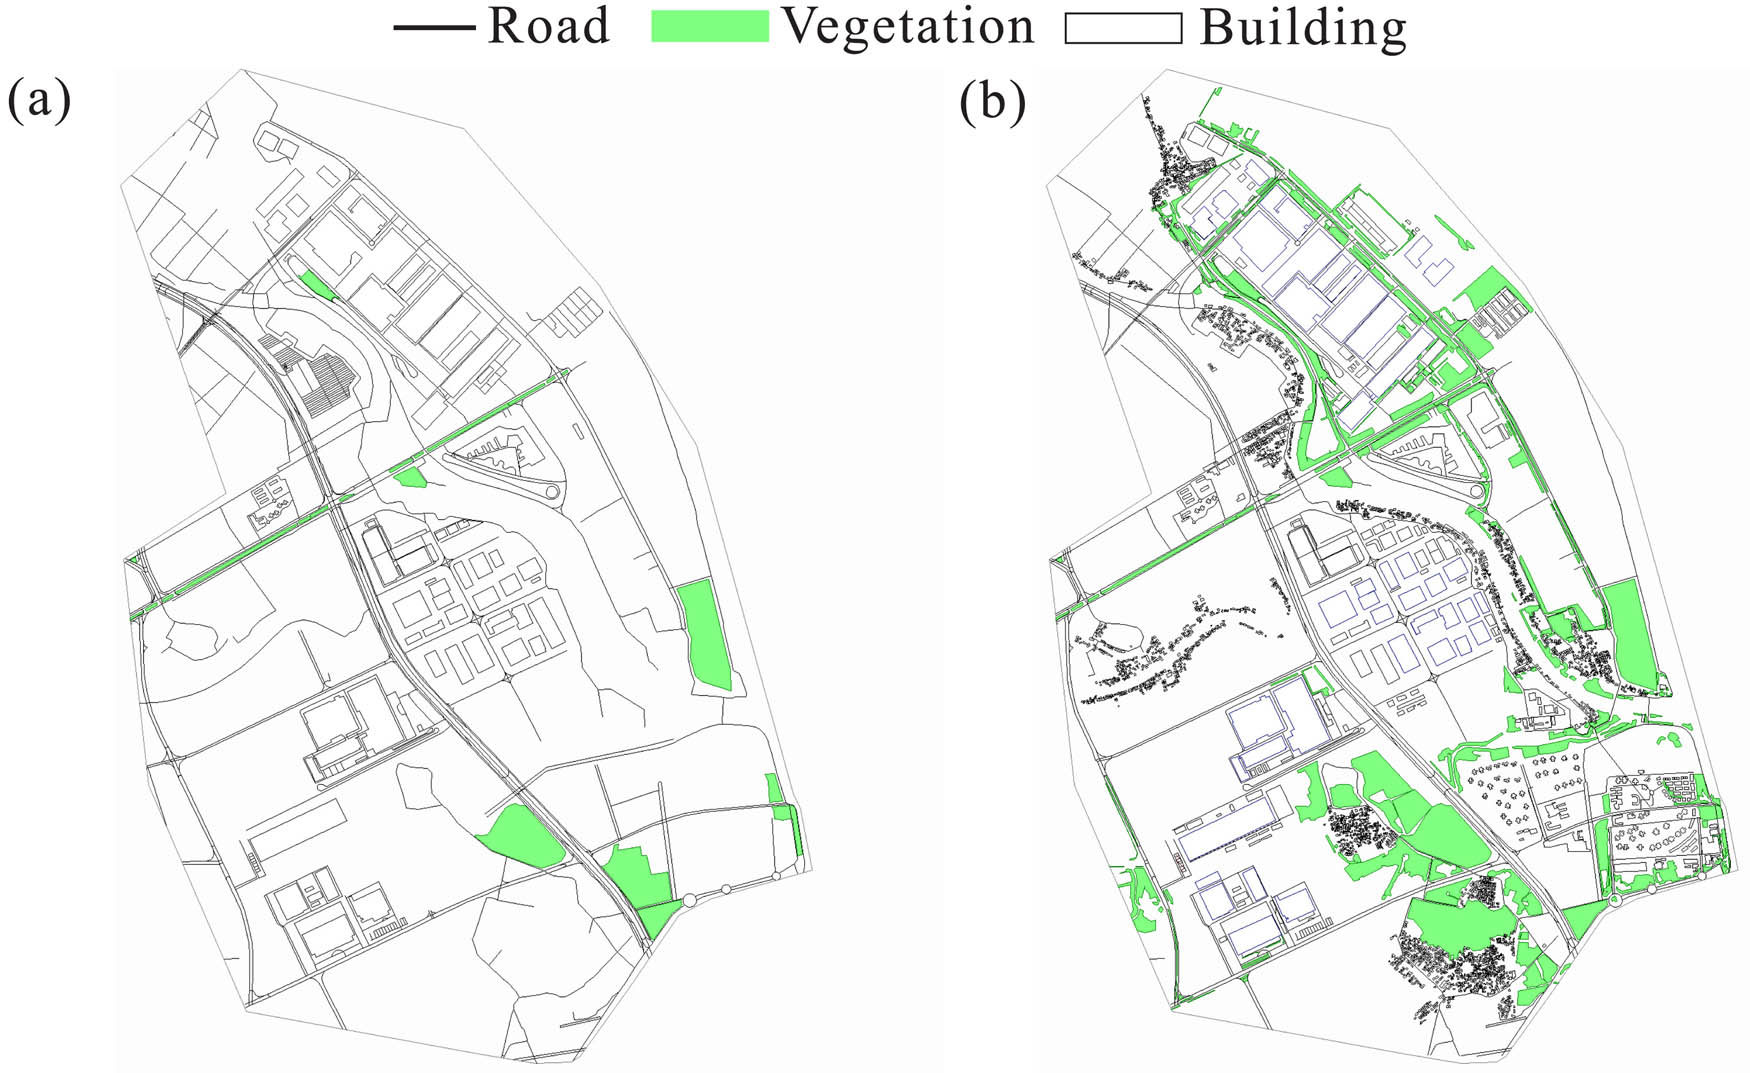
(a) Incomplete outline map and (b) complete outline map.
2.2 Basic information of the noise model
It is necessary to determine the basic information of the noise model to construct a noise map of the study area:
Software: CadnaA software (Version 2020 MR2).
Time frame: 6:00 to 22:00 is defined as daytime; 22:00 to 6:00 is defined as nighttime [25].
Meteorological data: Temperature and relative humidity were obtained from the official website of Guangzhou Meteorological Bureau [26]. Average temperature and average relative humidity of the measurement day were used in the noise model.
Terrain data: Through on-site observation, it was found that the terrain in the study area is relatively flat, so the impact of altitude differences was not considered in the noise model.
2.3 Outline map of the study area
The map of the study area was imported from OpenStreetMap into CadnaA software to obtain a contour map of the study area. However, the preliminary contour map obtained was incomplete and lacked of some contents such as factories and residential buildings. Therefore, by combining the latest satellite image from Google Earth and geographic information from Amap, the map of the study area was improved to obtain a complete outline map as shown in Figure 3.
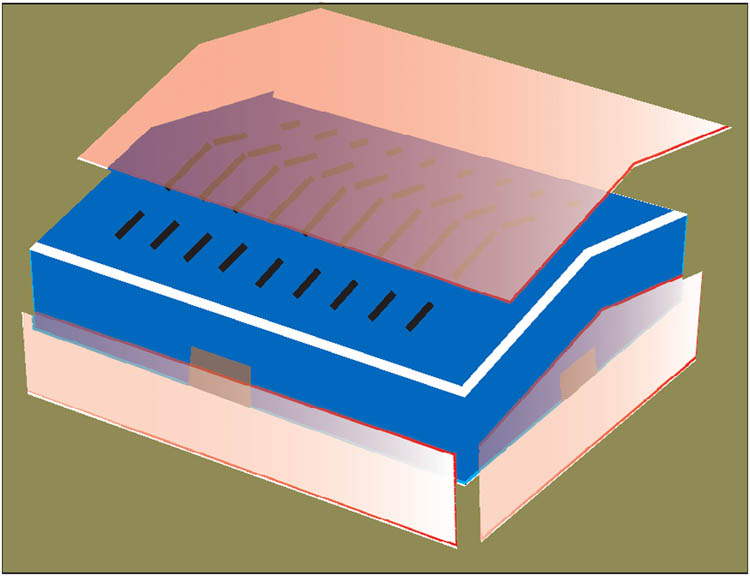
Area sound source of a factory.
2.4 Boundary condition of the factory
Each factory needed to be modelled after the outline map of the study area was obtained. The modelling method by assuming each equipment as a point sound source is very complex due to large number of equipment in each factory. Therefore, the outer surfaces of the factory (excluding the bottom surface) was simplified as area sound source as shown in Figure 4. Assuming that the sound power level was uniformly distributed within the factory, the steps and equation for establishing the factory model are presented here.
This study summarized the equipment types and equipment quantities of each factory based on the environmental impact assessment report of the factory (Table A1 in the Appendix). The working h of each factory was obtained through on-site observation and survey. Then, the mean room sound absorption coefficient of each factory was determined based on the type of factory [30,31] (metal processing and non-metal processing factories) as shown in Table A2 in the Appendix. The noise spectrum or sound power level of the equipment was obtained through previous relevant research studies and some environmental impact assessment reports as shown in Tables A3 and A4 in the Appendix. Finally, the area sound sources for each factory were constructed based on the actual size of the factory’s external surface using the information from Tables A1–A4.
The interior sound pressure level in the room (
(1)To include the effect of transmission loss from indoor to outdoor, it is necessary to input the weighted sound reduction index (
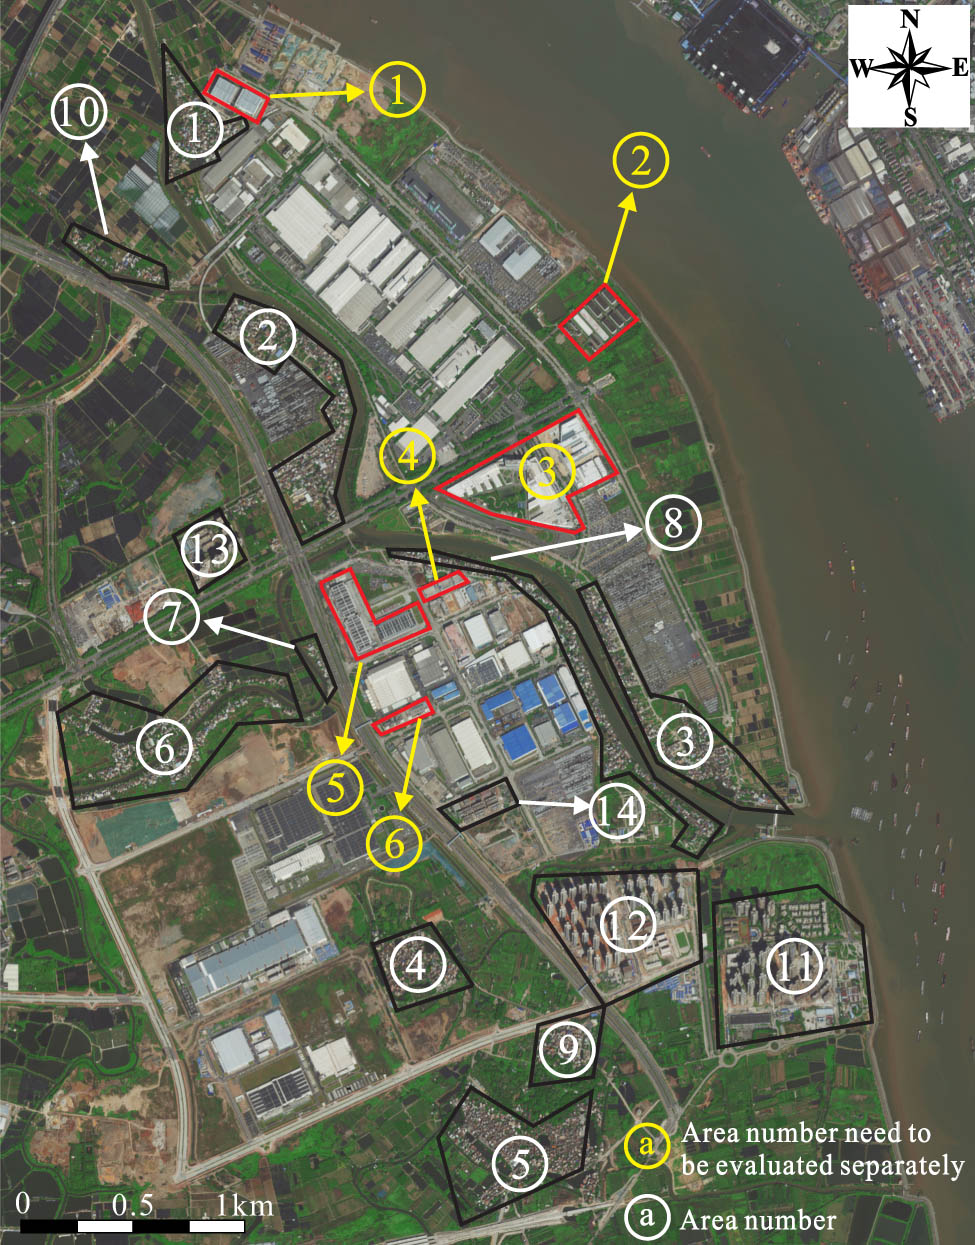
14 small areas with the same building height.
2.5 Building height and its wall sound absorption coefficient
Through on-site observation, beside factories, it was found that the buildings in the study area are mainly composed of villages and residential areas. Some areas in the villages and residential communities have consistent building height. Therefore, this study categorized 10 villages and 4 residential areas within the study area into 14 small areas with similar building heights [33] (Figure 5). Then, the number of floors of buildings in each small area was determined based on Baidu Street View Map [34]. Finally, the height of each building was estimated based on the number of floors and floor height (the floor height in Panyu Motor City is about 3 m), where building height = floor height
Comparison between
Building height of the 14 small areas
| Number | Number of floors | Building height (m) |
|---|---|---|
| 1 | 2.5 | 7.5 |
| 2 | 3 | 9 |
| 3 | 3 | 9 |
| 4 | 3.5 | 10.5 |
| 5 | 2.5 | 7.5 |
| 6 | 3 | 9 |
| 7 | 3 | 9 |
| 8 | 3 | 9 |
| 9 | 3 | 9 |
| 10 | 2 | 6 |
| 11 | 30 | 90 |
| 12 | 29 | 87 |
| 13 | 23 | 69 |
| 14 | 25 | 75 |
Building height that need to be evaluated separately
| Number | Building height (m) | Number | Building height (m) | ||
|---|---|---|---|---|---|
| Area number | 1 | 23 | Factory number | 18 | 15 |
| 2 | 15 | 19 | 8 | ||
| 3 | 26.5 | 20 | 20 | ||
| 4 | 20 | 21 | 16 | ||
| 5 | 25 | 22 | 16 | ||
| 6 | 35 | 23 | 14.15 | ||
| Factory number | 1 | 11 | 24 | 18 | |
| 2 | 19 | 25 | 18 | ||
| 3 | 16 | 26 | 20 | ||
| 4 | 15 | 27 | 20 | ||
| 5 | 17.5 | 28 | 18 | ||
| 6 | 9.3 | 29 | 18 | ||
| 7 | 9.3 | 30 | 17 | ||
| 8 | 9.3 | 31 | 15 | ||
| 9 | 11.5 | 32 | 10 | ||
| 10 | 9.3 | 33 | 12.5 | ||
| 11 | 22 | 34 | 10.5 | ||
| 12 | 9.3 | 35 | 23 | ||
| 13 | 16 | 36 | 9 | ||
| 14 | 16 | 37 | 10.5 | ||
| 15 | 30 | 38 | 10.5 | ||
| 16 | 8 | 39 | 16 | ||
| 17 | 16 | 40 | 7.5 | ||
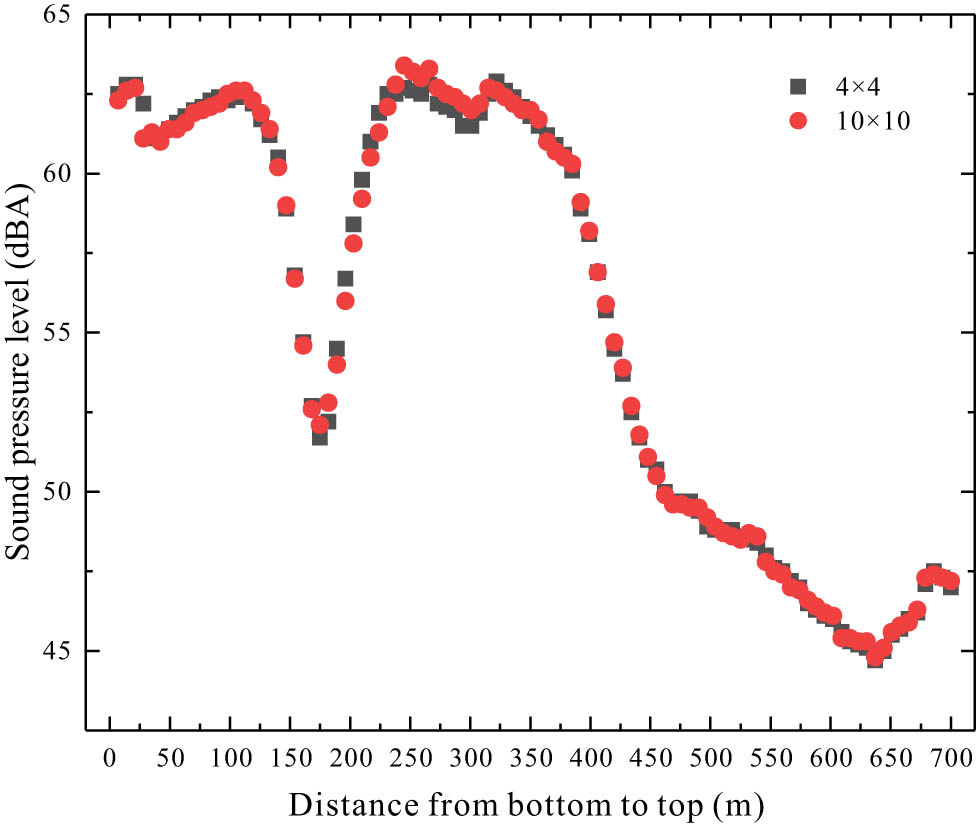
2.6 Grid independency study
Figure 6 shows the sound pressure levels that computed from the production base of Gac Motor using the grid sizes of
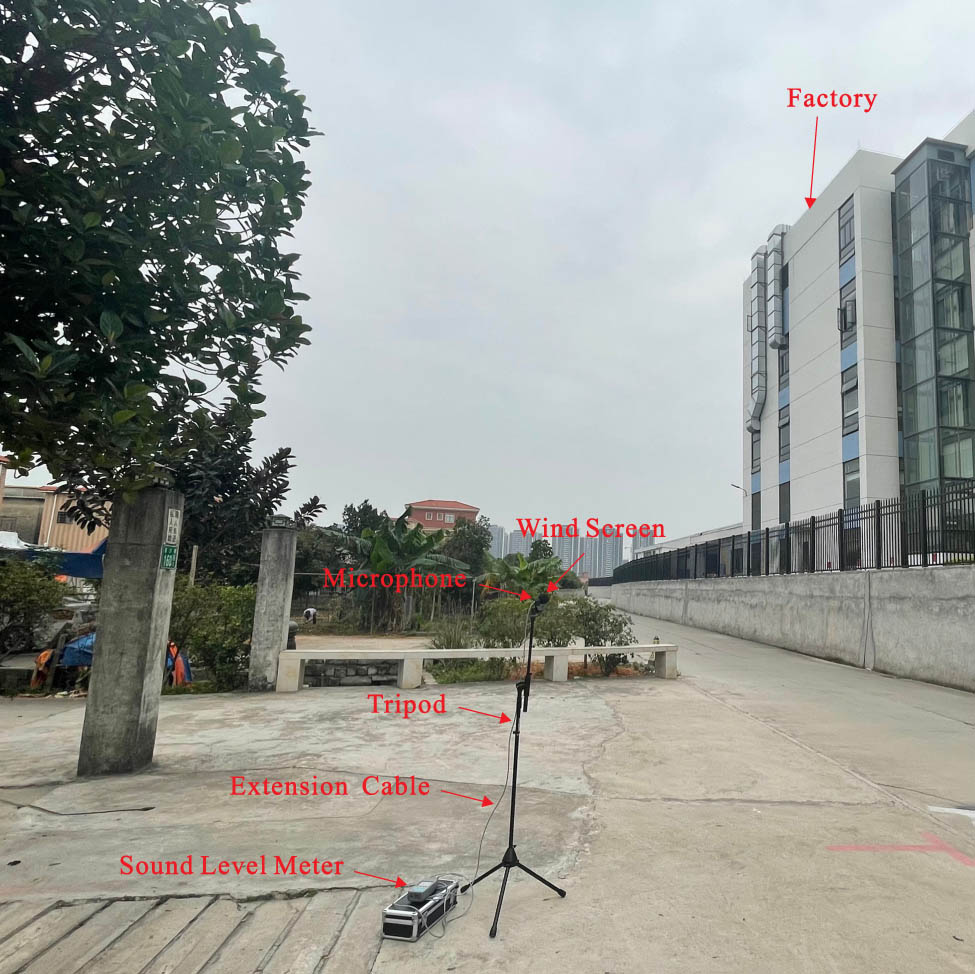
Measurement of the traffic and industrial noise.
2.7 Census data
The total population of the study area is about 48,249 people based on the relevant reports of the People’s Government of Panyu District [36,37]. The total population was allocated to each residential building based on its geometric dimensions (building area and height).
2.8 Validation experiment
Four days field measurements were conducted from 3th to 6th July 2023 to verify accuracy of the trial day road traffic and industrial noise model as shown in Figure 7. Totally there were 39 measurement points (Figure 8). First, the measurement points were selected at the location without the interference of the road traffic noise. Second, some factories are located on side of some roads, so the measurement points of these factories were arranged to simultaneously measure the road traffic noise and industrial noise. Finally, a measurement point was arranged to each arterial road to measure the road traffic noise separately. The measurement process was carried out from 6:00 to 22:00 with measurement time of 15 min at each point based on China national standard (GB 3096-2008) [25]. GB 3096-2008 requires that during the daytime measurement period, the equivalent sound level must be measured for at least 10 min at each measurement point. The date of the measurement process should avoid holidays and non-working days. The measurement time of many researchers were less than 15 min [38–40]. Therefore, 15 min measurement time in the present study complied with China national standard and consistent with the practices of other researchers over the world. The microphone and calibrator used for measuring traffic and factory noises in the present study met the requirements of China national standards GB/T 3785.1 [41] and GB/T 15173 [42], respectively. The microphone was fixed on a tripod at a distance of 1.5 m from the ground and at a distance of 1m or more than 1 m from the fence of factories. In addition, the measurement process was carried out in good weather without rain, snow, or lightning with wind speed below 5 m/s [27]. The average temperature and average relative humidity on the measurement day were
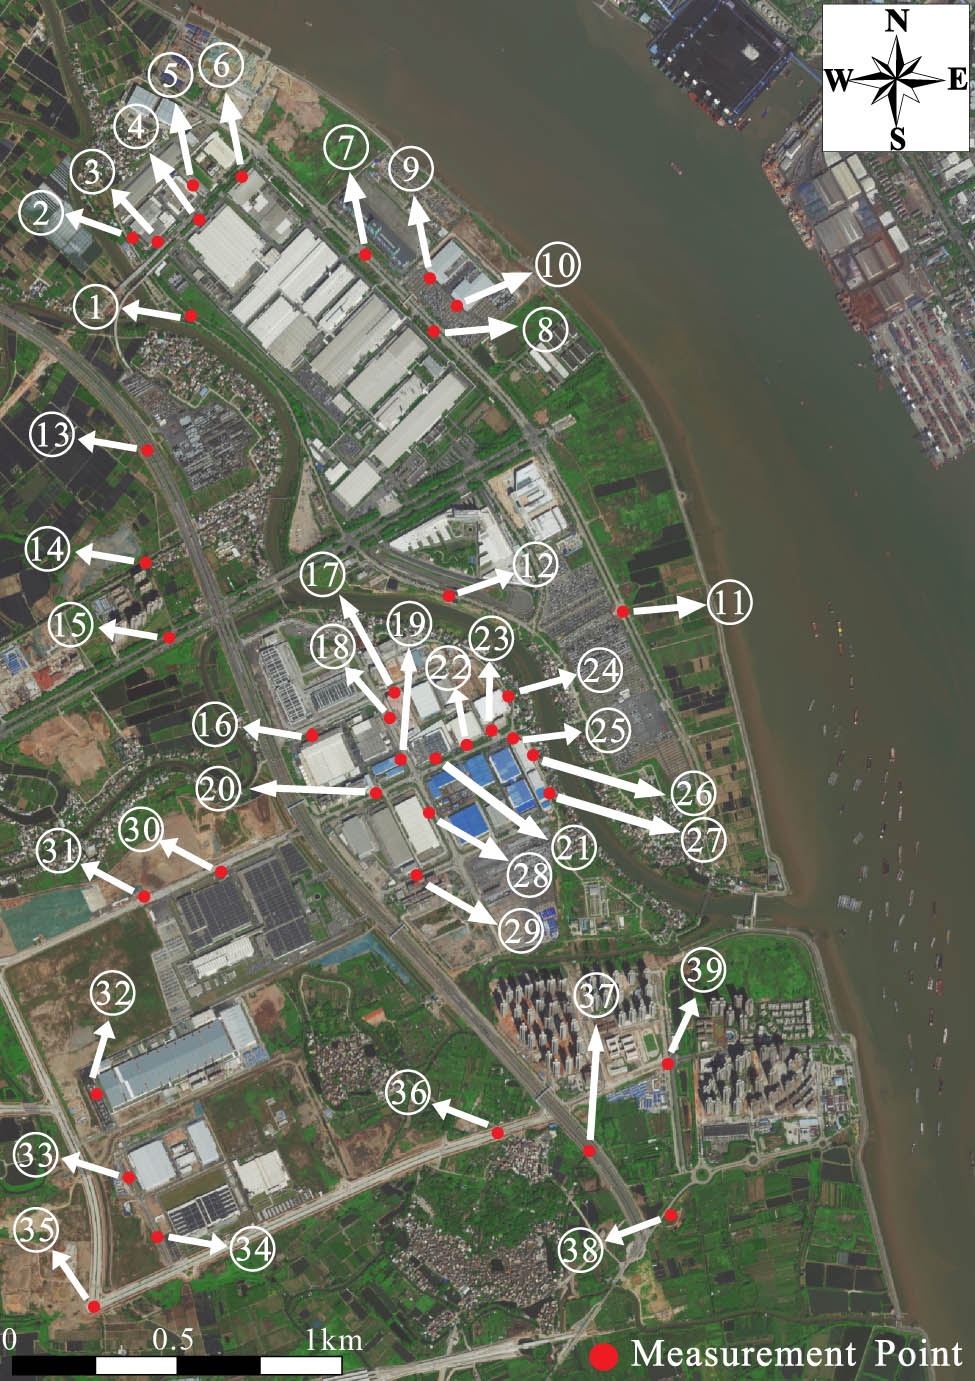
Measurement points.
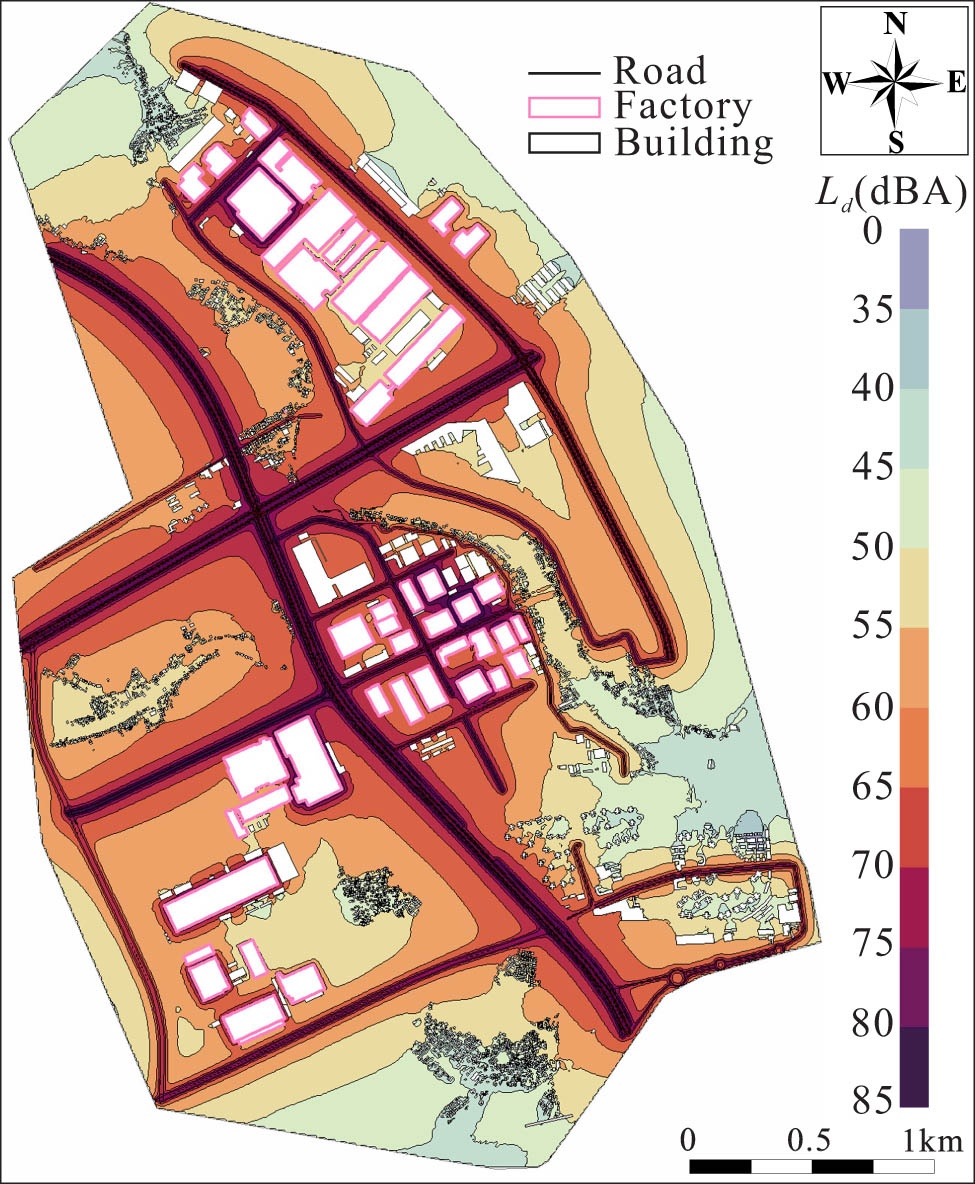
Day road traffic and industrial noise map.
Among the 39 noise measurement points, 20 of these points were located near to the main road (points 2–4, 7, 8, 16–28, 30, and 31). Therefore, these points need to include road traffic data measurement in addition to noise measurement. The data were used to generate the trial day traffic and industrial noise model which included: road width, traffic flow, vehicle type ratio, vehicle speed, and road surface type. The actual width of the road was obtained using the distance measurement function of Amap (satellite map). Vehicle flows and types were measured based on the categories of small-size, mid-size and large-size cars [43]. Vehicle speeds were measured based on the categories of cars and trucks (15 each), and their average values were computed. The hand-held radar speedometer used for measuring vehicle speed in the present study met the requirements of China national standard JJG 771 [44]. In addition, asphalt concrete was selected as the road surface type through on-site observation.
3 Results and discussion
3.1 Comparison between simulation and measurement results
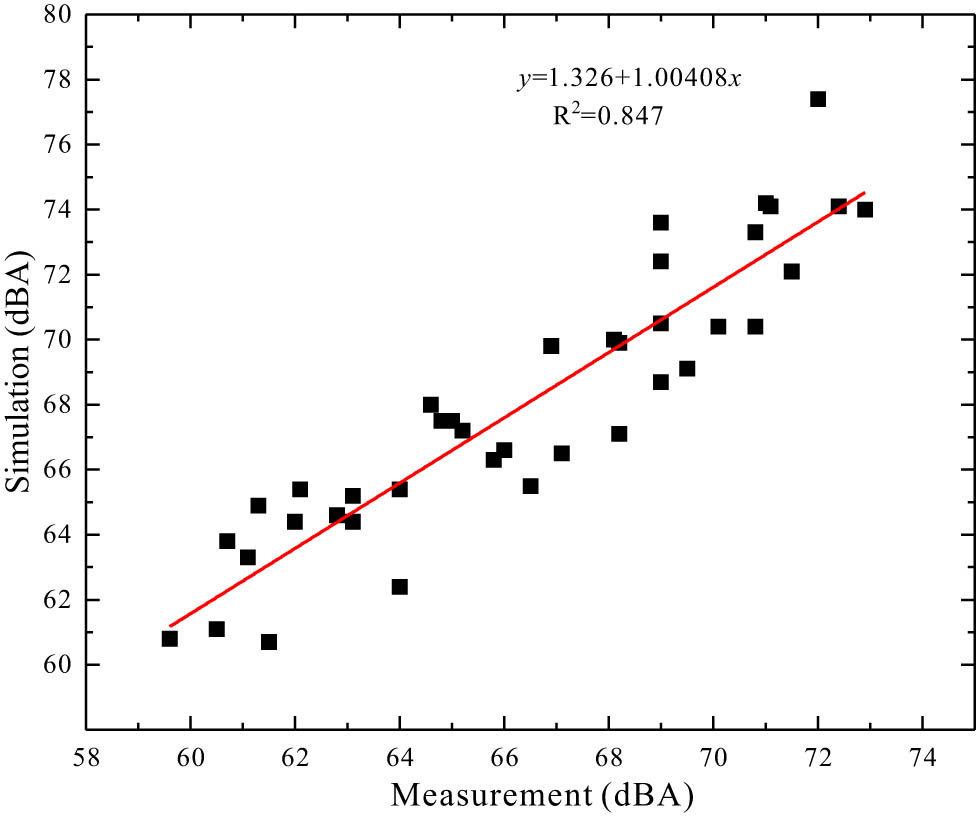
The road traffic and industrial noise map of the study area is shown in Figure 9. The measurement and simulation results at the 39 measurement points are compared as shown in Table 3. The results show that about 80% of the measurement points have errors less than 3 dBA, with an average error of 1.9 dBA. Therefore, the error in this study is relatively small if compared with other similar studies with an average error of approximately 6.1–6.5 dBA [12,13]. In this study, there are two significant errors in 2 measurement points, namely, 4.6 dBA and 5.4 dBA. These large errors are due the fact where the factory equipment near the measurement point shut down intermittently during the measurement process, which resulting in higher simulation values if compared to measurement values.
Correlation analysis between the measurement and simulation results.
Error between the measurement and simulation results. Error =
| Measurement ponit |
|
|
Error (dBA) | Measurement ponit |
|
|
Error (dBA) |
|---|---|---|---|---|---|---|---|
| 1 | 69.0 | 70.5 | 1.5 | 21 | 69.0 | 72.4 | 3.4 |
| 2 | 61.3 | 64.9 | 3.6 | 22 | 72.0 | 77.4 | 5.4 |
| 3 | 64.8 | 67.5 | 2.7 | 23 | 70.8 | 73.3 | 2.5 |
| 4 | 72.9 | 74.0 | 1.1 | 24 | 66.5 | 65.5 | 1.0 |
| 5 | 60.7 | 63.8 | 2.1 | 25 | 68.2 | 69.9 | 1.7 |
| 6 | 68.1 | 70.0 | 1.9 | 26 | 62.0 | 64.4 | 2.4 |
| 7 | 63.1 | 65.2 | 2.1 | 27 | 59.6 | 60.8 | 1.2 |
| 8 | 66.0 | 66.6 | 0.6 | 28 | 64.6 | 68.0 | 3.4 |
| 9 | 61.1 | 63.3 | 2.2 | 29 | 69.0 | 68.7 | 0.3 |
| 10 | 63.1 | 64.4 | 1.3 | 30 | 71.0 | 74.2 | 3.2 |
| 11 | 60.5 | 61.1 | 0.6 | 31 | 71.5 | 72.1 | 0.6 |
| 12 | 67.1 | 66.5 | 0.6 | 32 | 62.8 | 64.6 | 1.8 |
| 13 | 71.1 | 74.1 | 3.0 | 33 | 61.5 | 60.7 | 0.8 |
| 14 | 64.0 | 65.4 | 1.1 | 34 | 64.0 | 62.4 | 1.6 |
| 15 | 70.1 | 70.4 | 0.3 | 35 | 62.1 | 65.4 | 3.3 |
| 16 | 68.2 | 67.1 | 1.1 | 36 | 65.0 | 67.5 | 2.5 |
| 17 | 69.0 | 73.6 | 4.6 | 37 | 70.8 | 70.4 | 0.4 |
| 18 | 72.4 | 74.1 | 1.7 | 38 | 65.2 | 67.2 | 2.0 |
| 19 | 69.5 | 69.1 | 0.4 | 39 | 65.8 | 66.3 | 0.5 |
| 20 | 66.9 | 69.8 | 2.9 |
In addition, a good correlation between the measurement and simulation results is found with a determination coefficient of 0.847 as shown in Figure 10. Therefore, it is proved that the simulation results of this study are accurate. It indicates that the methodologies and industrial noise model in the present study are reliable.
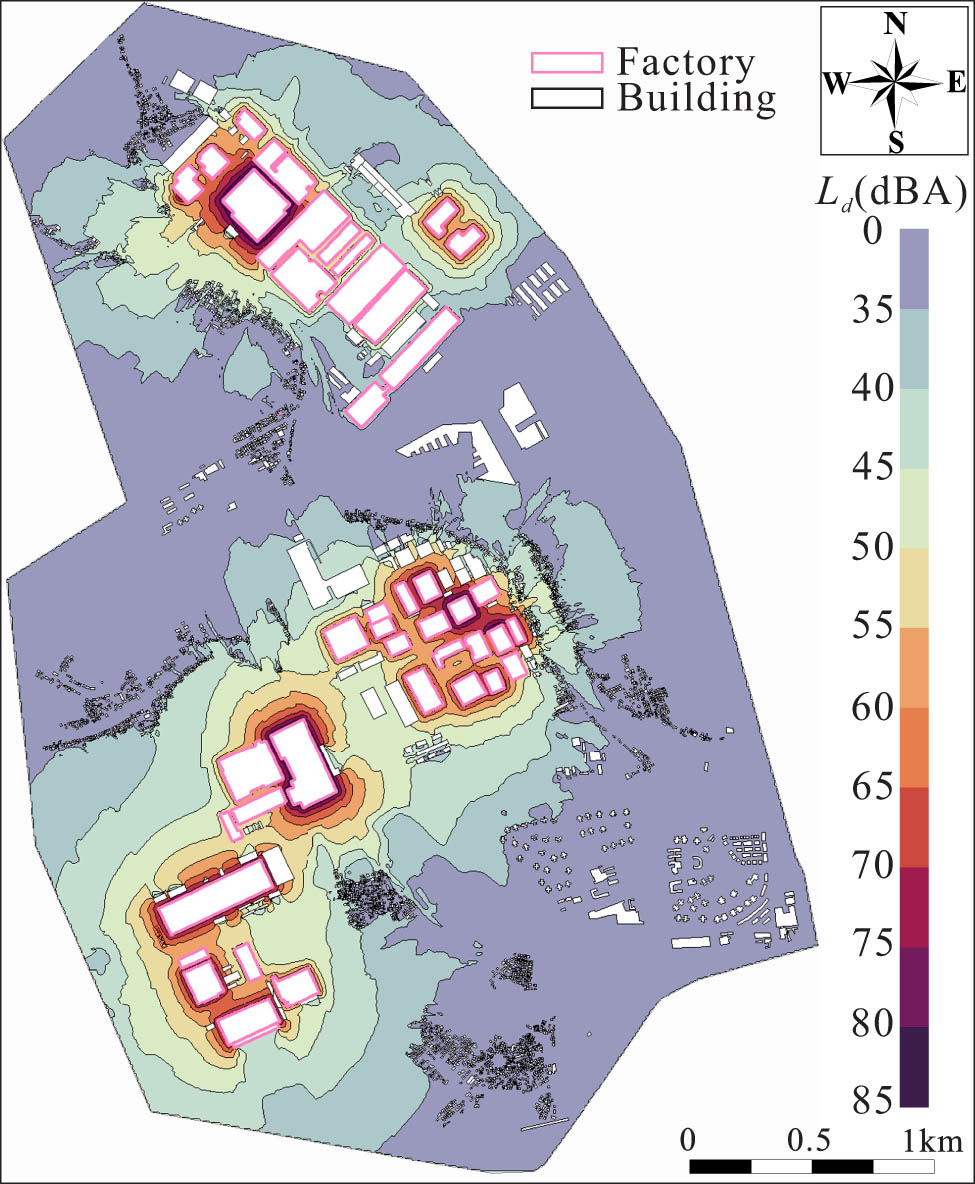
Day industrial noise map.
3.2 Industrial noise map
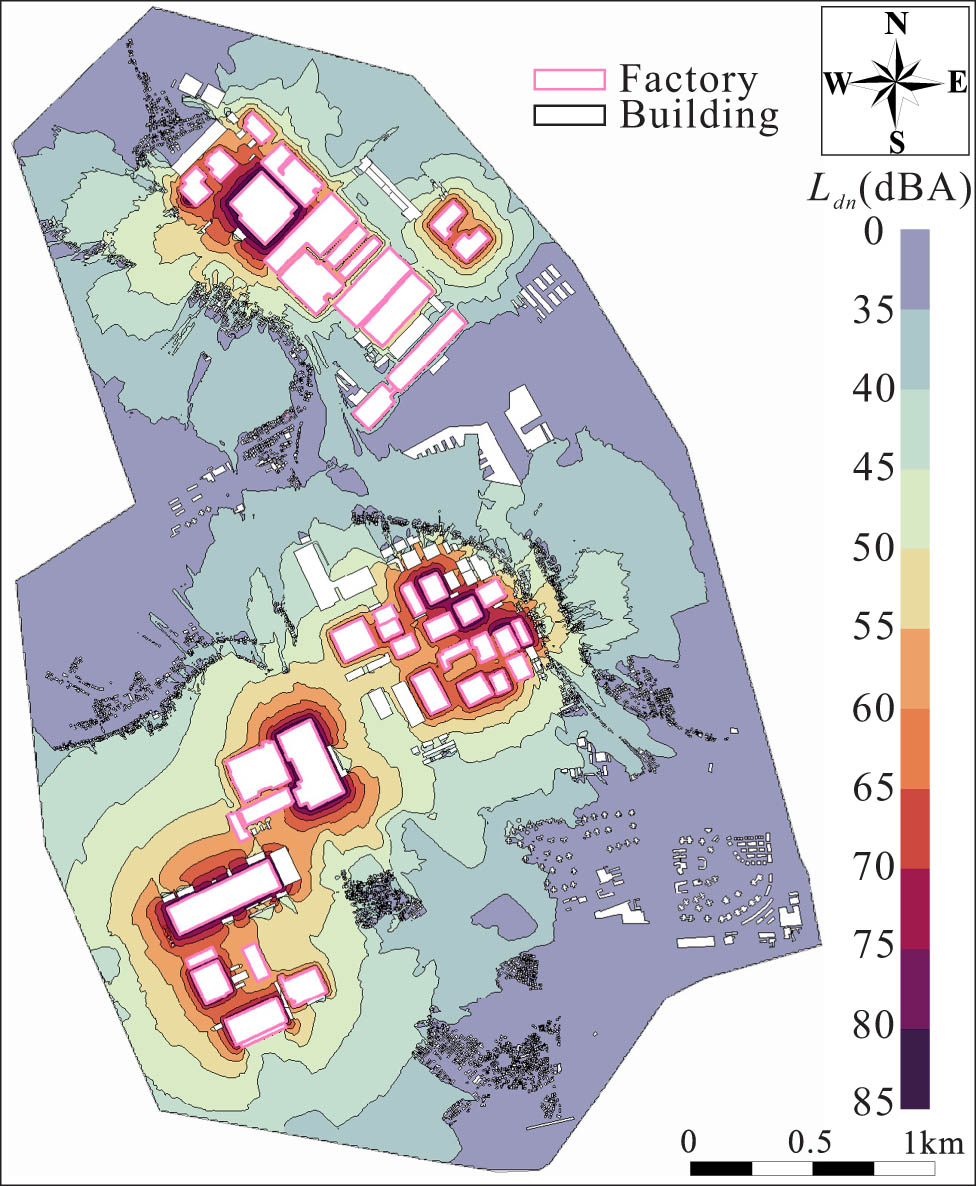
The industrial noise maps for three time periods in Panyu Automobile City was computed after accuracy of the traffic and industrial noise model was verified. The three industrial noise maps are day, night, and day–night noise maps as shown in Figures 11, 12, 13. During daytime, the noise levels of most factory areas (35/40) remain within the range of 55–64.5 dBA. According to the environmental noise limit in Table A6 in the Appendix, industrial production area belongs to Class 3 functional area and thus, the noise level around the factory area needs to be controlled below 65 dBA. Consequently, it can be concluded that the sound environment quality of most factories in the study area meets the requirement of China national standard. However, some residential areas which located near the industrial production areas are affected by industrial noise where their noise levels are above 55dBA (residential area belongs to Class 1 functional area with noise limit of 55dBA). These areas are mainly distributed in parts of Zhansha Village and all staff dormitory buildings as shown in Figure 14(a).
Night industrial noise map.
Day–night industrial noise map.
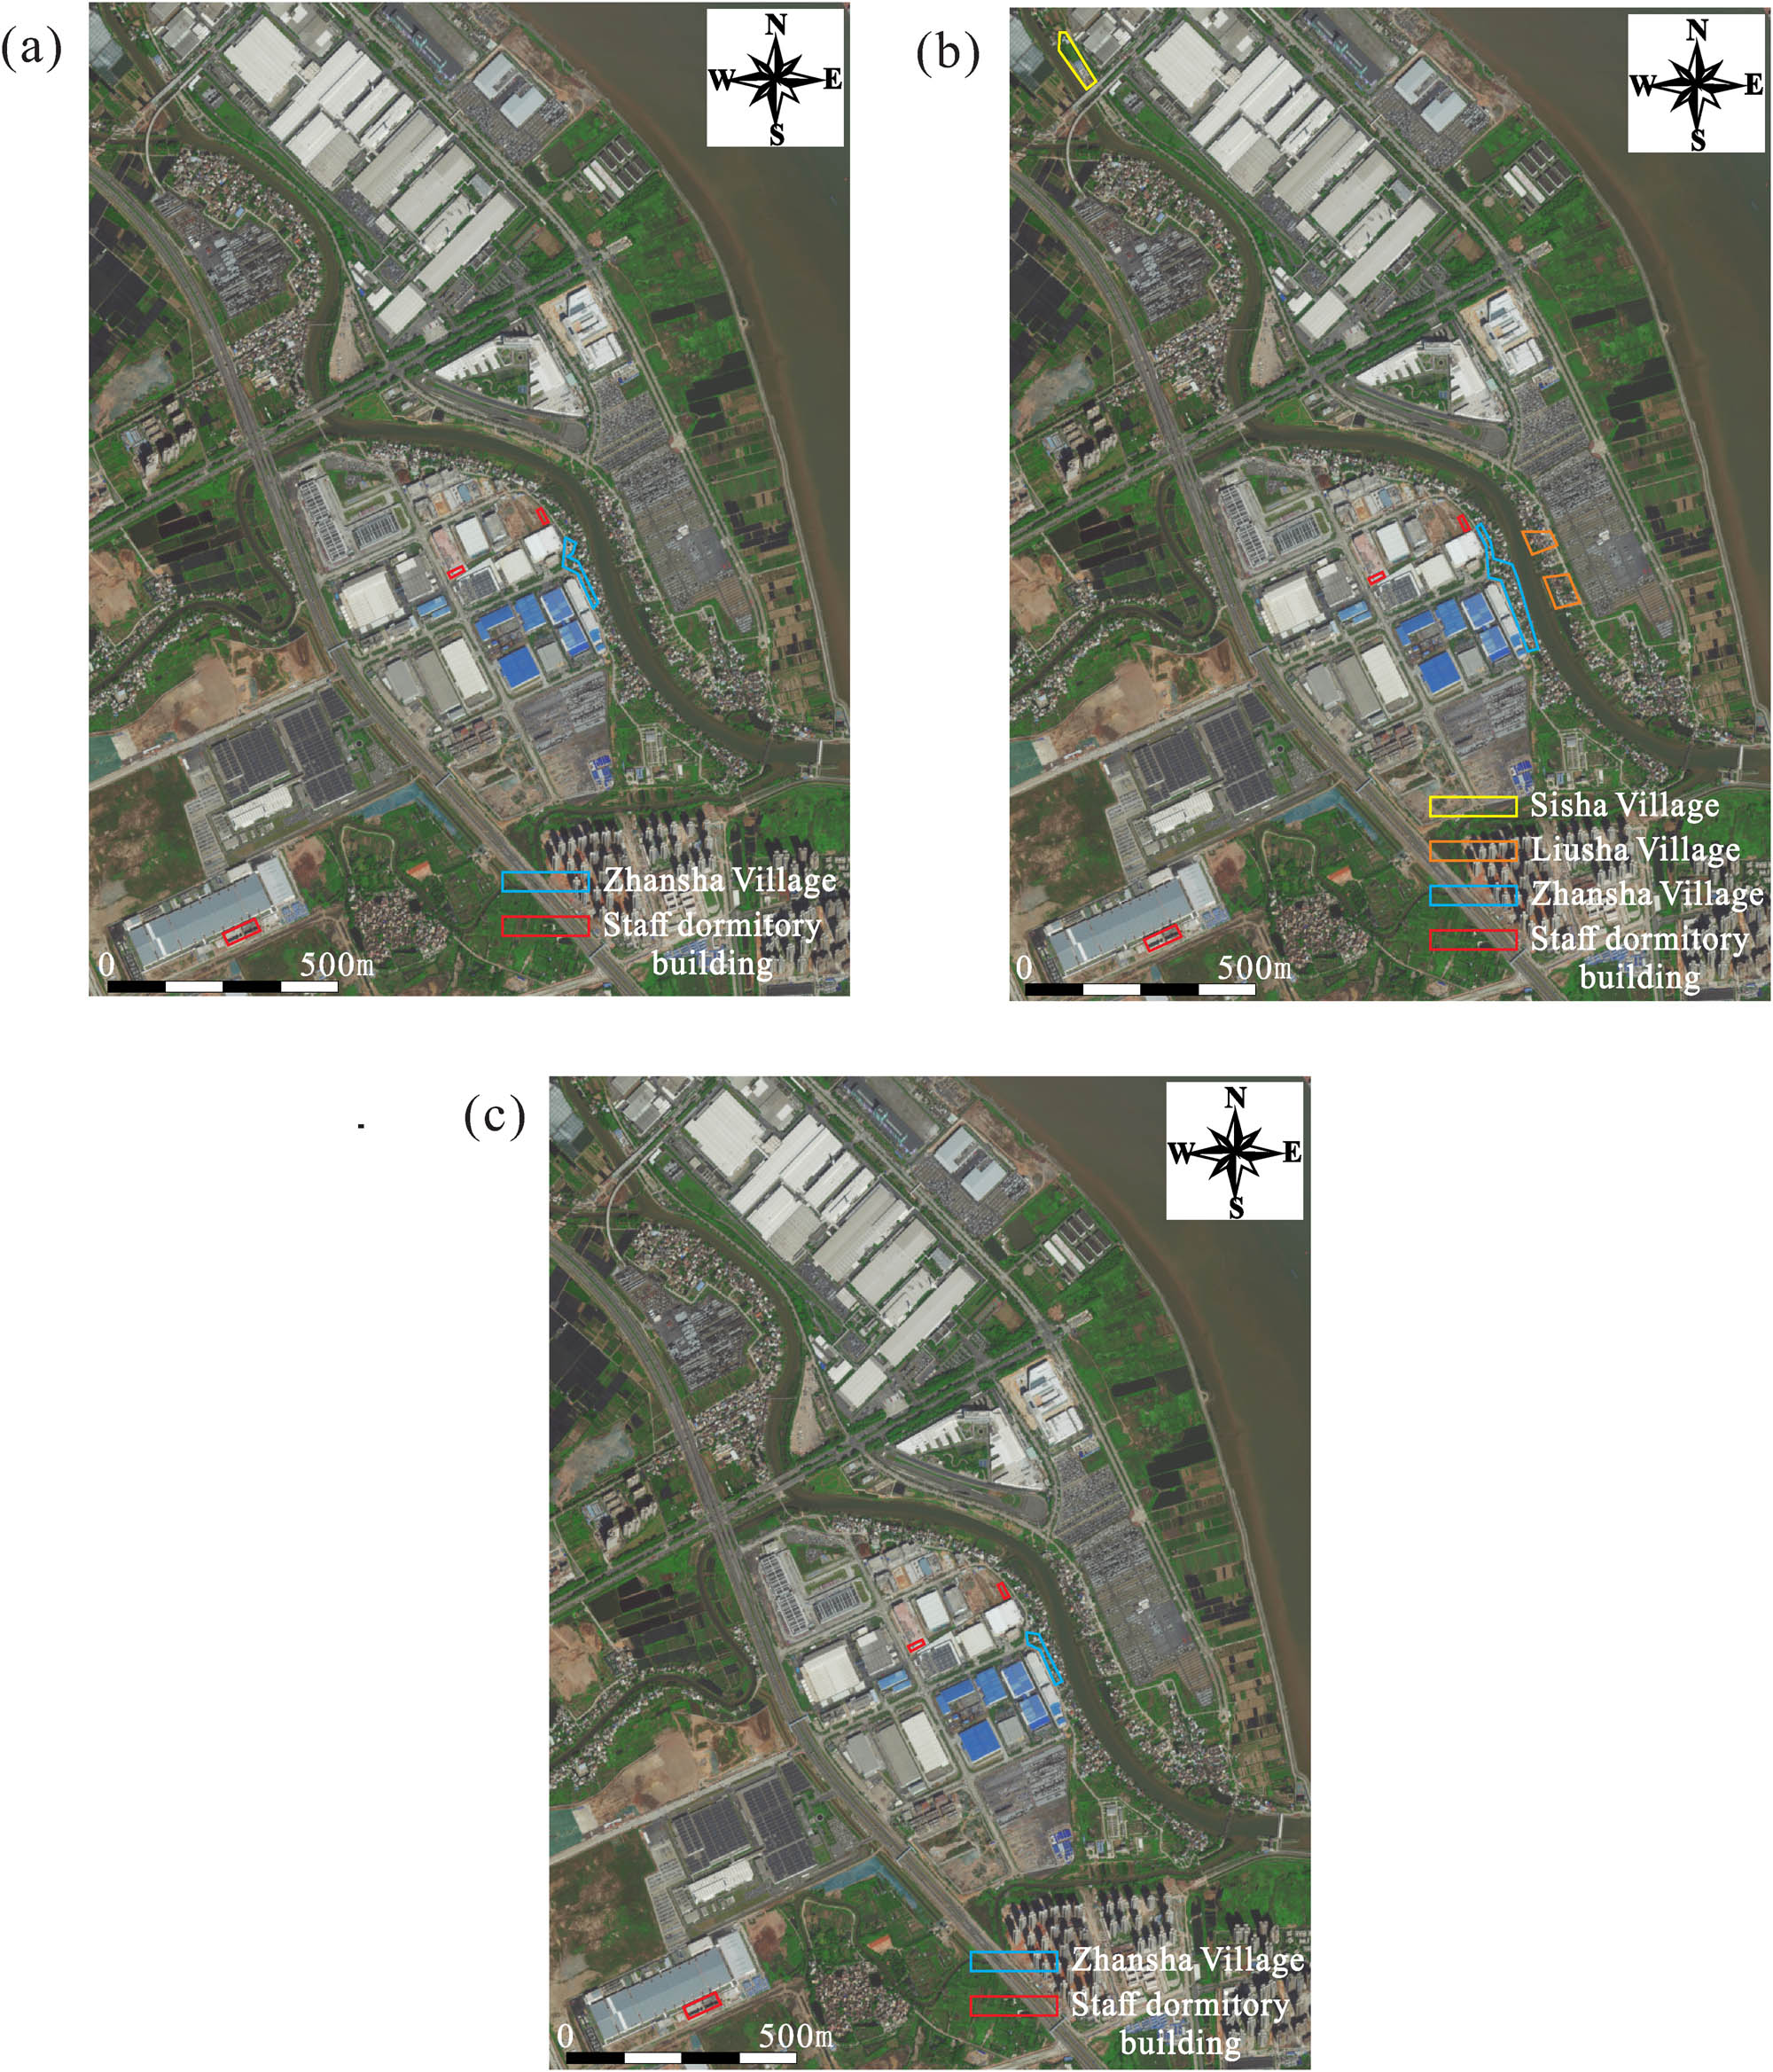
Residential areas that affected by industrial noise. (a) Daytime, (b) nighttime, and (c) day–night.
The noise levels around the factory areas at nighttime decrease about 1.8–5.7 dBA compared to daytime noise level (compare Figures 11 and 12). However, the noise limit of industrial production area during nighttime is tighter (below 55 dBA). Therefore, many factories (13/40) cannot meet the requirement of the national standard during nighttime. Besides, the residential areas that affected by nighttime industrial noise (
This study uses standard of the US Department of Housing and Urban Development (HUD) [45] to classify day–night noise level since there is no relevant China regulations on day–night noise limit. HUD groups the noise level into four groups: (i) clearly acceptable:
3.3 Population under different noise levels
This study evaluates the population that exposed to different noise levels based on day, night, and day–night noise maps as shown in Table 4. The results show that 523 people and 1,357 people are exposed to noise levels (noise limits) of
Population under different noise levels
| Time period |
|
Population |
|---|---|---|
| Day-time |
|
2,415 |
|
|
1,118 | |
|
|
523 | |
|
|
238 | |
|
|
93 | |
| Night-time |
|
1,357 |
|
|
748 | |
|
|
378 | |
|
|
173 | |
|
|
79 | |
| Day-night |
|
46,140 |
|
|
1,752 | |
|
|
357 | |
|
|
0 |
Figure 15 shows the proportion of population under different noise levels during daytime and nighttime. The results indicate that the population in Panyu Automobile City is mainly living under the noise level of
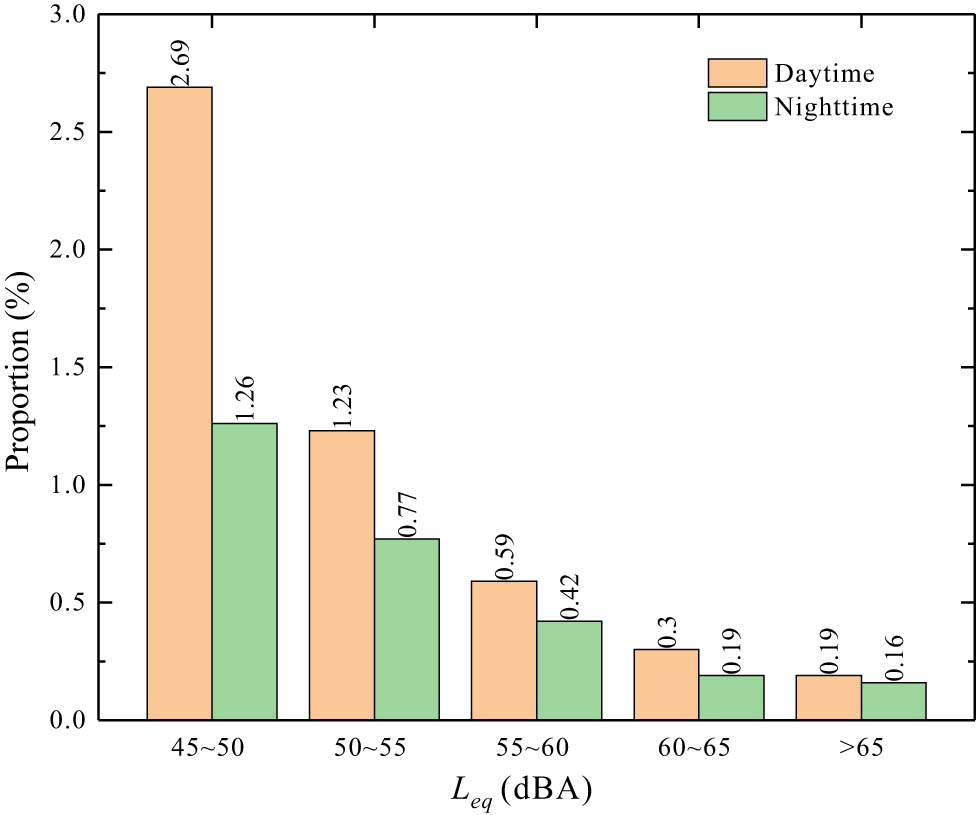
Proportion of the population under different noise levels during daytime and nighttime.
3.4 Low-frequency industrial noise map
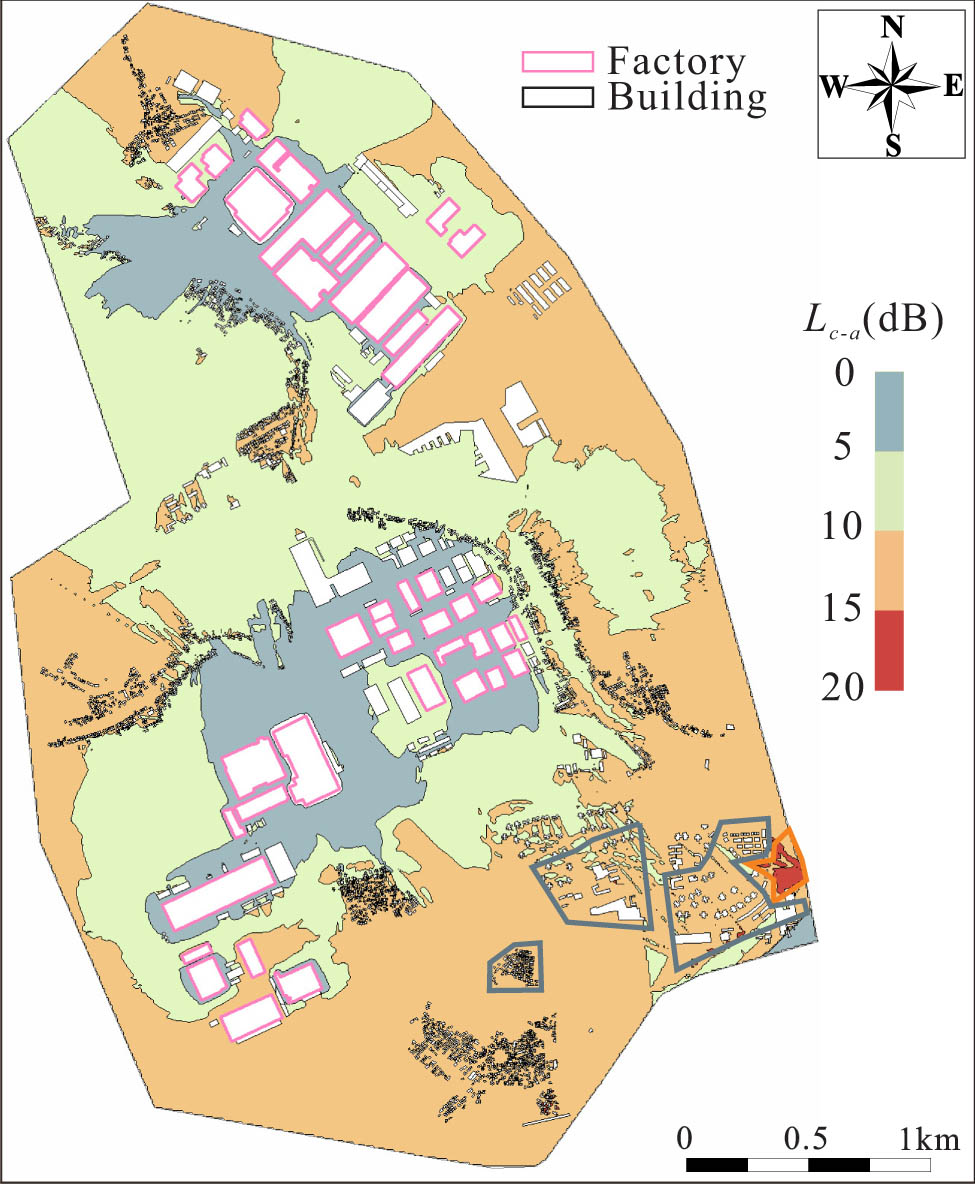
Recently, low-frequency noise has been classified as an environmental problem by the World Health Organization [46]. However, compared to high-frequency noise, there are lesser researches done on the impact of low-frequency noise on health. Some studies had shown that low-frequency noise could cause health problems such as sleep disorders [47] and headaches [48]. Therefore, this study uses dBC-dBA and 15 dB as the indicator and threshold [29,49,50], respectively, to evaluate the low-frequency noise in Panyu Automobile City. If the difference between dBC-dBA at a certain location is greater than 15 dB (
The results for daytime and nighttime are shown in Figures 16 and 17, respectively. The results indicate that the areas affected by low-frequency noise during daytime and nighttime are distributed far away from industrial production areas and are mainly distributed in some areas of Shanhai Liancheng Community (orange marked area in Figures 16 and 17). However, unlike the daytime situation, the areas affected by low-frequency noise at nighttime are also distributed in some areas of Zhilian Automobile Town, and Jiaotang Village (red and purple marked areas in Figure 17, respectively). In addition,
Day low-frequency industrial noise map.
Night low-frequency industrial noise map.
4 Conclusions
The traditional construction method of industrial noise map often consumes high costs in term of manpower and time as it requires obtaining data from relevant departments of government and factories. To overcome the shortcoming of the traditional method, this study obtained the types and quantities of equipment in each factory through environmental impact assessment reports. Thereafter, the noise levels of each equipment were summarizes through open-source data, thus eliminating the need to obtain data from factory managers, greatly improves the efficiency in obtaining factory equipment information. Finally, with the combination with on-site observation, measurement, and numerical modelling, the industrial noise map of Panyu Automobile City was constructed at different time periods. The average error between the measurement and the simulation results at all measurement points was 1.9 dBA, which is lower than the errors of other similar studies. Therefore, the noise map of this study can accurately reflect the actual industrial noise level in the study area.
The industrial noise maps indicated significant differences in the noise pollution level in Panyu Automobile City at different time periods. Therefore, this study evaluated the exposed population under different noise levels. The results showed that during daytime and nighttime, 1.08 and 2.81% of the populations were exposed to excessive noise levels (over the noise limits of national standard), respectively. It can be seen that the industrial noise pollution level at nighttime is more severe than during daytime because the noise limit at nighttime is much stricter than that during daytime. In addition, noise maps with
-
Funding information: Authors state no funding involved.
-
Author contributions: All authors have accepted responsibility for the entire content of this manuscript and consented to its submission to the journal, reviewed all the results and approved the final version of the manuscript. Conceptualization: HML; methodology: YW; software: YW; validation: YW; formal analysis: YW; investigation: YW; resources: HML; data curation: YW; writing – original draft preparation: HML; writing – review and editing: HML; visualization: YW; supervision: HML; project administration: HML.
-
Conflict of interest: The authors state no conflict of interest.
Appendix
Factory information
| Factory number | Factory type | Equipment | Number of equipment | Working time |
|---|---|---|---|---|
| 1 | Rubber plant [51] | Open mill | 3 | 24 h |
| Internal mixer | 2 | |||
| Rubber filter machine | 1 | |||
| Chiller | 1 | |||
| Extruder | 14 | |||
| Cutting machine | 48 | |||
| Foaming machine | 4 | |||
| Perforating machine | 4 | |||
| Sealing strip flocking | 3 | |||
| Compressor | 3 | |||
| Injection molding machine | 17 | |||
| 2 | Seat manufacturing [52] | Forming machine | 2 | 8:00–24:00 |
| Dryer | 2 | |||
| Chiller | 2 | |||
| Riveting machine | 1 | |||
| Spot welding machine | 6 | |||
| Welding robots | 14 | |||
| Spot welding robot | 3 | |||
| Laser welding machine | 2 | |||
| Axial flow fan | 2 | |||
| Glue spraying cabinet | 1 | |||
| Compressor | 3 | |||
| 3 | Interior manufacturing [53] | Foaming machine | 3 | 8:00–24:00 |
| Foaming machine | 2 | |||
| Punching machine | 6 | |||
| Cutting machine | 1 | |||
| Thermoforming machine | 1 | |||
| Glue spray machine | 2 | |||
| Ultrasonic welder | 25 | |||
| Friction welding machine | 2 | |||
| Injection molding machine | 5 | |||
| Flame treatment machine | 1 | |||
| Compressor | 2 | |||
| Generator | 1 | |||
| 4 | Engine manufacturing [54] | CNC | 109 | 8:00–24:00 |
| Ultrasonic washer | 12 | |||
| Press-fitting machine | 16 | |||
| Tightening machine | 15 | |||
| Lathe | 4 | |||
| Grinding machine | 10 | |||
| Glue coating machine | 6 | |||
| Chiller | 1 | |||
| Buffing machine | 1 | |||
| Engine heat test bench | 4 | |||
| 5 | Press shop [55] | Mechanical press | 40 | 8:00–24:00 |
| Rectifier welding machine | 1 | |||
| Pedestal grinder | 1 | |||
| Research and matching press | 2 | |||
| Bench drill machine | 1 | |||
| Mold cleaning machine | 1 | |||
| Forklift | 6 | |||
| 6 | Welding shop [55] | Spot welding machine | 53 | 8:00–24:00 |
| Spot welding Robot | 189 | |||
| CO2 arc welding machine | 14 | |||
| Crop shear | 28 | |||
| Stud welding machine | 9 | |||
| Riveting robot | 69 | |||
| Glue dispensing robot | 11 | |||
| Roller hemming robot | 9 | |||
| Robotic stud welding | 7 | |||
| 7 | Welding shop [55] | Spot welding machine | 14 | 8:00–24:00 |
| Spot welding robot | 23 | |||
| CO2 arc welding machine | 4 | |||
| Crop shear | 7 | |||
| Stud welding machine | 2 | |||
| Air hoist | 7 | |||
| Riveting robot | 18 | |||
| Glue dispensing robot | 3 | |||
| Roller hemming robot | 2 | |||
| Robotic stud welding | 2 | |||
| 8 | Welding shop [55] | Spot welding machine | 12 | 8:00–24:00 |
| Spot welding robot | 20 | |||
| CO2 arc welding machine | 3 | |||
| Crop shear | 6 | |||
| Stud welding machine | 2 | |||
| Air hoist | 6 | |||
| Riveting robot | 15 | |||
| Glue dispensing robot | 2 | |||
| Roller hemming robot | 2 | |||
| Robotic stud welding | 2 | |||
| 9 | Assembly shop [55] | Car interior line | 1 | 8:00–24:00 |
| Car chassis line | 1 | |||
| Car exterior assembly line | 1 | |||
| Instrument assembly line | 1 | |||
| Powertrain production area | 1 | |||
| Door subassembly | 1 | |||
| Test line | 1 | |||
| 10 | Welding shop [55] | Spot welding machine | 40 | 8:00–24:00 |
| Spot welding robot | 67 | |||
| CO2 arc welding machine | 11 | |||
| Crop shear | 21 | |||
| Stud welding machine | 7 | |||
| Air hoist | 19 | |||
| Riveting robot | 52 | |||
| Glue dispensing robot | 8 | |||
| Roller hemming robot | 7 | |||
| Robotic stud welding | 5 | |||
| 11 | Paint shop [55] | Kiln | 4 | 8:00–24:00 |
| The wax room | 1 | |||
| Painting robot | 4 | |||
| Spraying robot | 4 | |||
| 12 | Battery testing [55] | Charge and discharge tester | 8 | 8:00–24:00 |
| Transfer robot | 2 | |||
| 13 | Metal products [56] | Uncoiler | 2 | 8:00–24:00 |
| Crop shear | 2 | |||
| Welding machine | 1 | |||
| Compressor | 3 | |||
| Water pump | 2 | |||
| Bridge crane | 3 | |||
| 14 | Axial flow fan | 6 | ||
| Skin pass mill | 1 | |||
| Roll coater | 1 | |||
| Stretching straightener | 1 | |||
| Coiler | 2 | |||
| Furnace anneal | 1 | |||
| 15 | Parts manufacturing [57] | Injection molding machine | 9 | 8:00–24:00 |
| Crusher | 3 | |||
| Buffing machine | 3 | |||
| Heating furnace | 1 | |||
| Kiln | 2 | |||
| Painting robot | 12 | |||
| 16 | Parts manufacturing [58] | Mechanical press | 20 | 24 h |
| Spot welding machine | 22 | |||
| Leveling machine | 2 | |||
| Oil press | 16 | |||
| Cutting machine | 5 | |||
| Bending machine | 2 | |||
| Bench drill machine | 6 | |||
| Chiller | 4 | |||
| Double head saws | 9 | |||
| Welding robots | 13 | |||
| 17 | Interior decoration [53] | Foaming machine | 2 | 8:00–17:20 |
| Injection molding machine | 5 | |||
| Punching machine | 9 | |||
| Ultrasonic welder | 25 | |||
| Flame treatment machine | 1 | |||
| Foaming machine | 3 | |||
| Friction welding machine | 2 | |||
| Cutting machine | 1 | |||
| Compressor | 3 | |||
| Oil press | 1 | |||
| Cooler | 1 | |||
| Nitrogen generator | 1 | |||
| Generator | 1 | |||
| 18 | Parts manufacturing [59] | Mechanical press | 48 | 8:00–24:00 |
| Compressor | 3 | |||
| Hydraulic press | 6 | |||
| Hydraulic pipe bender | 4 | |||
| Lathe | 21 | |||
| Shearing machine | 4 | |||
| Automatic pipe cutting machine | 4 | |||
| Double head multi boring machine | 4 | |||
| Welding robots | 26 | |||
| Spot welding machine | 10 | |||
| CO2 arc welding machine | 41 | |||
| TIG welding | 2 | |||
| Buffing machine | 2 | |||
| 19 | Metal components [60] | 3D laser cutting machine | 3 | 8:00–24:00 |
| CNC | 1 | |||
| OTC robotic arm | 10 | |||
| Compressor | 3 | |||
| Cutting machine | 1 | |||
| Oil press | 1 | |||
| Cooler | 1 | |||
| Nitrogen generator | 1 | |||
| Heating furnace | 1 | |||
| 20 | Parts manufacturing [61] | Forming machine | 2 | 24 h |
| Dryer | 2 | |||
| Chiller | 2 | |||
| Riveting machine | 1 | |||
| Spot welding machine | 6 | |||
| Welding robots | 14 | |||
| Spot welding robot | 3 | |||
| Laser welding machine | 2 | |||
| Axial flow fan | 2 | |||
| Glue spraying cabinet | 1 | |||
| Compressor | 3 | |||
| 21 | Parts manufacturing [62] | Welding robots | 20 | 8:00–24:00 |
| Spot welding robot | 90 | |||
| Forklift | 8 | |||
| Mechanical press | 6 | |||
| Compressor | 3 | |||
| Bridge crane | 2 | |||
| 22 | Mold manufacturing [62] | Lathe | 2 | 8:00–24:00 |
| Milling machine | 4 | |||
| Wire-cutting machine | 2 | |||
| Electrical discharge machining | 6 | |||
| CNC | 4 | |||
| Grinding machine | 2 | |||
| 23 | Parts manufacturing [63] | Plate shear | 1 | 8:00–17:20 |
| Mechanical press | 19 | |||
| Bending machine | 1 | |||
| Welding robots | 20 | |||
| Spot welding machine | 6 | |||
| Compressor | 1 | |||
| 24 | Recycling processing [64] | Roller machine | 10 | 8:30–17:15 18:00–24:00 |
| Mechanical press | 4 | |||
| 25 | Packaging machine | 2 | ||
| Bridge crane | 2 | |||
| Forklift | 3 | |||
| 26 | Steel processing [65] | Uncoiler | 1 | 8:00–24:00 |
| Plate shear | 1 | |||
| Ultrasonic washer | 1 | |||
| Leveling machine | 1 | |||
| Forklift | 2 | |||
| Bridge crane | 10 | |||
| 27 | Steel processing [65] | Plate shear | 1 | 8:00–24:00 |
| Panel turnover machine | 1 | |||
| Axial flow fan | 30 | |||
| Compressor | 4 | |||
| Generator | 1 | |||
| Cold sawing machine | 2 | |||
| Temper mill | 2 | |||
| Straightening machine | 2 | |||
| Leveling machine | 2 | |||
| Coiler | 2 | |||
| Packaging machine | 1 | |||
| Uncoiler | 2 | |||
| Roller machine | 2 | |||
| 28 | Recycling processing [64] | Roller machine | 10 | 8:00–24:00 |
| Mechanical press | 4 | |||
| Packaging machine | 2 | |||
| Bridge crane | 2 | |||
| Forklift | 3 | |||
| 29 | Mold manufacturing [66] | Lathe | 3 | 8:00–24:00 |
| Milling machine | 6 | |||
| Wire-cutting machine | 3 | |||
| Electrical discharge machining | 9 | |||
| CNC | 6 | |||
| Grinding machine | 3 | |||
| Driller | 3 | |||
| 30 | Press shop [66] | Mechanical press | 11 | 8:00–24:00 |
| CNC | 8 | |||
| 31 | Welding shop [66] | Stud welding machine | 30 | 8:00–24:00 |
| CO2 arc welding machine | 52 | |||
| Spot welding machine | 195 | |||
| Welding robots | 398 | |||
| 32 | Press shop [55] | Mechanical press | 40 | 8:00–24:00 |
| Rectifier welding machine | 1 | |||
| Pedestal grinder | 1 | |||
| Research and matching press | 2 | |||
| Bench drill machine | 1 | |||
| Mold cleaning machine | 1 | |||
| Forklift | 6 | |||
| 33 | Welding shop [55] | Spot welding machine | 118 | 8:00–24:00 |
| Spot welding robot | 199 | |||
| CO2 arc welding machine | 32 | |||
| Crop shear | 62 | |||
| Stud welding machine | 21 | |||
| Air hoist | 57 | |||
| Riveting robot | 154 | |||
| Glue dispensing robot | 24 | |||
| Roller hemming robot | 20 | |||
| Robotic stud welding | 16 | |||
| 34 | Paint shop [55] | Kiln | 4 | 8:00–24:00 |
| The wax room | 1 | |||
| Painting robot | 4 | |||
| Spraying robot | 4 | |||
| 35 | Battery manufacturing [67] | Coating machine | 8 | 24 h |
| Roller machine | 8 | |||
| Laser welding machine | 52 | |||
| Assembly machine | 8 | |||
| Industrial inkjet printer | 8 | |||
| Compressor | 4 | |||
| Nitrogen generator | 4 | |||
| Refrigerating machine | 3 | |||
| 36 | Semiconductor [68] | Ring cutting machine | 2 | 8:00–24:00 |
| Dicing machine | 4 | |||
| Automatic welding machine | 2 | |||
| Automatic bonding machine | 20 | |||
| Automatic module mounting machine | 2 | |||
| Automated assembly machine | 2 | |||
| Automatic packaging machine | 2 | |||
| Compressor | 2 | |||
| Chiller | 3 | |||
| 37 | Interior manufacturing [69] | Painting robot | 12 | 8:00–24:00 |
| Punching machine | 33 | |||
| Welding machine | 20 | |||
| Injection molding machine | 4 | |||
| Crusher | 1 | |||
| Compressor | 4 | |||
| Chiller | 3 | |||
| 38 | Parts manufacturing [70] | Rotor assembly line | 5 | 8:00–24:00 |
| Stator assembly line | 5 | |||
| Motor assembly line | 5 | |||
| Gearbox assembly line | 5 | |||
| Final assembly line | 5 | |||
| Compressor | 5 | |||
| 39 | Gearbox manufacturing [71] | CNC | 127 | 8:00–24:00 |
| Lathe | 19 | |||
| Grinding machine | 19 | |||
| Dryer | 58 | |||
| Hydraulic press | 37 | |||
| Compressor | 62 | |||
| Ultrasonic washer | 35 | |||
| Refrigerating machine | 1 | |||
| Tightening machine | 40 | |||
| 40 | Engine manufacturing [54] | CNC | 218 | 8:00–24:00 |
| Ultrasonic washer | 24 | |||
| Press-fitting machine | 31 | |||
| Tightening machine | 29 | |||
| Lathe | 7 | |||
| Grinding machine | 19 | |||
| Glue coating machine | 11 | |||
| Chiller | 2 | |||
| Buffing machine | 1 | |||
| Engine heat test bench | 8 |
| Factory number | Mean room absorption coefficient | Factory number | Mean room absorption coefficient |
|---|---|---|---|
| 1 | 0.5 | 21 | 0.35 |
| 2 | 0.5 | 22 | 0.35 |
| 3 | 0.35 | 23 | 0.35 |
| 4 | 0.35 | 24 | 0.35 |
| 5 | 0.35 | 25 | 0.35 |
| 6 | 0.35 | 26 | 0.35 |
| 7 | 0.35 | 27 | 0.35 |
| 8 | 0.35 | 28 | 0.35 |
| 9 | 0.35 | 29 | 0.35 |
| 10 | 0.35 | 30 | 0.35 |
| 11 | 0.35 | 31 | 0.35 |
| 12 | 0.5 | 32 | 0.35 |
| 13 | 0.35 | 33 | 0.35 |
| 14 | 0.35 | 34 | 0.35 |
| 15 | 0.35 | 35 | 0.35 |
| 16 | 0.35 | 36 | 0.35 |
| 17 | 0.35 | 37 | 0.35 |
| 18 | 0.35 | 38 | 0.35 |
| 19 | 0.35 | 39 | 0.35 |
| 20 | 0.35 | 40 | 0.35 |
Noise level (dBA) of equipment in 1/1 octave band
| Equipment | 63 Hz | 125 Hz | 250 Hz | 500 Hz | 1,000 Hz | 2,000 Hz | 4,000 Hz | 8,000 Hz |
|---|---|---|---|---|---|---|---|---|
| Open mill [72] | 82 | 91 | 96 | 95 | 92 | 80 | 75 | 66 |
| Mechanical press [73] | 95 | 99 | 105 | 107 | 110 | 117 | 115 | 110 |
| Internal mixer [72] | 84 | 87 | 88 | 91 | 90 | 81 | 72 | 62 |
| Chiller [74] | 80 | 86 | 88 | 92 | 86 | 80 | 74 | 62 |
| Extruder [72] | 92 | 93 | 94 | 91 | 92 | 88 | 83 | 78 |
| Cutting machine [75] | 72.1 | 71.4 | 72.0 | 70.9 | 68.8 | 68.4 | 68.5 | 66.9 |
| Axial flow fan [76] | 86 | 77 | 87 | 95 | 98 | 98 | 92 | 86 |
| Compressor [77] | 106.5 | 112 | 108 | 90 | 86 | 81 | 80.5 | 72.5 |
| Lathe [78] | 71.9 | 67.4 | 70.9 | 78 | 85.2 | 83.4 | 72.4 | 64 |
| Grinding machine [79] | 85 | 88 | 90 | 100 | 87 | 80 | 85 | 80 |
| Press-fitting machine [80] | 85.4 | 84.9 | 85.8 | 85.9 | 85.6 | 85.4 | 86.2 | 86.1 |
| CNC [81] | 60 | 68 | 78 | 78 | 85 | 81 | 78 | 75 |
| Bridge crane [82] | 75 | 80 | 95 | 110 | 92 | 115 | 108 | 80 |
| Glue pump [83] | 60 | 61 | 63 | 63 | 66 | 63 | 59 | 56 |
| buffing machine [75] | 78.7 | 77.4 | 77.0 | 77.5 | 81.4 | 79.2 | 76.9 | 75.1 |
| Kiln [84] | 93 | 94 | 96 | 99 | 93 | 92 | 94 | 83 |
| Finishing machine [85] | 62.2 | 70.5 | 73.5 | 78.9 | 83.2 | 85.5 | 90.5 | 88.6 |
| Milling machine [86] | 93 | 94 | 96 | 99 | 93 | 92 | 94 | 83 |
| Drille [87] | 93 | 94 | 96 | 99 | 93 | 92 | 94 | 83 |
| Cold sawing machine [88] | 80 | 83 | 94 | 104 | 110 | 106 | 100 | 91 |
| Refrigerating machine [89] | 71 | 75 | 75 | 80 | 86 | 94 | 100 | 95 |
| Crusher [90] | 65 | 68 | 69 | 111 | 118 | 99 | 90 | 78 |
| Water pump [83] | 88 | 89 | 91 | 91 | 94 | 91 | 87 | 81 |
| Generator [91] | 90 | 91 | 91 | 91 | 89 | 87 | 84 | 79 |
Sound power level of equipment
| Equipment | PWL (dBA) | Equipment | PWL (dBA) |
|---|---|---|---|
| Roll forming machine | 96 [72] | Research and matching press | 90 [55] |
| Perforating machine | 80 [92] | Radial drilling machine | 86 [93] |
| Sealing strip flocking machine | 80 [94] | Mold cleaning machine | 106 [95] |
| Injection molding machine | 84 [96] | Forklift | 93 [97] |
| Dryer | 85.5 [98] | CO2 arc welding machine | 81 [99] |
| Riveting machine | 90 [100] | Stud welding machine | 85 [101] |
| Spot welding machine | 89.9 [102] | Air hoist | 96 [103] |
| Welding robots | 80 [104] | Riveting robot | 80 [105] |
| Spot welding robot | 91 [101] | Glue dispensing robot | 80 [105] |
| Laser welding machine | 101.2 [106] | Roller hemming robot | 78 [107] |
| Glue spraying cabinet | 99.8 [108] | Robotic stud welding | 70 [109] |
| Foaming machine | 80 [110] | Car interior line | 71 [111] |
| Punching machine | 80 [112] | Car chassis line | 81 [111] |
| Thermoforming machine | 86 [113] | Car exterior assembly line | 81 [111] |
| Glue spray machine | 91 [114] | Instrument subassembly line | 81 [111] |
| Ultrasonic welder | 75 [99] | Powertrain production area | 81 [111] |
| Friction welding machine | 86 [115] | Door subassembly | 81 [111] |
| Flame treatment machine | 80 [115] | Test line | 71 [111] |
| Ultrasonic washer | 98 [116] | Spray booth | 85 [117] |
| Glue coating machine | 88 [118] | Spraying robot | 75 [119] |
| Engine heat test bench | 97.5 [54] | Painting robot | 85 [115] |
| Roller machine | 101 [64] | Charge and discharge tester | 70 [120] |
| Rectifier welding machines | 87 [121] | Transfer robot | 80 [122] |
| Pedestal grinder | 91 [123] | Uncoiler | 90 [124] |
| Crop Shear | 90.5 [98] | Nitrogen generator | 84 [60] |
| Welding machine | 82.7 [98] | Wire-cutting machines | 91 [125] |
| Roll coater | 85 [126] | Electrical discharge machining | 86 [125] |
| Stretching straightener | 102.7 [106] | Plate shear | 84 [121] |
| Coiler | 81.8 [127] | Packaging machine | 91 [65] |
| Furnace anneal | 81.7 [128] | Panel turnover machine | 80 [129] |
| Tightening machine | 80 [130] | Temper mill | 90.2 [127] |
| Heating furnace | 75 [60] | Straightening machine | 88 [131] |
| Leveling machine | 80 [132] | Coating machine | 93 [133] |
| Oil press | 90 [60] | Assembly machine | 70 [134] |
| Cutting machine | 79.7 [135] | Industrial inkjet printer | 75 [136] |
| Bending machine | 94 [137] | Ring cutting machine | 85 [138] |
| Bench drill machine | 85 [139] | Dicing machine | 88 [140] |
| Double head saws | 85 [59] | Automatic welding machine | 86 [68] |
| Welding robot | 70 [141] | Automatic bonding machine | 81 [68] |
| Hydraulic press | 100.9 [142] | Automatic module mounting machine | 76 [68] |
| Hydraulic pipe bender | 81 [59] | Automated assembly machine | 81 [68] |
| Shearing machine | 107 [143] | Automatic packaging machine | 81 [68] |
| Automatic pipe cutting machine | 83 [121] | Rotor assembly line | 70 [70] |
| Double head multi boring machine | 91 [59] | Stator assembly line | 70 [70] |
| TIG welding | 88.6 [59] | Motor assembly Line | 70 [70] |
| 3D laser cutting machine | 81 [60] | Gearbox assembly line | 70 [70] |
| OTC robotic arm | 96 [60] | Final assembly line | 70 [70] |
| Cooler | 88 [60] | Rubber filter machine | 80 [144] |
| Frequency (Hz) | 63 | 125 | 250 | 500 | 1,000 | 2,000 | 4,000 |
|---|---|---|---|---|---|---|---|
|
|
10 | 13 | 15 | 14 | 17 | 21 | 24 |
Environmental noise limit [25]
| Functional area | Coverage | Noise limit | |
|---|---|---|---|
| Daytime (dBA) | Night (dBA) | ||
| Category 1 | Residential, nature reserve, school, administrative, hospital | 55 | 45 |
| Category 2 | Commercial, market | 60 | 50 |
| Category 3 | Warehousing, industry | 65 | 55 |
| Category 4a | Areas on both side of traffic artery | 70 | 55 |
| Category 4b | 70 | 60 | |
Proportion of the low-frequency industrial noise during (a) daytime and (b) nighttime.
References
[1] World Bank Open Data. The World Bank. Available from: https://www.worldbank.org/en/home. Search in Google Scholar
[2] Asamoah BC, Kwabla AG. Industrial noise pollution and its effects on the hearing capabilities of workers: A study from saw mills, printing presses and corn mills. Afr J Health Sci. 2004;11(1):55–60. 10.4314/ajhs.v11i1.30778Search in Google Scholar
[3] Eleftheriou PC. Industrial noise and its effects on human hearing. Appl Acoustics. 2002;63(1):35–42. 10.1016/S0003-682X(01)00022-6Search in Google Scholar
[4] Zare S, Nassiri P, Monazzam MR, Pourbakht A, Azam K, Golmohammadi T. Evaluation of Distortion Product Otoacoustic Emissions (DPOAEs) among workers at an Industrial Company exposed to different industrial noise levels in 2014. Electronic Phys. 2015;7(3):1126. Search in Google Scholar
[5] Gupta A, Gupta A, Jain K, Gupta S. Noise Pollution and Impact on Children Health. Indian J Pediatrics. 2018;85(4):300–6. 10.1007/s12098-017-2579-7Search in Google Scholar PubMed
[6] Zeydabadi A, Askari J, Vakili M, Mirmohammadi SJ, Ghovveh MA, Mehrparvar AH. The effect of industrial noise exposure on attention, reaction time, and memory. Int Archives Occupat Environ Health. 2019;92(1):111–6. 10.1007/s00420-018-1361-0Search in Google Scholar PubMed
[7] Nissenbaum MA, Aramini JJ, Hanning CD. Effects of industrial wind turbine noise on sleep and health. Noise Health. 2012;14(60):237–43. 10.4103/1463-1741.102961Search in Google Scholar PubMed
[8] Test T, Canfi A, Eyal A, Shoam-Vardi I, Sheiner EK. The influence of hearing impairment on sleep quality among workers exposed to harmful noise. SLEEP. 2011;34(1):25–30. 10.1093/sleep/34.1.25Search in Google Scholar PubMed PubMed Central
[9] Beutel ME, Braehler E, Ernst M, Klein E, Reiner I, Wiltink J, et al. Noise annoyance predicts symptoms of depression, anxiety and sleep disturbance 5 years later. Findings from the Gutenberg Health Study. Europ J Public Health. 2020;30(3):516–21. 10.1093/eurpub/ckaa015Search in Google Scholar PubMed
[10] Esmaielpour MRM, Zakerian SA, Abbasi M, Ábbasi Balochkhaneh F, Kordmiri SHM. Investigating the effect of noise exposure on mental disorders and the work ability index among industrial workers. Noise Vibrat Worldwide. 2022;53(1–2):3–11. 10.1177/09574565211052690Search in Google Scholar
[11] Fallah Madvari R, Tahmasbi Abdar F, Halvani GH, Sefidkar R, Mohammadi M, Sojoudi S, et al. Correlation between noise exposure and mental health components among Iranian steel workers, 2021. J Occupat Health Epidemiol. 2022;11(2):148–56. 10.52547/johe.11.2.148Search in Google Scholar
[12] Bozkurt TS, Demirkale SY. The field study and numerical simulation of industrial noise mapping. J Build Eng. 2017;9(1):60–75. 10.1016/j.jobe.2016.11.007Search in Google Scholar
[13] Lokhande SK, Dhawale SA, Pathak SS, Gautam R, Jain MC, Bodhe GL. Appraisal of noise level dissemination surrounding mining and industrial areas of Keonjhar, Odisha: a comprehensive approach using noise mapping. Archiv Acoustics. 2017;42(3):423–32. 10.1515/aoa-2017-0044Search in Google Scholar
[14] Moravec M, Badida M, Mikusova N, Sobotova L, Svajlenka J, Dzuro T. Proposed options for noise reduction from a wastewater treatment plant: case study. Sustainability. 2021;13(4):2409. 10.3390/su13042409Search in Google Scholar
[15] Thien CT, Quoc HN, Nguyen AT, Tran M. In: Analysis and Prediction of Noise Pollution from Wind Turbines: A Case Study of Loi Hai Wind Power Plant (Ninh Thuan, Vietnam.) Nguyen AT, Hens L, editors. Cham: Springer International Publishing; 2022. p. 805–16. 10.1007/978-3-030-81443-4_51Search in Google Scholar
[16] Raina AK, Soni AK, Vajre R, Sangode AG. Impact of topography on attenuation of noise from a cement plant in a hilly terrain. Sci Total Environ. 2022;835(8):155532. 10.1016/j.scitotenv.2022.155532Search in Google Scholar PubMed
[17] del Mar Durán del Amor M, Caracena AB, Llorens M, Esquembre F. Tools for evaluation and prediction of industrial noise sources. Application to a wastewater treatment plant. J Environ Manag. 2022;319(10):115725. 10.1016/j.jenvman.2022.115725Search in Google Scholar PubMed
[18] Deaconu M, Cican G. Turbojet test cell and noise impact assessment in the vicinity of Romanian research and development institute for gas turbines COMOTI. Acoustics Australia. 2018;46(2):249–57. 10.1007/s40857-018-0134-ySearch in Google Scholar
[19] Ko JH, Chang SI, Lee BC. Noise impact assessment by utilizing noise map and GIS: A case study in the city of Chungju, Republic of Korea. Appl Acoustics. 2011;72(8):544–50. 10.1016/j.apacoust.2010.09.002Search in Google Scholar
[20] Wosniacki GG, Zannin PHT. Framework to manage railway noise exposure in Brazil based on field measurements and strategic noise mapping at the local level. Sci Total Environ. 2021;757(2):143721. 10.1016/j.scitotenv.2020.143721Search in Google Scholar PubMed
[21] Paschalidou AK, Kassomenos P, Chonianaki F. Strategic Noise Maps and Action Plans for the reduction of population exposure in a Mediterranean port city. Sci Total Environ. 2019;654(3):144–53. 10.1016/j.scitotenv.2018.11.048Search in Google Scholar PubMed
[22] Licitra G, Bolognese M, Chiari C, Carpita S, Fredianelli L. Noise source predominance map: a new representation for strategic noise maps. Noise Mapping. 2022;9(1):269–79. 10.1515/noise-2022-0163Search in Google Scholar
[23] Panyu Auto City; 2023. Available from: http://www.panyu.gov.cn/fzzs/zsxm/content/post8882482.html. Search in Google Scholar
[24] Guangzhou Climate Bulletin in 2022. Guangzhou Meteorology; 2023. Available from: http://www.tqyb.com.cn/gz/climaticprediction/bulletin/2023-03-01/11752.html. Search in Google Scholar
[25] Standard of Acoustic Environmental Quality (GB3096-2008); 2008. Ministry of Environmental Protection of the People’s Republic of China. Search in Google Scholar
[26] Meteorological data. Available from: http://gd.cma.gov.cn/gzsqxj/. Search in Google Scholar
[27] Emission standard for industrial enterprises noise at boundary(GB12348-2008). Ministry of Environmental Protection of the People’s Republic of China. Search in Google Scholar
[28] Wang L, Geng M, Bai X, Ma J, Zhao Y, Shen C, et al. Urban 110ÂăkV indoor substation noise analysis and control schemes: A real case study. Appl Acoustics. 2021;183(12):108290. 10.1016/j.apacoust.2021.108290Search in Google Scholar
[29] Silva LT, Magalães A, Silva JF, Fonseca F. Impacts of low-frequency noise from industrial sources in residential areas. Appl Acoustics. 2021;182(11):108203. 10.1016/j.apacoust.2021.108203Search in Google Scholar
[30] Hodgson M. Review and critique of existing simplified models for predicting factory noise levels. Canadian Acoustics. 1991;19(1):15–23. Search in Google Scholar
[31] Code for design of machinery building architecture; 2011. Ministry of Housing and Urban-Rural Development of the People’s Republic of China. Search in Google Scholar
[32] CadnaA Reference Manual(Version 2020 MR2). 2020. Company Germany: Datakustik. Search in Google Scholar
[33] Xie J, Zhu L, Lee HM. Novel methodologies for the development of large-scale airport noise map. Sustainability. 2022;14(11):6573. 10.3390/su14116573Search in Google Scholar
[34] Street View Mode. Baidu Map. Available from: https://map.baidu.com/@12634306.489999998,2620562.68,21z,87t,-62.33h#panoid=01004800001401141441579245D&panotype=street&heading=62.31&pitch=0&l=13. Search in Google Scholar
[35] Good practice guide for strategic noise mappping and the production of associated data on noise exposure. European Commission Working Group Assessment of Exposure to Noise; 2003. WG-WEN 004.2007. Search in Google Scholar
[36] Overview of Hualong Town. Guangzhou Panyu District People’s Government. Available from: http://www.panyu.gov.cn/jgzy/zzfjdbsc/fzqhlzrmzf/zjgk/. Search in Google Scholar
[37] Overview of Shilou Town. Guangzhou Panyu District People’s Government. Available from: http://www.panyu.gov.cn/jgzy/zzfjdbsc/fzqslzrmzf/zjgk/. Search in Google Scholar
[38] Zannin PHT, Engel MS, Fiedler PEK, Bunn F. Characterization of environmental noise based on noise measurements, noise mapping and interviews: A case study at a university campus in Brazil. Cities. 2013;31(4):317–27. 10.1016/j.cities.2012.09.008Search in Google Scholar
[39] Fiedler PEK, Zannin PHT. Evaluation of noise pollution in urban traffic hubs-Noise maps and measurements. Environ Impact Assessment Rev. 2015;51(2):1–9. 10.1016/j.eiar.2014.09.014Search in Google Scholar
[40] Bastián-Monarca NA, Suárez E, Arenas JP. Assessment of methods for simplified traffic noise mapping of small cities: Casework of the city of Valdivia, Chile. Sci Total Environ. 2016;550(4):439–48. 10.1016/j.scitotenv.2016.01.139Search in Google Scholar PubMed
[41] Electroacoustics-Sound Level Meters-Part 1: Specifications(GB/T 3785.1); 2010. Standardization Administration of the Peopleas Republic of China. Search in Google Scholar
[42] Electroacoustics-Sound Calibrators (GB/T 15173-2010); 2010. Standardization Administration of the Peopleas Republic of China. Search in Google Scholar
[43] Technical Standard for Expressway Engineering (JTG B01-2014); 2014. Ministry of Transport of the People’s Republic of China. Search in Google Scholar
[44] Test Equipment for Vehicle Speed Radar Measurement Meters(JJG 771); 2010. General Administration of Quality Supervision, Inspection and Quarantine of the People’s Republic of China. Search in Google Scholar
[45] Noise abatement and control. the US Department of Housing and Urban Development; 2015. Search in Google Scholar
[46] Berglund B, Lindvall T, Schwela DH. Guidelines for community noise. Geneva, Switzerland: World Health Organization; 1999. Search in Google Scholar
[47] Baliatsas C, van Kamp I, van Poll R, Yzermans J. Health effects from low-frequency noise and infrasound in the general population: Is it time to listen? A systematic review of observational studies. Sci Total Environ. 2016;557–558:163–9. 10.1016/j.scitotenv.2016.03.065Search in Google Scholar PubMed
[48] Waye KP, Bengtsson J, Kjellberg A, Benton S. Low frequency noise pollution interferes with performance. Noise Health. 2001;4(13):33–49. Search in Google Scholar
[49] Ascari E, Licitra G, Teti L, Cerchiai M. Low frequency noise impact from road traffic according to different noise prediction methods. Sci Total Environ. 2015;505:658–69. 10.1016/j.scitotenv.2014.10.052Search in Google Scholar PubMed
[50] Murphy E, King EA. An assessment of residential exposure to environmental noise at a shipping port. Environ Int. 2014;63(2):207–15. 10.1016/j.envint.2013.11.001Search in Google Scholar PubMed
[51] Environmental Protection Acceptance for the Completion of the Construction Project of 50 Million Metres of Automotive Seals (Phase I) of Shenya Seals (Guangzhou) Co. Ltd. Guangzhou Panyu District Environmental Monitoring Station; 2016. Search in Google Scholar
[52] Approval of the Environmental Impact Report on the Construction Project of Adding 500,000 Skeletons/Year by Guangzhou Andauto Automotive Seating Co.; 2020. Guangzhou Eco-environment Bureau. Available from: http://www.panyu.gov.cn/attachment/6/6728/6728194/6956762.pdf. Search in Google Scholar
[53] Environmental Impact Report on the Construction Project of Panyu Base of Yanfeng Automotive Trim Systems Guangzhou Co. Ltd. Guangzhou Panyu Environmental Science Institute; 2015. Search in Google Scholar
[54] Environmental impact Reporting Form of engine phase III production line transformation project of Guangzhou Qisheng Powertrain Co. Ltd. Guangzhou Yuehuan Environmental Protection Technology Co. Ltd; 2021. Search in Google Scholar
[55] Environmental Impact Reporting Form for the Capacity Expansion Project of Additional 200,000 Vehicles/Year for Passenger Cars under Own Brand of Guangzhou Automobile Co. Ltd. Guangdong Environmental Protection Engineering Research And Design Institute Co. Ltd; 2017. Search in Google Scholar
[56] Environmental Impact Report on the Construction Project of Ansteel Guangzhou High Strength Hot-Dip Galvanised Line Project. South China Institute of Environmental Science; 2015. Search in Google Scholar
[57] Approval of the Environmental Impact Reporting Form on the Construction of 310,000 Pieces of Automotive Parts and Components Per Year by Nantong Jialong Plastic Co. Ltd; 2021. Guangzhou Eco-environment Bureau. http://www.panyu.gov.cn/attachment/6/6750/6750645/7150958.pdf. Search in Google Scholar
[58] Environmental Impact Reporting Form for the Construction Project with Annual Production Capacity of 470,000 Pieces of Automobile Door Frame and 470,000 Pieces of Glass Rail of Guangzhou Jingle Auto Parts Co. Ltd. Ministry of Ecology and Environment of the Peopleas Republic of China; 2018. Search in Google Scholar
[59] Environmental Impact Reporting Form for the Construction Project of Guangzhou Junguo Auto Parts Co. Ltd. Ministry of Ecology and Environment of the People’s Republic of China; 2017. Search in Google Scholar
[60] Environmental Impact Statement for Guangzhou RD Centre Construction Project of LUCKY HARVEST CO., LTD. Panyu Environmental Engineering Co, Ltd; 2017. Search in Google Scholar
[61] Summary of partial bidding announcement information for the fourth quarter of 2021; 2021. Panyu District Housing and Urban-Rural Development Bureau. Available from: http://www.panyu.gov.cn/ztzx/qmtjzwgkh/gkzyjyly/content/post7982133.html. Search in Google Scholar
[62] Environmental Impact Reporting Form for the Construction Project of Annual Production of 800,000 Sets of Auto Parts of Guangzhou Juzhi Auto Parts Co. Ltd. Ministry of Ecology and Environment of the Peopleas Republic of China; 2017. Search in Google Scholar
[63] Environmental Impact Reporting Form for the Construction Project with Annual Output of 300,000 Sets of Auto Parts of Guangzhou Yulong Auto Parts Co. Ltd.Guangzhou Panyu Environmental Science Institute; 2017. Search in Google Scholar
[64] Environmental Assessment Reporting Form for Renewable Resources Recycling and Utilisation Construction Project of Guangzhou Guangqi Trading Renewable Resources Co. Ltd. Beihai Bilan Marine Environmental Protection Service Co. Ltd; 2014. Search in Google Scholar
[65] Environmental Impact Reporting Foam for Phase I Expansion Project of Guangzhou Guangqi Baoshang Steel Processing Co., LTD. Guangzhou Panyu Environmental Science Institute; 2017. Search in Google Scholar
[66] Environmental Impact Reporting Form for the Phase II Expansion Project of Guangzhou Guangzhou Diyuan Die and Stamping Co. Ltd. Guangzhou Panyu Environmental Science Institute; 2017. Search in Google Scholar
[67] Environmental Impact Reporting Form for Jinan Findreams Annual Production Capacity of 15Gwh Power Battery and Supporting Production Project Phase II Construction Project. Ministry of Ecology and Environment of the Peopleas Republic of China; 2022. Search in Google Scholar
[68] Environmental Impact Reporting Form for the Construction Project of IGBT Packaging and Testing Project of Guangzhou Qinglan Semiconductor Co. Ltd. Ministry of Ecology and Environment of the People’s Republic of China; 2022. Search in Google Scholar
[69] Approval of the Environmental Impact Report on Yanfeng Plastic Omnium Automotive Exterior Systems Co. Ltd, with an Annual Output of 600,000 Sets of Automotive Exterior Trim Products and 50,000 Sets of Tailgate Construction Project; 2021. Guangzhou Eco-environment Bureau. Search in Google Scholar
[70] Environmental Impact Reporting Form on the Construction Project of PT1 Production Line of Automotive Drive Systems Co. Ltd. Guangzhou Chiqi Environmental Protection Technology Co. Ltd; 2021. Search in Google Scholar
[71] Annual production capacity of 400,000 sets of automatic gearboxes environmental assessment report public notice. Foshan Environmental Engineering and Equipment Co. Ltd; 2019. Search in Google Scholar
[72] Jiang Y, Wang W, Zhang L. The noise of rubber industry and management way(I). Rubber Industrial Design. 1984;1:34–40. Search in Google Scholar
[73] Zhao S, Shi W. Mechanism of noise generation and its characterization in mechanical press. Noise Vibration Control. 1996;6(12):36–9. Search in Google Scholar
[74] Wang Q. Structural design and noise reduction performance of combined sound barriers in noise management of air-cooled chillers. J Hubei Univ Educat. 2017;34(8):16–20. Search in Google Scholar
[75] Wang X, Zhong X, Qiu H, Guan Y, Xiang Y, Zhou W, et al. Noise spectrum characteristics in workplaces of stone processing industry in Shenzhen. Occupat Health Emergency Rescue. 2022;40(2):53–6. Search in Google Scholar
[76] Zhi N, Xiao B.The control technology of Wind turbine noise. 1st ed. Beijing: China Machine Press; 1985. Search in Google Scholar
[77] Zhou J, Zhao J, Li P. Noise pollution and control measures of rubber factory compressor room. In: 2009 Third International Symposium on Intelligent Information Technology Application Workshops; 2009 Nov 21–22. China.Nanchang: DEStech Publications; 2009. p. 241–2. 10.1109/IITAW.2009.35Search in Google Scholar
[78] Li J. Frequency analysis of C6240F lathe noise. Plant Maintenance Eng. 1985;5(10):16–23. Search in Google Scholar
[79] Haruna A, Agu MN. Grinding machine Noise spectra in Kaduna metropolis, Nigeria. J Environ Issues Agricult Develop Countries. 2011;3(1):157–64. Search in Google Scholar
[80] Draghici A. Noise control for pressing machines. Man-machine characterization. Archives Acoustics. 2004;29(2):155–67. Search in Google Scholar
[81] Sinay J, Balazikova M, Dulebova M, Markulik S, Kotianova Z. Measurement of low-frequency noise during CNC machining and its assessment. Measurement. 2018;119(4):190–5. 10.1016/j.measurement.2018.02.004Search in Google Scholar
[82] Zhang J, Lin T, Liu W, Yang Y. Dynamic characteristics analysis and structural Noise prediction of bridge crane. In: 2016 International Conference on Advanced Manufacture Technology and Industrial Application (AMTIA 2016); 2016 Sep 25. China.Shanghai: DEStech Publications; 2016. p. 234–8. Search in Google Scholar
[83] Bies DA, Hansen CH. Engineering noise control: theory and practice. 3rd ed. Florida, The United States of America: CRC Press; 2009. Search in Google Scholar
[84] Koonsman GL. Reducing machinery Noise in cement plants. IEEE Trans Industry General Appl. 1970;IGA-6(5):476–9. 10.1109/TIGA.1970.4181218Search in Google Scholar
[85] Kroening A. Reducing noise exposures produced by vibratory finishing machines. Montana Tech of the University of Montana; 2016. Search in Google Scholar
[86] Luo L, Wang J, Xu Y, Liu R. The main noise sources of X62W milling machine and the noise reduction analysis. J Nanchang Univ (Eng Technol Edn). 1985;3:91–7. Search in Google Scholar
[87] Sakae MM, Takashi SS. Dictionary of Noise Terms. Beijing, China: China Metrology Publishing House; 1990. Search in Google Scholar
[88] Shiii A, Han X, Cheng X. Noise control technology and its application on cold saw machine in steel factory. In: Yao L, editor. 2009 Academic Conference on Acoustics in Four Provinces and One City of Zhejiang, Jiangsu, Heilongjiang, Shandong, and Tianjin; 2009 Aug 21. China. Jinan: Technical Acoustics; 2009. p. 160–2. Search in Google Scholar
[89] Zhu M. Research on Noise of Air Conditioning Equipment in Textile Mill. Noise Vibrat Control. 1986;000(6):19–26. Search in Google Scholar
[90] Lv R, Gao Y. Noise reduction of powder Muller. Acta Acustica. 1979;4(8):182–7. Search in Google Scholar
[91] Li S. Study on the Diesel Generator Noise Control. Acta Sci Naturalium Universit Sunyatseni. 1996;4(8):55–7. Search in Google Scholar
[92] The sound insulation treatment of automatic Perforating machine; 2022. Shenzhen Xunanda Automation Equipment Co. Ltd. Available from: https://www.xundaa.com/companynews/347.html. Search in Google Scholar
[93] Environmental Impact Reporting Form for the Project with an Annual Production Capacity of 80 Units of Waste Pre-treatment Equipment. Department of Ecology and Environment of Jiangsu Province; 2020. Search in Google Scholar
[94] Environmental Impact Reporting Form for Home Textiles Project with an Annual Production Capacity of 46 Million Metres. Zhejiang Environmental Technology Co. Ltd; 2021. Search in Google Scholar
[95] Wang J. Noise control of car body stamping workshop in planning process. Automobile Parts. 2015;2(2):3. Search in Google Scholar
[96] Zhang Y. Design of reducing hydraulic system Noise of SZ-400/1600 injection molding machine. Hydraulics Pneumatics Seals. 1990;1(4):52–6. Search in Google Scholar
[97] Owoyemi MJ, Falemara B, Owoyemi AJ. Noise pollution and control in wood mechanical processing wood industries. Preprints. 2016 August. 10.20944/preprints201608.0236.v1Search in Google Scholar
[98] Yu D, Yu H, Fu W, Zhao X, Xing H. Analysis of identification of occupational hazards and control of critical parts of hot-dip galvanising production line for cold rolled sheets. Industr Health Occupat Diseases. 2007;33(4):244–6. Search in Google Scholar
[99] Environmental Impact Reporting Form for the Construction Project of New Energy Environmental Protection and Sanitation Equipment Production Project. Ministry of Ecology and Environment of the People’s Republic of China; 2021. Search in Google Scholar
[100] Hydraulic eiveting machine(JB/T 9966-2015); 2015. Ministry of Industry and Information Technology. Search in Google Scholar
[101] Environmental Impact Reporting Form for the Construction Project of Welding and Assembly Workshop and Corridor with an Annual Production Capacity of 100,000 Passenger Cars at Baoji Geely Auto Parts Co. Ltd. Ministry of Ecology and Environment of the People’s Republic of China; 2022. Search in Google Scholar
[102] Ning K, Qu C, Dai X, Fang L. Evaluation of occupational disease hazard control effect of a technical reform project of an automobile manufacturing plant. Chin J Public Health Eng. 2019;18(1):5. Search in Google Scholar
[103] Enterprise Product Standards of Tianjin Ruifen Electromechanical Development Co. Ltd(Q/12HD3809-2017); 2017. Tianjin Ruifen Electromechanical Development Co. Ltd. Search in Google Scholar
[104] Environmental impact Reporting Form on the Annual Output of 550,000 Sets of Automobile Seats Technical Reform Project of Wuhu Adient Yunhe Automobile Seat Co. Ltd. Anhui Haizhi Botian Environmental Protection Technology Co. Ltd; 2021. Search in Google Scholar
[105] Environmental Impact Reporting Form for Hunan University’s New Construction Project of Lightweight Design, Manufacturing and Demonstration Application of Automotive Structures. Ministry of Ecology and Environment of the People’s Republic of China; 2023. Search in Google Scholar
[106] Mo G. Analysis of identification and control of occupational disease hazards in cold rolled coil production line. Liuzhou Med. 2013;26(1):26–9. Search in Google Scholar
[107] Environmental Impact Reporting Form for the Construction Project of Xiajin County Auto Parts Intelligent Manufacturing Industrial Park. Ministry of Ecology and Environment of the People’s Republic of China; 2021. Search in Google Scholar
[108] Environmental Impact Reporting Form for the Construction Project of Newly Built Automotive Interior Cladding Parts Production Project. Ministry of Ecology and Environment of the People’s Republic of China; 2022. Search in Google Scholar
[109] Environmental Impact Reporting Form for the Construction Project of Logistics Automation Equipment Renovation Project. Ministry of Ecology and Environment of the People’s Republic of China; 2022. Search in Google Scholar
[110] Environmental Impact Reporting Form for the Project of Processing and Manufacturing of Assisted Vehicle Parts and Components of Tianjin Jia Ruida Technology Co. Ltd. Ministry of Ecology and Environment of the People’s Republic of China; 2023. Search in Google Scholar
[111] Environmental Impact Report on Construction Project with Annual Production Capacity of 120,000 Pure Electric Passenger Cars of Qoros Automotive Co. Ltd. Shaanxi Qike Environmental Technology Co. Ltd; 2020. Search in Google Scholar
[112] Environmental Impact Reporting Form for Construction Project of New Auto Parts, Moulds and Plastic Products of Taicang Yuanfu Auto Parts Co. Ltd. Ministry of Ecology and Environment of the People’s Republic of China; 2023. Search in Google Scholar
[113] Environmental Impact Reporting Form for Weile Sports Goods Production Project. Ministry of Ecology and Environment of the People’s Republic of China; 2022. Search in Google Scholar
[114] Environmental Impact Reporting Form for High-end Footwear and Clothing Products Production Line Construction Project. Ministry of Ecology and Environment of the People’s Republic of China; 2023. Search in Google Scholar
[115] Environmental Impact Reporting Form for the Construction Project of New Annual Production Capacity of 600,000 Vehicle Interior Trim Parts Supporting Project. Ministry of Ecology and Environment of the Peopleas Republic of China; 2022. Search in Google Scholar
[116] High pressure cleaning unit(GB/T 26135-2010); 2010. Standardization Administration of the People’s Republic of China. Search in Google Scholar
[117] Spray booth (JBT 10413-2005); 2005. National Development and Reform Commission. Search in Google Scholar
[118] Gao J, Yu Z, Zhang S. Noise pollution of man-made board machinery and its control technology. China Wood-Based Panels. 2005;12(12):17–9. Search in Google Scholar
[119] Environmental Impact Report Form for the Project of Annual Production of 20,000 Tons of Supporting Components for Theo Elevator and Research and Development of Stereo Intelligent Parking Garage. Hangzhou Pingyun Environmental Protection Technology Co. Ltd; 2020. Search in Google Scholar
[120] Environmental Impact Reporting Form for 2GW All-Vanadium Liquid Current Battery Production Line (Phase I) Construction Project. Ministry of Ecology and Environment of the Peopleas Republic of China; 2023. Search in Google Scholar
[121] Environmental Impact Reporting Form for the Construction Project of Plastic Parts and Medical Stretchers Manufacturing Project. Ministry of Ecology and Environment of the People’s Republic of China; 2023. Search in Google Scholar
[122] Environmental Impact Reporting Form for Xiamen Jiayu Industrial Park (Annual Output of 1 Million Intelligent Toilet Production Line) Construction Project. Department of Ecology and Environment of Fujian Province; 2019. Search in Google Scholar
[123] Grinding machine Technical conditions for safety protection(JB 8799-2008); 2008. State Administration of Machinery Industry. Search in Google Scholar
[124] Environmental Impact Reporting Form on Construction Project of Metal Pipe Structure Manufacturing Project of Xinjin Dongxin Yisheng Company. Ministry of Ecology and Environment of the People’s Republic of China; 2023. Search in Google Scholar
[125] Environmental Impact Statement for Mould Manufacturing Project of Tianjin Ningyuanzhi Mould CO., LTD. Zhongsheng Huayuan (Beijing) Environmental Technology Co. Ltd; 2018. Search in Google Scholar
[126] Environmental Impact Reporting Form for Customised Furniture Manufacturing Project. Ministry of Ecology and Environment of the People’s Republic of China; 2022. Search in Google Scholar
[127] When Z, Pan Z, Xiao J. Evaluation on control effect of occupational hazards in transforming project of cold rolled high strength steel in Benxi Iron and Steel(Group)Co. LTD. Occupation Health. 2021;37(2):156–9. Search in Google Scholar
[128] Environmental Impact Reporting Form for the Construction Project of 5,000 tonnes per annum Fully Automatic High Precision and Fast Alloy Steel Bar Roll Billet Production Line Project. Ministry of Ecology and Environment of the Peopleas Republic of China; 2016. Search in Google Scholar
[129] Environmental Impact Reporting Form for the Annual Output of 1.2 Million m2 Multilayer Electronic Circuit Board Production Project of Hunan Gordon Electronics Co. Ltd. Hunan Mucheng Ecological Environment Engineering Co. Ltd; 2020. Search in Google Scholar
[130] Environmental Impact Reporting Form for New Energy Vehicle Key Components Manufacturing and Engineering Centre Project of JWD Automotive Technology Co. Ltd. Ministry of Ecology and Environment of the People’s Republic of China; 2023. Search in Google Scholar
[131] Environmental Impact Reporting Form for the Project with an Annual Capacity of 38,800 Tonnes of Precision Seamless Steel Tubes and Pipes. Ministry of Ecology and Environment of the Peopleas Republic of China; 2020. Search in Google Scholar
[132] Environmental Impact Reporting Form for Construction Project with Annual Production Capacity of 5,000 Tonnes of Two-wave Guardrail Plates and Ancillary Facilities. Ministry of Ecology and Environment of the Peopleas Republic of China; 2018. Search in Google Scholar
[133] Printing machinery-Metal sheet coating machine(JB/T 12375-2015). Ministry of Industry and Information Technology of the People’s Republic of China. Search in Google Scholar
[134] Environmental Impact Reporting Form for the Construction Project of Electronic Components with an Annual Production Capacity of 500,000 Pieces. Ministry of Ecology and Environment of the Peopleas Republic of China; 2023. Search in Google Scholar
[135] Environmental Impact Reporting Form for Plastic Packaging Products Project. Department of Ecology and Environment of Jiangsu Province; 2020. Search in Google Scholar
[136] Environmental Impact Reporting Form for Decorative Gypsum Board and Light Steel Keel Reconstruction and Expansion Project. Ministry of Ecology and Environment of the People’s Republic of China; 2023. Search in Google Scholar
[137] CNC bending machine WC67K-200T/4000. Haian Hongli Machine Co. Ltd. Available from: https://product.11467.com/info/2602404.htm. Search in Google Scholar
[138] Environmental protection acceptance report on the completion of the newly-built project with an annual output of 15,000 tonnes of polyurethane foam materials and products. Changzhou Jiake Environmental Protection Technology Consulting Co. Ltd; 2019. Search in Google Scholar
[139] Environmental Impact Reporting Form for the Construction Project of the Expansion of Automotive Interior Trims and Other Products Project. Ministry of Ecology and Environment of the People’s Republic of China; 2022. Search in Google Scholar
[140] Environmental Impact Reporting Form for Microwave/Millimetre Wave RF Chip Microsystem Development and Pilot Project. Ministry of Ecology and Environment of the People’s Republic of China; 2023. Search in Google Scholar
[141] Environmental Impact Report Form for the Project with an Annual Production Capacity of 5,600 Sets of Turbine Fittings. Ministry of Ecology and Environment of the Peopleas Republic of China; 2020. Search in Google Scholar
[142] Chen Q. Suggestions for Improving the Standard of Noise Limits for Hydraulic Press. China Metalform Equipment Manufactur Technol. 2001;36(4):36. Search in Google Scholar
[143] Chen P. Noise and control in press shop. Modern Manufactur Eng. 1981;4(5):5–8. Search in Google Scholar
[144] Monitoring Report on Environmental Protection Phase Acceptance of the Annual Production of 150 million Rubber Sealing Products Project (Phase I). Anhui Xianghe Environmental Safety Technology Service Co. Ltd; 2019. Search in Google Scholar
[145] Insul version 9.0,sound insulation prediction software, users manual;. MashallDay Acoustics https://www.insul.co.nz/. Search in Google Scholar
© 2024 the author(s), published by De Gruyter
This work is licensed under the Creative Commons Attribution 4.0 International License.
Articles in the same Issue
- Regular Articles
- Low-frequency cabin noise of rapid transit trains
- Utilizing the phenomenon of diffraction for noise protection of roadside objects
- Benchmarking the aircraft noise mapping package developed for a unified urban environmental modelling tool
- Acoustical analysis and optimization design of the hair dryers
- Methodologies for the prediction of future aircraft noise level
- Basics of meteorology for outdoor sound propagation and related modelling issues
- Predictive noise annoyance and noise-induced health effects models for road traffic noise in NCT of Delhi, India
- Modeling and mapping of traffic noise pollution by ArcGIS and TNM2.5 techniques
- A novel method for constructing large-scale industrial noise maps based on open source data
- Understanding perceived tranquillity in urban Woonerf streets: case studies in two Dutch cities
- Review Article
- A comprehensive review of noise pollution monitoring studies at bus transit terminals
- Rapid Communication
- The Environment (Air Quality and Soundscapes) (Wales) Act 2024
- Erratum
- Erratum to “Comparing pre- and post-pandemic greenhouse gas and noise emissions from road traffic in Rome (Italy): a multi-step approach”
- Special Issue: Latest Advances in Soundscape - Part II
- Soundscape maps of pleasantness in a university campus by crowd-sourced measurements interpolation
- Conscious walk assessment for the joint evaluation of the soundscape, air quality, biodiversity, and comfort in Barcelona
- A framework to characterize and classify soundscape design practices based on grounded theory
- Perceived quality of a nighttime hospital soundscape
- Relating 2D isovists to audiovisual assessments of two urban spaces in a neighbourhood
- Special Issue: Strategic noise mapping in the CNOSSOS-EU era - Part I
- Analysis of road traffic noise in an urban area in Croatia using different noise prediction models
- Citizens’ exposure to predominant noise sources in agglomerations