Experimental investigation of WEDM process through integrated desirability and machine learning technique on implant material
-
Anish Kumar
 ,
Renu Sharma
,
Renu Sharma

Abstract
CP-Ti G2 has become the preferred biocompatible material for various devices mainly used in orthopedic and dental implants and it is also used in aviation and aircraft. While CP-Ti G2 deals with good ductility, higher stiffness, and fatigue resistance. The novelty of present research work was attentive to the effect of WEDM factors on MRR. After machining, surface topography was examined through SEM. MRR was modeled through ANOVA to analyze the adequacy. It was observed that POT, POFT, PC, and SGV most significant factors. The WEDM factors have also been significantly deteriorating the morphology of machined samples in the form of craters, debris, and micro cracks. A multi-objective optimization ‘desirability’ function hybrid with a supervised machine learning algorithm was applied to obtain the optimal solutions. The results show a good agreement between actual and predicted values.
1 Introduction
Osteointegration is a successful technique for dental implant applications. In this method, many factors affect this application such as composition or surface architecture of dental material and bone cell responsiveness of recipients. Many biomedical implants are derived from tailoring products, such as prosthetics and lost limbs or bone, or rebuild specific joint function in a patient's condition [1]. CP-Ti G2 is one of the most regularly used implant materials due to its outstanding biocompatibility. Moreover, Ti is very flexible and can be prepared in many different shapes without affecting its bio-compatibility compared to stainless steel and this bio-compatibility is providing in vivo long term solidity of the artificial implants and scaffolds. It also finds application in aerospace engines, because the use of Ti would mean a reduction in the weight, without foregoing performance. A reduction in weight will consequently reduce the amount of fuel used. Conventional machining imparts difficult-to-machined; however, MRR is very low, coupled with a relatively higher tool wear rate [2, 3, 4]. There is an important need for consistent and efficient methods for machining of CP-Ti G2. On the other hand, the WEDM process seems to be a better choice as it can cut the components with complicated geometries and intricate shapes. Therefore, in the present investigation, an attempt has been made to evaluate the machinability of the WEDM process for CP-Ti G2. This bio-compatible material has little information is available in the literature for its machining characteristics. Kuriakose and Shunmugam [5] observed that WEDM parameters were significantly affected by cutting velocity and the surface finish on Ti-6Al-4V. Sarkar et al. [6] formulated the feed-forward back propagation neural network model to predict the cutting speed, dimensional deviation, and surface finish on the γTi-Al alloy. Poros and Zoboruski [7] observed that a higher value of thermal properties of Ti6Al4V causes to decrease in the volumetric efficiency of WEDM. Roy and Mandal [8] attempted to quantitatively analysis of recast layer thickness, surface crack density, cutting rate, and surface roughness of Nitinol-60. Monte Carlo regression analysis was applied; they observed that experimental values were closer to means and standard deviation. Kumar et al. [9] studied the effect of WEDM parameters on the titanium-based human implant. The voltage parameter was most significantly affected the surface roughness and MRR. Increment of voltage results improved surface quality and reduced the white layer. Manikandan et al [10] performed the orthogonal machining processes on Ti-6Al-4V using wire EDM textured tungsten carbide 6% cobalt tool with texture and without texture at various cutting speeds. The formation of less curled chips was observed in the cross-checked tool. Bobbili et al. [11] presented the effect of wire EDM parameters on high strength armor steel. Six parameters were varied to observe MRR and surface roughness performance measures. Dey and Pandey [12] investigated the WEDM of AA6061/cenosphere as-cast aluminum matrix. They observed that the weight factor of the cenosphere significantly affected the cutting rate. Mussada et al. [13] improved the surface hardenability of die steel. They have concluded that wire speed and servo feed increased the thickness of the recast layer. Bisaria and Shandilya [14] conducted the WEDM of curved profile on Ni-based shape memory alloy. Triangular profiles were machined at an angle of 60°, 90°, and 120°. Corner error was observed due increase of spark time and decrease of spark off time, spark gap voltage. Bisaria and Shandilya [15] further tried the WEDM of Nimonic C 263 superalloy for surface roughness and cutting rate. Surface morphology was altered by the recast layer, micro-cracks, and craters. Payla et al. [16] observed that the MRR and power consumption increases with an increase in discharge energy and further decrease off servo voltage. Wire tension has shown no sign of power consumption. Mandal et al. [17] developed the mathematical model for a multi-cut strategy fo the Nimonic C-263 superalloy. The optimal setting was predicted through desirability function for cutting rate, surface roughness, spark gap, and wire wear ratio. WEDM uses electro-thermal mechanisms to cut electrically difficult-to-machine CP-Ti material. In this process, a discrete series of electrical sparks have been produced in the localized plasma channel developed under the spark gap. The temperature varies from 10000°C to 12000°C in-between wire electrode and conductive CP-Ti material. The material removal occurs by erosion, melting, and vaporization. The molten material swept away through de-ionized water. After an ample review of literature of different materials it is obvious that the several investigations were performed by early investigators on the following:
Many investigations have been conducted on modeling and optimization on performance measures like material removal rate, surface roughness using steels and composites as work material [5, 6, 7, 11, 12, 13, 14]. A limited has been reported on bio-compatible implant material using machine learning technique to optimize the material removal rate.
The erosion mechanism of the WEDM process.
Specifically, less significant literature has been found by the authors relating to optimization of material removal rate using some evolutionary optimization techniques such as RSM. Limited work has been reported on the evaluation of the surface morphology of CP-Ti after WEDM process.
The novelty of present research work was focused on studying the effect of WEDM factors on MRR. A multi-objective optimization ‘desirability’ function hybrid with a supervised machine learning algorithm was applied to obtain the optimal solutions.
2 Material and methods
For conducting all the investigations a CNC WEDM machine was used and proposed methodology in this work as pictorially presented in Figure 1. The factors and their levels in (coded and actual) are shown in Table 1. CP-Ti (ASTM G2, purchased from Anand Metals, Mumbai, India) was used. The chemical composition of selected material is as follows: C: 0.10%, N: 0.03%, O: 0.25%, H: 0.015%, Fe: 0.30% and Ti: 99.03%. Based on pilot and past survey six input factors i.e. POT, POF, PC, SGV, WS, and WT were selected to observe their effect on MRR. Surface morphology was analyzed using SEM (Model: JEOL, Japan, JSM-6610LV) integrated with EDX apparatus. The machined surface was etched with Krol's reagent. Further, the samples were also cleaned with acetone (CH3)2CO. The sample was prepared in a square punch shape having a size (10mm × 10 mm × 26 mm) taken for analysis. The factors kept fixed through the WEDM process were electrode (brass wire with Ø250μm), t: 26mm, and WP: 7kg/cm2. The following formula was used for measurements of MRR:
Where, CR = Cutting rate (mm/min), b = width of cut (mm), t = thickness of workpiece (mm)

Schematic of the experimental setup with methodologies proposed.
Factors and their levels (coded and actual).
| Factor | Name | Units | Lower range | Upper range | Coded low | Coded high | Mean | Std. dev. |
|---|---|---|---|---|---|---|---|---|
| A | POT | μs | 0.7 | 1.1 | 1↔0.7 | +1↔1.1 | 0.9 | 0.1346 |
| B | POFT | μs | 17 | 38 | −1↔17 | +1↔38 | 27.5 | 7.07 |
| C | PC | A | 120 | 200 | 1↔120 | +1↔200 | 160 | 26.92 |
| D | SGV | V | 40 | 60 | −1↔40 | +1↔60 | 50 | 6.73 |
| E | WS | m/min | 4 | 10 | −1↔4 | +1↔10 | 7 | 2.02 |
| F | WT | g | 500 | 1400 | 1↔500 | +1↔1400 | 950 | 302.82 |
3 ANOVA and development of a predictive model
To evaluate the adequacy of the models, three different tests (SS, LOF, and model summary statistics) have been performed for MRR. RSM can be effectively employed to develop the BBD matrix for an experimental plan and their observed values for MRR as demonstrated in Table 2. The significance level α=0.05 at 95CI and the ANOVA for the reduced quadratic model has been determined after the backward elimination method. Adequacy measures the PR2, AR2, and AP. A second-order mathematical quadratic polynomial regression equation for MRR as follows:
Design matrix for main experimentation.
| Run no. | POT (μs) | POFT (μs) | PC (A) | SGV (V) | WS (m/min) | WT (g) | MRR (mm3/min) |
|---|---|---|---|---|---|---|---|
| 1 | 1.1 | 28 | 200 | 50 | 7 | 500 | 9.6 |
| 2 | 0.9 | 38 | 160 | 50 | 4 | 500 | 4.92 |
| 3 | 0.7 | 28 | 160 | 60 | 4 | 950 | 3.39 |
| 4 | 0.9 | 17 | 120 | 50 | 10 | 950 | 8.29 |
| 5 | 0.9 | 28 | 120 | 60 | 7 | 500 | 4.45 |
| 6 | 1.1 | 28 | 160 | 40 | 4 | 950 | 9.2 |
| 7 | 0.9 | 38 | 160 | 50 | 10 | 1400 | 4.77 |
| 8 | 0.9 | 28 | 160 | 50 | 7 | 950 | 5.19 |
| 9 | 0.9 | 17 | 160 | 50 | 4 | 500 | 8.81 |
| 10 | 1.1 | 28 | 160 | 40 | 10 | 950 | 8.59 |
| 11 | 1.1 | 38 | 160 | 40 | 7 | 950 | 8.3 |
| 12 | 1.1 | 28 | 160 | 60 | 4 | 950 | 7.03 |
| 13 | 0.9 | 17 | 160 | 50 | 10 | 500 | 8.19 |
| 14 | 0.9 | 28 | 160 | 50 | 7 | 950 | 4.67 |
| 15 | 0.7 | 28 | 120 | 50 | 7 | 500 | 3.28 |
| 16 | 0.9 | 28 | 160 | 50 | 7 | 950 | 5.51 |
| 17 | 0.9 | 28 | 120 | 60 | 7 | 1400 | 4.66 |
| 18 | 0.7 | 38 | 160 | 40 | 7 | 950 | 3.65 |
| 19 | 0.9 | 38 | 120 | 50 | 10 | 950 | 4.37 |
| 20 | 0.9 | 28 | 200 | 40 | 7 | 1400 | 6.72 |
| 21 | 0.9 | 28 | 200 | 60 | 7 | 500 | 6.67 |
| 22 | 0.9 | 38 | 200 | 50 | 10 | 950 | 6.54 |
| 23 | 0.9 | 28 | 120 | 40 | 7 | 1400 | 5.07 |
| 24 | 0.7 | 28 | 120 | 50 | 7 | 1400 | 3.3 |
| 25 | 0.9 | 38 | 200 | 50 | 4 | 950 | 7.07 |
| 26 | 1.1 | 28 | 160 | 60 | 10 | 950 | 6.77 |
| 27 | 1.1 | 28 | 120 | 50 | 7 | 500 | 7.1 |
| 28 | 0.7 | 28 | 160 | 40 | 10 | 950 | 4.27 |
| 29 | 0.7 | 28 | 200 | 50 | 7 | 500 | 4.49 |
| 30 | 0.7 | 17 | 160 | 40 | 7 | 950 | 6.9 |
| 31 | 0.7 | 28 | 200 | 50 | 7 | 1400 | 4.44 |
| 32 | 0.9 | 28 | 160 | 50 | 7 | 950 | 4.7 |
| 33 | 0.9 | 17 | 200 | 50 | 4 | 950 | 8.06 |
| 34 | 0.9 | 28 | 160 | 50 | 7 | 950 | 5.61 |
| 35 | 1.1 | 17 | 160 | 40 | 7 | 950 | 11.16 |
| 36 | 0.9 | 17 | 200 | 50 | 10 | 950 | 8.28 |
| 37 | 0.9 | 28 | 200 | 40 | 7 | 500 | 7.07 |
| 38 | 0.7 | 28 | 160 | 40 | 4 | 950 | 4.41 |
| 39 | 0.9 | 38 | 160 | 50 | 10 | 500 | 4.96 |
| 40 | 0.9 | 28 | 160 | 50 | 7 | 950 | 5.65 |
| 41 | 1.1 | 38 | 160 | 60 | 7 | 950 | 6.77 |
| 42 | 0.7 | 17 | 160 | 60 | 7 | 950 | 4.14 |
| 43 | 0.9 | 28 | 200 | 60 | 7 | 1400 | 6.57 |
| 44 | 0.9 | 17 | 120 | 50 | 4 | 950 | 7.61 |
| 45 | 0.7 | 28 | 160 | 60 | 10 | 950 | 3.75 |
| 46 | 1.1 | 28 | 120 | 50 | 7 | 1400 | 7.11 |
| 47 | 0.7 | 38 | 160 | 60 | 7 | 950 | 3.28 |
| 48 | 0.9 | 17 | 160 | 50 | 4 | 1400 | 8.15 |
| 49 | 0.9 | 28 | 120 | 40 | 7 | 500 | 5.36 |
| 50 | 1.1 | 17 | 160 | 60 | 7 | 950 | 8.45 |
| 51 | 0.9 | 38 | 120 | 50 | 4 | 950 | 4.55 |
| 52 | 1.1 | 28 | 200 | 50 | 7 | 1400 | 8.37 |
| 53 | 0.9 | 17 | 160 | 50 | 10 | 1400 | 7.53 |
| 54 | 0.9 | 38 | 160 | 50 | 4 | 1400 | 4.92 |
From ANOVA (Table 3) values predicted that factors POT, POFT, PC, SGV, and their interactions (POT*PC, POT*SGV, POFT*PC, POFT*SGV) have been most significant to MRR. The p-value of LOF for the MRR is 0.5894 which implies that it is not significant relative to the pure error. Moreover, the R-squared value for MRR (95.87%) shows that all the data closely fitted to the regression line. Further, PR2 (92.55%) and AR2 (96.44%) are again reasonable high correlation between observed values and predicted values. The AP evaluates the signal to noise ratio. A ratio is >4 is necessary [18]. So, the ratio for MRR was observed 37.40 which reveals the adequate signal.
ANOVA for MRR (Reduced quadratic after backward elimination).
| Source | SS | DF | MS | F-value | p-value | Coefficients |
|---|---|---|---|---|---|---|
| Model | 183.43 | 12 | 15.29 | 79.35 | <0.0001 | |
| POT | 100.66 | 1 | 100.66 | 522.50 | <0.0001 | 2.05 |
| POFT | 41.27 | 1 | 41.27 | 214.21 | <0.0001 | −1.31 |
| PC | 14.62 | 1 | 14.62 | 75.88 | <0.0001 | 0.7804 |
| SGV | 9.09 | 1 | 9.09 | 47.18 | <0.0001 | −0.6154 |
| WS | 0.1365 | 1 | 0.1365 | 0.7086 | 0.4048 | −0.0754 |
| POT*SGV | 0.7921 | 1 | 0.7921 | 4.11 | 0.0491 | −0.2225 |
| POFT*PC | 2.26 | 1 | 2.26 | 11.72 | 0.0014 | 0.5313 |
| POFT*SGV | 1.59 | 1 | 1.59 | 8.27 | 0.0064 | 0.4462 |
| POT2 | 1.09 | 1 | 1.09 | 5.66 | 0.0221 | 0.3061 |
| POFT2 | 9.01 | 1 | 9.01 | 46.77 | <0.0001 | 0.9191 |
| PC2 | 1.73 | 1 | 1.73 | 9.00 | 0.0046 | 0.3861 |
| WS2 | 0.7438 | 1 | 0.7438 | 3.86 | 0.0562 | 0.2641 |
| Residual | 7.90 | 41 | 0.1926 | |||
| LOF | 6.90 | 36 | 0.1918 | 0.9637 | 0.5894 | |
| not significant | ||||||
| PE | 0.9949 | 5 | 0.1990 | |||
| Correlation total | 191.32 | 53 | ||||
4 Main and interaction effect of parameters on MRR
The one-factor plot for MRR was presented in Figure 2. It was observed that as the POT increases from 0.7μs to 1.1μs, the MRR rises by (23%, 98%). A decrease of POFT from 38μs to 17μs, as a result the rise of MRR (15%, 55%). While increasing of PC from 120A to 200A, observed the increment of MRR by (14%, 33%). With an increase of SGV from 40V to 60V, the MRR decreased by (8%, 17%). It could be observed that higher MRR could be obtained at increased values of POT, PC. On the other hand, a reduction in POFT and SGV is found to improve the MRR. The effect of WS and WT is insignificant for MRR by (2%, 3%). It shows a constant and U-shape pattern. Due to increase in PC and decrease of POFT, the rate of discharge energy increases, together with an improvement in the discharge frequency. The concentration of discharge energy in the spark gap leads to melting and vaporization of molten metal and floating metal suspended in the electrical discharge which leads to increase of MRR. The reason is that due to an increase of POT the spark energy causes melting and vaporization and formed deep wider craters on the machined surface. While a decrease of POFT there is less percentage rise of MRR. Smaller POFT, the number of discharges within a given period becomes more and ejected debris on a machined surface that will not be flushed away properly and deposited on the surface as a resulting increment of MRR. 3-D interaction response surface graph for MRR has been shown in Figure 3. The effect of interaction between POT*SGV (increases from 3.28mm3/min to 8.51mm3/min), POFT*PC (increases from 4.10mm3/min to 7.5mm3/min) and POFT*SGV (increases from 4.09mm3/min to 8.5mm3/min) for MRR. The MRR increment rate (more than 100%) was observed at higher POT and lower POFT, SGV combined interaction. A combined interaction cause's more sparking time, melting, and vaporization of material that will increase the MRR. In this plot, factor WS and WT show the flat line which is insignificant for MRR. SEM morphology of CP-Ti at higher POT and PC the sub-surfaces have appeared with a wavy pattern, micro-cracks, wider-deep craters, globules of debris as illustrated in Figures 4 and 5. This may be attributed to the reduced gap between the work and wire electrode during the spark, when the SGV is set at a lower value. The reduced gap results in higher sparking frequency and thus, the machining speed is improved. The present study revealed that higher MRR can be achieved at the lower SGV and POFT coupled with higher PC. An increase in discharge energy causes a pool of molten metal to be formed and overheated. The overheated molten metal evaporates, forming gas bubbles that explode when the discharge ceases, taking molten metal material away. The result is the formation of a crater. It has been observed that increasing the POT PC results in formation of deeper and wider craters, thus improving the MRR. Based on experimental results (as shown in Table 2), maximum MRR (11.16 mm3/min) was obtained when the parameters were set at POT = 1.1μs, POFT = 17μs, PC = 160A, SGV= 40V, WS = 7m/min and WT = 950 grams.
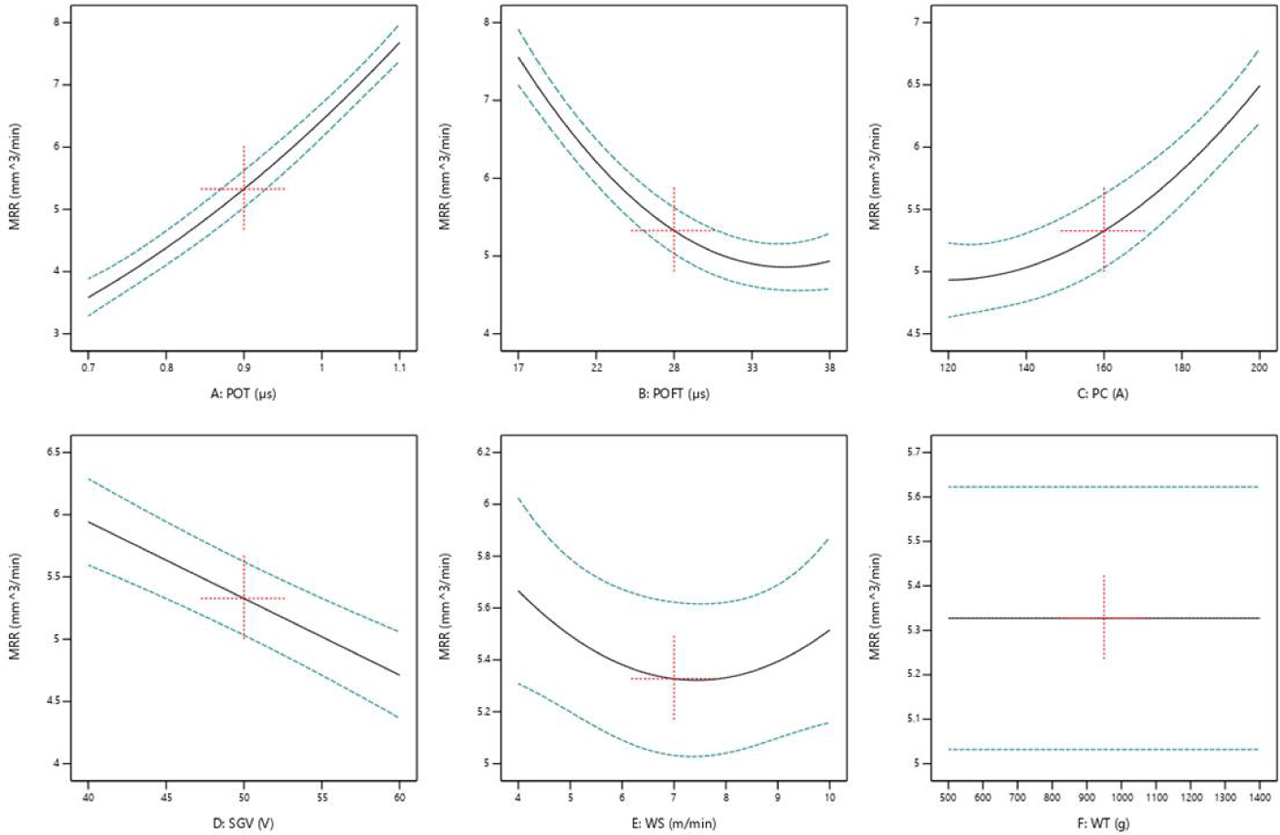
One factor plot for MRR.

3-D Response surface interaction and Perturbation plot for MRR.

Surfaces have appeared with a wavy pattern, micro-cracks, wider-deep craters, globules of debris.

SEM micrograps of micro cracks observed at (a) POT=0.7μs, POFT=17μs, PC=120A, (b) POT=0.9μs, POFT=28μs, PC=160A, (c) POT= 0.9μs, POFT=17μs, PC= 160A, (d) POT=1.1μs, POFT=28μs, PC=160A, (e) POT=1.1μs, POFT=38μs, PC=200A, (f) POT=1.1μs, POFT=38μs, PC=200A.
5 Results and discussion on the machined surface morphology
The quality of a machined surface is generally characterized by surface morphology which includes micro-cracks, heat affected zone, recast layer and phase transformations on the surface and subsurface regions. The surface properties might be altered due to effect of process parameters such as pulse on time, pulse off time, peak current and spark gap voltage. It was observed from SEM micrographs, (Figures 4, 5 and 6) that machined surface contained globules of debris, spherical particles, craters, pockmarks and micro-cracks. The POT (1.1μs) and PC (200A) were observed as the most significant parameters affecting the surface properties. The increase in POT resulted in the formation of deep craters on the machined surface. These deep and overlapping craters were formed due to successive electrical discharge, intense heat transferred to the surface of the sample which caused local melting or evaporization of work material. Some of the molten material produced by the discharge was carried away by the deionized water. The remaining molten material re-solidified to form lumps of debris. During short POT, electric sparks produced small craters on work surface. During WEDM some of titanium particles protruded and completely dislodged from the machined surface as observed in Figure 6 (e–g) at higher values of POT (1.1μs) and PC (200A). Also the formation of spherical shape particles was observed and it may be due to surface tension of molten material. Matt surfaces with many fine nodules were also observed in Figure 6 (b). These nodules may be formed due to solidification of molten or vaporized titanium particles during machining. The more frequent melt expulsion resulted in the formation of deep and larger craters on the machined surface as shown in Figure 6(e). The main possible reason for deep and big craters is the oxidation reaction, the impulsive force of dielectric pressure concentrated on localized spark gap area. It was observed from Figure 6(d–f) that WEDM surfaces may also have macro-ridges as formed by melted material. This melted material was blasted out of the machined surface by the discharge pressure.

SEM micrographs observed with C→Craters, P→Pockmarks, D→Debris, M→Matt surface, spherical nodule, and protruding material at higher POT=1.1μs, POFT=17μs and PC=200A.
6 Optimization of MRR using desirability function and machine learning technique
The optimization was performed by numerical optimization and machine learning algorithm. The objectives are: maximize, minimize, target, within a range that applies to MRR [19, 20, 21]. In this work, the goal is set at a target to achieve the maximum MRR=11.16mm3/min. The weights were assigned for MRR (lower weight=0.2 and upper weight= 0.8). A total of 10 best optimal solutions have been obtained after applying the desirability function as shown in Table 4. The overall combined desirability was observed closer to 1.000. Figure 7 shows the ramp and bar graph for achieving the optimal overall desirability. A dot was on ramp graph indicates the optimal solutions [26, 27, 28, 29]. This section also describes the data analysis and predictions for MRR using a machine learning technique. In the first step data was imported from excel format and then giving the local namespace. After that data was analyzed using NumPy and Pandas. For an understanding of Pandas, the prerequisites for data structures is series and data frame [22, 23, 24, 25]. It is shown in Table 5. The second step is to find co-relation between WEDM factors and performance measures. This can be done through the evaluation, visualization of the datasets. The output value for MRR has been observed with the help of the seaborn library. Heat map and co-relation matrix for each factor as shown in Table 6. In the third step data which is obtained from step-2 was preprocessed in machine learning libraries using sci-kit-learn. To train the model at a higher degree a polynomial regression algorithm was applied. The data was divided into two portions, 80% for training data and 20% for testing data. This is demonstrated in Table 7. In the final step, the trained model to predict the optimal data for MRR as shown in Table 8. Figure 8a shows the heat map and co-relation matrix for each dataset. Besides this algorithm which was applied to predict the optimal values for MRR as shown in Figure 8b. It shows a good agreement with the actual and predicted values.

Desirability ramp and a bar graph (a graphical representation of numerical optimization results) for achieving optimum MRR.

(a) heat map co-relation matrix, (b) Comparison of RSM vs Machine learning.
Optimal solution after desirability function.
| Optimal solution | POT μs | POFT μs | PC A | SGV V | WS m/min | WT g | MRR mm3/min | Desirability |
|---|---|---|---|---|---|---|---|---|
| 1 | 1.1 | 17 | 120 | 51 | 4 | 836 | 7.220 | 1.000 |
| 2 | 1.1 | 19 | 121 | 49 | 4 | 951 | 7.220 | 1.000 |
| 3 | 1.1 | 19 | 120 | 49 | 4 | 1012 | 7.220 | 1.000 |
| 4 | 1.1 | 20 | 121 | 49 | 4 | 715 | 7.220 | 1.000 |
| 5 | 1.1 | 17 | 120 | 50 | 10 | 725 | 7.220 | 1.000 |
| 6 | 1.1 | 17 | 120 | 50 | 4 | 584 | 7.220 | 1.000 |
| 7 | 1.1 | 17 | 120 | 51 | 4 | 1298 | 7.220 | 1.000 |
| 8 | 1.1 | 17 | 123 | 52 | 4 | 1057 | 7.220 | 1.000 |
| 9 | 1.1 | 17 | 120 | 51 | 5 | 890 | 7.220 | 1.000 |
| 10 | 1.1 | 17 | 123 | 52 | 10 | 1006 | 7.220 | 1.000 |
Instruction to import the desirability values for MRR.

Co-relation matrix and heat map for MRR.

Instructions to preprocess the MRR dataset and split the dataset into training (80%) and test data (20%).

Instruction to predict the data for MRR using trained model.

7 Conclusions
Following conclusions have been drawn from the study:
It can be concluded that the POT increases MRR by (23%, 98%). During the decrease of POFT, as a result the MRR increase by (15%, 55%). While increasing of PC, observed an increment of MRR by (14%, 33%). With an increase of SGV, MRR decreased by (8%, 17%). The interaction effect between the two factors has also shown a significant effect on MRR.
The surface morphology was studied using scanning electron microscope (SEM). It was observed that higher POT and PC deteriorated the surface morphology of machined samples. It resulted in the formation of deep and wide overlapping craters, pock marks, globules of debris and micro cracks.
The residuals of spherical nodules in free or compound form were observed near the heat affected zone. These nodules were developed due to thermal affects and surface tension. The spherical nodules were formed due to higher discharge energy and rapid quenching resulted in micro-cracks were formed.
SEM morphology of CP-Ti at higher POT and PC the sub-surfaces have appeared with a wavy pattern, micro-cracks, craters, globules of debris. It was observed that higher POT (1.1μs) and PC (200A) deteriorated the surface integrity of machined samples. Sub-surface cracks, penetrating cracks have been mostly integrated with irregular spherical debris and craters. It is due to fast heating and quenching successions by spark and de-ionized water.
A ‘Desirability’ function was applied to obtain the optimal solutions. The overall desirability was observed to 1.00. The effect of WS and WT is insignificant on output responses.
The application of a supervised machine learning algorithm for optimization presented the good agreement with desirability function.
Abbreviations
- ANOVA
analysis of variance
- BBD
Box-Behnken design
- CI
confidence interval
- CP-Ti
commercially pure titanium
- LOF
lack of fit
- MRR
material removal rate
- MS
mean square
- POFT
pulse off time
- POT
pulse on time
- PE
pure error
- RSM
response surface methodology
- SGV
spark gap voltage
- SEM
scanning electron microscope
- SS
sum of square
- WS
wire speed
- WEDM
wire electric discharge machining
- PC
peak current
- WT
wire tension
Funding information:
The authors state no funding involved.
Author contributions:
All authors have accepted responsibility for the entire content of this manuscript and approved its submission.
Conflict of interest:
The authors state no conflict of interest.
References
[1] Elias C, Lima J, Valiev R, Meyers M. Biomedical applications of titanium and its alloys. J Miner Met Mater Soc. 2008;60(3):46–9.10.1007/s11837-008-0031-1Search in Google Scholar
[2] Long M, Rack HJ. Titanium alloys in total joint replacement—a materials science perspective. Biomaterials. 1998 Sep;19(18):1621–39.10.1016/S0142-9612(97)00146-4Search in Google Scholar
[3] Budinski KG. Tribological properties of titanium alloys. Wear. 1991;151(2):203–17.10.1016/0043-1648(91)90249-TSearch in Google Scholar
[4] Revankar GD, Shetty R, Rao SS, Gaitonde VN. Wear resistance enhancement of titanium alloy (Ti-6Al-4V) by ball burnishing process. J Mater Res Technol. 2017;6(1):13–32.10.1016/j.jmrt.2016.03.007Search in Google Scholar
[5] Kuriakose S, Shunmugam MS. Multi-objective optimization of wire electro-discharge machining process by non-dominated sorting genetic algorithm J. J Mater Process Technol. 2005;170(1–2):133–41.10.1016/j.jmatprotec.2005.04.105Search in Google Scholar
[6] Sarkar S, Mitra S, Bhattacharyya B. Parametric analysis and optimization of wire electrical discharge machining of γ-titanium aluminide alloy J. J Mater Process Technol. 2005;159(3):286–94.10.1016/j.jmatprotec.2004.10.009Search in Google Scholar
[7] Pasam V, Battulla SB, Madar VP, Swapna M. Optimizing surface finish in WEDM using the Taguchi parameter design method. J Braz Soc Mech Sci Eng. 2010;32(2):107–13.10.1590/S1678-58782010000200002Search in Google Scholar
[8] Roy K, Mandal A. Biplab, Mandal Amitava. Surface integrity analysis of Nitinol-60 shape memory alloy in WEDM. Mater Manuf Process. 2019;34(10):1091–102.10.1080/10426914.2019.1628256Search in Google Scholar
[9] Siva K, Khan AM, Murlidharan B. Processing of titanium-based human implant material using wire EDM. Mater Manuf Process. 2019;34(6):695–700.10.1080/10426914.2019.1566609Search in Google Scholar
[10] Manikandan N, Arulkirubakaran D, Palanisamy D, Ramesh R. Influence of wire-EDM textured conventional tungsten carbide inserts in machining of aerospace materials (Ti-6Al-4V alloy). Mater Manuf Process. 2018:10426914.2018.1544712.10.1080/10426914.2018.1544712Search in Google Scholar
[11] Ravindranadh B, Madhu V, Gogia AK. Effect of wire-EDM machining parameters on surface roughness and material removal rate of high strength armor steel. Mater Manuf Process. 2013;28(4):364–8.10.1080/10426914.2012.736661Search in Google Scholar
[12] Abhijit D, Krishna PM. Wire electrical discharge machining characteristics of AA6061/cenosphere as-cast aluminium matrix composites. Mater Manuf Process. 2018;33(12):1346–53.10.1080/10426914.2017.1388517Search in Google Scholar
[13] Eswara MK, Choo HC, Rao PK. Surface hardenability studies of the die steel machined by WEDM. Mater Manuf Process. 2018;33(16):1745–50.10.1080/10426914.2018.1476695Search in Google Scholar
[14] Himanshu B, Pragya S. Processing of curved profiles on Ni-rich nickel-titanium shape memory alloy by WEDM. Mater Manuf Process. 2019a;34(12):1333–41.10.1080/10426914.2019.1594264Search in Google Scholar
[15] Himanshu B, Pragya S. Experimental investigation on wire electric discharge machining (WEDM) of Nimonic C-263 superalloy. Mater Manuf Process. 2019b;34(1):83–92.10.1080/10426914.2018.1532589Search in Google Scholar
[16] Aishwarya P, Kunal C, Eswara MK. Investigations on power consumption in WEDM of EN31 steel for sustainable production. Mater Manuf Process. 2019;34(16):1855–65.10.1080/10426914.2019.1683577Search in Google Scholar
[17] Mandal Amitava, Dixit Rai Amit, Das K. Alok, Mandal N. Modeling and Optimization of Machining Nimonic C-263 Super Alloy Using Multi-Cut Strategy in WEDM. Mater Manuf Process. 2016;31(7):860–8.10.1080/10426914.2015.1048462Search in Google Scholar
[18] Zhang G, Zhen Z, Guo J, Ming W. Modeling and optimization of medium-speed WEDM process parameters for machining SKD11. Mater Manuf Process. 2013;28(10):1124–32.10.1080/10426914.2013.773024Search in Google Scholar
[19] Anish K, Vinod K, Jatinder K. Surface integrity and material transfer investigation of pure titanium for rough cut surface after wire electro discharge machining. Proc. I. Mech. Eng, Part B: J. Proc Inst Mech Eng, B J Eng Manuf. 2014;228(8):880–901.10.1177/0954405413513013Search in Google Scholar
[20] Shahali H, Reza Soleymani Yazdi M, Mohammadi A, et al. Optimization of surface roughness and thickness of white layer in wire electrical discharge machining of DIN 1.4542 stainless steel using micro-genetic algorithm and signal to noise ration techniques. Proc Inst Mech Eng, B J Eng Manuf. 2012;226(5):803–12.10.1177/0954405411434234Search in Google Scholar
[21] Rao PV, Pawar PJ. Modeling and optimization of process parameters of wire electrical discharge machining. Proc I Mech Eng Part B: J Eng Manuf 2009;223:1431–1440.10.1243/09544054JEM1559Search in Google Scholar
[22] Vendan AS, Kamal R. Karan Abhinav, Gao Liang et al. In: Welding and Cutting Case Studies with Supervised Machine Learning. Eng Appl Comp Meth. 2020;1: https://doi.org/10.1007/978-981-13-9382-2-410.1007/978-981-13-9382-2Search in Google Scholar
[23] Shahali H, Reza Soleymani Yazdi M, Mohammadi A, et al. Optimization of surface roughness and thickness of white layer in wire electrical discharge machining of DIN 1.4542 stainless steel using micro-genetic algorithm and signal to noise ration techniques. Proc Inst Mech Eng, B J Eng Manuf. 2012;226(5):803–12.10.1177/0954405411434234Search in Google Scholar
[24] Anish K, Vinod K, Jatinder K. Investgation of machining characterization for wire wear ratio & MRR on pure titanium in WEDM process through response surface methodology. Proc IMechE, Part E: J. Proc. Mech. Eng. 2017;232(1):108–26.10.1177/0954408916685588Search in Google Scholar
[25] Himanshu B, Pragya S. Wire Electric Discharge Machining Induced Surface Integrity for Ni55.95Ti44.05 Shape Memory Alloy. Proc I MechE, Part E: J Proc Mech Eng. 2020; https://doi.org/10.1177/0954408920951146.10.1177/0954408920951146Search in Google Scholar
[26] Anish K, Renu S. Multi-response optimization of magnetic field assisted EDM through desirability function using response surface methodology. J Mech Behav Mater. 2020;29(1):29–35.10.1515/jmbm-2020-0003Search in Google Scholar
[27] Kumar P, Gupta M, Kumar V. Microstructural analysis and multiresponse optimization of WEDM of Inconel 825 using RSM based desirability approach. J Mech Behav Mater. 2019;28(1):39–61.10.1515/jmbm-2019-0006Search in Google Scholar
[28] Sandeep J, Harpreet S. Microstructural analysis and multiresponse optimization of WEDM of Inconel 825 using RSM based desirability approach. J Mech Behav Mater. 2021;30(1):9–18.Search in Google Scholar
[29] Dwivedi SP, Dwivedi G; Dwivedi Prakash Shashi. Dwivedi Garima. Utilization of RHA in development of green composite material using RSM. J Mech Behav Mater. 2019;28(1):20–8.10.1515/jmbm-2019-0004Search in Google Scholar
A Appendix
#importing files
from sklearn.model_selection import cross_val_score
import pandas as pd
import numpy as np
from sklearn.linear_model import LinearRegression
from sklearn.preprocessing import PolynomialFeatures
from sklearn.model_selection import train_test_split
#Load the data
data = pd.read_excel("Experimental Plan1.xlsx", header=0)
display(data)
#Import Libraries for data Visualization
import matplotlib.pyplot as plt
import seaborn as sns
#correlation between variables
corr = data.corr()
display (corr)
sns.heatmap(corr,xticklabels=corr.columns, yticklabels=corr.columns, cmap=’RdBu’)
#get the summary
desc_data=data.describe()
#Add Standard Deviation Metric
desc_data.loc [’+3_std’]=desc_data.loc[’mean’]+(desc_data.loc['std’]*3)
desc_data.loc [’-3_std’]=desc_data.loc[’mean’]-(desc_data.loc['std’]*3)
desc_data
#define input and output variables
x=data.iloc[:,:-1]
y=data.iloc[:,6]
#create Polynomial features
from sklearn.preprocessing import PolynomialFeatures
polynomial_features= PolynomialFeatures(degree=2)
x = polynomial_features.fit_transform(x)
#divide into training and testing data
x_train,x_test,y_train,y_test=train_test_split(x,y,test_size=.20, random_state=0)
print("X_train",x_train)
print("Y_train",y_train)
print("X_test",x_test)
print("Y_test",y_test)
#Create Linear Regression Model
regression_model=LinearRegression()
regression_model.fit(x_train,y_train)
#Get Prediction
y_predict=regression_model.predict(x)
#Show Prediction
y_predict[:]
df=pd.DataFrame(’Actual’:y,’Predicted’:y_predict)
df
© 2021 Anish Kumar et al., published by De Gruyter
This work is licensed under the Creative Commons Attribution 4.0 International License.
Articles in the same Issue
- Research Articles
- The elastic-plastic properties of an anti-icing coating on an aluminum alloy: Experimental and numerical approach
- Optimization of recycled slag-fresh flux mixture based upon weld bead quality for submerged arc welding of stainless steel
- Design and optimization of differential capacitive micro accelerometer for vibration measurement
- Mechanical performance of abrasive sandpaper made with palm kernel shells and coconut shells
- Experimental investigation of WEDM process through integrated desirability and machine learning technique on implant material
- Mechanical properties and microstructural characteristics of rotating arc-gas metal arc welded carbon steel joints
- Assessment of cement replacement with fine recycled rubber particles in sustainable cementitious composites
- Structural response and sensitivity analysis of granular and asphaltic overlayment track considering linear viscoelastic behavior of asphalt
- Unmanned aerial vehicle evasion manoeuvres from enemy aircraft attack
- Effect of corrosion on surface degradation of galvanized steel in poultry dung, pig dung and urea solutions using rice straw as an inhibitor
- Mathematical modeling of AZ30 magnesium alloys at high temperature using the ring compression test and genetic algorithm method
- Study on hot deformation behavior and workability of stir-cast Al6063-6wt.% steelp based composites
- The effects of processing parameters on the formation of oxide layers in aluminium alloys using plasma electrolytic oxidation technique
- Behavior of green reactive powder mortar reinforced with steel fibers
- On the hygrothermal properties of sandcrete blocks produced with sawdust as partial replacement of sand
- Mechanical behavior of thin-walled steel under hard contact with rigid seabed rock: Theoretical contact approach and nonlinear FE calculation
- Mechanical properties and microstructural characteristics of rotary friction welded dissimilar joints of rolled homogeneous armor steel and medium carbon steel
- Studies of carboxylated nitrile butadiene rubber/butyl reclaimed rubber (XNBR/BRR) blends for shoe soles application
- Mechanical properties of wire arc additive manufactured carbon steel cylindrical component made by gas metal arc welding process
- Synthesis and mechanical characterization of Si3N4 reinforced copper-tin matrix composites
- Analysis of plated-hull structure strength against hydrostatic and hydrodynamic loads: A case study of 600 TEU container ships
- Mechanical performance investigation of lignocellulosic coconut and pomegranate / LDPE biocomposite green materials
- Special Issue MICAP-2021
- Double hydrothermal synthesis of iron oxide/silver oxide nanocomposites with antibacterial activity**
- Enhanced photocatalytic activity of TiO2-CdS composite nanofibers under sunlight irradiation**
- Structural properties of CoxCu1−xFe2O4 solid solution**
- Green-synthesis of Ag2O nanoparticles for antimicrobial assays**
- Effect of current density on the porous silicon preparation as gas sensors**
- A mechanochemical preparation, properties and kinetic study of kaolin–N, P fertilizers for agricultural applications**
- Impact strength of surface treated SS316L wires reinforced PMMA**
- Computational studies on electronic and optical properties of dopamine derivatives structure: A DFT study**
- Multilayer coating effects on the thermal conductivity of tools using an electric furnace technique**
- The positron and mechanical parameters of a cold-worked aluminum alloy (3004) Using PALT, PADBT and HV**
- Effect of thermal annealing on the structural and optical properties of TiO2 nanostructures**
- Improvement of forging die life by failure mechanism analysis**