Polarizabilities and emission cross-sections of lanthanide laser crystals
-
Dimitar N. Petrov

 ,
The-Long Phan
,
The-Long Phan

Abstract
The dependence between stimulated-emission cross-sections and polarizability volumes has been studied for laser transitions of Nd3+, Ho3+, Er3+, and Tm3+ ions doped in dielectric crystals: complex oxides, simple and complex fluorides. The overall polarizability of each crystal containing Ln3+ ions has been calculated by inclusion of the dopant polarizability in respective concentration. The applied method has revealed distinctly different positions of Nd3+ ions in the mentioned dependence in a series of crystals, e.g. Y3Al5O12, YAlO3, LiYF4, compared to the other Ln3+ ions doped in the same lattices.
1 Introduction
The trivalent lanthanide ions (Ln3+) are unavoidable in research and application of solid-state lasers, either doped in insulating single crystals, in fibers, in waveguide/clad structures or as crystals of stoichiometric compounds. Their ground-state electronic configuration is Z Ln3+ = [54Xe] 4f N , where Z varies from 58 (Ce) to 71 (Lu), with N changing from 1 to 14, respectively. The atomic number Z and the number N of 4f electrons predetermine the complexity of the energy-level schemes including all types of interactions. 1 The most studied in the mentioned scope among Ln3+ ions are 60Nd3+ = [Xe] 4f3, 67Ho3+ = [Xe] 4f10, 68Er3+ = [Xe] 4f11, and 69Tm3+ = [Xe] 4f12. Stimulated emission transitions in these ions occur via mechanisms comprising three or four energy levels of 4f electrons, including appropriate absorption of light from optical source: LED, diode-, dye- or ion laser. The emission 4f–4f transitions often initiate after and terminate with non-radiative transitions. The basic characteristics include generation wavelength λ e, absorption σ a and emission σ e cross-sections, lifetime τ of the stimulated-emission transition, optical-pump power threshold, and output/input efficiency. Most of these quantities have been interrelated for Nd3+ miniature lasers. 2 It is noteworthy that laser transitions with Nd3+ and Er3+ ions can be obtained at room temperature, mostly quoted T = 300 K, while the active media with Ho3+ and Tm3+ ions often require cryogenic temperatures, e.g. T = 77–100 K, in order to achieve inverse population of the excited level relative to the level at which the stimulated emission terminates. The concentration of Ln3+ ions in doped crystals is low, usually 0.5–5 mol.%, which is alternatively expressed as a number of ions per unit of volume, 1019–1020 cm−3. The generation wavelengths for the mentioned Ln3+ ions are located within 1–3 μm for most of the transitions.
The band widths of Russell–Saunders terms in Nd3+: Y3Al5O12 have been experimentally verified to depend on the doping concentration and growth process. 3 It was pointed out in the same study that the increase of concentration reduces the stimulated-emission cross-section of the activated crystal more than twice per 1 mol.% Nd3+ proceeding from emission at 1.06 μm to that at 1.32 μm. Er3+ cross-sections for the transitions 4I13/2 → 4I15/2 have been analyzed with the aid of McCumber’s theory. 4 , 5
Another issue of primary importance for the operation of a solid-state laser resonator is the change of polarizability of the ions in the active media causing optical inhomogeneity. For this purpose, the indices of refraction n for various solid-state laser materials have been measured during pumping. 6
A good linear dependence between polarizabilities and molecular volumes of 25 molecules of various size, shapes and degrees of polarity has been found. 7 In the same article, the authors obtained a better correlation between the same quantities by including the tightness of binding of electrons on the molecular surface. The proportionality of the atomic polarizability to the volumes of real atoms has also been confirmed. 8 It has been suggested that this correlation could be enhanced by the introduction of a slowly varying periodic function of the nuclear charge.
Since the active volume of a laser crystal is significant not only for the stoichiometric compounds containing Ln3+ ions as constituents of the crystal lattice, 9 it is important to study the dependence between emission cross-sections and molar volumes of lanthanide laser crystals. This is the purpose of the present work. The polarizability volumes are associated with: (i) a specific feature directly linked with the volume of the laser resonator since it may contain crystal lattice with unit cell of different symmetry and number of molecules, (ii) a more systematic dependence than separately exerted by the relative dielectric permittivity or by the index of refraction. The difference in both cases is accumulated in the ratio M/ρ that reflects the chemical composition via molar mass and a basic physical quantity, respectively.
2 Methods
At frequencies lower than those for the VIS range of the electromagnetic spectrum, i.e. at ν < 372 THz, the molar polarizability α may be revealed in the right-hand side of Clausius – Mossotti equation for molar polarization P m: 10
where the symbols designate: M/10−3 kg mol−1 – molar mass, ρ/103 kg m−3 – mass density, N A = 6.02214 × 10²³ mol−1 – Avogadro’s number, ε r – relative dielectric permittivity, ε 0 = 8.85419 × 10⁻¹² J−1 C2 m−1 – electric permittivity of vacuum. It is noteworthy that Equation (1) does not contain thermally averaged electric dipole moment μ = (μ 2 E/3kT) in applied electric field E.
The equation of Lorenz–Lorentz, an analogue of the Clausius–Mossotti equation for the optical region of the electromagnetic spectrum, has been used here for determination of the molar polarizability α and the polarizability volume α v:
where P m/10−6 m3 mol−1, with dimension of molar volume, and α v/10−30 m3 pertain to the transparent host crystal. Both Equations (1) and (2) relate macroscopic quantities ε r and n λ respectively, to the microscopic, molar quantity α and this link has been explicitly included in this study.
The stimulated-emission transitions are in fact internal 4f–4f transitions in the lanthanide (3+) ions. For this reason, the specific Ln3+ ion polarizability, α (Ln3+), need to be included to the overall polarizability of the doped crystal,
The values of α (Ln3+) are known from electric polarizability computations for the same ions in free state; 11 those obtained in the approximation (LC + CPP), i.e. of large-core and contracted pseudopotentials, have been used here. The quantities α (Ln3+) have the same order of magnitude and dimension as α v, namely 10−30 m3 or Å3. The contributions from Ln3+ ions to β are proportional to the molar concentration c of the Ln3+ ions, as noted in Equation (4).
The index of refraction n λ in Equation (2) should be considered dependent on the wavelength λ e to which it is referred, in this case – those of laser transitions. The latter for each of the studied Ln3+ ions are shown in Table 1.
Ln3+ ions with transitions and approximate stimulated-emission wavelengths λ e included in the present work.
| Ln3+ | Transition | ≈λ e (μm) |
|---|---|---|
| Nd3+ | 4F3/2 → 4I11/2 | 1.06 |
| 4F3/2 → 4I13/2 | 1.3 | |
| Ho3+ | 5I7 → 5I8 | 2.0 |
| 5I6 → 5I7 | 2.9 | |
| Er3+ | 4I13/2 → 4I15/2 | 1.55 |
| 4I11/2 → 4I13/2 | 2.9 | |
| Tm3+ | 3H4 → 3F4 | 1.4 |
| 3F4 → 3H6 | 1.9 |
Molar masses M and mass densities ρ of the crystals comprised in this work are listed in Table 2, first fluorides (simple and complex) followed by the complex oxides. Molar masses of the host crystals are according to the stoichiometries with molar masses of the elements, 12 the latter have been compiled in a source on optical materials, along with indices of refraction for the same substances, including isotropic, uniaxial and biaxial crystals. 13 The refraction indices have been evaluated in the present work for the wavelengths of stimulated (or rarely, spontaneous) emissions through the Sellmeier equations n 2 = f(λ 2), available for most of the listed laser crystals except for certain stoichiometric neodymium compounds. 13
Molar masses M and mass densities ρ of certain crystals considered in this work.
| Crystal | M (10−3 kg mol−1) | ρ (103 kg m−3) 12 , 13 |
|---|---|---|
| CaF2 | 78.08 | 3.18 |
| SrF2 | 125.62 | 4.24 |
| BaF2 | 175.32 | 4.83 |
| LaF3 | 195.90 | 5.94 |
| LiYF4 | 171.18 | 3.99 |
| LiLuF4 | 257.90 | 6.186 |
| YAlO3 | 163.88 | 5.35 |
| YPO4 | 183.88 | 4.31 |
| YVO4 | 203.85 | 4.23 |
| LiNbO3 | 147.85 | 4.644 |
| LiTaO3 | 235.89 | 7.46 |
| CaWO4 | 287.92 | 6.062 |
| KLa(MoO4)2 | 497.88 | 4.61 |
| KY(WO4)2 | 623.68 | 6.565 |
| NaGd(WO4)2 | 675.92 | 7.2 |
| YAl3(BO3)4 | 405.09 | 3.724 |
| Y3Al5O12 | 593.62 | 4.56 |
| Gd3Ga5O12 | 1,012.36 | 7.02 |
| NdAl3(BO3)4 | 460.42 | 4.13 |
| LiNdP4O12 | 467.07 | 3.39 |
| NdP5O14 | 523.10 | 3.37 |
3 Results and discussion
Tables 3–6 contain values of relevant quantities included in Equation (2) for Nd3+, Ho3+, Er3+, and Tm3+ ions doped in crystals, respectively, as well as for three stoichiometric neodymium compounds. The crystals are listed in all tables in order of increasing polarizability volumes. The quantities comprise experimentally determined emission cross-sections σ e, peak wavelengths λ e of emission transitions, interpolated indices of refraction n λ at λ е, molar concentrations c of Ln3+ ions, as well as calculated here polarizability volumes α v and intrinsic indices of refraction for the wavelength of generation. References in all tables pertain to σ e, λ e, and c (Ln3+) for corresponding crystal. The input data are contained in the three columns after that with the empirical formula of each crystal following the column with the respective reference. Our results are in the last two columns in Tables 3–6. The influence of σ-, π- and other types (x, y, z) of polarization for anisotropic crystals on the polarizability volumes α v in the observed laser transitions with Ln3+ -doped single crystals has been reflected in this work by means of the Sellmeier equations. 13 For example, these are of the type n o 2 = f(λ e 2), n e 2 = f(λ e 2) – for CaWO4, LaF3, LiNbO3, LiYF4, YVO4, etc. or n a 2 = f(λ e 2), n b 2 = f(λ e 2), n c 2 = f(λ e 2) – for YAlO3, where n o and n e are ordinary and extraordinary indices of refraction, respectively, a, b, and c are axes of the unit cell, λ e is in μm. The isotropic crystals such as garnets and MIIF2 exhibit only one Sellmeier equation for n λ 2.
Simple and complex fluorides and complex oxides in crystalline state have attracted considerable research interest for the following reasons. The fluorides are transparent in a wider wavelength range, have lower refraction indices that reduce non-linear optic effects during pumping and exhibit lower phonon frequencies limiting the losses due to non-radiative transitions in the active media. 14 On the other side, the complex oxides provide higher power output remaining thermo-mechanically stable. 15 These important properties for stimulated emission are very sensitive to the energy-level scheme of the particular Ln3+ ion. The results for Nd3+ ions are presented in Table 1. It should be noted that the n λ 2 values for YVO4 have been determined after Sellmeier equations for each polarization at the indicated wavelengths.
Crystals containing Nd3+ ions.
| Nd3+: crystal | σ е (10−24 m2) | λ е (nm) | c (Nd3+) (mol.%) | Ref. | n λ 2 | α v (10−30 m3) |
|---|---|---|---|---|---|---|
| CaF2 | 1.48 | 1,061 | 6.38 × 10⁻³ | Ref 16 | 2.0406 | 2.507 |
| 0.34 | 1,380 | 6.38 × 10⁻³ | Ref 16 | 2.0358 | 2.498 | |
| SrF2 | 1.68 | 1,036.5 | 0.5 | Ref 17 | 2.0050 | 2.947 |
| 1.56 | 1,146.2 | 0.5 | Ref 17 | 1.8879 | 2.682 | |
| BaF2 | 0.15 | 1,036 | 0.25 | Ref 17 | 2.0868 | 3.827 |
| LiYF4 σ | 14.2 | 1,053 | 1.21 | Ref 18 | 2.1593 | 4.740 |
| π | 19.6 | 1,047 | 1.21 | Ref 18 | 2.0969 | 4.554 |
| LiLuF4 σ | 7.6 | 1,053 | 0.489 | Ref 19 | 2.1550 | 4.594 |
| π | 17.3 | 1,047 | 0.489 | Ref 19 | 2.2320 | 4.811 |
| YAlO3 E‖a | 2.9 | 1,341 | (1.0) | Ref 20 | 3.6017 | 5.640 |
| b | 7.0 | 1,341.5 | (1.0) | Ref 20 | 3.6906 | 5.741 |
| c | 3.6 | 1,340 | (1.0) | Ref 20 | 3.7234 | 5.778 |
| LiTaO3 σ | 7.8 | 1,092.8 | 0.7 | Ref 21 | 4.5757 | 6.816 |
| π | 11.6 | 1,082.4 | 0.7 | Ref 21 | 4.5967 | 6.834 |
| LiNbO3 σ | 7.5 | 1,093.4 | 0.66 | Ref 21 | 4.6417 | 6.920 |
| π | 27.0 | 1,084.9 | 0.66 | Ref 21 | 4.9768 | 7.194 |
| CaWO4 | 18 | 1,057.8 | 1.0 | Ref 22 | 3.5824 | 8.710 |
| YVO4 σ | 29.5 | 1,066 | 1.00 | Ref 23 | 4.6975 | 10.547 |
| π | 141 | 1,064 | 1.00 | Ref 23 | 3.8338 | 9.280 |
| YVO4 | 65 | 1,063.5 | 1.0 | Ref 23 | 4.6980 | 10.548 |
| YAl3(BO3)4 | 23 | 1,060 | 5.5 | Ref 24 | 2.9036 | 16.740 |
| NaGd(WO4)2 | 9.4 | 1,058 | 1.0 | Ref 22 | 3.61 | 17.314 |
| LiNdP4O12 | 32 | 1,047.2 | 30.9 | Refs 2 , 10 | 2.5281 | 18.432 |
| NdAl3(BO3)4 | 100 | 1,063.5 | 31.3 | Refs 2 , 10 | 3.2041 | 18.718 |
| KY(WO4)2 | 5.3 | 1,060 | 4.57 | Ref 25 | 4.0319 | 18.930 |
| KLa(MoO4)2 σ | 7.7 | 1,060 | 5.2 | Ref 26 | 3.6749 | 20.180 |
| π | 9.7 | 1,060 | 5.2 | Ref 26 | 3.6481 | 20.073 |
| NdP5O14 | 20 | 1,051.2 | 27.6 | Refs 2 , 10 | 2.5345 | 20.823 |
| Y3Al5O12 | 28 | 1,064 | 2.98 | Refs 27 , 28 , 29 | 3.3043 | 22.419 |
| Y3Al5O12 | 38 | 1,064 | 1.1 | Ref 22 | 3.3043 | 22.419 |
| Gd3Ga5O12 | 21 | 1,062.1 | 1.68 | Ref 30 | 3.7778 | 27.485 |
Ho3+ ions doped crystals.
| Ho3+: crystal | σ е (10−24 m2) | λ е (nm) | c (Ho3+) (mol.%) | Ref. | n λ 2 | α v (10−30 m3) |
|---|---|---|---|---|---|---|
| LaF3 | 0.33 | 2,050 | 2.92 | Ref 31 | 2.5176 | 4.392 |
| LaF3 | 0.39 | 1,930 | 1.03 | Ref 32 | 2.5179 | 4.392 |
| LiYF4 | 1.84 | 2,050 | 0.278 | Ref 31 | 2.1127 | 4.601 |
| LiYF4 σ | 0.83 | 2,062 | 0.5 | Ref 33 | 2.1592 | 4.740 |
| π | 1.5 | 2,050 | 0.5 | Ref 33 | 2.0798 | 4.501 |
| LiLuF4 σ | 0.67 | 2,066 | 1.0 | Ref 34 | 2.1550 | 4.594 |
| π | 1.3 | 2,060 | 1.0 | Ref 34 | 2.2320 | 4.811 |
| LiLuF4 E‖a | 1.7 | 2,840 | 1.0 | Ref 34 | 2.1550 | 4.594 |
| b | 1.2 | 2,898 | 1.0 | Ref 34 | 2.2320 | 4.811 |
| c | 0.59 | 2,944 | 1.0 | Ref 34 | 2.2320 | 4.811 |
| YAlO3 | 0.82 | 2,118 | 1.00 | Ref 31 | 3.6124 | 5.652 |
| YAlO3 E‖a | 0.74 | 1,977 | 1.0 | Ref 35 | 3.6114 | 5.651 |
| b | 0.81 | 2,056 | 1.0 | Ref 35 | 3.6797 | 5.729 |
| c | 0.64 | 2,117 | 1.0 | Ref 35 | 3.7116 | 5.765 |
| YVO4 | 2.6 | 2,040 | 0.41 | Ref 36 | 4.6209 | 10.45 |
| YVO4 | 1.8 | 2,008 | 0.41 | Ref 36 | 4.6218 | 10.45 |
| Y3Al5O12 | 0.98 | 2,098 | 0.97 | Ref 31 | 3.2472 | 22.10 |
| Y3Al5O12 | 1.62 | 2,090 | 1.0 | Ref 37 | 3.2477 | 22.10 |
| Y3Al5O12 | 0.80 | 2,021 | 1.0 | Ref 37 | 3.2515 | 22.13 |
Er3+ ions doped crystals.
| Er3+: crystal | σ е (10−24 m2) | λ е (nm) | c (Er3+) (mol.%) | Ref. | n λ 2 | α v (10−30 m3) |
|---|---|---|---|---|---|---|
| CaF2 | 0.95 | 2,725 | 10.34 | Ref 38 | 2.0156 | 2.462 |
| CaF2 | 0.38 | 2,800 | 10.34 | Ref 38 | 2.0142 | 2.459 |
| BaF2 | 1.425 | 551 | 2 | Ref 39 | 2.1073 | 3.879 |
| LaF3 | 0.37 | 1,568 | 1.28 | Ref 31 | 2.5196 | 4.396 |
| LiYF4 | 0.42 | 1,615 | 9.63 | Ref 31 | 2.1592 | 4.740 |
| YAlO3 | 0.31 | 1,625 | 2.11 | Ref 31 | 3.6074 | 5.647 |
| YAlO3 E‖x | 0.82 | 1,515 | 1 | Ref 40 | 3.6056 | 5.644 |
| y | 0.94 | 1,515 | 1 | Ref 40 | 3.6865 | 5.737 |
| z | 1.19 | 1,515 | 1 | Ref 40 | 3.7191 | 5.774 |
| YPO4 σ | 1.66 | 1,538 | 0.6 | Ref 41 | 3.2979 | 7.336 |
| π | 1.14 | 1,538 | 0.6 | Ref 41 | 3.3379 | 7.408 |
| YAl3(BO3)4 σ | 1.26 | 1,529 | 5.97 | Ref 42 | 2.9036 | 16.74 |
| π | 0.71 | 1,529 | 5.97 | Ref 42 | 3.1613 | 18.06 |
| Y3Al5O12 | 2.6 | 2,936 | 1 | Ref 15 | 3.1929 | 21.79 |
| Y3Al5O12 | 0.45 | 2,940 | 2 | Ref 43 | 3.3241 | 22.53 |
| Y3Al5O12 | 0.45 | 1,644 | 1.73 | Ref 31 | 3.3308 | 22.56 |
Tm3+ ions doped crystals.
| Tm3+: crystal | σ е (10−24 m2) | λ е (nm) | c (Tm3+) (mol.%) | Ref. | n λ 2 | α v (10−30 m3) |
|---|---|---|---|---|---|---|
| CaF2 | 0.39 | 1,842 | 1.34 | Ref 44 | 2.0296 | 2.487 |
| LaF3 | 0.25 | 1,850 | 0.323 | Ref 31 | 2.5182 | 4.393 |
| LaF3 | 0.28 | 1,840 | 1.03 | Ref 14 | 2.5183 | 4.393 |
| LiYF4 | 0.33 | 1,902 | 0.955 | Ref 31 | 2.0824 | 4.509 |
| LiYF4 | 0.44 | 1,910 | 3.5 | Ref 45 | 2.0824 | 4.509 |
| LiLuF4 | 0.4 | 1,911 | 8 | Ref 46 | 2.1550 | 4.594 |
| YAlO3 | 0.50 | 1,936 | 0.671 | Ref 31 | 3.6110 | 5.651 |
| YAlO3 | 0.4 | 1,940 | 4 | Ref 47 | 3.6110 | 5.651 |
| YAlO3 | 0.433 | 2,000 | 6 | Ref 48 | 3.6115 | 5.651 |
| LiTaO3 | 2.2 | 1,761 | 0.5 | Ref 49 | 4.4842 | 6.735 |
| LiNbO3 | 0.552 | 1,757 | 2 | Ref 50 | 4.5469 | 6.838 |
| YVO4 | 1.6 | 1,800 | 5 | Ref 51 | 4.6290 | 10.46 |
| Y3Al5O12 | 0.2 | 2,020 | 12 | Ref 52 | 3.2516 | 22.13 |
| Gd3Ga5O12 | 0.105 | 1,990 | 6.78 | Ref 53 | 3.7189 | 27.18 |
| Gd3Ga5O12 | 0.148 | 1,432 | 6.78 | Ref 53 | 3.7494 | 27.34 |
In Table 1, the concentrations of Nd3+ ions doped in YAlO3, as well as in Y3Al5O12 and Y2O3, have not been explicitly given in Ref. 20 . It is seen in the same table that while fluorides exhibit the lowest values of polarizability volumes α v, the highest values are those of garnets, especially gadolinium gallium garnet. This may be attributed mainly to the ratio M/ρ and, to a lesser extent, to the indices of refraction. The polarizability of the active ions α (Nd3+) = 0.955 × 10⁻³⁰ m3. 11 LiNbO3 and LiTaO3 single crystals doped with Nd3+ ions present special interest due to high electrooptical and linear coefficients of the crystal hosts providing frequency doubling in the gain material. 21
Further, it is useful to normalize the polarizability volumes by means of Equation (4). Such a procedure provides an estimate of the deviations for each crystal host while the dopant ion is kept constant. The dashed lines in Figures 1–4 represent the upper limit at β = 1 with polarizability of the crystal matrices only, i.e. excluding contributions from polarizabilities of the dopant, cα (Ln3+). Except crystals of stoichiometric Nd compounds in Figure 1, the deviations are below β = 1 and small for all doped crystal lattices and for all of the studied ions. These results are mainly due to the low concentration of the doped Ln3+ ions which in turn is a proportionality coefficient to the electric polarizability of the corresponding lanthanide ion, α (Ln3+). The stoichiometric Nd crystals exhibit emission cross-sections nearly in the same range of values but at lower relative polarizability volumes. This fact may be added to their advantages compared to the other transparent crystals doped with Nd3+ ions.
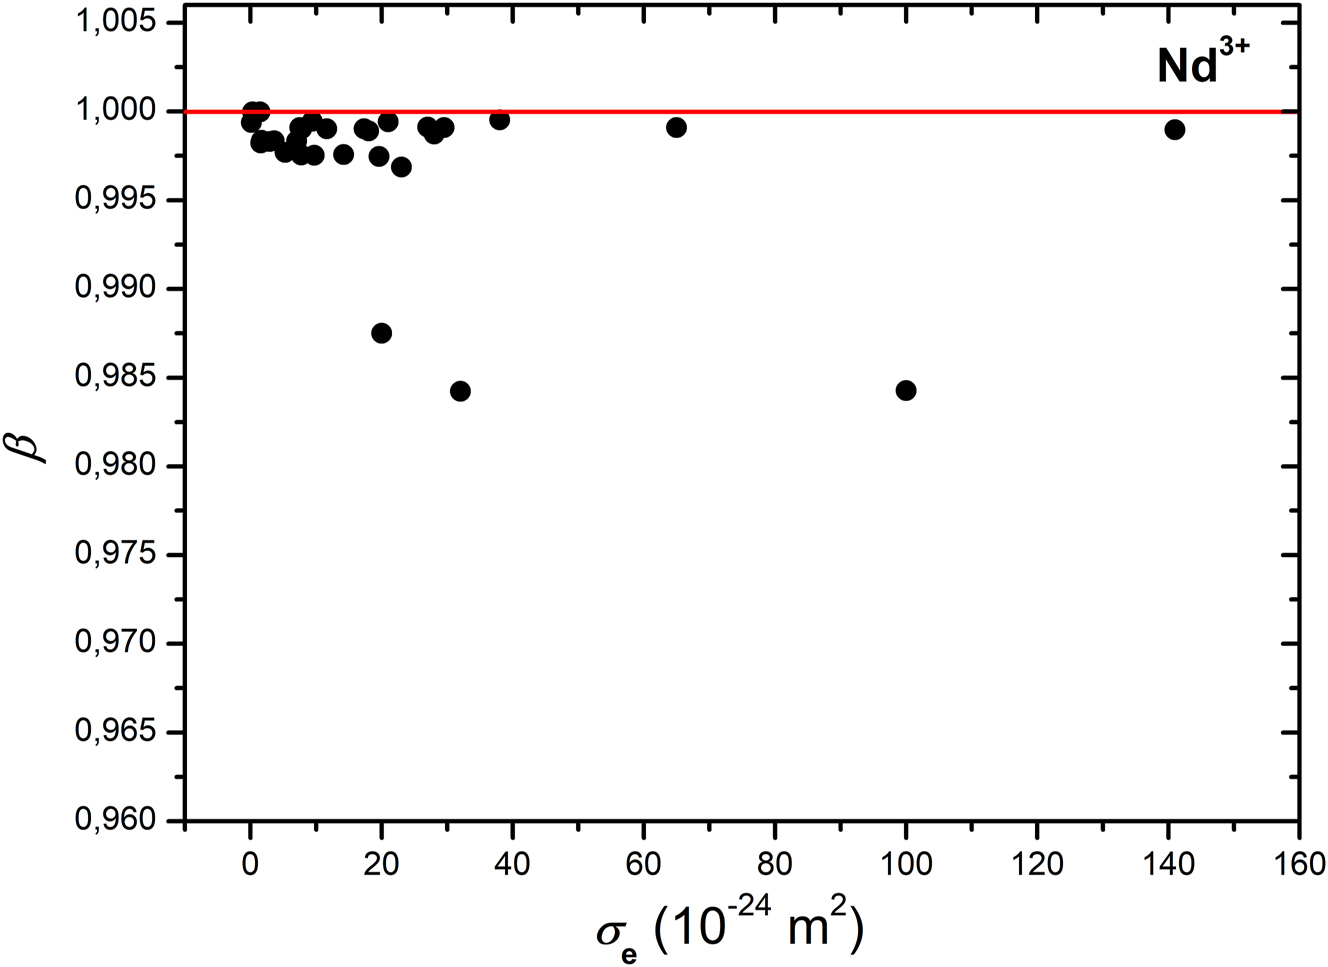
Correspondence between relative polarizability volumes β and emission cross-sections σ e in crystals containing Nd3+ ions (the lowest three points, from left to right, pertain to NdP5O14, LiNdP4O12, and NdAl3(BO3)4, respectively).

Relative polarizability volumes β versus emission cross-sections σ e in Ho3+ activated crystals (the lowest point is of LaF3 crystal).
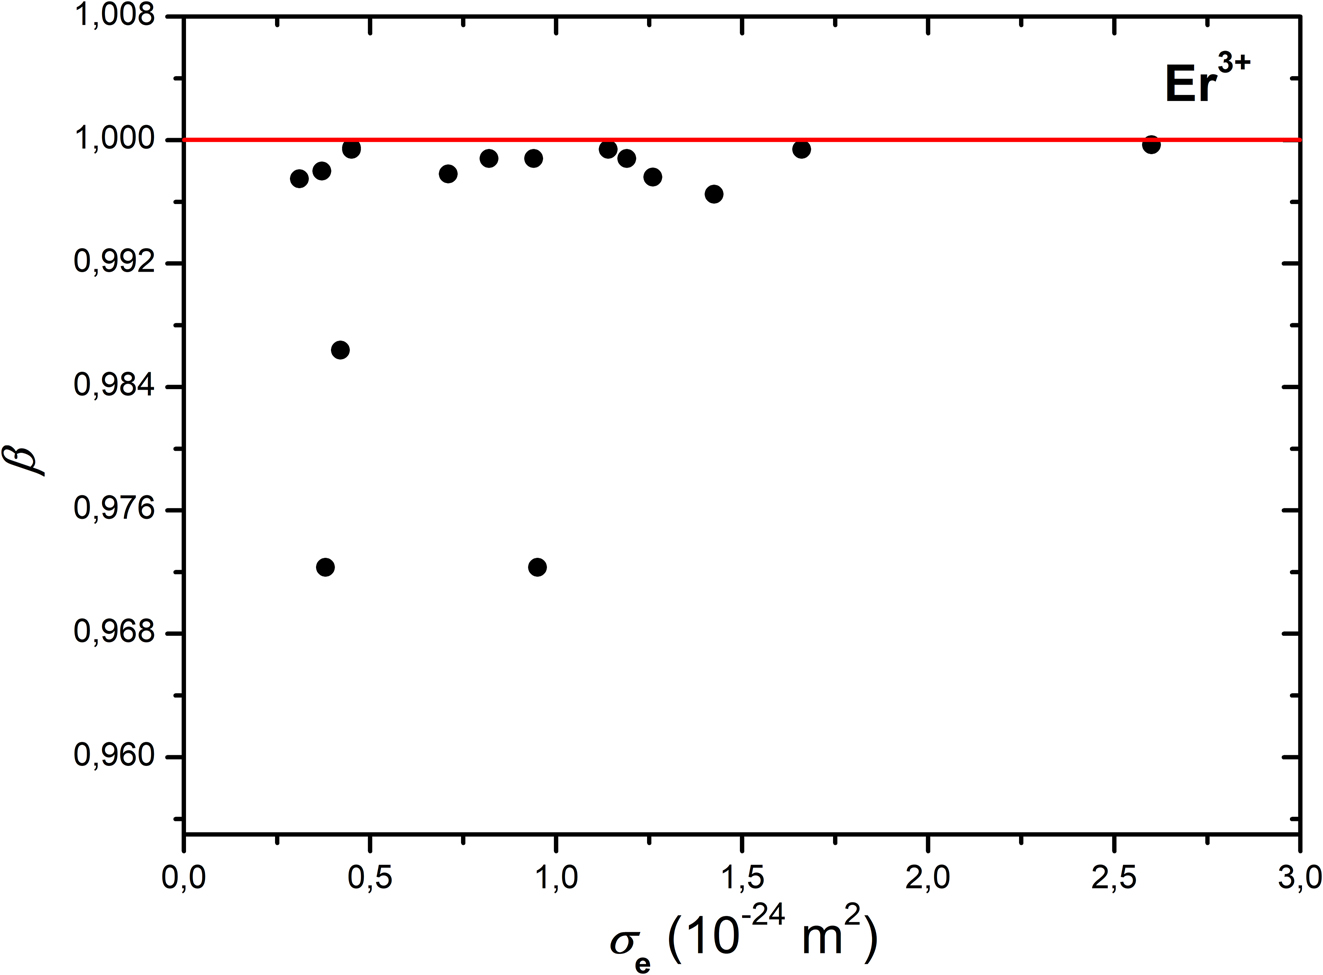
Dependence of relative polarizability volumes β on emission cross-sections σ e in Er3+ doped crystals (the lowest two points pertain to CaF2, that above – to LiYF4).

Relative polarizability volumes β as a function of the emission cross-sections σ e in Tm3+ doped crystals (the lowest 4 points present LiLuF4 and YAlO3 (3) crystals).
For Ho3+ -doped crystals in Table 4, YVO4 takes an intermediate position in relative polarizability volumes β between fluorides and garnets due to high M/ρ ratio and high indices of refraction. The variation of the normalized polarizability volumes versus emission cross-sections for the same ion is shown in Figure 2. It is seen that the reductions from β = 1 are small mainly because of the low concentrations c(Ho3+) with α(Ho3+) = 0.702 × 10⁻³⁰ m3. 11
It is known that the emission cross-section of Ho3+: YVO4 is higher than that for Ho3+: Y3Al5O12 36 (in Table 4), whereas the comparison between the polarizability volumes α v for the same crystals is vice versa, with emission transitions of the same type (5I7 → 5I8) and at close wavelengths, ca. 2.0 μm. As the same situation occurs with Nd3+ ions in the same matrices, it may be concluded that relatively soft crystals, in terms of lower polarizability volumes, produce higher emission cross-sections.
The crystals doped with Er3+ ions (Table 5), lasing at 1.55 μm and near 2.9 μm reveal the same small deviations from β = 1; here, only Er3+: BaF2 crystal may be exemplified with a stimulated emission at 0.55 μm. With α (Er3+) = 0.678 × 10⁻³⁰ m3, 11 the most distinct reductions in Figure 3 pertain to CaF2 and LiYF4 crystals doped with Er3+ ions. In this regard, it should be noted the deviation seen in Figure 3 for the heavily doped single crystal of Er3: CaF2 38 and Er3+: LiYF4. 31 It is noteworthy the discrepancy in the emission cross-sections data of Er3+: Y3Al5O12 from two sources 15 , 43 in Table 5. Those with almost identical wavelengths (2.9 μm) of the transition 4I11/2 → 4I13/2 differ six times in magnitude, being reported in one and the same year. The origin of this discrepancy may be assigned either to the method and techniques for measurements in the mid-IR of the electromagnetic spectrum, to certain optical inhomogeneity or to traces of other Ln3+ ions in the crystal samples.
The polarizability volume of YVO4 (Table 6) is intermediate between those of fluorides, certain complex oxides and garnets whereas the lowest values of relative polarizability volumes β correspond to LiLuF4 and YAlO3 crystals doped with Tm3+ ions (Figure 4); the polarizability α (Tm3+) = 0.658 × 10⁻³⁰ m3. 11 Tunable stimulated emissions have been observed at room temperature in Tm3+: CaF2 crystal. 44 It should be noted again the inverse dependence between emission cross-sections and polarizability volumes of simple fluorides (CaF2, LaF2) and garnets (Y3Al5O12, Gd3Ga5O12) at close wavelengths, around 1.9 μm of the transition 3F4 → 3H6. As far as the emission cross section σ e is inversely proportional to the lifetime τ of the stimulated-emission transition. 2 It may be concluded that increased polarizability volumes may serve as an additional operational characteristic in this respect, indicating higher lifetime of laser generation.
In order to examine the dependences between emission cross-sections σ e and polarizability volumes α v for given crystal lattice, we have verified the corresponding variations in Ln3+: Y3 Al5O12 (Figure 5), Ln3+: YAlO3 (Figure 6), and Ln3+: LiYF4 (Figure 7). It is noteworthy that the mentioned crystal hosts differ in basic properties: structural, optical, and thermo-mechanical. YAG is cubic and isotropic while YAlO3 is biaxial and anisotropic, 13 , 35 , 54 LiYF4 is also anisotropic but exhibiting negative temperature dependence of the refraction index. 19 It has been found in the present work that despite these differences, doping with Nd3+ ions in each of the crystal matrices results in the largest values of stimulated emission cross-sections σ e or polarizability volumes α v or both, compared with Ho3+, Er3+, and Tm3+ ions. This fact may be explained with the energy-level scheme in Nd3+ -doped crystals: stimulated-emission transitions in the near-infrared region, with the largest energy-level differences at low terminal levels compared to the other mentioned Ln3+ ions.

Correspondence between emission cross-sections σ e and polarizability volumes α v for Ln3+ ions (Ln = Nd, Ho, Er, Tm) doped in Y3Al5O12 (both points on the top pertain to Nd3+).

Emission cross-sections σ e dependence on polarizability volumes α v for Ln3+ ions (Ln = Nd, Ho, Er, Tm) doped in YAlO3 (the two highest points are those of Nd3+).

Dependence of emission cross-sections σ e on polarizability volumes α v for Ln3+ ions (Ln = Nd, Ho, Er, Tm) doped in LiYF4 (the two points on the right pertain to Nd3+).
Whereas the absorption cross-sections are related to channels for optical pumping and to those for re-absorption, 31 the cross-sections σ e of stimulated-emission transitions present key spectroscopic quantities directly employed in characterization of laser transitions. 30 The latter are linked with the line-shape or spectral density-of-states function, F(ν), as evident in numerous studies applying either method for determination of σ e: the reciprocity method or the Fuchtbauer–Ladenburg method. 15 , 22 , 30 , 31 , 32 , 34 , 39 , 41 , 43 On the other side, the bands of the same 4f–4f transitions are observed in insulating transparent crystals. Hence, both phenomena, emission transitions and polarizability, are complementary. Molecular polarizability has been included in unified treatment of nephelauxetic parameters within the framework of the dielectric screening model in single crystals containing Pr3+, 55 Nd3+, 56 and Tm3+ 57 ions.
4 Conclusions
Following the above considerations, the polarizability volumes have been determined for host dielectric crystals of simple and complex fluorides and complex oxides, as well as of certain stoichiometric laser crystals containing Nd3+ as constituents of the respective lattices. The introduced relative polarizability volumes have revealed that the dopant Nd3+, Ho3+, Er3+, or Tm3+ ions at low molar concentrations give small contributions to the overall polarizabilities of the crystal lattices, except for Nd3+ ions in stoichiometric compounds. The dependences between polarizability volumes and stimulated-emission cross-sections exhibit different points for Nd3+ ions doped in Y3Al5O12, YAlO3, and LiYF4 compared to the other mentioned Ln3+ ions in the same lattices. It is expected that the polarization effects highlighted in this work would promote further studies: ab initio calculations on polarizabilities of lanthanide laser crystals and on the special position of Nd3+ ions in regard to the emission cross-sections in dielectric crystals.
-
Research ethics: Not applicable.
-
Author contributions: The authors have accepted responsibility for the entire content of this manuscript and approved its submission. Dimitar N. Petrov: conceptualization; investigation; writing-review and editing; visualization. Bogdan M. Angelov: methodology; writing-original draft. The Phan Long: data curation; formal analysis; resources.
-
Competing interests: The authors state no conflict of interest.
-
Research funding: None declared.
-
Data availability: Not applicable.
References
1. Ma, C.-G.; Brik, M. G.; Li, Q.-X.; Tian, Y. J. Alloys Compd. 2014, 599, 93. https://doi.org/10.1016/j.jallcom.2014.02.044.Search in Google Scholar
2. Kaldis, E., Ed. Current Topics in Materials Science; North-Holland Publ. Co: Amsterdam, New York, 1980; p. 45.Search in Google Scholar
3. Sato, Y.; Taira, T. Opt. Mater. Express 2011, 1, 514. https://doi.org/10.1364/OME.1.000514.Search in Google Scholar
4. Miniscalco, W. J.; Quimby, R. S. Opt. Lett. 1991, 16, 258. https://doi.org/10.1364/OL.16.000258.Search in Google Scholar
5. Quimby, R. S. J. Appl. Phys. 2002, 92, 180. https://doi.org/10.1063/1.1485112.Search in Google Scholar
6. Powell, R. C.; Payne, S. A.; Chase, L. L.; Wilke, G. D. Opt. Lett. 1989, 14, 1204. https://doi.org/10.1364/OL.14.001204.Search in Google Scholar PubMed
7. Brinck, T.; Murray, J. S.; Politzer, P. J. Chem. Phys. 1993, 98, 4305. https://doi.org/10.1063/1.465038.Search in Google Scholar
8. Politzer, P.; Jin, P.; Murray, J. S. J. Chem. Phys. 2002, 117, 8197. https://doi.org/10.1063/1.1511180.Search in Google Scholar
9. Weber, M. J., Ed. CRC Handbook of Laser Science and Technology; CRC Press: Boca Raton, 1982; p. 147.Search in Google Scholar
10. Atkins, P.; De Paula, J. Physical Chemistry; Oxford University Press: Oxford, 2006.Search in Google Scholar
11. Clavaguéra, C.; Dognon, J. P. Chem. Phys. 2005, 311, 169. https://doi.org/10.1016/j.chemphys.2004.10.014.Search in Google Scholar
12. Lide, D. CRC Handbook of Chemistry and Physics; CRC Press: Boca Raton, 2004.Search in Google Scholar
13. Weber, M. J. Handbook of Optical Materials; CRC Press: Boca Raton, 2003.Search in Google Scholar
14. Hong, J.; Zhang, L.; Xu, M.; Hang, Y. Infrared Phys. Technol. 2017, 82, 50. https://doi.org/10.1016/j.infrared.2017.02.012.Search in Google Scholar
15. Payne, S. A.; Smith, L. K.; Krupke, W. F. J. Appl. Phys. 1995, 77, 4274. https://doi.org/10.1063/1.359449.Search in Google Scholar
16. Wang, Q.; Su, L.; Li, H.; Zheng, L.; Guo, X.; Jiang, D.; Zhao, H.; Xu, J.; Ryba-Romanowski, W.; Solarz, P.; Lisiecki, R. J. Alloys Compd. 2011, 509, 8880. https://doi.org/10.1016/j.jallcom.2011.05.022.Search in Google Scholar
17. Payne, S. A.; Caird, J. A.; Chase, L. L.; Smith, L. K.; Nielsen, N. D.; Krupke, W. F. J. Opt. Soc. Am. B 1991, 8, 726. https://doi.org/10.1364/JOSAB.8.000726.Search in Google Scholar
18. Ryan, J. R.; Beach, R. J. Opt. Soc. Am. B 1992, 9, 1883. https://doi.org/10.1364/JOSAB.9.001883.Search in Google Scholar
19. Zhao, Ch.; Zhang, L.; Hang, Y.; He, X.; Yin, J.; Hu, P.; Chen, G.; He, M.; Huang, H.; Zhu, Y. J. Phys. D Appl. Phys. 2010, 43, 495403. https://doi.org/10.1088/0022-3727/43/49/495403.Search in Google Scholar
20. Kück, S.; Foznasiero, L.; Mix, E.; Huber, G. Appl. Phys. B 1998, 67, 151. https://doi.org/10.1007/s003400050486.Search in Google Scholar
21. Burlot, R.; Moncorge, R.; Manaa, H.; Boulon, G.; Guyot, Y.; Garcia Sole, J.; Cochet-Muchy, D. Opt. Mater. 1996, 6, 313. https://doi.org/10.1016/S0925-3467(96)00047-X.Search in Google Scholar
22. Faure, N.; Borel, C.; Couchand, M.; Basset, G.; Templier, R.; Wyon, C. Appl. Phys. B 1996, 63, 593. https://doi.org/10.1007/BF01830998.Search in Google Scholar
23. Sato, Y.; Taira, T. IEEE J. Sel. Top. Quant. Electron. 2005, 11, 613. https://doi.org/10.1109/JSTQE.2005.850569.Search in Google Scholar
24. Jaque, D.; Garcia Sole, J. Chem. Phys. Lett. 2001, 334, 309. https://doi.org/10.1016/S0009-2614(00)01424-X.Search in Google Scholar
25. Han, M. M.; Wang, G. F. Cryst. Growth 2003, 247, 551. https://doi.org/10.1016/S0022-0248(02)02050-X.Search in Google Scholar
26. Cavalli, E.; Zannoni, E.; Mucchino, C.; Carozzo, V.; Toncelli, A.; Tonelli, M.; Bettinelli, M. J. Opt. Soc. Am. B 1999, 16, 1958. https://doi.org/10.1364/JOSAB.16.001958.Search in Google Scholar
27. Kushida, T.; Marcos, H. M.; Geusic, J. E. Phys. Rev. 1968, 167, 289. https://doi.org/10.1103/PhysRev.167.289.Search in Google Scholar
28. Singh, S.; Smith, R. G.; Van Uitert, L. G. Phys. Rev. B 1974, 10, 2566. https://doi.org/10.1103/PhysRevB.10.2566.Search in Google Scholar
29. Lu, J.; Prabhu, M.; Song, J.; Li, C.; Xu, J.; Ueda, K.; Kaminskii, A. A.; Yagi, H.; Yanagitani, T. Appl. Phys. B 2000, 71, 469. https://doi.org/10.1007/s003400000394.Search in Google Scholar
30. Rotter, M. D.; Dane, B. Opt. Commun. 2001, 198, 155. https://doi.org/10.1016/S0030-4018(01)01507-3.Search in Google Scholar
31. Payne, S. A.; Chase, L. L.; Smith, L. K.; Kway, W. L.; Krupke, W. F. IEEE J. Quant. Electron. 1992, 28, 2619. https://doi.org/10.1109/3.161321.Search in Google Scholar
32. Hong, J.; Zhang, L.; Zhang, P.; Xu, M.; Hang, Y. Infrared Phys. Technol. 2016, 76, 636. https://doi.org/10.1016/j.infrared.2016.04.024.Search in Google Scholar
33. Walsh, B. M.; Barnes, N. P.; Bartolo, B. D. J. Appl. Phys. 1998, 83, 2772. https://doi.org/10.1063/1.367037.Search in Google Scholar
34. Zhao, C.; Hang, Y.; Zhang, L.; Yin, J.; Hu, P.; Ma, E. Opt. Mater. 2011, 33, 1610. https://doi.org/10.1016/j.optmat.2011.04.010.Search in Google Scholar
35. Dong, Q.; Zhao, G.; Cao, D.; Yao, B.; Yang, X.; Yu, Z. J. Phys. D Appl. Phys. 2009, 42, 045114. https://doi.org/10.1088/0022-3727/42/4/045114.Search in Google Scholar
36. Golab, S.; Solarz, P.; Dominak-Dzik, G.; Lukasiewicz, T.; Swirkowicz, M.; Ryba-Romanowski, W. Appl. Phys. B 2002, 74, 237. https://doi.org/10.1007/s003400200791.Search in Google Scholar
37. Kwiatkowski, J.; Jabczynski, J. K.; Gorajek, L.; Zendzian, W.; Jelinkova, H.; Sule, J.; Nemec, M.; Koranda, P. Laser Phys. Lett. 2009, 6, 531. https://doi.org/10.1002/lapl.200910031.Search in Google Scholar
38. Labbe, C.; Donalan, J. L.; Camy, P.; Moncorge, R.; Thuau, M. Opt. Commun. 2002, 209, 193. https://doi.org/10.1016/S0030-4018(02)01628-0.Search in Google Scholar
39. Bitam, A.; Khiari, S.; Diaf, M.; Boubekri, H.; Boulma, E.; Bensalem, C.; Guerbous, L.; Jouart, J. P. Opt. Mater. 2018, 82, 104. https://doi.org/10.1016/j.optmat.2018.05.034.Search in Google Scholar
40. Dong, Q.; Zhao, G.; Cao, D.; Chen, J.; Ding, W. J. Alloys Compd. 2010, 493, 661. https://doi.org/10.1016/j.jallcom.2009.12.182.Search in Google Scholar
41. Che, Y.; Zheng, F.; Dou, C.; Yin, Y.; Wang, Z.; Zhong, D.; Sun, S.; Teng, B. J. Alloys Compd. 2021, 859, 157854. https://doi.org/10.1016/j.jallcom.2020.157854.Search in Google Scholar
42. You, W.; Lin, Y.; Chen, Y.; Luo, Z.; Huang, Y. Opt. Mater. 2007, 29, 488. https://doi.org/10.1016/j.optmat.2005.11.013.Search in Google Scholar
43. Koetke, J.; Huber, G. Appl. Phys. B 1995, 61, 151. https://doi.org/10.1007/BF01090936.Search in Google Scholar
44. Camy, P.; Donalan, J. L.; Renard, S.; Braud, A.; Menard, V.; Moncorge, R. Opt. Commun. 2004, 236, 395. https://doi.org/10.1016/j.optcom.2004.03.055.Search in Google Scholar
45. Dergachev, A.; Wall, K.; Moulton, P. F. Adv. Solid State Lasers 2002, 68, 343. https://doi.org/10.1364/ASSL.2002.WA1.Search in Google Scholar
46. Coluccelli, N.; Galzerano, G.; Laporta, P.; Cornacchia, F.; Parisi, D.; Tonelli, M. Opt. Lett. 2007, 32, 2040. https://doi.org/10.1364/OL.32.002040.Search in Google Scholar
47. Stoneman, R. C.; Esterowitz, L. IEEE J. Sel. Top. Quant. Electron. 1995, 1, 78. https://doi.org/10.1109/2944.468368.Search in Google Scholar
48. Lu, Y. L.; Dai, Y. B.; Yang, Y.; Wang, J.; Dong, A. P.; Sun, B. D. J. Alloys Compd. 2008, 453, 482. https://doi.org/10.1016/j.jallcom.2006.11.178.Search in Google Scholar
49. Gong, J.; Zhao, C. C.; Yin, J. G.; Hu, P. C.; He, X. M.; Hang, Y. Laser Phys. 2012, 22, 455. https://doi.org/10.1134/S1054660X12020107.Search in Google Scholar
50. Zhang, P. X.; Yin, J. G.; Zhang, R.; Li, H. Q.; Xu, J. Q.; Hang, Y. Laser Phys. 2014, 24, 035805. https://doi.org/10.1088/1054-660X/24/3/035805.Search in Google Scholar
51. Ohta, K.; Saito, H.; Obara, M. J. Appl. Phys. 1993, 73, 3149. https://doi.org/10.1063/1.353005.Search in Google Scholar
52. Stoneman, R. C.; Esterowitz, L. Opt. Lett. 1990, 15, 486. https://doi.org/10.1364/OL.15.000486.Search in Google Scholar PubMed
53. Zhou, H.; Ma, X.; Chen, G.; Lu, W.; Wang, Y.; You, Zh.; Li, J.; Zhu, Zh.; Tu, C. J. Alloys Compd. 2009, 475, 555. https://doi.org/10.1016/j.jallcom.2008.07.084.Search in Google Scholar
54. Gschneidner, K. A.Jr.; Bünzli, J.-C. G.; Pecharski, V. K., Eds. Handbook on the Physics and Chemistry of Rare Earths; Elsevier: Amsterdam, 2009; p. 113.Search in Google Scholar
55. Tanner, P.; Yeung, Y. Y. J. Phys. Chem. A 2013, 117, 10726. https://doi.org/10.1021/jp408625s.Search in Google Scholar PubMed
56. Petrov, D.; Angelov, B. Spectrochim. Acta A 2014, 118, 199. https://doi.org/10.1016/j.saa.2013.08.108.Search in Google Scholar PubMed
57. Petrov, D. Spectrochim. Acta A 2015, 151, 415. https://doi.org/10.1016/j.saa.2015.06.118.Search in Google Scholar PubMed
© 2024 Walter de Gruyter GmbH, Berlin/Boston
Articles in the same Issue
- Frontmatter
- Original Papers
- Polarizabilities and emission cross-sections of lanthanide laser crystals
- Wet-chemical synthesis and luminescence studies of nano-crystalline gadolinium gallium garnet
- Synthesis of carbon nanotube–iron oxide and silver nanocomposites as photocatalyst in removing carcinogenic aromatic dyes
- Influence of annealing temperature on the structure, morphology, optical property and antibacterial response of phytochemicals-assisted synthesized zinc oxide nanoparticles
- Study on the magnetic properties and critical behavior of CoFe2−xAl x O4 (x = 1.0 and 1.2) spinel ferrite
- Experimental study on selected properties and microstructure of pine-based wood ceramics
- Muga (Antheraea assamensis) silk electrospun scaffold for biomedical applications
- First-principles calculations of the mechanical properties of Mg2Si intermetallic via ternary elements doping
- Effects of Zr additions and process annealing on mechanical and corrosion properties of AA5383 Al–Mg alloys
- Study on the effect of LuCl3 doping on the characteristics of titanium alloy micro-arc oxidation coatings
- News
- DGM – Deutsche Gesellschaft für Materialkunde