β-Amyloid peptide modulates peripheral immune responses and neuroinflammation in rats
-
Krishnendu Adhikary

 and
Prithviraj Karak
and
Prithviraj Karak

Abstract
Alzheimer’s disease (AD) is characterized by immune system dysregulation, impacting both central and peripheral immune responses. The study aimed to investigate the mechanism behind the neurotoxic effects of β-amyloid (Aβ) peptide in the rat brain including the study of neuroinflammation, neurodegeneration, and alterations in peripheral immune responses (PIR). The neuroinflammation brought on by Aβ1–42 and is unknown to influence PIR. Animal models were prepared, after 28 days, control, sham, and treated rats were anaesthetized and inflammatory markers of hippocampus and serum levels (reactive oxygen species, nitrite, tumor necrosis factor-α, and interleukin-1β), and some markers of PIR (splenic mononuclear cells or MNC, cytotoxicity and phagocytic index of the white blood cells leukocyte adhesion inhibition index or LAI), as well as polymorphonuclear cells of the spleen, were assessed. In addition to changes in peripheral immune responses, the present study found that AD rats had higher blood levels of inflammatory markers. Based on the study, the immune system irregularities observed in AD rats in the peripheral regions might be connected to neuroinflammation, which is facilitated by a compromised blood–brain barrier. Hence, it is viable to propose that the neuroinflammatory condition in rats with Aβ-induced AD could modify immune responses in the peripheral areas with significantly higher levels of inflammatory cytokines markers in the hippocampal tissue in Aβ-injected AD rats.
Introduction
Alzheimer’s disease (AD) is a progressive neurological condition that has been linked to dementia in the aged population globally [1,2]. AD is characterized by two important neuropathological features; intracellular neurofibrillary tangles made of hyperphosphorylated β-amyloid (Aβ) peptide and extracellular senile or neuritic plaques [3,4]. AD origins are frequently classified as sporadic or familial. While sporadic AD accounts for 90–95% of all cases [5,6], familial instances are uncommon (0.1%) and are linked to mutations in the presenilin-1 (PSEN-1), presenilin-2 (PSEN-2), and β-amyloid precursor protein (APP) genes [7,8]. Even though the etiology of AD is complex, the majority of studies has concentrated on the role of the β-amyloid peptide in its formation [9]. According to the “amyloid cascade hypothesis,” the primary cause of the pathogenesis of AD is a result of abnormal amyloid synthesis, aggregation, and deposition [10]. The transmembrane protein APP is successively cleaved by the secretases and results in the production of an Aβ40 and an Aβ42 [11]. The commencement of the amyloid-β cascade is believed to be triggered by elevated levels of Aβ42 particularly, which engages in the formation of soluble dimers, trimers, and oligomers with limited order. Further aggregation results in the formation of insoluble, proteolysis-resistant fibrils, which accumulate as β-amyloid deposits or plaques [12]. An increase in studies, demonstrating the toxicity of various species in vitro and in vivo has supported the idea that age-dependent accumulation plays a role in the pathogenesis of AD [13]. This buildup of β-amyloid is thought to be neurotoxic and may cause oxidative stress, inflammation, synaptic dysfunction, nitrosative stress, and ultimately, these conditions result in progressive neurodegeneration [14]. As a result, there is damage in neurons which is essential for the progression of the illness. Aβ is the principal component of senile plaques [15]. To study the neural degeneration and distinctive neural degeneration condition seen in the AD brain, numerous studies have injected β-amyloid peptide into the brain ventricles of mice and rats [16]. While limited research has been conducted in this domain, the emergence of neuroinflammation in Aβ-AD mice could potentially influence peripheral immune responses by causing the release of inflammatory cytokine mediators through a compromised blood–brain barrier. The objective of our study is to assess peripheral immunological parameters (like splenic mononuclear cell cytotoxicity, leucocyte adhesion inhibition index, engulfing the blood white blood cell (WBC), and splenic polymorphonuclear leukocyte (PMN)) and also to assess how Aβ-induced neuroinflammation affects those values. The main goal of this study is to investigate how rat neuroinflammatory indicators and a few specific peripheral immunological parameters are affected by intracerebroventricular (ICV) injection of the protein β-amyloid [17]. We performed the inflammatory cytokines markers (tumor necrosis factor-α (TNF-α), interleukin-1β, reactive oxygen species [ROS], and nitrite) in the hippocampus in Aβ-AD rats, placebo rats, and rats that underwent sham surgery (received phosphate-buffer saline or PBS) [18]. We set out to measure the concentrations of ROS, nitrite, TNF-α, and interleukin-1β and nitrite in the serum of placebo, sham-treatment, and rats affected by Aβ-induced Alzheimer’s disease (Aβ-AD), as well as in Aβ-AD-affected rats. To explore systemic immune parameters in experimental AD rats (Aβ-AD rats), as well as in placebo or control and sham-treated rats. This includes assessing the engulfing of blood WBC and polymorphonuclear cells in the spleen, measuring the leukocyte adhesion inhibition (LAI), and evaluating the mononuclear cells (MNC) [19].
Materials and methods
Animals
Wistar strain adult male albino rats, weighing typically between 210 ± 10 g, were used in this study. They were given standard food pellets, unfettered access to water ad libitum, and individual housing in polypropylene animal cages. The rats were maintained under standard housing conditions (humidity 60–65% and room temperature 23–28°C with 12:12 h light:dark cycles). They were accustomed for eight days prior to starting the experiment.
Design of study
Three groups, such as control, ICV experimental AD rats (Aβ-AD rats), and sham-treated group (PBS), each contained nine rats. Four weeks following their surgery, the rats of placebo, Aβ-AD, and sham treatments were assassinated. Measurements were made of the blood WBC’s phagocytic index, as well as the spleen’s MNC’s LAI, PMN’s phagocytic activity, and MNC’s cytotoxicity. We looked for interleukin-1β, TNF-α, ROS, and the levels of nitrite present in the hippocampal and serum level among three groups of rats.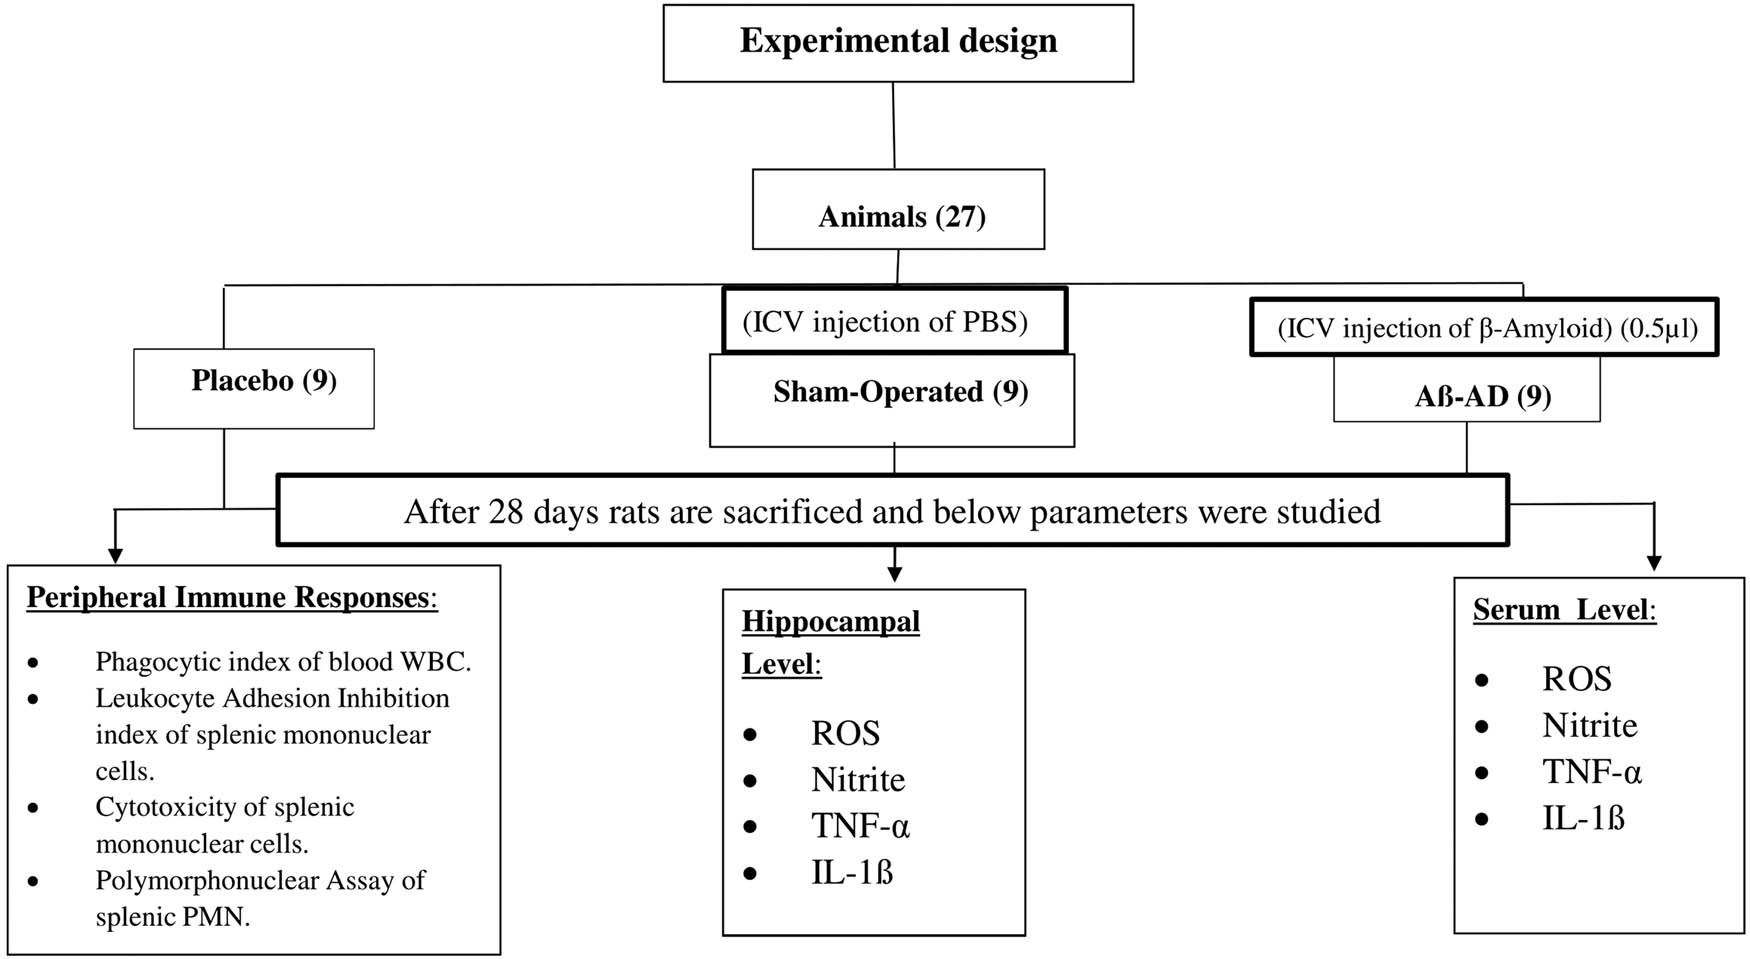
Preparation of Aβ-AD rats
Thiopentone injections into the peritoneum (50 mg/kg body weight) were used to anesthetize the rats. The stereotaxic equipment (INCO, India Ltd.) that the anesthetized animals were placed on head an ear bar that was specifically made to protect the tympanic membrane. The incisor bar can be firmly fastened to the head to align the bregma and lambda sutures on the same horizontal axis and stabilize the head. A midline scalp incision was used to lateralize the pericranial muscles and fascia. Before drilling the relevant portions of the overlaying bone, the muscles at the nape of the neck were gently pulled aside. To gain access to the lateral ventricle, drilling was done at exact sites that matched the coordinates shown on the stereotaxic atlas [20]. At the midline, 1.5 mm laterally, and 2.8 mm below the cortical surface, the lateral ventricles were situated 1.5 mm laterally to the bregma. Each lateral ventricle was injected with both 5 μl of PBS in the sham group and 5 μl of β-amyloid protein in the Aβ-AD group using a 10 μl Hamilton syringe. Hence, 2.5 μl of PBS was bilaterally injected. Potassium chloride (0.06 g/100 ml), sodium chloride (3 g/100 ml), potassium dihydrogen phosphate (0.06 g/100 ml), and disodium phosphate are the components of PBS.
Procedure for the preparation of Aβ amyloid protein for ICV injection
To establish a rodent model of AD, Aβ1–42 was administered intracerebroventricularly (SRL, India). Aβ1–42 was dissolved at a concentration of 1 mg/ml in PBS prior to use for oligomerization or fibrillary aggregation. After that, it underwent 7 days of incubation at 37°C. This solution, containing 5 µg of Aβ1–42, was administered to each rat by injecting 5 µl into each lateral ventricle.
Immunological study
Blood sample collection
100 μl of sodium citrate (3.8%; SRL, India) in a syringe was used to take blood from the heart of rats after they had received a deep anesthetic (Diethyl ether; Kabra Pharmaceuticals, India). This blood was used for fluorescence-activated cell sorting (FACS) analysis. Moreover, 1.5 ml of blood was drawn to collect serum without the use of any anticoagulants.
LAI
The spleens of rats were surgically removed while under the anaesthesia of diethyl ether (Kabra Medicines). After that, LAI was determined with the method proposed by Maluish and Halliday in 1979. Spleens were mixed in PBS at a ratio of 10:1 (v/v) with 3.8% sodium citrate (Sigma) using three rats from each of the three categories. These spleens were produced as single-cell suspensions, and WBCs were divided using a 1.092 Percoll density gradient. After that, MNC and PMN were separated using a Percoll density gradient with a value of 1.077. Following 30 min of incubation at 37°C in a humid setting, the isolated suspension of MNC (with a separation purity of 98%) was quantified using a Neubauer haemocytometer; and the counted region was gently rinsed with PBS using a Pasteur pipette after 30 min of incubation. A count of adherent cells was then made as follows: LAI (%) is calculated as follows: (100 adherent cells after incubation)/(total cells counted before incubation). Leishman stain was used to create a smear from the isolated MNC suspension (SRL, India). To guarantee the purity of the separation, the amount of MNC in this smear was calculated [21].
Phagocytic activity of WBC
The technique developed by Oben and Foreman in 1998 was used to produce fluorescein isothiocyanate (FITC; Sigma)-labeled bacterial cell membranes. Each of the four microcentrifuge tubes was filled with 380 µl of Roswell Park Memorial Institute (RPMI) medium (R8758; Merck, USA) and 20 µl of FITC-tagged bacterial cell membrane. After that, the tubes were incubated at various temperatures and times (0, 15, 60, and 90 min) at 37°C. From the collected blood, 100 µl of blood was drawn and placed into four microcentrifuge tubes [22]. The process was stopped by placing the tubes in ice for 15 min after incubation. Subsequently, 1 ml of a red blood cell lysing solution was put into each tube (BD) and prepared by diluting it tenfold with distilled water. The tubes were then left in the dark for 5 min. The tubes were then rinsed with PBS and centrifuged at 800g for 3 min (pH 7.4). Using in light scatter to collect 10,000 events inside the leukocyte gate, the BD FACS Verse and BD FACSuite software were used to analyze the mean fluorescence intensity. The histogram of the number of FITC-positive cells was examined to determine the mean fluorescence values for various time periods. A regression line was made for each rat group using the mean fluorescence readings at various times (MINITAB statistical program).
PMN assay
PMN were isolated from spleen individual cell suspension using the same technique used to isolate LAI [23]. After that, PBS was used to wash effector cells (PMN) and target cells (i.e., EAC) separately in 15 ml centrifuge tubes. The resultant pellets were then individually resuspended in RPMI 1640 (Hi-Media) medium devoid of phenol red. To quantify PMN (with a separation purity of 98%) and target cells, a Neubauer haemocytometer was utilized for the separated suspensions. Effector cells were combined with target cells in a 15 ml centrifuge tube, maintaining a ratio of 10:1. Following this, the tube received 200 μl of 1% nitroblue tetrazolium and 3 ml of RPMI, and the combination was incubated at 37°C for 18 h. The reaction was stopped after 18 h by adding cold 0.1 N HCl. Before being centrifuged at 2,000g for 30 min, the tube was allowed to acclimatize at ambient temperature for 5–10 min. After removing the supernatant from the tube, 3 ml of the pyridine solution was introduced. After being initially exposed to hot water for 10 min, the mixture was then subjected to 3,000 rpm centrifugation for a total of 10 min. The blue solution that resulted was then evaluated spectrophotometrically using absorbance at 480 nm.
Calculation for PMN assay
Two tubes with the labels “test” (T) and “blank” (B) were gathered for sampling. The percentages of PMN were then determined using the spectrophotometer measurements and applying the formula:
Cytotoxicity assay
The cytotoxicity between splenic MNC (isolated from the spleen using the LAI approach) and target cells (EAC cells) was evaluated using the LDH-FS non-radioactive cytotoxicity assay kit made by Canvax Reagents SL in Spain, in accordance with the methods outlined by Weyermann et al. in 2005 [24]. Effector and target cells were separated and washed with PBS in 15 ml centrifuge tubes before having their pellets dissolved in phenol red-free Allegra V-15R Benchtop Centrifuge (Beckman Coulter Life Sciences, US) solution. Three millilitres of the broken-up pellet were prepared for each centrifuge tube. The effector or target cells within 1 ml of the dissolved pellet solution were counted using a counting chamber. The 1.5 ml microcentrifuge tubes were used to transfer 1 × 10⁸ effector cells from the dissolved pellet solution (tubes 1 and 2). From the dissolved target cell solution, 1 × 10⁷ target cells were taken out and introduced to tube 1, which already included 1 × 10⁸ effector cells. The same number of target cells was also added to tubes 3 and 4 of another microcentrifuge. As a result, tube 1’s effector-to-target cell ratio was 10–1.1% Triton X-100 (SRL, India) was used to treat tube 4 to cause the target cells to lyse. Then, using phenol red-free RPMI 1640, each of the four microcentrifuge tubes was adjusted to have a capacity of 500 μl. Three hours were spent incubating all four microcentrifuge tubes at 37°C. 2,000 rpm of centrifugal force was applied for 2 min to the microcentrifuge tubes. Following the instructions provided by the kit’s manufacturer, the supernatant was collected, and the absorbance at 340 nm was used to calculate the amount of LDH released. The “C”-designated effector/target co-culture in microcentrifuge tube 1 has LDH released from it. Microcentrifuge tubes 2 and 3 were used to assess the LDH release from the effector cells (E) and target cells (T) in the absence of any particular treatment. Microcentrifuge tube 4 (M), meantime, successfully caught the whole LDH release from the target cells.
Each test was run three times, and the quantity of released LDH was determined using the formula below:
Test for cytokine
TNF-α assay
To analyze TNF-α levels in both the hippocampus and serum, we utilized the rat TNF Flex Set in conjunction with the CBA mouse/rat soluble protein master buffer kit, which is manufactured by ELK, Biotechnology, USA. The measurements were conducted using BD FACS Verse. To analyze the data, FCAP array software was employed. The technique described by Csölle and Sperlágh in 2010 and 2011 was used to prepare the samples [25,26]. For each 0.1 g of tissue, the technique involved grinding the hippocampus in a solution containing 10 mM Tris-HCl buffer, 1 mM EDTA, 0.2 mM PMSF, and 4 M urea. After that, the obtained samples underwent centrifugation at 15,000g for 20 min at 4°C. A kit method was employed, utilizing 50 µl of this solution for TNF-α testing. Following the collection of the supernatant, the addition of 1% bovine serum albumin (BSA), 0.2% Tween 20, and 10 mM Tris-HCl buffer was performed. Pictograms were used to show the amounts of cytokines for each 100 mg of protein sample.
Interleukin-1β assay
The concentrations of interleukin-1β in different regions of the brain were determined by employing an ELISA kit for rats (Ray Bio, Norcross, GA). The manufacturer’s recommendations were followed, and 100 ml of solutions were utilized to measure the levels of IL-1β. The sample content was calculated using a 96-well plate reader to measure absorbance at 450 nm for each well (Ray Bio). The samples’ cytokine concentrations were quantified as pg/mg protein. The kit has a sensitivity of 80 pg/ml for IL-1β detection.
Estimation of ROS
A modified version of the Socci et al. approach was used to measure ROS using spectrofluorometrics [27]. To measure the amounts of ROS, nitrite, and protein in the hippocampus, 500 µl of ice-cold Tris-HCl buffer (40 mM, pH 7.4) was homogenized. Following that, 5 M DCF-DA (SRL, India) was incubated with 10 µl of brain homogenate in a distilled water bath at 38°C for 32 min. A microplate reader (model: 51119100) was used to measure the fluorescent DCF product at wavelengths of 495 and 529 nm. ROS were quantified as a percentage relative to the control.
Estimation of nitrite
The assessment of nitrite levels was conducted following the method outlined by Green et al. in 1982 [28]. In conclusion, 10 µl of brain homogenate that had been produced in accordance with the instructions for the ROS assay were mixed with 0.01% N-(1-naphthyl) ethylenediamine dihydrochloride, Griess reagent, 2.4% phosphoric acid, and 1% sulfanilamide. The mixture was then incubated for 10 min at 38°C before the absorbance was measured spectrophotometrically at a wavelength of 550 nm. Nitrite concentrations were expressed in micrograms per milligram of protein and were determined using sodium nitrite as a reference [28].
Estimation of protein
In all the brain samples and serum, protein concentration was calculated using Lowry et al. The reference concentration was 1 mg/ml of BSA [29].
Statistical analysis
The data is expressed as mean ± standard error of the mean (SEM). The statistical analysis was performed using the SPSS software (Version 19.00, USA) employing a two-way analysis of variance to compare the information among the other groups including placebo, sham-treated, and Aβ-AD groups.
-
Ethical approval: The research related to animals’ use has been complied with all the relevant national regulations and institutional policies for the care and use of animals. Following the guidelines set out by the institutional animal ethics committee and with permission number: OIST/IAEC/L-12/2023, all necessary measures were taken to minimize the rat’s suffering and pain.
Results
Hippocampus inflammatory markers
In AD rats, there was a notable elevation in hippocampal nitrite, ROS, IL-1β, and TNF-α levels in comparison to both placebo and sham-treated animals (p < 0.001). However, among control and sham-operated animals, there were no significant distinctions observed in hippocampal nitrite, ROS, IL-1β, or TNF-α levels (Figure 1).
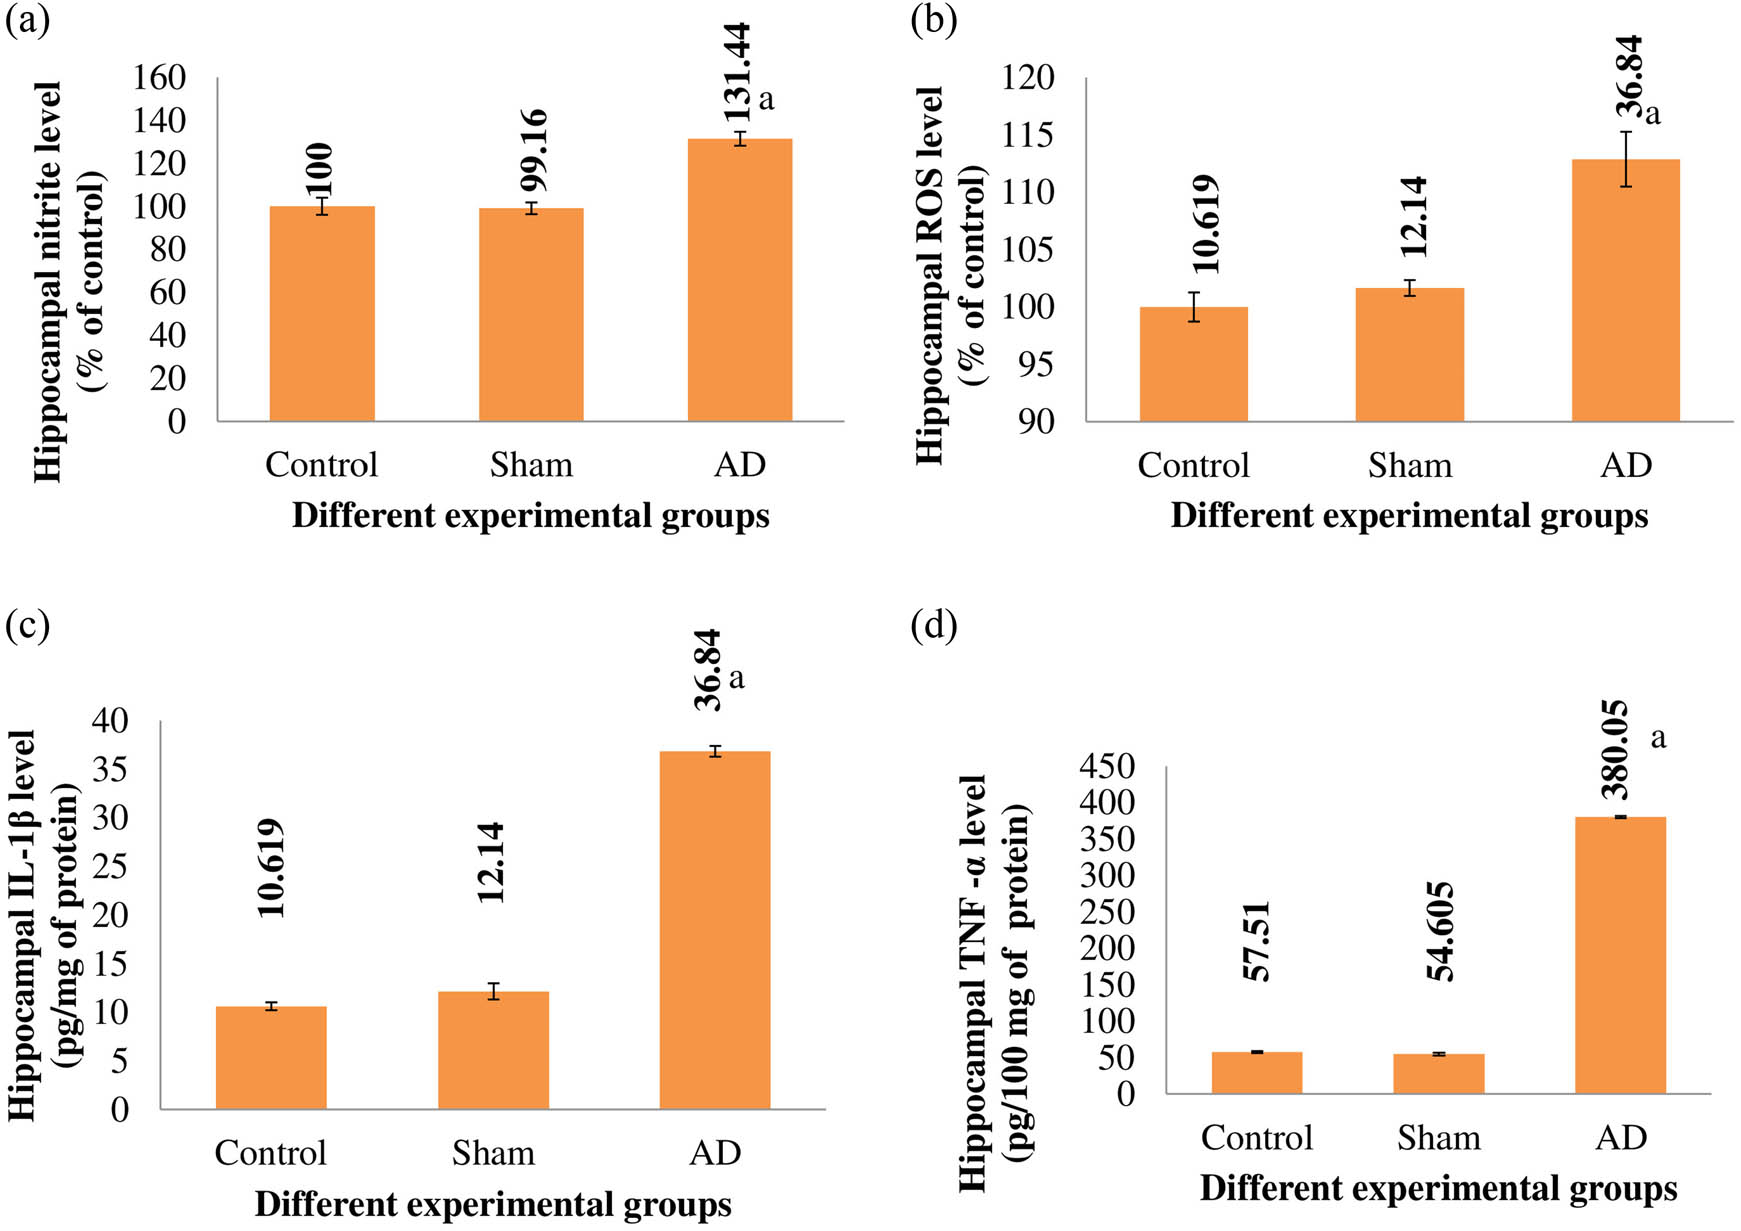
The hippocampal nitrite level (a), ROS level (b), IL-1β level (c), TNF-α level (d) of different experimental groups of rats. When compared to the placebo/sham-treated rats, AD rats showed a significant difference (p < 0.001). With n = 9, the values are displayed as the Mean ± SEM. Abbreviations: sham stands for the group that underwent a sham operation, whereas AD stands for the group that received intracerebroventricular Aβ injections.
Serum inflammatory markers
Comparing AD animals to placebo and sham-treated rats, there was a statistical increase in blood nitrite levels, ROS levels, IL-1β levels, and TNF-α levels (p < 0.001). Rats that had sham surgery did not significantly vary from control rats in terms of serum nitrite, ROS, IL-1β, or TNF-α levels (Figure 2).
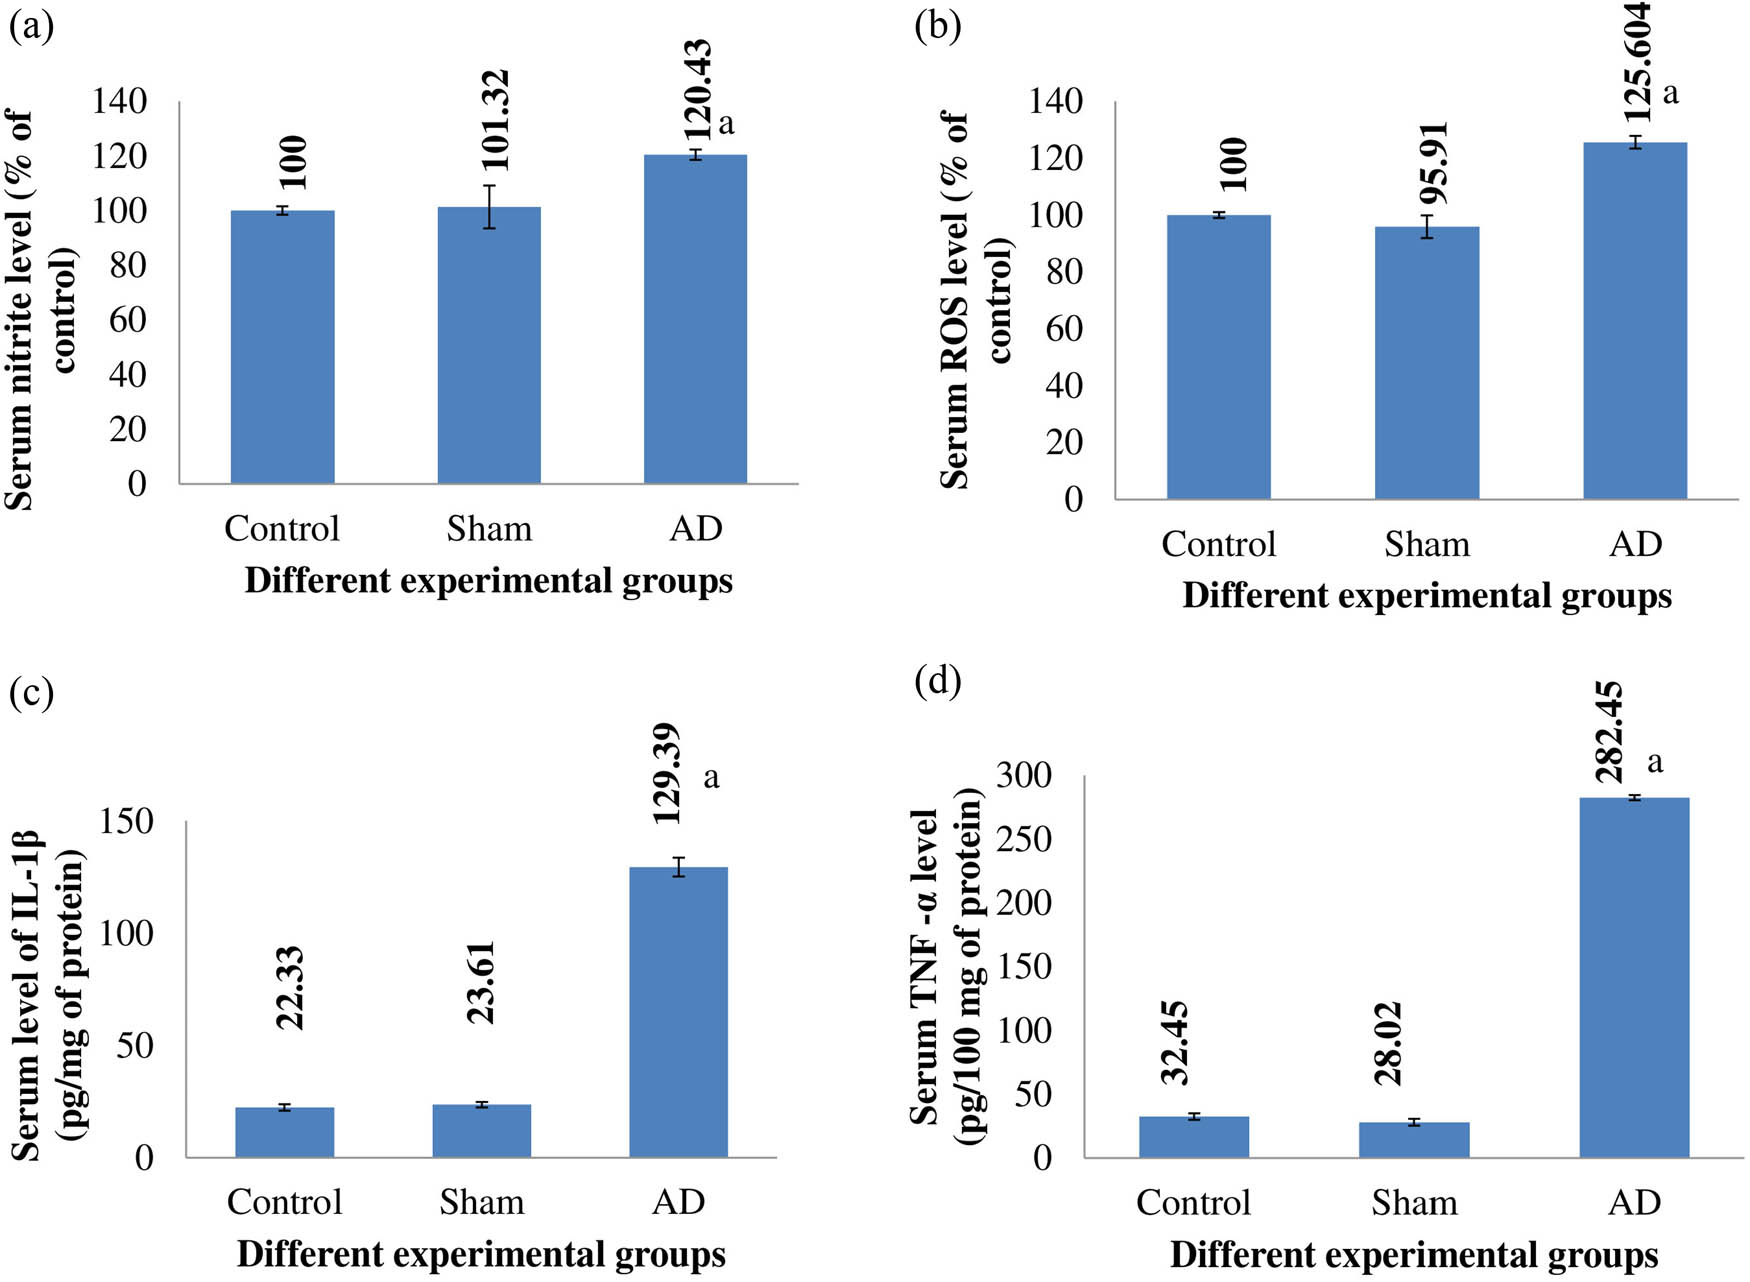
The serum nitrite level (a), ROS level (b), IL-1β level (c), and TNF-α level (d) of different rats of experimental groups. Comparing AD animals to placebo/sham-treated rats, there was a noticeable change that was statistically significant (p < 0.001). Data are presented as the mean ± SEM (animals n = 9). Abbreviations: AD = intracerebroventricular Aβ injected group; Sham = sham-treated group.
Splenic PMN phagocytic activity
When compared to placebo and sham-treated animals, the splenic PMN of AD rats had a significantly higher level of phagocytic activity (p < 0.001). Rats that had a sham operation had similar levels of phagocytic activity to control rats (Figure 3).
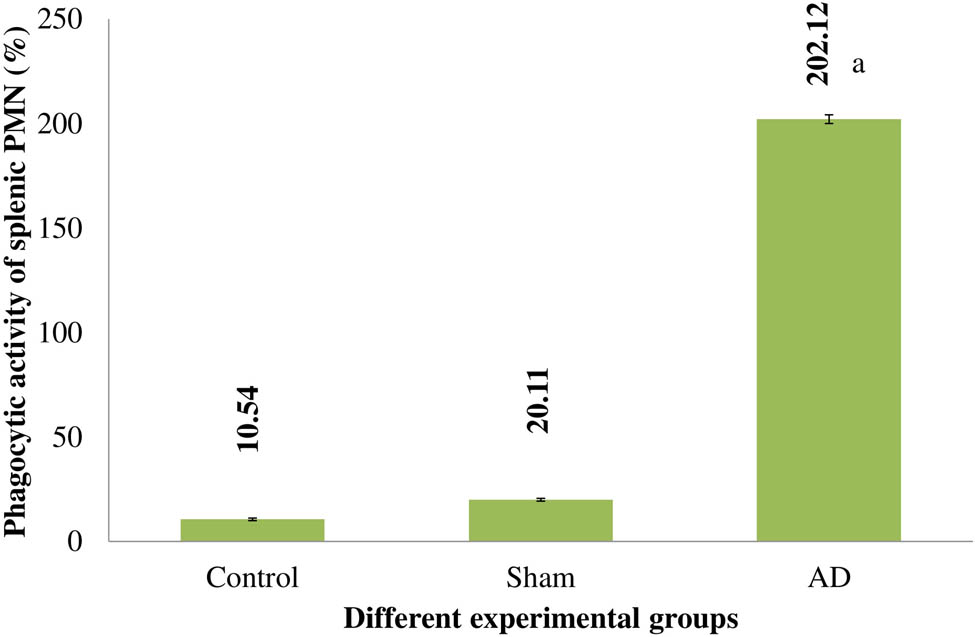
The splenic PMN of several experimental rat groups’ phagocytic activities. Statistically significant (p < 0.001) differences between AD animals and placebo/sham-treated rats were seen. Data are presented as the mean ± SEM (animals n = 9). Abbreviations: AD = intracerebroventricular Aβ injected group; Sham = sham-treated group.
Splenic MNC cytotoxicity
When compared to control and rats who had a sham operation, the cytotoxicity of the splenic MNC of AD animals increased significantly (p < 0.001). Rats under control and sham operations had similar levels of splenic MNC cytotoxicity (Figure 4).
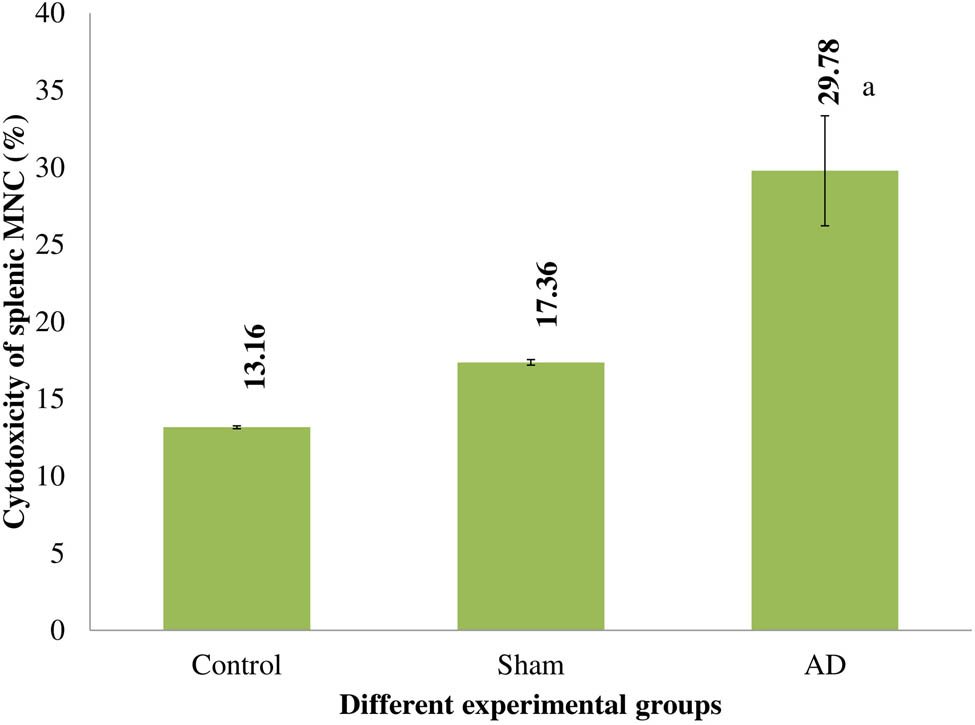
The cytotoxicity of several experimental rat groups’ splenic MNC. Statistically significant (p < 0.001) differences between AD animals and placebo/sham-treated rats were seen. Data are presented as the mean ± SEM (animals n = 9). Abbreviations: AD = intracerebroventricular Aβ injected group; Sham = sham-treated group.
LAI
Comparing AD animals to control and rats who underwent a sham operation, there was a substantial reduction in LAI (p < 0.001). Rats with control or sham operations showed no discernible variation in the cytotoxic of the splenic MNC (Figure 5).
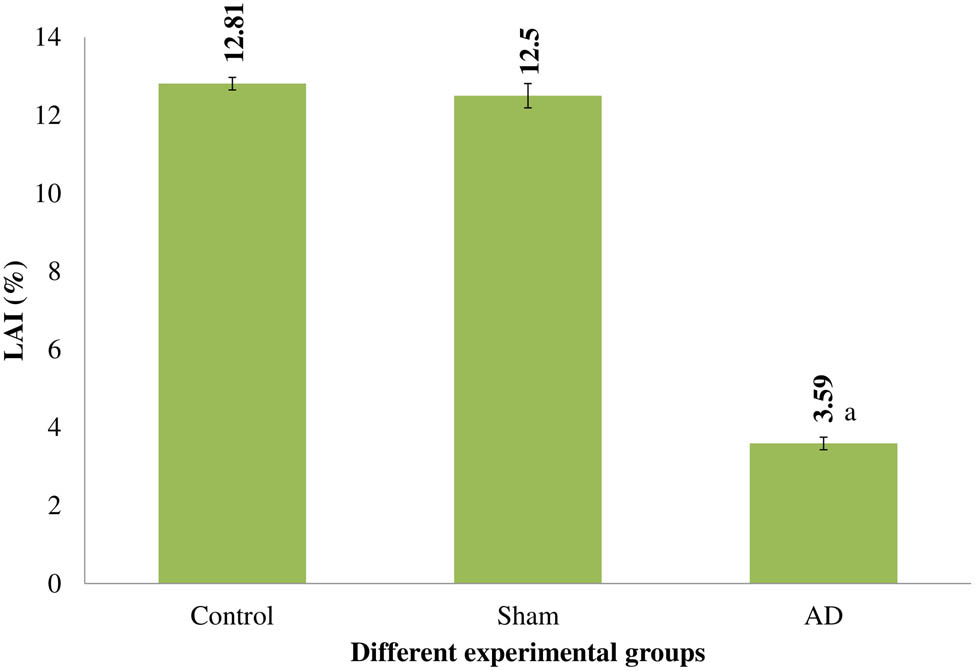
LAI of several rat experimental groups. Statistically significant (p < 0.001) differences between AD animals and placebo/sham-treated rats were seen. Data are presented as the mean ± SEM (animals n = 9). Abbreviations: AD = intracerebroventricular Aβ injected group; Sham = sham-operated group.
Phagocytic activity of WBC
A statistically noteworthy rise in the engulfing of splenic PMN was evident in AD animals in contrast to placebo and sham-treated rats (p < 0.001). Rats that underwent control or sham operations exhibited no noticeable difference in the cytotoxicity of splenic MNC (Figure 6).
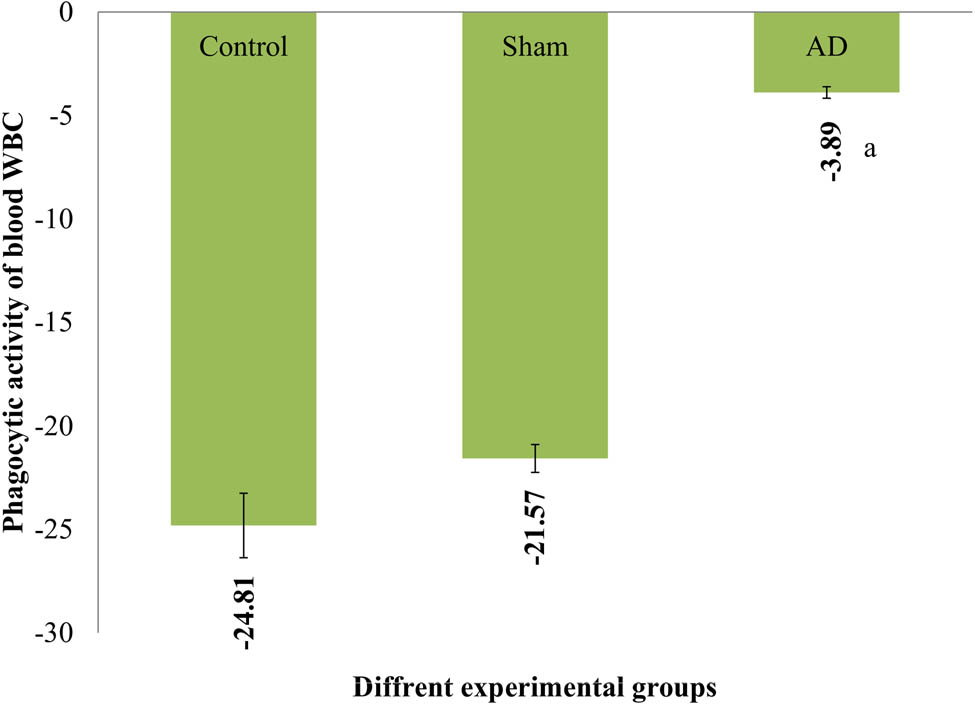
The rats in various experimental groups’ PI for WBC. With statistical significance (p < 0.001), AD animals showed a noticeable difference from placebo/sham-treated rats. Data are presented as the mean ± SEM (animals n = 9). Abbreviations: AD = group receiving intracerebroventricular Aβ; sham = group receiving sham operation.
Discussion and conclusion
According to prior research, the idea that plaque development initiates the inflammatory process can be due to increased levels of proinflammatory cytokines (such as TNF-α and IL-1β) [30,31]. In response to the ongoing buildup of Aβ, microglia and astrocytes become activated thereby secreting a variety of inflammatory factors that then damage nearby neurons [32]. The Aβ-AD rats enhance the levels of TNF-α and Interleukin-1β confirming that these two cytokines are key players in the etiology of AD. In early AD, IL-1β is reportedly overexpressed by others [33]. Moreover, after Aβ1–42 injection, the hippocampus exhibits increased immunoreactivity for IL-1β [34]. When compared to placebo and sham-treated rats, higher blood levels of TNF-α and IL-1β were also found in Aβ-AD rat serum. Given the complex and tightly controlled interactions between the brain and the immune system, our findings are consistent with the hypothesis that a relationship between the inflammatory cytokine marker profile in the blood and that in the brain exists for AD. A decline in the engulfing of WBCs and the index for inhibiting leukocyte adhesion was evident in Aβ-AD rats in comparison to placebo and sham-treated rats. This decline in blood WBC’s engulfing process has also been noticed in AD patients in the previous study [35,36]. However, the decrease in LAI shown in AD-affected rats cannot be primarily attributable to an increase in inflammatory mediators in the peripheral system. Instead, it can be the result of a coping mechanism against different inflammatory pathways [37,38,39,40,41,42,43,44]. The idea that the blood–brain barrier may be damaged allowing inflammatory mediators to potentially cross the barrier during neuroinflammation can be used to explain these changes in peripheral immune reactivity. This might then affect peripheral immune reactions.
Aβ1–42 in the Aβ-AD rat group were administered (ICV) to produce the AD model for the current experiment. Researchers examined the histology of the hippocampus in rats Aβ-AD, the serum and hippocampus levels of inflammatory cytokines markers (TNF-α, ROS, nitrite, and interleukin-1β), and other factors like peripheral immune responses, such as blood WBC and splenic polymorphonuclear cell phagocytosis, the LAI, and splenic mononuclear cell MNC cytotoxicity. These traits were also investigated in rats that were given PBS as a sham operation and were subjected to control circumstances. Relative to placebo and sham-treated rats, the hippocampus of Aβ-AD rats exhibited notably increased levels of inflammatory cytokines markers (ROS, nitrite, TNF-α, and interleukin-β). These points to a marked level of neuroinflammation. Hence, these data suggest that neuroinflammation and neurodegeneration are related. In addition to modifications in peripheral immune responses, AD rats had higher blood concentrations of the inflammatory marker’s IL-1β, ROS, nitrite, TNF-α, and interleukin-1β. The immunological parameters splenic polymorphonuclear cell phagocytic activity and splenic mononuclear cell cytotoxicity were dramatically enhanced in the Aβ-AD rats as compared to the placebo group as well as sham-treated animals. The LAI of splenic MNC in the AD group was lower than that in the placebo as well as in sham-treated groups. The Aβ-AD rats also showed decreased phagocytic activity of blood WBC. Given that neuroinflammation indicators can flow through a damaged blood brain barrier (BBB), neuroinflammation may potentially play a role in the peripheral immunological alterations observed in rats with AD. Given this, one would speculate that the neuroinflammation seen in Aβ-AD rats may affect peripheral immune responses.
Acknowledgments
We are very thankful to the Director of Paramedical College Durgapur, West Bengal, India, for his immense support and providing facilities to carry out this work. We also thank Dr. Pradipta Banerjee, a Postdoctoral Fellow at the Department of Surgery, Pittsburgh University School of Medicine, Pittsburgh, USA, for his valuable suggestions and guidance.
-
Funding information: Authors state no funding involved.
-
Author contributions: Conceptualization: K.A., S.M., and P.K. methodology: K.A., B.B., and R.M. writing - original draft preparation: K.A., K.B., and P.K. validation: B.B., S.M., and R.M. supervision: P.K. and R.M. All authors have read and agreed to the published version of the manuscript.
-
Conflict of interest: Authors state no conflict of interest.
-
Data availability statement: The datasets generated during and/or analyzed during the current study are available from the corresponding author on reasonable request.
References
[1] Basavaraju M, de Lencastre A. Alzheimer’s disease: presence and role of microRNAs. Biomol Concepts. 2016;7(4):241–52.10.1515/bmc-2016-0014Search in Google Scholar PubMed PubMed Central
[2] Pillai JA, Cummings JL. Clinical trials in predementia stages of Alzheimer disease. Med Clin North Am. 2013;97(3):439–57.10.1016/j.mcna.2013.01.002Search in Google Scholar PubMed
[3] Jucker M, Walker LC. Alzheimer’s disease: From immunotherapy to immunoprevention. Cell. 2023;186(20):4260–70.10.1016/j.cell.2023.08.021Search in Google Scholar PubMed PubMed Central
[4] Soria Lopez JA, González HM, Léger GC. Alzheimer’s disease. Handb Clin Neurol. 2019;167:231–55.10.1016/B978-0-12-804766-8.00013-3Search in Google Scholar PubMed
[5] Carter SF, Herholz K, Rosa-Neto P, Pellerin L, Nordberg A, Zimmer ER. Astrocyte biomarkers in Alzheimer’s disease. Trends Mol Med. 2019;25(2):77–95.10.1016/j.molmed.2018.11.006Search in Google Scholar PubMed
[6] Weller J, Budson A. Current understanding of Alzheimer’s disease diagnosis and treatment. F1000Research. 2018;7:1161.10.12688/f1000research.14506.1Search in Google Scholar PubMed PubMed Central
[7] Beata BK, Wojciech J, Johannes K, Piotr L, Barbara M. Alzheimer’s disease-biochemical and psychological background for diagnosis and treatment. Int J Mol Sci. 2023;24(2):1059.10.3390/ijms24021059Search in Google Scholar PubMed PubMed Central
[8] Villain N, Dubois B. Alzheimer’s disease including focal presentations. Semin Neurol. 2019;39(2):213–6.10.1055/s-0039-1681041Search in Google Scholar PubMed
[9] Grøntvedt GR, Schröder TN, Sando SB, White L, Bråthen G, Doeller CF. Alzheimer’s disease. Curr Biol. 2018;28(11):R645–9.10.1016/j.cub.2018.04.080Search in Google Scholar PubMed
[10] Hardy JA, Mann DMA, Wester P, Winblad B. An integrative hypothesis concerning the pathogenesis and progression of Alzheimer’s disease. Neurobiol Aging. 1986;7(6):489–502.10.1016/0197-4580(86)90086-2Search in Google Scholar PubMed
[11] Penney J, Ralvenius WT, Tsai LH. Modeling Alzheimer’s disease with iPSC-derived brain cells. Mol Psychiatry. 2020;25(1):148–67.10.1038/s41380-019-0468-3Search in Google Scholar PubMed PubMed Central
[12] Ogbodo JO, Agbo CP, Njoku UO, Ogugofor MO, Egba SI, Ihim SA, et al. Alzheimer’s disease: Pathogenesis and therapeutic interventions,. Curr Aging Sci. 2022;15(1):2–25.10.2174/1874609814666210302085232Search in Google Scholar PubMed
[13] Twarowski B, Herbet M. Inflammatory processes in Alzheimer’s disease-pathomechanism, diagnosis and treatment: A review. Int J Mol Sci. 2023;24(7):6518.10.3390/ijms24076518Search in Google Scholar PubMed PubMed Central
[14] Stefaniak O, Dobrzyńska M, Drzymała-Czyż S, Przysławski J. Diet in the prevention of Alzheimer’s disease: Current knowledge and future research requirements. Nutrients. 2022;14(21):4564.10.3390/nu14214564Search in Google Scholar PubMed PubMed Central
[15] Cortes-Canteli M, Iadecola C. Alzheimer’s disease and vascular aging: JACC focus seminar. J Am Coll Cardiol. 2020;75(8):942–51.10.1016/j.jacc.2019.10.062Search in Google Scholar PubMed PubMed Central
[16] Ma C, Hong F, Yang S. Amyloidosis in Alzheimer’s disease: Pathogeny, etiology, and related therapeutic directions. Molecules. 2022;27(4):1210.10.3390/molecules27041210Search in Google Scholar PubMed PubMed Central
[17] Chen ZY, Zhang Y. Animal models of Alzheimer’s disease: Applications, evaluation, and perspectives. Zool Res. 2022;43(6):1026–40.10.24272/j.issn.2095-8137.2022.289Search in Google Scholar PubMed PubMed Central
[18] Lloret A, Esteve D, Lloret MA, Cervera-Ferri A, Lopez B, Nepomuceno M, et al. When does Alzheimer’s disease really start? The role of biomarkers. Int J Mol Sci. 2019;20(22):5536.10.3390/ijms20225536Search in Google Scholar PubMed PubMed Central
[19] Sun BL, Li WW, Zhu C, Jin WS, Zeng F, Liu YH, et al. Clinical research on Alzheimer’s disease: Progress and perspectives. Neurosci Bull. 2018;34(6):1111–8.10.1007/s12264-018-0249-zSearch in Google Scholar PubMed PubMed Central
[20] Paxinos G, Watson CRR, Emson PC. AChE-stained horizontal sections of the rat brain in stereotaxic coordinates. J Neurosci Methods. 1980;3(2):129–49.10.1016/0165-0270(80)90021-7Search in Google Scholar PubMed
[21] Liu RY, Gu R, Qi XL, Zhang T, Zhao Y, He Y, et al. Decreased nicotinic receptors and cognitive deficit in rats intracerebroventricularly injected with beta-amyloid peptide (1-42) and fed a high-cholesterol diet. J Neurosci Res. 2008;86(1):183–93.10.1002/jnr.21463Search in Google Scholar PubMed
[22] Oben JA, Foreman JC. A simple quantitative fluorimetric assay of in vitro phagocytosis in human neutrophils. J Immunol Methods. 1988;112(1):99–103.10.1016/0022-1759(88)90039-7Search in Google Scholar PubMed
[23] Csölle C, Sperlágh B. Peripheral origin of IL-1beta production in the rodent hippocampus under in vivo systemic bacterial lipopolysaccharide (LPS) challenge and its regulation by P2X(7) receptors. J Neuroimmunol. 2010;219(1–2):38–46.10.1016/j.jneuroim.2009.11.011Search in Google Scholar PubMed
[24] Weyermann J, Lochmann D, Zimmer A. A practical note on the use of cytotoxicity assays. Int J Pharm. 2005;288(2):369–76.10.1016/j.ijpharm.2004.09.018Search in Google Scholar PubMed
[25] Hudson L, Hay FC. Practical Immunology. 222, 2nd edn. Oxford: Blackwell Scientific Publications; 1980.Search in Google Scholar
[26] Csölle C, Sperlágh B. Endocannabinergic modulation of interleukin-1β in mouse hippocampus under basal conditions and after in vivo systemic lipopolysaccharide stimulation. Neuroimmunomodulation. 2011;18(4):226–31.10.1159/000323778Search in Google Scholar PubMed
[27] Socci DJ, Crandall BM, Arendash GW. Chronic antioxidant treatment improves the cognitive performance of aged rats. Brain Res. 1995;693(1):88–94.10.1016/0006-8993(95)00707-WSearch in Google Scholar
[28] Green LC, Wagner DA, Glogowski J, Skipper PL, Wishnok JS, Tannenbaum SR. Analysis of nitrate, nitrite,and [15N] nitrate in biological fluids. Anal Biochem. 1982;126(1):131–8.10.1016/0003-2697(82)90118-XSearch in Google Scholar PubMed
[29] Lowry OH, Rosebrough NJ, Farr AL, Randall RJ. Protein measurement with the Folin phenol reagent. J Biol Chem. 1951;193(1):265–75.10.1016/S0021-9258(19)52451-6Search in Google Scholar
[30] Rai S, Kamat PK, Nath C, Shukla R. A study on neuroinflammation and NMDA receptor function in STZ (ICV) induced memory impaired rats. J Neuroimmunol. 2013;254(1–2):1–9.10.1016/j.jneuroim.2012.08.008Search in Google Scholar PubMed
[31] Monteiro AR, Barbosa DJ, Remião F, Silva R. Alzheimer’s disease: Insights and new prospects in disease pathophysiology, biomarkers and disease-modifying drugs. Biochem Pharmacol. 2023;211:115522.10.1016/j.bcp.2023.115522Search in Google Scholar PubMed
[32] Serrano-Pozo A, Das S, Hyman BT. APOE and Alzheimer’s disease: advances in genetics, pathophysiology, and therapeutic approaches [published correction appears in Lancet Neurol. 2021 Feb;20(2):e2]. Lancet Neurol. 2021;20(1):68–80.10.1016/S1474-4422(20)30412-9Search in Google Scholar PubMed PubMed Central
[33] Serrano-Pozo A, Growdon JH. Is Alzheimer’s disease risk modifiable? J Alzheimers Dis. 2019;67(3):795–819.10.3233/JAD181028Search in Google Scholar PubMed PubMed Central
[34] Se Thoe E, Fauzi A, Tang YQ, Chamyuang S, Chia AYY. A review on advances of treatment modalities for Alzheimer’s disease. Life Sci. 2021;276:119129.10.1016/j.lfs.2021.119129Search in Google Scholar PubMed
[35] Klyucherev TO, Olszewski P, Shalimova AA, Chubarev VN, Tarasov VV, et al. dvances in the development of new biomarkers for Alzheimer’s disease. Transl Neurodegener. 2022;11(1):25A.10.1186/s40035-022-00296-zSearch in Google Scholar PubMed PubMed Central
[36] Ozben T, Ozben S. Neuro-inflammation and anti-inflammatory treatment options for Alzheimer’s disease. Clin Biochem. 2019;72:87–9.10.1016/j.clinbiochem.2019.04.001Search in Google Scholar PubMed
[37] Whitwell JL. Alzheimer’s disease neuroimaging. Curr Opin Neurol. 2018;31(4):396–404.10.1097/WCO.0000000000000570Search in Google Scholar PubMed
[38] Lei P, Ayton S, Bush AI. The essential elements of Alzheimer’s disease. J Biol Chem. 2021;296:100105.10.1074/jbc.REV120.008207Search in Google Scholar PubMed PubMed Central
[39] Knapskog AB, Engedal K, Selbæk G, Øksengård AR. Alzheimer’s disease – diagnosis and treatment. Tidsskr Nor Laegeforen. 2021;141(7):10.Search in Google Scholar
[40] Ferrari C, Sorbi S. The complexity of Alzheimer’s disease: an evolving puzzle. Physiol Rev. 2021;101(3):1047–81.10.1152/physrev.00015.2020Search in Google Scholar PubMed
[41] Huberman M, Shalit F, Roth-Deri I, Gutman B, Brodie C, Kott E, et al. Correlation of cytokine secretion by mononuclear cells of Alzheimer patients and their disease stage. J Neuroimmunol. 1994;52(2):147–52.10.1016/0165-5728(94)90108-2Search in Google Scholar PubMed
[42] Chowdhury T, Bardhan S, Maiti R. A review on the self-assembly of phenylalanine as the hallmark of the neurological disorder phenylketonuria (PKU): Origin to therapeutic strategy. Proc Indian Natl Sci Acad. 2023;89(4):802–10.10.1007/s43538-023-00203-8Search in Google Scholar
[43] Chowdhury M, Chowdhury S, Bhattacherjee A, Roy C, Sarkar R, Adhikary K, et al. Natural antioxidants and nutraceuticals to fight against common human diseases: an overview. Eur Chem Bull. 2023;12(9):1505–21.Search in Google Scholar
[44] LaFerla FM, Green KN, Oddo S. Intracellular amyloid-beta in Alzheimer’s disease. Nat Rev Neurosci. 2007;8(7):499–509.10.1038/nrn2168Search in Google Scholar PubMed
© 2024 the author(s), published by De Gruyter
This work is licensed under the Creative Commons Attribution 4.0 International License.
Articles in the same Issue
- Research Articles
- Antitumor activity of 5-hydroxy-3′,4′,6,7-tetramethoxyflavone in glioblastoma cell lines and its antagonism with radiotherapy
- Digital methylation-specific PCR: New applications for liquid biopsy
- Synergistic effects of essential oils and phenolic extracts on antimicrobial activities using blends of Artemisia campestris, Artemisia herba alba, and Citrus aurantium
- β-Amyloid peptide modulates peripheral immune responses and neuroinflammation in rats
- A novel approach for protein secondary structure prediction using encoder–decoder with attention mechanism model
- Diurnal and circadian regulation of opsin-like transcripts in the eyeless cnidarian Hydra
- Withaferin A alters the expression of microRNAs 146a-5p and 34a-5p and associated hub genes in MDA-MB-231 cells
- Toxicity of bisphenol A and p-nitrophenol on tomato plants: Morpho-physiological, ionomic profile, and antioxidants/defense-related gene expression studies
- Review Articles
- Polycystic ovary syndrome and its management: In view of oxidative stress
- Senescent adipocytes and type 2 diabetes – current knowledge and perspective concepts
- Seeing beyond the blot: A critical look at assumptions and raw data interpretation in Western blotting
- Biochemical dynamics during postharvest: Highlighting the interplay of stress during storage and maturation of fresh produce
- A comprehensive review of the interaction between COVID-19 spike proteins with mammalian small and major heat shock proteins
- Exploring cardiovascular implications in systemic lupus erythematosus: A holistic analysis of complications, diagnostic criteria, and therapeutic modalities, encompassing pharmacological and adjuvant approaches