Inverse Analysis of Concrete Meso-constitutive Model Parameters Considering Aggregate Size Effect
-
Lixia Guo
 ,
Lei Guo
,
Lei Guo

Abstract
The meso numerical simulation has become an important method to study the characteristics of materials; however, the key to its further application is determining the parameters of meso-constitutive model. Considering that the meso-scale parameters of materials are hard to measure, this paper took into account the aggregate size effect and proposed a meso-parameter identification method by combining random aggregate numerical simulation and genetic algorithm. First, a random aggregate model of concrete was established, and its meso-model parameters were analyzed. The Morris method was used to analyze the sensitivity of meso-component parameters to the macro-responses, and results showed that the elastic modulus of mortar matrix, interface and large aggregates had a great effect on the peak strain and that the elastic modulus, Poisson’s ratio and tensile strength of interface and mortar matrix, as well as the Poisson’s ratio of large aggregates and the elastic modulus of small aggregates all had an effect on the peak stress, among which the interface tensile strength produced the greatest effect. Second, a parametric inversion and optimization function was established. The uniaxial compression numerical simulation test and genetic algorithm were combined to invert the meso-parameters, and results showed that compared with the single-aggregate parameter inversion curve, the multi-aggregate inversion stress-strain curve was much closer to the measured curve. That was because the aggregates of small size had lower elastic modulus, easing the stress concentration at the interface between aggregates and cement stone, and delaying the formation and growth of cracks.
1 Introduction
The mesoscopic failure characteristics of concrete need to be tested with a scanning electron microscope (SEM) or other advanced experimental equipment, but it usually costs much and the test results are a little discrete. In recent years, with the rapid development of computer technology, using numerical simulation to study the process of material damage and fracture has become a popular trend [1, 2, 3], while the first problem to be solved is how to quantitatively determine the meso-parameters of concrete materials.
The concrete aggregates are often millimeter sized, and are hard to measure directly. Generally, their sizes are obtained by processing measured data in a lab, which, however, lacks directivity and purpose. For this reason, many scholars have done a lot of research. Chen Pengyu [4] studied the relationship between macro and meso parameters, and proposed a trial-and-error method to calibrate meso-parameters; Li Shouju [5] used linear regression to obtain the mapping relationship between meso-parameters and macro-responses, which was compared with the measured macro-response optimization to get the estimations of meso-parameters; Han Xiao [6] proposed a meso-mechanical parameter identification method based on the tensile curve of unidirectional ceramic matrix composite materials;Wang Zhiyun [7] established a function of meso-constitutive model parameters based on the macro deformation data of concrete samples to obtain meso-parameters by the minimum difference between the function value and the measured value. Most of the above research attempt to derive meso-parameters by quantifying the relationship between meso-parameters and macro-properties. However in fact, the complex nonlinear relationship is difficult to quantify accurately. Therefore, this paper proposes a meso-parameter identification method based on the finite element calculation and genetic algorithm. In this paper, the numerical simulation was adopted to establish a non-linear relationship between meso-parameters and macro-responses, the genetic algorithm was adopted to optimize macro-responses, thereby inverting meso-parameters, and the meso-parameter setting considered the size effect of aggregates. This study may provide a theoretical basis for the meso-numerical simulation in the subsequent research of materials and structural properties.
2 Theory of Computation
2.1 Random aggregate model and parameterization
The concrete sample showed a random distribution of aggregate particles on its cross-section, with the help of the pseudo-random number generated through the Monte Carlo method [8].
In computer simulation, the most basic random variables were those evenly distributed in the range [0, 1]. The probability density function of X was established as follows:
The sampling sequence of the random variable X was generated in the computer. Since the random variable in the range [0, 1] was the most basic one, those distributed in other forms can be obtained by its transformation. For example, random variables evenly distributed in the range [a, b] can be obtained by transformation of the formula X′ = a + (b − a)X.
The Monte Carlo method was used to randomly determine the location of aggregates in different particle size ranges on the sample. The number of aggregate particles was calculated by the concrete grading and aggregate content according to the three-dimensional Fuller grading the ory [9] based on the principle of maximum compaction, Figure 1 shows the Fuller curves of aggregates. In the two-dimensional plane, the probability Pc(D < D0) that Walraven J C [10] converted the three-dimensional Fuller grading curve to any point with the aggregate diameter D < D0 on the cross-section of the sample was:
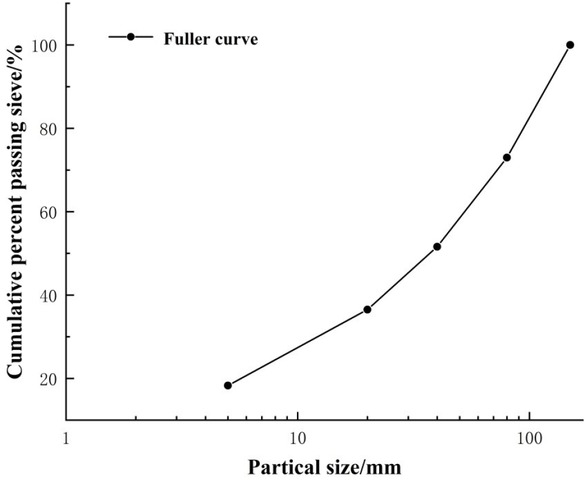
Fuller curves of aggregates
Where, Pk represents the percentage of aggregate volume to the total volume of the sample. According to different values, the probability distribution curve was obtained from the formula (2), and thereby, the number of aggregate particles of each size on the cross-section of the sample was determined.
The concrete aggregates were made by crushing, and showed convex in the shape, which can be simplified into irregular polygons. The aggregate surface had an interface. The aggregate and its interface were generated as follows: (1) Determining the number of required aggregates of different sizes according to the aggregate and grading curve; (2) Generating an aggregate random circle and an interface random circle and record their radii; (3) Dividing quadrants within the inner and outer circles, determining the number of corner points in each quadrant, and generating coordinates of each corner point; (4) Connecting all corner points in the inner and outer circles to generate polygons, and setting the start number of polygons in the outer circle as the total number of aggregates +1.
The deformation of concrete cracks varies from their meso-components. Considering the size effect of aggregates, the concrete aggregates of different particle sizes were differentiated according to their equivalent particle sizes. Here were the specific material parameterization steps: (1) determining the serial number of aggregate materials according to the test results and grading analysis; (2) circulating the generated polygon number [1, (maximum number −1/2)]; (3) judging the particle size of each polygonal aggregate, and assigning the material number and parameter according to the particle size.
2.2 Optimized inversion
Genetic Algorithm (GA) is a computational model that simulates the natural selection of Darwin’s biological evolution theory and the biological evolution of genetic mechanism, and is also a method to search for the optimal solution by simulating the natural evolution [11].
GA optimization is achieved through data transfer between Fortran and Ansys, in which the data format adopts .dat file. ANSYS reads data through APDL language, and Fortran reads data through programming. The specific optimization process is as follows: (1) Setting the population size, number of variables, number of iterations, crossover probability and mutation probability in the Fortran program; (2) FORTRAN generates the initial population under constraint conditions and saves it in the input.dat file; (3) ANSYS reads parameters in the input.dat file and substitutes them into the APDL language to complete the numerical calculation; (4) ANSYS stores stress values extracted from different load segments into the output.dat file; (5) FORTRAN reads the data in the output.dat file, which will be used as the objective function value and fitness value to judge whether the termination condition is met or not; if the termination condition is met, the optimal design variable will be output; if it is not met, perform the step (6); (6) a new initial population is generated through selection, crossover and mutation to overwrite the original initial population, and saved in input.dat file. Repeat steps (3)-(5).
2.3 Morris parameter screening method
Morris method [12] is a discrete search method based on parameter space, which can study the model parameters in a global scope. The standard deviation of sensitivity discriminant factor is used to measure the interaction between parameters. The calculation formula is as follows:
Where, di(j) is the base effect of the j-th sample of the i-th parameter, j = 1, 2, . . . , R (R is the sampling frequency); n is the number of parameters; xi is the i-th parameter; Δ is a small change in a single parameter; f ( ) is the response output of the corresponding parameter group, and takes the values of peak stress and peak strain in the stress-strain curve of the uniaxial compression simulation test in this paper.
To evaluate the sensitivity of parameters, the Morris method was modified so that the independent variable could change with a fixed-step percentage, and the average of multiple Morris coefficients was taken as the final sensitivity, namely:
Where, SN is the sensitivity discrimination factor of the meso-parameters of the material; Yi is the peak stress or peak strain in the i-th operation based on the random aggregate model; Yi+1 is the peak stress or peak strain in the i+1-th operation based on the random aggregate model; Y0 is the initial value (peak stress or peak strain) of the calculated result after parameter inversion; Pi is the percentage of changes in parameters with the inverse initial parameter after the i-th simulation calculation; Pi+1 is the percentage of changes in parameters with the inverse initial parameter after the i+1-th simulation calculation; and n is the number of simulation calculations.
3 Constitutive model and parameters of concrete meso-components
3.1 Constitutive model
From a mesoscopic angle, ordinary concrete is composed of aggregate, cement mortar and interface between the aggregate and the cement mortar. Considering the size effect of different graded aggregates, the concrete features n+1 (n is the number of equivalent aggregate sizes) materials and one interface (see Figure 2). The random aggregate model of concrete includes three elements: aggregate element, mortar element, and interface element.
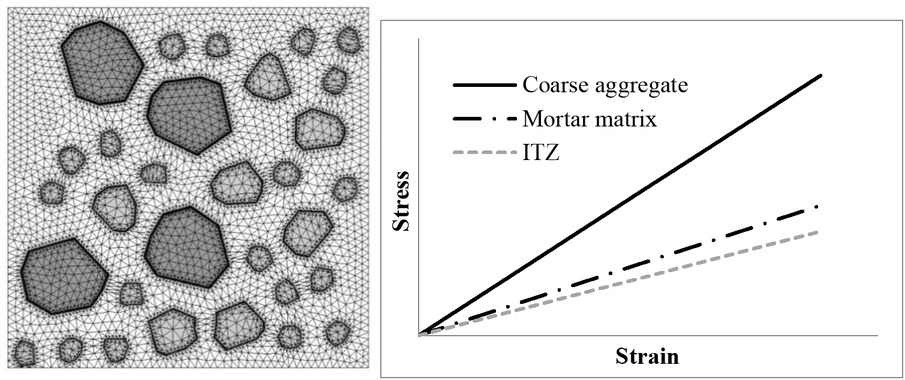
Micro components of concrete and its constitutive model
To simplify the calculation, this paper selected a simpler form for the constitutive relation and failure criterion of meso-component materials. The constitutive model used a linear elastic model, and the failure criterion used the first strength theory, that is, when the maximum tensile stress of the material exceeds the ultimate tensile strength, the material will crack.
3.2 Calculation parameters and sensitivity analysis
The calculation parameters in the linear elastic constitutive model include elastic modulus and Poisson’s ratio. The ultimate tensile strength needs to be known for the first strength theory that is used to judge whether the meso-component material damages or not.
Concrete aggregates are generally crushed stone or pebbles. Existing aggregate parameters through meso numerical simulation are often obtained based on lab physical tests or engineering analogies of standard test blocks. A large number of tests at home and abroad have shown that [13, 14], with the increase of aggregate particles, the elastic modulus decreases, the strength increases, and the Poisson’s ratio changes insignificantly. Combined with the generation of random aggregates, it is deemed that the parameters in each particle size range are the same, which is obtained by inversion. For example, if an aggregate is second graded, aggregates in the 10-20mm range have the same elastic modulus and allowable tensile strength based on their equivalent particle size, while in the 20-40mm range, the elastic modulus of aggregates is the same as their allowable tensile strength.
The porosity formed near the surface of the aggregate is higher than that on the interfacial transition zone (ITZ) of the mortar [15]. Because the cause and composition of ITZ is very complicated, the ITZ performance parameters obtained through the test method cannot be truly reflected in the composition of the concrete [16]. Therefore, its mechanical parameters are mostly based on assumptions and experience. Assuming that the interface is a uniform material, the effective elastic modulus of the interface is related to its volume fraction, and the interface is related to the ratio of the elastic modulus of the matrix. Yang [17] combined the three-phase model, and concluded that when the interface is 40um thick, the ITZ elastic modulus is 50%–70% of the matrix. According to the Literature [18], the interface tensile bond strength is about 1/3 of the mortar tensile strength.
Results of the multi-parameter inversion depend on the selection of parameters and their initial values. Through the quantitative analysis of the sensitivity of meso-parameters to macro-responses, the parameter identification is realized to improve the quantification of the meso-parameters. This paper adopted the numerical simulation for uniaxial compression test to survey the sensitivity of the parameters to the macro-responses (peak stress and peak strain) by changing a meso-parameter with other parameters unchanged. The numerical simulation test was made with reference to the lab uniaxial compression test of Ertan Arch Dam concrete in the Literature [19]. The concrete mix ratio is shown in Table 1. The cement uses 525# Emei Dam cement (28d compressive strength: 59.9MPa), both coarse and fine aggregates use syenite (wet compressive strength: 173MPa), and the sample size is 100mm×100mm. See the model in Figure 2.
Concrete mix proportion
| Cement grade | Mix proportion kg/m3 | ||||||
|---|---|---|---|---|---|---|---|
| Water | Cement | Fly ash | Artificial sand | Crushed stone 5-20mm | Crushed stone 20-40mm | 0.2% sodium lignosulphonate | |
| 525 | 180.3 | 280.6 | 112.7 | 736.4 | 530.2 | 530.2 | 0.75 |
According to the stress-strain curve measured by the test, the peak compressive stress is 29.45MPa and the peak strain 0.00188.
In order to truly and wholly reflect the sample failure, the end displacement control loading method was used during the numerical simulation analysis. According to the maximum deformation of the sample in a physical test, it was divided into 31 displacement (load) steps to load one by one. The boundary conditions were fully constrained at the bottom, and free at the top. See the Literature [20, 21, 22]. The initial parameters for numerical simulation are shown in Table 2.
Parameters of material micro components
| Material Science | Tensile strength / MPa | Poisson’s ratio | Initial value of elastic modulus / GPa |
|---|---|---|---|
| Cement mortar | 4-6 | 0.16-0.18 | 13-25 |
| Interface | 1-3 | 0.16-0.18 | 10-12.5 |
| 5-20mm aggregate | 5-10 | 0.2-0.24 | 22-40 |
| 20-40mm aggregate | 5-10 | 0.2-0.24 | 33-50 |
The sensitivity analysis requires sampling of parameters according to the Principles of Statistics. This paper adopted the Morris sampling method. 12 parameters were repeatedly sampled 40 times to obtain 480 groups of parameter samples. A mesoscopic uniaxial compression test was carried out to simulate these samples. The Morris method was used to analyze and obtain the sensitivity ranking of 12 parameters, as shown in Figure 3.
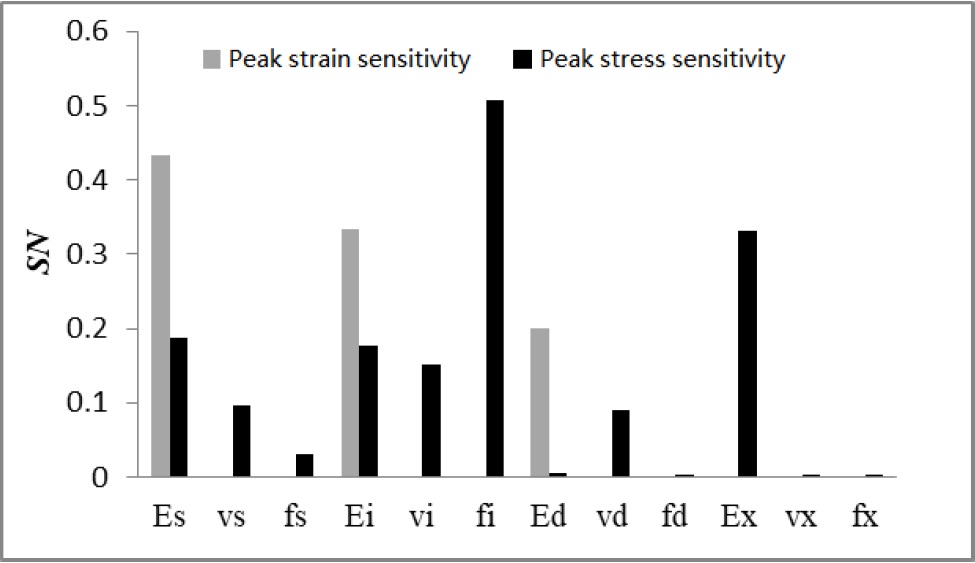
Sensitivity analysis of parameters
Note: E, v, f represent elastic modulus, Poisson’s ratio and tensile strength respectively; the subscript s represents mortar; i represents interface; d represents large aggregates, and x represents small aggregates.
It can be seen from Figure 3 that the elastic modulus of mortar matrix, interface and large aggregates have a large sensitivity to the peak strain, with the sensitivity parame ters ranked as Es > Ei > Ed; and all parameters of the interface and the mortar matrix, the Poisson’s ratio of large aggregates and the elastic modulus of small aggregates all have an effect on the peak stress, and the biggest effect is generated by the allowable tensile strength of the interface. This is because cracking starts from the interface. In this paper, 9 parameters with greater effect (except for the tensile strengths fd, fx of large and small aggregates and the Poisson’s ratio vx of small aggregates) were selected and inverted.
4 Inverse analysis of cubic sample
Similarly, the lab uniaxial compression test of Ertan Arch Dam was simulated to set up comparison of working conditions of single-aggregate inversion for other meso numerical simulation methods. The numerical simulation parameters of each working condition are shown in Table 3.
Inversion results of material micro components
| Calculation condition | Material Science | Tensile strength / MPa | Poisson’s ratio | Initial Value of elastic modulus / GPa |
|---|---|---|---|---|
| Multiaggregate inversion | Cement mortar | 5.0 | 0.18 | 13 |
| Interface | 2.4 | 0.16 | 10 | |
| 5-20mm aggregate | 10 | 0.24 | 22 | |
| 20-40mm aggregate | 8 | 0.24 | 30 | |
| Single aggregate inversion | Cement mortar | 5.1 | 0.18 | 16 |
| Interface | 3.6 | 0.18 | 10 | |
| aggregate | 8 | 0.24 | 26 | |
Due to the use of displacement control loading, the strain in the lab uniaxial compression test was controlled by the load step, and accordingly the stress value was measured. The objective function of the inverse analysis is:
Where, N is the total number of load steps, and 31 is taken here; the first 6 steps in the elastic stage are 0.002 long, and the other steps are 0.0003 long;
The maximum number of genetic iterations is 30, the number of populations is 9, the crossover probability is 0.9, and the mutation probability is 0.01. The comparison between the stress-strain curve of numerical inversion and the actual measurement is shown in Figure 4, and horizontal displacement after six steps loading of the lab uniaxial compression test is shown in Figure 5.
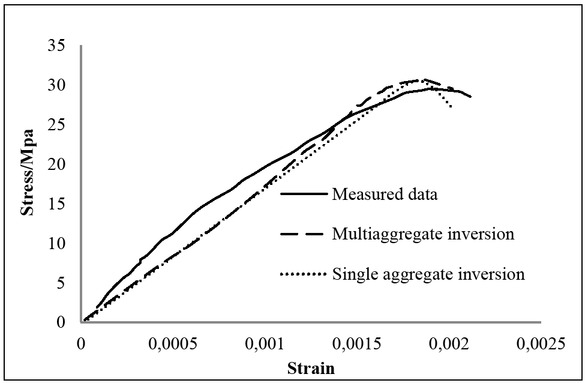
Comparison of stress-strain curve
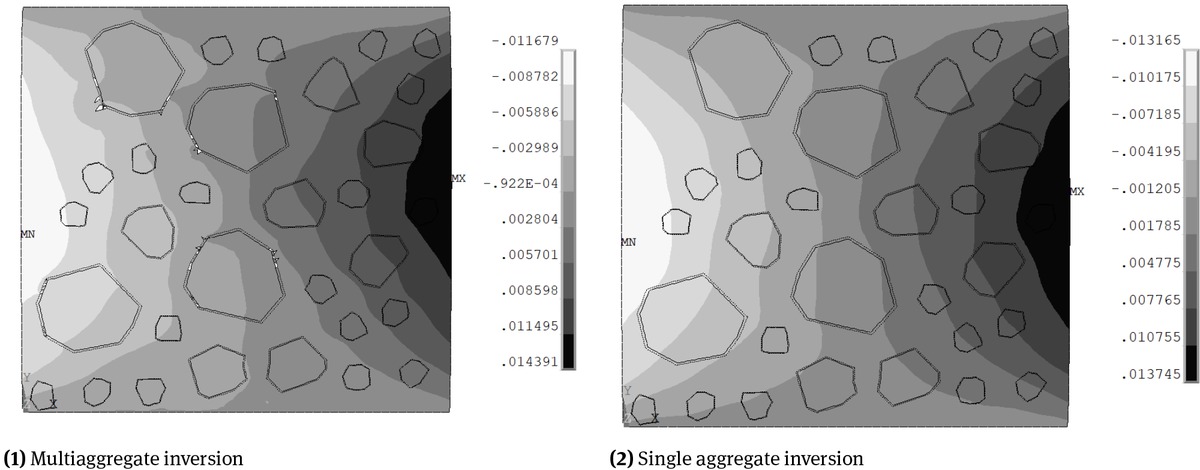
Horizontal displacement after six steps loading under different conditions (Unit:mm)
According to the figure, (1) the measured data and the multi-aggregate inversion stress-strain curve are consistent in the peak range, but differ greatly in the ascent stage. This is because the random aggregate model has a large mesh and the simulated cracks are larger than the actual cracks of the sample, which needs to be improved in the subsequent research; (2) whether the aggregate is single or not significantly affects the descent stage of the concrete stress-strain curve. The descent stage of the multi-aggregate stress-strain curve is flatter than that of the single-aggregate stress-strain curve. This may be because the small-sized aggregates have a lower elastic modulus, easing the stress concentration at the interface between aggregates and cement stone, and delaying the formation and growth of cracks [24].
5 Conclusions
Due to the limited test methods, this paper proposed a meso-parameter identification method. First, the meso-components of concrete were analyzed; the uniaxial compression test was simulated; and the Morris method was used to analyze the sensitivity of meso-component parameters to the macro-responses. Second, coupled with the sensitivity index and based on the combination of finite element method and genetic algorithm, an optimization function was established using the measured results and the simulated results, and the inversion of the meso-parameters showed that:
According to the meso-parameter sensitivity analysis based on the relationship between the meso-parameters and the macro-responses, the elastic modulus of mortar matrix, interface and large aggregates had a great effect on the peak strain, and all parameters of the interface and the mortar matrix, the Poisson’s ratio of large aggregates and the elastic modulus of small aggregates all had an effect on the peak stress, among which the allowable tensile strength of the interface produced the greatest effect.
The multi-aggregate inversion stress-strain curve was closer to the measured curve than the single-aggregate parameter inversion curve, because the elastic modulus of small-sized aggregates waslower, easing the stress concentration at the interface between aggregates and cement stone, and delaying the formation and growth of cracks.
The difference between the numerical simulation and the measured stress-strain curve in the ascent stage mainly lay in that the cracks simulated through the random aggregate model were larger than the actual ones. It needs to be improved in the subsequent research.
Acknowledgement
Fund projects: Open project of Research Center on Levee Safety and Disaster Prevention, Ministry of Water Resources (2018008); science and technology innovation talent support plan of science and Technology Department of Henan province (174200510020); science and technology innovation team support plan of colleges and universities of Henan province (19IRTSTHN030).
References
[1] Liu GY, Wang ZM. Numerical simulation study of fracture of concrete material using random aggregate model. Journal of Tsinghua University. 1996;36(1):84–9.Search in Google Scholar
[2] Peng YJ, Li BK. Numerical simulation of meso-level mechanical properties of roller compacted concrete. Journal of hydraulic engineering. 2001;11(6):19–22.Search in Google Scholar
[3] Zhang NL, Guo XM, Zhu BB, Guo L. A mesoscale model based on Monte-Carlo method for concrete fracture behavior study. Sci China Technol Sci. 2012;55(12):3278–84.10.1007/s11431-012-5035-ySearch in Google Scholar
[4] Chen PY, Kong Y, Yu HM. Research on the calibration method of microparameters of a uniaxial compression PFC2D model for rock. Chinese Journal of Underground Space and Engineering. 2018;14(05):1240–9.Search in Google Scholar
[5] Li SJ, Wang S, Wang ZY. Microparamener estimation method of concrete micro-constitutive model based on Brazilian test. Journal of Shandong University of Science and Technology. 2018;37(4):49–57.Search in Google Scholar
[6] Han X, Gao XG, Song YD. Identification of micromechanical parameters of unidirectional ceramics matrix composites based on tensile curves. Journal of Propulsion Technology. 2018;39(09):2121–6.Search in Google Scholar
[7] Wang ZY, Li SJ, Wang S. Parameter estimation procedure for meso constitutive model of concrete materials. Journal of Heilongjiang University of Science and Technology. 2019;29(02):225–9.Search in Google Scholar
[8] Xu ZJ. Monte Carlo Method. Shanghai: Shanghai Scientific & Technical Publishers; 1985.Search in Google Scholar
[9] Ma HF, Chen HQ, Li BK. Meso-structure numerical simulation of concrete specimens. Journal of hydraulic engineering. 2004;(10):27–35.Search in Google Scholar
[10] Walraven, J. C, Reinhardt, H. W. Concrete mechanics. Part A: Theory and experiments on the mechanical behavior of cracks in plain and reinforced concrete subjected to shear loading. Nasa Sti/recon Technical Report N, 1981, 82.Search in Google Scholar
[11] Guang N, Cheng RW. Genetic Algorithms and Engineering Design. John Wiley & Sons, Inc; 2007.Search in Google Scholar
[12] Saltelli A. An effective screening design for sensitivity analysis of large models. Environ Model Softw. 2007;22(10):1509–18.10.1016/j.envsoft.2006.10.004Search in Google Scholar
[13] Liu G, Xiao F, Qin T. Rock mechanics characteristics and acoustic emission rule under small-size effect. Chinese Journal of Rock Mechanics and Engineering. 2018;37:3905–17.Search in Google Scholar
[14] Wang F, Zhang JQ. Breakage behavior of original rockfill materials based on size effect of particle strength. Yantu Lixue. 2020;(01):1–9.Search in Google Scholar
[15] Hui S, Sun W. Interfacial Transition zone between Aggregate and Paste in Cementitious Composites(II):Mechanism of formation and degradation of interfacial transition zone microstructure, and ite influence factors. Journal of the Chinese Ceramic Socity. 2004;32(1):71–81.Search in Google Scholar
[16] He R, Ji SH, Huang PM, et al. Numerical simulation of the effect of interface transition zone between mortar and aggregates on the mechanics properties of concrete [Natural ence Edition]. Journal of Chang’an University. 2015;35(2):31–7.Search in Google Scholar
[17] Yang CC. Effect of the transition zone on the elastic moduli of mortar. Cement Concr Res. 1998;28(5):727–36.10.1016/S0008-8846(98)00035-0Search in Google Scholar
[18] Rao GA, Prasad BK. PRASAD BKR. Influence of the roughness of aggregate surface on the interface bond strength. Cement Concr Res. 2002;32(2):253–7.10.1016/S0008-8846(01)00668-8Search in Google Scholar
[19] Yang MQ, Lin H. Experimental study on the complete stress-strain curve of concrete under uniaxial compression. Journal of Hydraulic Engineering. 1992;(06):60–6.Search in Google Scholar
[20] Yang J, Wang JT, Wang JH, et al. Feedback analysis of material parameters of Ertan arch dam and its foundation rock. Journal of Hydroelectric Engineering. 2008;27(2):78–83.Search in Google Scholar
[21] Li JJ. Design, test and study on the concrete for Ertan Arch Dam. Water power,1998,(5):37-39.Search in Google Scholar
[22] Guo Z. A study of mechanical characteristic of aegirine syenite. Scientia geological sinica, 1983(03):279-285.Search in Google Scholar
[23] Song XM, Kong FZ, Zhan CS, et al. Sensitivity analysis of hydrological model parameters using a statistical theory approach. Shui Kexue Jinzhan. 2012;23(05):642–9.Search in Google Scholar
[24] Xiao JZ, Du JT. Complete Stress-Strain Curve of Concrete with Different Recycled Coarse Aggregates under Uniaxial Compression. Journal of Building Materials. 2008;(01):111–5.Search in Google Scholar
© 2020 Lixia G. et al., published by De Gruyter
This work is licensed under the Creative Commons Attribution 4.0 International License.
Articles in the same Issue
- Regular Articles
- Microstructure and compressive behavior of lamellar Al2O3p/Al composite prepared by freeze-drying and mechanical-pressure infiltration method
- Al3Ti/ADC12 Composite Synthesized by Ultrasonic Chemistry in Situ Reaction
- Microstructure and photocatalytic performance of micro arc oxidation coatings after heat treatment
- The effect of carbon nanotubes on the mechanical and damping properties of macro-defect-free cements
- Toughening Mechanism of the Bone — Enlightenment from the Microstructure of Goat Tibia
- Characterization of PVC/MWCNTs Nanocomposite: Solvent Blend
- Study on Macroscopic and Mesoscopic Mechanical Behavior of CSG based on Inversion of Mesoscopic Material Parameters
- Bearing properties and influence laws of concrete-filled steel tubular arches for underground mining roadway support
- Comparing Test Methods for the Intra-ply Shear Properties of Uncured Prepreg Tapes
- Investigation of Microstructural, Mechanical and Corrosion Properties of AA7010-TiB2 in-situ Metal Matrix Composite
- A Comparative Study of Structural Changes in Conventional and Unconventional Machining and Mechanical Properties Evaluation of Polypropylene Based Self Reinforced Composites
- Research on Influence mechanism of composite interlaminar shear strength under normal stress
- Mechanical properties of geopolymer foam at high temperature
- Synthesis and mechanical properties of nano-Sb2O3/BPS-PP composites
- Multiscale acoustic emission of C/SiC mini-composites and damage identification using pattern recognition
- Modifying mechanical properties of Shanghai clayey soil with construction waste and pulverized lime
- Relationship between Al2O3 Content and Wear Behavior of Al+2% Graphite Matrix Composites
- Static mechanical properties and mechanism of C200 ultra-high performance concrete (UHPC) containing coarse aggregates
- A Parametric Study on the Elliptical hole Effects of Laminate Composite Plates under Thermal Buckling Load
- Morphology and crystallization kinetics of Rubber-modified Nylon 6 Prepared by Anionic In-situ Polymerization
- Effects of Elliptical Hole on the Correlation of Natural Frequency with Buckling Load of Basalt Laminates Composite Plates
- Effect of interphase parameters on elastic modulus prediction for cellulose nanocrystal fiber reinforced polymer composite
- Mixed Matrix Membranes prepared from polysulfone and Linde Type A zeolite
- Fabrication and low-velocity impact response of pyramidal lattice stitched foam sandwich composites
- Design and static testing of wing structure of a composite four-seater electric aircraft
- CSG Elastic Modulus Model Prediction Considering Meso-components and its Effect
- Optimization of spinning parameters of 20/316L bimetal composite tube based on orthogonal test
- Chloride-induced corrosion behavior of reinforced cement mortar with MWCNTs
- Statistical Law and Predictive Analysis of Compressive Strength of Cemented Sand and Gravel
- Young’s modulus and Poisson’s ratio of the deformable cement adhesives
- Reverse localization on composite laminates using attenuated strain wave
- Impact of reinforcement on shrinkage in the concrete floors of a residential building
- Novel multi-zone self-heated composites tool for out-of-autoclave aerospace components manufacturing
- Effect of notch on static and fatigue properties of T800 fabric reinforced composites
- Electrochemical Discharge Grinding of Metal Matrix Composites Using Shaped Abrasive Tools Formed by Sintered Bronze/diamond
- Fabrication and performance of PNN-PZT piezoelectric ceramics obtained by low-temperature sintering
- The extension of thixotropy of cement paste under vibration: a shear-vibration equivalent theory
- Conventional and unconventional materials used in the production of brake pads – review
- Inverse Analysis of Concrete Meso-constitutive Model Parameters Considering Aggregate Size Effect
- Finite element model of laminate construction element with multi-phase microstructure
- Effect of Cooling Rate and Austenite Deformation on Hardness and Microstructure of 960MPa High Strength Steel
- Study on microcrystalline cellulose/chitosan blend foam gel material
- Investigating the influence of multi-walled carbon nanotubes on the mechanical and damping properties of ultra-high performance concrete
- Preparation and properties of metal textured polypropylene composites with low odor and low VOC
- Calculation Model for the Mixing Amount of Internal Curing Materials in High-strength Concrete based on Modified MULTIMOORA
- Electric degradation in PZT piezoelectric ceramics under a DC bias
- Cushioning energy absorption of regular polygonal paper corrugation tubes under axial drop impact
- Erratum
- Study on Macroscopic and Mesoscopic Mechanical Behavior of CSG based on Inversion of Mesoscopic Material Parameters
- Effect of interphase parameters on elastic modulus prediction for cellulose nanocrystal fiber reinforced polymer composite
- Statistical Law and Predictive Analysis of Compressive Strength of Cemented Sand and Gravel
- Retraction
- Assessment of nano-TiO2 and class F fly ash effects on flexural fracture and microstructure of binary blended concrete