Multiscale acoustic emission of C/SiC mini-composites and damage identification using pattern recognition
-
Chuyang Xie
 ,
Huajun Zhang
,
Huajun Zhang

Abstract
In this paper, multiscale acoustic emission (AE) signal analysis was applied to acoustic emission data processing to classify the AE signals produced during the tensile process of C/SiC mini-composites. An established unsupervised clustering algorithm was provided to classify an unknown set of AE data into reasonable classes. In order to correctly match the obtained classes of the AE signals with the damage mode of the sample, three scales of materials were involved. Single fiber tensile test and fiber bundle tensile test were firstly performed to achieve the characteristics of AE signal of fiber fracture. Parameter analysis and waveform analysis were added to extract the different features of each class of signals in the In-situ tensile test of C/SiC mini-composite. The change of strain field on the sample surface analyzed by DIC (Digital Image Correlation) revealed the corresponding relationship between matrix cracking and AE signals. Microscopic examinationwas used to correlate the clusters to the damage mode. By analyzing the evolution process of signal activation for each class against the load, it also provided a reliable basis for the correlation between the obtained classes of the AE signals and the damage mechanism of the material.
1 Introduction
Ceramic matrix composites (CMCs) have been widely used in aerospace industry, owing to their excellent mechanical properties [1, 2, 3, 4]. Therefore, it is necessary for a deep understanding of their evolution and failure mechanism. As a real-time and dynamic non-destructive testing method, acoustic emission (AE) technology has become an important method to study the damage and fracture mechanism of composite materials. AE is a transient elastic wave produced by the rapid release of local source energy in the material. One of the most important purposes of AE detection is to identify the position and characteristics of the AE source, and the effective way to solve this problem is AE signal processing.
The previous researchers [5, 6, 7, 8, 9, 10, 11] mostly described the AE source by the parameters such as, amplitude, energy, count, duration. As a whole, the single parameter analysis can only reflect the activity, intensity and development trend of the AE source. It has been proved that the single parameter analysis is not enough to an accurate separation of AE signals in the process of composite damage. Since a variety of damage mechanism will take place continuously and the single parameter describing different damage mechanism are often overlapped. Therefore, it is difficult to accurately recognize the characteristics of AE source by this signal processing method.
Pattern recognition is developed rapidly in recent years. By taking into consideration multiple AE parameters, pattern recognition technology can classify unknown AE signals into reasonable classes. It is quite different from the single parameter analysis. Unsupervised pattern recognition was proved to be a promising scheme in that it can divide AE signals into an appropriate number of class without the pre-knowledge of them. However, the selection of cluster algorithm is a significant problem. R.Gutkin, et al. [12] selected three different pattern recognition algorithms: K-means, SOM, CNN to analyze the AE signals. The approximate peak frequency distribution of matrix cracking, delamination, fiber matrix debonding, fiber fracture and fiber pullout was obtained by analyzing the peak frequency distribution of all kinds of AE signals after clustering. V.Kostopoulos, et al. [13, 14] combined a variety of different algorithms and compared the results of various algorithms in order to obtain the optimal classification of damage signals of ceramic matrix composites. In general, the unsupervised pattern recognition [15, 16, 17, 18, 19] was based on AE activity of each class combined with existing understanding of the damage mechanism of composite materials to determine the relationship between various types of signals and damage mechanisms. V.Kostopoulos, et al. [13, 14] established the relationship between damage modes and AE signals by analyzing different classes of signals and combining scanning electron microscope. M. Moevus et al. [20] used K-means clustering algorithm to analyze the damage process of two kinds of ceramic matrix composites. By observing the size and number of cracks under microscope, combining with the characteristics of various kinds of AE signals and the evolution process of the number of various signal events with strain, the signals of two different types of matrix cracking in composite materials are distinguished successfully. S.Huguet,N.Godin, et al. [21, 22] identified the typical waveforms of different damage modes in the glass fiber reinforced composite laminates by the visual observation and conventional parameter analysis. The cluster were recognized to the corresponding damage mode by comparing the waveforms of each cluster to the typical waveforms. S. Momon et al. [16]. studied the damage mechanism of C/SiC composite under static load and cyclic fatigue load at 700-1200∘C. 4 or 5 kinds of signals are classified under static load (depending on test conditions), and 4 kinds of signals are classified under cyclic fatigue load using K-means clustering. According to the analysis of AE activity, various AE characteristic parameters and SEM scanning electron microscope, the damage modes of matrix cracking, fiber matrix interface debonding and delamination, fiber fracture and were identified. Nevertheless, it is still a difficulty how to correctly correlate the AE signals after clustering with the mechanism of the AE source. There is no a standard of the AE signal characteristics for damage events.
As is known to all, different damage mechanisms such as matrix cracking, fiber fracture, debonding of fiber matrix in the continuous fiber ceramic matrix composites can be found during the tensile process. In order to establish the relationship between AE signal and different damage mechanisms accurately and reliably, different scale experiments are needed to get the AE signals at different scales. However, researchers hitherto mostly focus on the CMCs of specimen level and there are few reports on AE signal analysis of mini-composites, fiber bundles and single fiber at smaller scales.
According to the known knowledge, in this paper, in order to study the relationship between the damage mechanism and AE signals, the tensile tests under multiple scales were carried out to obtain the AE signals of the material damage process at multiple scales. Single fiber tensile test and fiber bundle tensile test were firstly performed to achieve the characteristics of AE signal of fiber fracture. Then a simple C/SiC mini-composite was used to do In-situ tensile test. The whole test was carried out under the digital microscope, in order to observe the damage process of the sample surface in real time. The DIC (Digital Image Correlation) technique was used to calculate the strain field variation on the specimen surface, which played a key role in the analysis of post-text damage identification. At the same time, parameter analysis, waveform analysis and microscopic examination were also added to cooperate with AE signal evolution process analysis of each class to identify the damage together.
2 Experimental procedure
2.1 Materials
Three scales of materials were mainly involved in this paper. They are single fiber, T300-3K carbon fiber bundle and C/SiC mini-composites. Single fiber is obtained from carbon fiber bundle and the C/SiC mini-composites are composed of carbon fibers reinforced in chemical vapor infiltration (CVI) silicon carbide matrices. All materials were manufactured by the Institute of Metal Research, Chinese Academy of Sciences. Table 1 shows the material parameter of the samples. From Table 1, E is the elasticity modu lus, T is the tensile strength, α is the coefficient of thermal expansion, r is the diameter of carbon fiber.
Material parameter of fiber and matrix
| Item | Carbon fiber | Silicon carbide matrix |
|---|---|---|
| E/GPa | 230 | 124 |
| T/MPa | 3530 | – |
| α/K−1 | −3.8×10⁻⁶ | 2.8×10⁻⁶ |
| ρ/(g/cm3) | 1.76 | 3.22 |
| r/μm | 3.5 | – |
2.2 Acoustic emission
The AE system is used for real-time and on-line detection which was a two-channel PCI-2 data acquisition system produced by PCA company. Two AE sensors (AE504A) are 8mm diameter and 17.5mm high. Vaseline is used as a coupling agent between AE sensors and the surface of the specimen. Each sensor is connected to a preamplifier (gain: 40dB, bandwidth: 10 kHz-2MHz). The peak definition time, hit definition time and hit lockout time were set to 50μs, 100μs, 300μs, respectively. Before the experiment, pencil break was used for calibration of AE testing. Nine AE parameters, Amplitude, Energy, Counts, Duration, Rise time, Counts to peak, Average frequency, Reverberation frequency and Initial frequency are recorded by AE acquisition system. Also each AE waveform is digitally stored.
2.3 Test procedure
2.3.1 Single fiber tensile test
Single fiber tensile test was performed on the test device shown in Figure 1. Since the small diameter of single fiber, before the tensile test, it was fixed on the piece of paper by AB glue. The AE sensor was placed on the lower slider and was closely attached to the surface of the fixture. Before the experiment, the piece of paper was fixed on the upper fixture and lower slider, then burn the middle section of the paper. Finally, the machine was started and the slider would move down for stretch loading. The AE threshold was equal to 58dB.

Single fiber tensile test
2.3.2 Fiber bundle tensile test
Since the fiber bundle contains a lot of fibers, both ends of the fiber bundle were nipped by four reinforced pieces fixed with AB glue as shown in Figure 2.

Fiber bundle tensile test
The axial/torsional testing system MTS 2.5t was used to fiber bundle tensile test. As shown in Figure 2, two AE sensors were positioned on the reinforced pieces coupled with Vaseline. The threshold value was set to 58dB. The whole test was under a constant displacement rate of 0.05mm/min. Only the AE data in the 50mm test section were used for subsequent analysis.
2.3.3 In-situ tensile test
The mini-composite tensile test was carried out on an in situ tensile testing machine. As shown in Figure 3, the mini-composite sample (with a 25-mm gauge length) was fixed at two reinforced pieces. The test section in the middle of the sample was 5 mm. Two AE sensors (AE504A) were coupled on the faces of the reinforced pieces with Vaseline. The threshold value was set to 55dB. As shown in Figure 3, the whole loading device was placed under a digital microscope. Before the experiment, an initial plot of the test section was need to be taken. The loading process was interrupted every 5N to take a picture of the test section until the sample fracture failure. Load was measured by load cell. Only the AE data in the 5mm test section were used for subsequent analysis.

In situ tensile test
3 Unsupervised pattern recognition technique
Unsupervised pattern recognition technique was used to classify the AE signals obtained during the testing process. The flow chart is presented in Figure 4. Next, the process of unsupervised clustering of AE signals will be introduced one by one.

Flow chart of unsupervised pattern recognition technique
3.1 AE data pre-processing
During the whole experiment process, 9 kinds of AE parameters will be recorded by the AE system [13, 19, 22, 23]. In AE experiments, noise interference is inevitable. The noise mixed in the AE signal will affect the whole experimental results. By filtering and adjusting threshold values, part of the noise can be effectively removed. According to the literature [13], there is a high correlation between Amplitude, Counts and Duration in AE signals produced by materials. Therefore, the 3 characteristic parameters were selected, by the Max-Min Distance algorithm, to separate the outliers as noise signals from AE signals. Figure 5 and Figure 6 show the results to the noise identification for fiber bundle tensile test and In-situ tensile test, respectively. So these outliers were removed from the original AE data.

Noise identification for fiber bundle tensile test

Noise identification for In-situ tensile test
3.2 The pattern features selection of AE parameters
After the preprocessing of the raw data, it is necessary to normalize the AE data. Since the AE parameters between different dimensions are quite different, the data needs to be normalized to eliminate the influence on the dimensional distance between the signals. In this paper, the Z normalization is used to transform the data under different parameters of AE to the mean value of 0 and the standard deviation of 1.
After standardizing the AE data, it is necessary to select the appropriate pattern feature for the clustering. Appropriate pattern features will help to improve the accuracy of clustering and reduce the amount of computation. Two or more relevant pattern features do not improve the accuracy of pattern recognition. Also too many pattern features will slow down the speed of operation. In this paper, based on SPSS statistical software, using hierarchical clustering of Ward’s method, choosing square Euclidean distance as measure, the relation graph between AE parameters will be draw out. First, calculate the distance between samples. Next, merge the nearest points into the same class. Then recalculate the distance between the new classes and merge the nearest class into a large class. In this way, it will continue to merge until it is merged into a class. Figure 7 and Figure 8 shows the correlation of the AE parameters for fiber bundle tensile test and In-situ tensile test. Table 2 shows the list of AE signals descriptors. Finally, the pattern features with the correlation coefficient higher than 5 was selected. Through the above analysis, Amplitude, Energy, Rise time, Average frequency and Initial frequency of the five AE parameters were selected as the pattern features for fiber bundle tensile test, while Amplitude, Energy, Average frequency and Initial frequency of the four AE parameters were selected as the pattern features for In-situ tensile test.

Correlation dendrogram for fiber bundle tensile test

Correlation dendrogram for In-situ tensile test
List of AE signals descriptors
| Number | Descriptors |
|---|---|
| 1 | Amplitude |
| 2 | Energy |
| 3 | Counts |
| 4 | Duration |
| 5 | Rise time |
| 6 | Counts to peak |
| 7 | Average frequency |
| 8 | Reverberation frequency |
| 9 | Initial frequency |
3.3 Clustering by K-means algorithm
K-means algorithm is a distance-based clustering algorithm, using distance as a similarity evaluation index. The algorithm is aimed to form a class of objects with similar distance through a constant iterative operation. Firstly, the number K of the cluster must be assumed in advance and the cluster centers will be randomly initialized. Secondly, the samples are divided into the nearest cluster according to Euclidean distance calculated between all the samples and the K cluster centers. Then, recalculate the average of all samples in every cluster as the new cluster center. Finally, repeat the above process until there is no change in the cluster centers. There are two main factors influencing the calculation of the algorithm. One is the choice of K value and the other is the choice of initial clustering center. In the K-means algorithm, the K value is given in advance. In unsupervised clustering, it is difficult to determine the K value for a given unknown data. Therefore, it is necessary to determine the appropriate K value by clustering validity analysis, which will be described later in detail. In the process of K-means clustering algorithm, K initial clustering centers must be selected first. The selection of initial value will be larger influence on the subsequent clustering results, once the initial value selection is not so good, it may not be able to get effective clustering results. In this paper, the Max-Min Distance algorithm was introduced to select the initial cluster center instead of the original random selection. By this algorithm, the initial cluster centers were obtained which were far away from each other. This was useful for subsequent clustering calculations.
3.4 Clustering validity analysis
The optimal number of clusters K was determined by using the square sum of error criterion which was used as the clustering criterion function in the paper. The sum of squares of error is defined as the sum of squares of the deviation between the data of each class and the cluster center of such a class, and summation. So the evaluation index J is defined as

Clustering validity analysis for fiber bundle tensile test
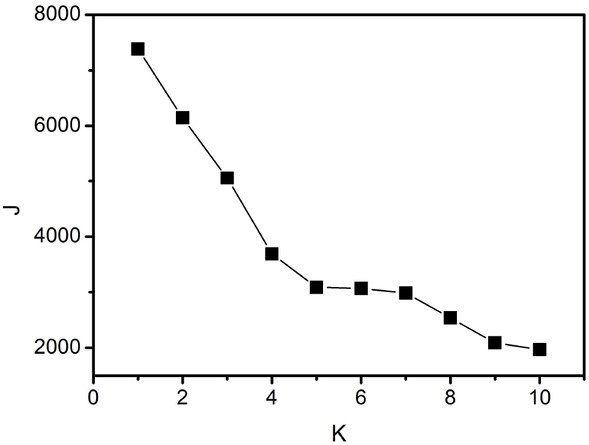
Clustering validity analysis for In-situ tensile test
4 Result and discussion
4.1 The characteristics of AE signals for single fiber tensile fracture
A total of 20 effective AE signals in single fiber failure were obtained. Table 3 shows the average of nine AE parameters from 20 signals.
Mean value of AE signal parameters for single fiber failure
| AE parameter | Mean value | AE parameter | Mean value |
|---|---|---|---|
| Amplitude/dB | 62.86 | Counts to peak | 1 |
| Energy/mv*ms | 10.57 | Average frequency/kHz | 23.29 |
| Counts | 2.57 | Reverberation | |
| Duration/μs | 125.07 | frequency/kHz | 13.14 |
| Rise time/μs | 2.57 | Initial frequency/kHz | 440.35 |
As can be seen from Table 3, the AE signals of single fiber failure were characterized by: the lower amplitude, energy, counts, rise time and long duration in time domain parameters, while the lower average frequency and reverberation frequency and the higher initial frequency in frequency domain parameters. So this kind of AE signals rise fast.
4.2 The characteristics of AE signals for fiber bundle tensile fracture
Six fiber bundle tensile tests were performed. Table 4 shows the tensile failure load, the number of signal and the number of clusters for each test. The following AE signal analysis was focused on #003. According to the clustering validity analysis, the optimal clustering was obtained with 2 classes in fiber bundle tensile test. As shown in Table 5, the signals for class1 are the main signal in the whole experiment. There are only 9 signals in class2. To observe the AE parameters, it can be found that in the signals for class2, amplitude, energy, counts, duration are significantly higher than that for class1 while average frequency and reverberation frequency are lower than that for class1. Therefore, it can be conducted that class1 and class2 be long to the same damage mode, but the signal intensity of class2 is stronger than that of class1.
List and result of fiber bundle tensile tests
| Failure Load/N | Number of signals | Number of cluster | |
|---|---|---|---|
| #001 | 213 | 1228 | 2 |
| #002 | 236 | 1487 | 2 |
| #003 | 224 | 1285 | 2 |
| #004 | 140 | 883 | 2 |
| #005 | 201 | 1385 | 3 |
| #006 | 229 | 1173 | 2 |
Average value of AE parameters per cluster for fiber bundle tensile test
| cluster | Amplitude /dB | Energy /mv*ms | Counts | Duration /μs | Rise time /μs |
|---|---|---|---|---|---|
| class1 | 74.31 | 39.85 | 54.38 | 191.25 | 16.46 |
| class2 | 97.22 | 2017.67 | 372.11 | 5451.00 | 18.22 |
| cluster | Counts to peak | Average frequency /kHz | Reverberation frequency /kHz | Initial frequency /kHz | Number of signal |
| class1 | 6.22 | 332.23 | 292.12 | 661.82 | 99.3% |
| class2 | 11.00 | 75.00 | 72.44 | 605.89 | 9 |
The fiber bundle used in the tensile test are made up of 3000 single fibers. All these fibers will bear the tensile load together. However, there will be some differences in these single fibers, and some fibers may have initial defects. So in the actual test, a small part of fibers will break first. With the increase of the load, fracture of the fiber will be more and more and now the signals will be similar to class1. Until the load reaches a certain value, a large number of fibers break at the same time to produce a signal similar to the class2. As shown in Figure 11, the first AE signal did not appear until the loading time reached 430s. The number of AE events grew slowly at the beginning of test, indicating that there was very little fiber breakage. When the loading time reached 830s, the first class2 signal appeared and there was an obvious step increase in the class1 signal. It showed that a large number of fibers were broken at the same time. Later at 900s and 1000s, the class2 signals appeared continuously. It indicated that the fiber bundle was constantly being destroyed, and the large number of fibers inside were broken.

Cumulative events of AE signals for each cluster for fiber bundle tensile test
Compared with Table 3, the amplitude, energy, counts, duration, rise time and counts to peak of the AE signals in single fiber breakage are significantly smaller than that of class1 and class2 signals in Table 5. This showed that the signal of class1 had the AE signals of single fiber breakage and the AE signals of multiple fiber breakage at the same time. These multiple fiber breakage signals can be equivalent to the coupling of single fiber breakage signals. So its intensity is stronger than the signal of single fiber breakage. Similarly, the signal intensity of the class 2 is greater. So it can be judged as the AE signals generated by the simultaneous failure of a large number of fibers.
Figure 12 shows the peak frequency distribution of all AE signals after FFT transformation during the fiber bundle tensile process. It is obvious that the peak frequency of AE signals of fiber fracture is almost concentrated between 200kHz-300kHz.

FFT peak frequency distribution of fiber bundle tensile acoustic emission signal
4.3 Damage identification according to the classified AE data
4.3.1 The parameters and waveform analysis for each class
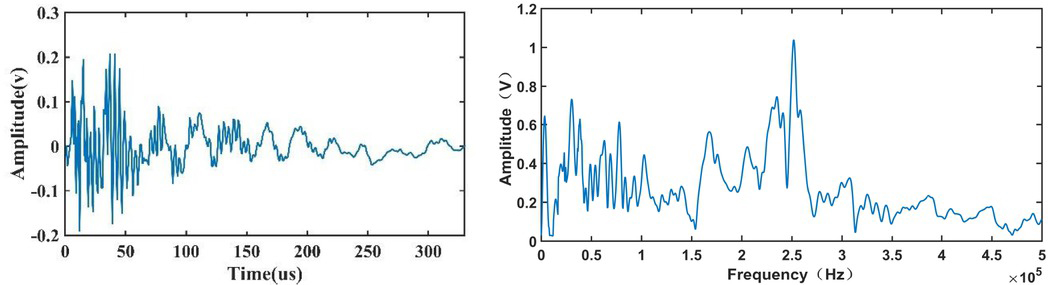
Five mini-composite tensile tests were performed. Table 6 shows the tensile failure load and the number of clusters for each test. The following AE signal analysis was focused on M5. According to Section 3.4, the AE signals of mini-composites should be categorized into five classes. Table 7 provides the mean of the characteristic parameters of the AE signals in each class after k-means clustering. Also typical waveform and FFT spectrogram for each class is showed in Figure 13-17.

Typical waveform and FFT spectrogram for class1
List and result of C/SiC mini-composite tensile test
| Failure Load/N | Number of cluster | |
|---|---|---|
| M1 | 165 | 4 |
| M2 | 170 | 5 |
| M3 | 155 | 4 |
| M4 | 190 | 5 |
| M5 | 180 | 5 |
Average value of AE parameters per cluster for In-situ tensile test
| cluster | Amplitude /dB | Energy /mv*ms | Counts | Duration /μs | Rise time /μs |
|---|---|---|---|---|---|
| class 1 | 57.82 | 1.74 | 3.30 | 24.67 | 8.85 |
| class 2 | 64.36 | 149.00 | 1.91 | 906.91 | 404.1 |
| class 3 | 67.65 | 5.90 | 13.68 | 79.40 | 8.55 |
| class 4 | 58.93 | 0.20 | 3.59 | 7.16 | 1.48 |
| class5 | 84.36 | 90.82 | 77.45 | 680.09 | 55.64 |
| cluster | Counts to peak | Average frequency /kHz | Reverberation frequency /kHz | Initial frequency /kHz | Number of signal |
| class 1 | 2.06 | 158.42 | 88.66 | 667.81 | 53.1% |
| class 2 | 1.18 | 2.45 | 1.00 | 4.36 | 0.6% |
| class 3 | 4.61 | 235.53 | 171.37 | 883.39 | 29.1% |
| class 4 | 1.88 | 725.44 | 296.31 | 1247.97 | 16.6% |
| class5 | 15.18 | 110.18 | 90.91 | 687.00 | 0.6% |
As is obvious, the signals for class 1 and class 4 have low amplitude, energy and counts. The former signals rise slowly and have a short duration. The latter signals rise fast and have a very short duration. According to the FFT spectrum analysis, the peak frequency of the class1 spectrum is around 40kHz while the class4 spectrum have a main peak at around 40kHz and a hypo-peak at around 250kHz. The signals for class 3 are different from them for class 1 and class 4. They have higher amplitude, energy and counts. They rise fast and also have long duration. The amplitude of class3 FFT spectrum reaches the highest point at 250kHz. The waveform of class5 is similar to that of class3, but the signal strength of class 5 is significantly stronger than that of class. The class5 spectrum have two main peak at around 40kHz and 250kHz. The signals for class 2 is characterized by higher energy, duration and rise time, lower counts, initial frequency, reverberation frequency and average frequency compared with signals for other classes. By observing Figure 14, the waveform and FFT spectrogram of class 2 is completely different from that of other classes. So it is assumed that the signals in class 2 are not the AE signals emitted by the sample. They must be noise signals that are not removed in AE data pre-processing.

Typical waveform and FFT spectrogram for class2
Typical waveform and FFT spectrogram for class3

Typical waveform and FFT spectrogram for class4

Typical waveform and FFT spectrogram for class5
Combined with Section 4.1 and 4.2, it can be found that the characteristics of the class3 signals are similar with signals in Table 3 and Table 5. Also, the peak frequency of class3 signals was consistent with the signals in the fiber bundle tensile. So it could be determined that the signals of class3 were produced by fiber fracture, while the signals of class5 were caused by the simultaneous failure of a large number of fibers.
Cumulative events for each class at the beginning of the In-situ tensile test
| Force (N) | Cumulative events :class1 | Cumulative events :class2 | Cumulative events :class3 | Cumulative events :class4 | Cumulative events :class5 |
|---|---|---|---|---|---|
| 5 | 0 | 0 | 0 | 0 | 0 |
| 10 | 0 | 0 | 0 | 0 | 0 |
| 15 | 7 | 0 | 0 | 1 | 0 |
| 20 | 8 | 0 | 1 | 2 | 0 |
| 25 | 18 | 0 | 3 | 5 | 0 |
4.3.2 Damage identification by DIC
In recent years, DIC (Digital Image Correlation) has been widely use in the field of mechanics. It is based on the image correlation point algorithm to calculate the displacement or strain distribution of the object surface. In the paper, before the experiment, a random speckle was sprayed on the surface of the sample and also an image was taken as the reference. During the experiment, an image was taken every 5N loading until the sample failed. Figure 18 shows the material strain-force curve calculated by DIC. In order to better understand the variation of the surface strain distribution of the specimen, Figure 19-24 show the strain field distribution under different loads. Clearly, something interesting can be observed at the beginning of the experiment. Table 6 shows the distribution of the cumulative events for each class at the beginning of the experiment. Combined with Figure and Table above, it was found that there is no significant strain of the larger area before the Force=10N, while no signals were collected from the AE system, indicating that the material at this time has not been obvious damage. Observing the strain field distribution of the Force = 15N, in the middle there was a significant increase in the area of strain, indicating the presence of micro cracks here. Corresponding to it, AE system collected 7 signals for class 1 and 1 signal for class 4. And then to observe the strain field distribution of Force=20N, 25N, 30N, three obvious large strain regions were formed gradually in the strain field distribution. It can be deduced that there were obvious matrix cracks in these three regions and along with crack propagation. Corresponding to it, the class 1 signal continued to increase, while the class 3 signal appeared in Force = 20N. It also can be seen that the signals for class 1 were obvious more than that for class 3 and class 4. Consequently, it is expected that class 1 must represent the matrix cracking.

The strain-force curve of the C/SiC mini-composite

Strain distribution(Force=5N)
4.3.3 Fracture analysis by SEM
The fracture surfaces of C/SiC mini-composites were investigated using the scanning electronic microscope (SEM). In Figure 25, it is obvious that fiber failure is the main failure mode in the static tensile test. The fracture of fiber is uneven, and fiber pull-out phenomenon can be found. The white arrows in Figure 25(a)(b) shows that fiber/ matrix interface debonding is also one of the failure mode in the static tensile test. This indicates that during the static tensile test, due to the load in the fiber direction, the weak interlaminar shear force leads to the debonding phenomenon. So fiber/matrix interface debonding is also one of the main source of AE signals.

Strain distribution(Force=10N)

Strain distribution(Force=15N)

Strain distribution(Force=20N)

Strain distribution(Force=25N)

Strain distribution(Force=30N)

SEM micrographs of the failed C/SiC mini-composites
4.3.4 Identification of damage mode for each class
Figure 26 shows the entire process of the sample damage evolution. The cumulative AE events of each class and the strain corresponding to the load are shown in it. As it can be seen in Figure 26, the whole experimental process can be divided into three stages, Stage I: the initial stage, the material was in elastic deformation. In the stage, the AE signal was rarely produced, indicating that the damage of the material was very little at this time; Stage II: the development stage, the material entered the plastic deformation stage. At this time, the damage of the material began to increase, and the AE signals also increased gradually; Stage III: material failure stage, the AE signals increased dramatically.

Cumulative events of AE signals for each cluster for Insitu tensile test
Class1 is the earliest signals in the experiment, with the largest number of signals in the entire experiment, and appeared until the material failure. Compared with other class signals, in the Stage I, the class1 signals are the most, and the signals increases gradually after entering the Stage II, and the cumulative signal increase more and more, showing an exponential growth mode. Combined with Section 4.3.1 and 4.3.2 analysis, class1 must represent the damage of matrix cracking. This damage will produce a AE signal with a peak frequency around 40kHz.
The class3 signals occurred somewhat later than the class1 and class4 signals. Compared with class1, the number of signals in the stage1 is very small. Compared with class1, the class3 signals are very small in Stage I. In the Stage II, the number of signals showed a linear increase and in material failure stage, a huge amount of such signals burst. Combined with Section 4.1, 4.2 and 4.3.1 analysis, the class3 signals correspond to the fiber failure. This damage will produce a AE signal with a peak frequency around 250kHz.
The class4 signals and class1 signals appear simultaneously and the evolution process of class4 is similar to that of class3. Similarly, a large number of signals occurred near the fracture of materials, but the number is far less than that of class1 and class3. Combined with Section 4.3.1 and 4.3.3 analysis, the class4 could attributed to the debonding and friction of fiber matrix interface layer, which occurs after matrix cracking and promotes the propagation of matrix crack, and paves the way for fiber fracture. So the FFT spectrum of this damage have two peaks. The main peak is at around 40kHz and the second peak is at around 250kHz.
The class5 signals are mainly concentrated in the fracture of the material. According to Table 7 and Figure 17, the waveform characteristics and signal characteristics of class5 are similar to those of class3, but the signal intensity of class5 is obviously stronger than that of class3. So class5 is inferred to correspond to multiple fiber failure. At the same time, matrix cracking, interface debonding are also coupled in it. The FFT spectrum of this damage have two main peaks at around 40kHz and 250kHz.
According to the analysis of 4.3.1 above, the class2 signals are completely different from other classes. As it can be shown in Figure 14, the clsaa2 signals appeared irregularly. Therefore, it refers to the noise that has not been removed during AE data pre-processing.
5 Conclusions
In order to establish the relationship between the damage mechanism of C/SiC composite material and the AE signals accurately, multiscale AE signal analysis was added to the AE data processing. The tensile tests of the materials were carried out in three different scales, and three sets of AE signals were obtained.
The AE signals of fiber fracture can be obtained by single fiber tensile. The signals rise fast and have a long duration, low amplitude, energy and counts. There were two kinds of effective AE signals in the process of fiber bundle failure. The characteristics of these two kinds of AE signals are similar to that of the AE signal of single fiber fracture while the signal intensity is obviously larger. This can be attributed to the coupling of multiple fibers at the same time.
In the In-situ tensile test of C/SiC mini-composites., the AE signals of the whole experiment were divided into five classes. DIC (Digital Image Correlation) as a promising technique has been proved to be very helpful in observing changes in the surface of a sample. Strain field on the specimen surface throughout the experiment was obtained by DIC technique. The changes of the strain field in the initial stage of the experiment were analyzed emphatically and compared with the changes of the AE signals of all classes. The AE signals corresponding to the matrix cracking are successfully identified. These signals rise slowly and have a short duration and low amplitude. Then, the AE signals of fiber fracture were identified by parameters analysis. Finally, combined with the fracture analysis by SEM and the evolution process of each class activation of signal to the load, the signals of the debonding and friction of fiber/ matrix interface layer were identified. These signals have a very low energy and high Average frequency, Reverberation frequency and Initial frequency.
This methodology will further be applied to AE experiments on the C/SiC composite for specimen level. In view of the simple structure of the C/SiC mini-composites, compared with specimen level, the damage mechanism is relatively simple. The results and methods obtained in this paper can be a reference for signals analysis of later experiments.
Acknowledgement
This work was supported by National Science and Technology Major Project (2017-IV-0005-0042).
References
[1] Yu G, Gao X, Song Y. Experimental investigation of the tensiontorsion coupling behavior on needled unidirectional C/SiC composites. Materials Science and Engineering: A, 2017,696:190-197.10.1016/j.msea.2017.04.028Search in Google Scholar
[2] Whitlow T, Jones E, Przybyla C. In-situ damage monitoring of a SiC/SiC ceramic matrix composite using acoustic emission and digital image correlation. Composite Structures, 2016,158:245-251.10.1016/j.compstruct.2016.09.040Search in Google Scholar
[3] Yang C P, Jia F, Wang B, et al. Unified tensile model for unidirectional ceramic matrix composites with degraded fibers and interface. Journal of the European Ceramic Society, 2019,39(2-3):222-228.10.1016/j.jeurceramsoc.2018.09.006Search in Google Scholar
[4] Schmidt S, Beyer S, Knabe H, et al. Advanced ceramic matrix composite materials for current and future propulsion technology applications. Acta Astronautica, 2004,55(3-9):409-420.10.1016/j.actaastro.2004.05.052Search in Google Scholar
[5] Morscher G N. Modal acoustic emission of damage accumulation in a woven SiC/SiC composite. COMPOSITES SCIENCE AND TECHNOLOGY, 1999,59(5):687-697.10.1016/S0266-3538(98)00121-3Search in Google Scholar
[6] Maillet E, Godin N, R Mili M, et al. Analysis of Acoustic Emission energy release during static fatigue tests at intermediate temperatures on Ceramic Matrix Composites: Towards rupture time prediction. Composites Science and Technology, 2012,72(9):1001-1007.10.1016/j.compscitech.2012.03.011Search in Google Scholar
[7] Dassios K G, Aggelis D G, Kordatos E Z, et al. Cyclic loading of a SiC-fiber reinforced ceramic matrix composite reveals damage mechanisms and thermal residual stress state. Composites Part A: Applied Science and Manufacturing, 2013,44:105-113.10.1016/j.compositesa.2012.06.011Search in Google Scholar
[8] Kaya F. Damage assessment of oxide fibre reinforced oxide ceramic matrix composites using acoustic emission. Ceramics International, 2007,33(2):279-284.10.1016/j.ceramint.2005.11.016Search in Google Scholar
[9] Almansour A, Maillet E, Ramasamy S, et al. Effect of fiber content on single tow SiC minicomposite mechanical and damage properties using acoustic emission. Journal of the European Ceramic Society, 2015,35(13):3389-3399.10.1016/j.jeurceramsoc.2015.06.001Search in Google Scholar
[10] Breede F, Koch D, Maillet E, et al. Modal acoustic emission of damage accumulation in C/C–SiC composites with different fiber architectures. Ceramics International, 2015,41(9):12087-12098.10.1016/j.ceramint.2015.06.026Search in Google Scholar
[11] Dassios K G, Kordatos E Z, Aggelis D G, et al. Nondestructive Damage Evaluation in Ceramic Matrix Composites for Aerospace Applications. The Scientific World Journal, 2013,2013:1-12.10.1155/2013/715945Search in Google Scholar PubMed PubMed Central
[12] Gutkin R, Green C J, Vangrattanachai S, et al. On acoustic emission for failure investigation in CFRP: Pattern recognition and peak frequency analyses. Mechanical Systems and Signal Processing, 2011,25(4):1393-1407.10.1016/j.ymssp.2010.11.014Search in Google Scholar
[13] Kostopoulos V, Loutas T H, Kontsos A, et al. On the identification of the failure mechanisms in oxide/oxide composites using acoustic emission. NDT & E International, 2003,36(8):571-580.10.1016/S0963-8695(03)00068-9Search in Google Scholar
[14] KOSTOPOULOS V, LOUTAS T, DASSIOS K. Fracture behavior and damage mechanisms identification of SiC/glass ceramic composites using AE monitoring. Composites Science and Technology, 2007,67(7-8):1740-1746.10.1016/j.compscitech.2005.02.002Search in Google Scholar
[15] Bhat C, Bhat M R, Murthy C R L. Acoustic emission characterization of failure modes in composites with ANN. Composite Structures, 2003,61(3):213-220.10.1016/S0263-8223(03)00068-0Search in Google Scholar
[16] Momon S, Godin N, Reynaud P, et al. Unsupervised and supervised classification of AE data collected during fatigue test on CMC at high temperature. Composites Part A Applied Science & Manufacturing, 2012,43(2):254-260.10.1016/j.compositesa.2011.10.016Search in Google Scholar
[17] Pappas Y Z,Markopoulos Y P, Kostopoulos V. Failure mechanisms analysis of 2D carbon/carbon using acoustic emission monitoring. Ndt & E International, 1998,31(3):157-163.10.1016/S0963-8695(98)00002-4Search in Google Scholar
[18] Philippidis T P, Nikolaidis V N, Anastassopoulos A A. Damage characterization of carbon/carbon laminates using neural network techniques on AE signals. Ndt & E International, 1998,31(5):329-340.10.1016/S0963-8695(98)00015-2Search in Google Scholar
[19] Yang B, Zhuang X, Zhang T, et al. Damage Mode Identification for the Clustering Analysis of AE Signals in Thermoplastic Composites. Journal of Nondestructive Evaluation, 2009,28(3-4):163-168.10.1007/s10921-009-0059-3Search in Google Scholar
[20] Moevus M, Godin N, R Mili M, et al. Analysis of damage mechanisms and associated acoustic emission in two SiCf/[Si–B–C] composites exhibiting different tensile behaviours. Part II: Unsupervised acoustic emission data clustering. Composites Science and Technology, 2008,68(6):1258-1265.10.1016/j.compscitech.2007.12.002Search in Google Scholar
[21] Godin N, Huguet S, Gaertner R. Integration of the Kohonen’s self-organising map and k-means algorithm for the segmentation of the AE data collected during tensile tests on cross-plycomposites. NDT & E International, 2005,38(4):299-309.10.1016/j.ndteint.2004.09.006Search in Google Scholar
[22] Godin N, Huguet S, Gaertner R, et al. Clustering of acoustic emission signals collected during tensile tests on unidirectional glass/polyester composite using supervised and unsupervised classifiers. NDT & E International, 2004,37(4):253-264.10.1016/j.ndteint.2003.09.010Search in Google Scholar
[23] Yang B, Yan X. Identification of damage mechanisms in self-reinforced polyethylene composites by using pattern recognition techniques on AE data. 2009,24(3):251-260.10.1080/10589750802195477Search in Google Scholar
© 2020 C. Xie et al., published by De Gruyter
This work is licensed under the Creative Commons Attribution 4.0 International License.
Articles in the same Issue
- Regular Articles
- Microstructure and compressive behavior of lamellar Al2O3p/Al composite prepared by freeze-drying and mechanical-pressure infiltration method
- Al3Ti/ADC12 Composite Synthesized by Ultrasonic Chemistry in Situ Reaction
- Microstructure and photocatalytic performance of micro arc oxidation coatings after heat treatment
- The effect of carbon nanotubes on the mechanical and damping properties of macro-defect-free cements
- Toughening Mechanism of the Bone — Enlightenment from the Microstructure of Goat Tibia
- Characterization of PVC/MWCNTs Nanocomposite: Solvent Blend
- Study on Macroscopic and Mesoscopic Mechanical Behavior of CSG based on Inversion of Mesoscopic Material Parameters
- Bearing properties and influence laws of concrete-filled steel tubular arches for underground mining roadway support
- Comparing Test Methods for the Intra-ply Shear Properties of Uncured Prepreg Tapes
- Investigation of Microstructural, Mechanical and Corrosion Properties of AA7010-TiB2 in-situ Metal Matrix Composite
- A Comparative Study of Structural Changes in Conventional and Unconventional Machining and Mechanical Properties Evaluation of Polypropylene Based Self Reinforced Composites
- Research on Influence mechanism of composite interlaminar shear strength under normal stress
- Mechanical properties of geopolymer foam at high temperature
- Synthesis and mechanical properties of nano-Sb2O3/BPS-PP composites
- Multiscale acoustic emission of C/SiC mini-composites and damage identification using pattern recognition
- Modifying mechanical properties of Shanghai clayey soil with construction waste and pulverized lime
- Relationship between Al2O3 Content and Wear Behavior of Al+2% Graphite Matrix Composites
- Static mechanical properties and mechanism of C200 ultra-high performance concrete (UHPC) containing coarse aggregates
- A Parametric Study on the Elliptical hole Effects of Laminate Composite Plates under Thermal Buckling Load
- Morphology and crystallization kinetics of Rubber-modified Nylon 6 Prepared by Anionic In-situ Polymerization
- Effects of Elliptical Hole on the Correlation of Natural Frequency with Buckling Load of Basalt Laminates Composite Plates
- Effect of interphase parameters on elastic modulus prediction for cellulose nanocrystal fiber reinforced polymer composite
- Mixed Matrix Membranes prepared from polysulfone and Linde Type A zeolite
- Fabrication and low-velocity impact response of pyramidal lattice stitched foam sandwich composites
- Design and static testing of wing structure of a composite four-seater electric aircraft
- CSG Elastic Modulus Model Prediction Considering Meso-components and its Effect
- Optimization of spinning parameters of 20/316L bimetal composite tube based on orthogonal test
- Chloride-induced corrosion behavior of reinforced cement mortar with MWCNTs
- Statistical Law and Predictive Analysis of Compressive Strength of Cemented Sand and Gravel
- Young’s modulus and Poisson’s ratio of the deformable cement adhesives
- Reverse localization on composite laminates using attenuated strain wave
- Impact of reinforcement on shrinkage in the concrete floors of a residential building
- Novel multi-zone self-heated composites tool for out-of-autoclave aerospace components manufacturing
- Effect of notch on static and fatigue properties of T800 fabric reinforced composites
- Electrochemical Discharge Grinding of Metal Matrix Composites Using Shaped Abrasive Tools Formed by Sintered Bronze/diamond
- Fabrication and performance of PNN-PZT piezoelectric ceramics obtained by low-temperature sintering
- The extension of thixotropy of cement paste under vibration: a shear-vibration equivalent theory
- Conventional and unconventional materials used in the production of brake pads – review
- Inverse Analysis of Concrete Meso-constitutive Model Parameters Considering Aggregate Size Effect
- Finite element model of laminate construction element with multi-phase microstructure
- Effect of Cooling Rate and Austenite Deformation on Hardness and Microstructure of 960MPa High Strength Steel
- Study on microcrystalline cellulose/chitosan blend foam gel material
- Investigating the influence of multi-walled carbon nanotubes on the mechanical and damping properties of ultra-high performance concrete
- Preparation and properties of metal textured polypropylene composites with low odor and low VOC
- Calculation Model for the Mixing Amount of Internal Curing Materials in High-strength Concrete based on Modified MULTIMOORA
- Electric degradation in PZT piezoelectric ceramics under a DC bias
- Cushioning energy absorption of regular polygonal paper corrugation tubes under axial drop impact
- Erratum
- Study on Macroscopic and Mesoscopic Mechanical Behavior of CSG based on Inversion of Mesoscopic Material Parameters
- Effect of interphase parameters on elastic modulus prediction for cellulose nanocrystal fiber reinforced polymer composite
- Statistical Law and Predictive Analysis of Compressive Strength of Cemented Sand and Gravel
- Retraction
- Assessment of nano-TiO2 and class F fly ash effects on flexural fracture and microstructure of binary blended concrete