
Thermal decomposition of copper(II) hydroxide and hydroxocarbonates according to X-ray photoelectron spectroscopy in operando
-
Marina A. Shumilova
 und
Feodor F. Chausov
und
Feodor F. Chausov

Abstract
The thermal decomposition of copper(II) hydroxide, malachite, and azurite was studied using X-ray photoelectron spectroscopy in operando within the spectrometer’s working chamber. We found that copper(II) hydroxide breaks down completely at 160 °C, forming copper(II) oxide (tenorite), which has a similar structure. Azurite has a more complex decomposition process, where a water molecule is split first, followed by the release of carbon dioxide to form copper(II) oxide. Malachite is the most resistant to decomposition, as it starts to break down only at 280 °C, with the simultaneous splitting of water and carbon dioxide due to the hydrogen bond between the hydroxide and carbonate groups. Therefore, the crystal structure and the presence of hydrogen bonds determine the conditions and stages of thermal decomposition of these copper compounds.
1 Introduction
Copper(II) hydroxide (Cu(OH)2), also known as the serpentinite, 1 copper(II) dihydroxymonocarbonate (Cu2CO3(OH)2), commonly known as the malachite, 2 , 3 and copper(II) dihydroxodicarbonate (Cu3(CO3)2(OH)2), known as the azurite, 4 are common forms of copper(II) deposits. They are often used as precursors for micro- and nanodispersed copper(II) oxide, which is used in catalysts and other functional materials. 5 , 6 The decomposition processes of Cu(OH)2, Cu2CO3(OH)2, and Cu3(CO3)2(OH)2 have been extensively studied using various methods.
The topotactic mechanism 7 , 8 of radiation-, thermally- and deformation-induced 9 decomposition of Cu(OH)2 in the solid phase has been investigated, as well as the kinetic regularities of thermal decomposition. 10 The reaction
occurs in one stage at 145 ÷ 160 °C with an endothermic effect. Decomposition occurs by the simultaneous cleavage of one of the OH groups and the proton of the neighboring OH group bound to it by a hydrogen bond, followed by the formation of the CuO structure due to displacements of copper and oxygen atoms.
The thermal decomposition processes of malachite (Cu2CO3(OH)2) and azurite (Cu3(CO3)2(OH)2), which have a more complex crystal structure, are being discussed. It is suggested that azurite decomposes to form malachite as an intermediate product 11
To another opinion, 12 malachite decomposes to form azurite as an intermediate product.
This scheme is distrustful since malachite decomposes by reaction (4) at about 325 °C, and azurite begins to lose constitutional water by reaction (2) at about 160 °C. The same can be said about the reaction (5), under which Cu(OH)2 will be thermodynamically unstable.
Moreover, it has been demonstrated 13 that during the thermal decomposition of malachite, CO2 and H2O are simultaneously released in the temperature range of 300–400 °C, favoring a different decomposition pathway (3).
Additionally, 14 a model is proposed for the decomposition of azurite and malachite to form the intermediate products Cu2CO3 and CuCO3
which then decompose further.
This paper presents the results of studying the processes of thermal decomposition of Cu(OH)2, Cu2CO3(OH)2, and Cu3(CO3)2(OH)2 by the XPS method in operando directly in the working chamber of X-ray photoelectron spectrometer.
2 Experiment
Copper(II) hydroxide, Cu(OH)2, is obtained by reacting a solution of 0.3 mol NaOH in 200 cm3 of distilled water with a solution of 0.1 mol CuSO4·5H2O in 200 cm3 of distilled water at room temperature. The elemental analysis showed that copper was found at 65.2 ± 0.2 wt%, which is consistent with the calculated value for Cu(OH)2 of 64.95 wt%. X-ray powder diffraction (XRPD) (Miniflex 600, Co Kα-radiation) resulted in the following d-spacing values (Å): 5.30, 3.75, 2.64, 2.51, 2.37, 2.28, and 1.73, which agrees with reference. 1 The IR spectrum (FSM-1201, using KBr pellets) showed peaks at 460 ν(Cu–O), 701 δ(Cu–O–H), 756 δ(O–Cu–O), and 3,598 ν(O–H) cm−1, consistent with reference. 15 In synchronous thermal analysis (STA, Shimadzu DTG-60H, 3 °C/min, pure argon atmosphere), we observed an endothermic peak between 120 and 200 °C with a weight loss of −26.2 % (H2O).
Malachite, Cu2CO3(OH)2, is produced by reacting a solution of 0.25 mol NaHCO3 in 200 cm3 of distilled water with a solution of 0.1 mol CuSO4·5H2O in 200 cm3 of distilled water at 90–95 °C. The elemental analysis indicated that copper was found at 57.0 ± 0.2 wt%, compared to the calculated value of 57.27 wt% for Cu2CO3(OH)2. XPRD revealed the following d-spacing values (Å): 6.01, 5.07, 3.72, 2.86, 2.83, 2.80, 2.55, and 2.47, which corresponds to reference. 3 The IR spectrum exhibited peaks at 505 ν(Cu–O), 528 ν(Cu–OH), 580 ν(Cu–O), 720, 753, 800, 827 ν(CO3), 890, 1,044 δ(O–H), 1,102, 1,403, 1,511 ν(CO3), and 3,330, 3,415 ν(O–H) cm−1, consistent with references. 16 In thermal analysis an endothermic peak was observed between 295 and 360 °C with a weight loss of −29.1 % (H2O + CO2).
Azurite, Cu3(CO3)2(OH)2, is synthesized by reacting a solution of 0.25 mol Na2CO3 in 200 cm3 of distilled water with a solution of 0.1 mol CuSO4·5H2O in the same volume of distilled water at room temperature. The elemental analysis showed copper content at 54.7 ± 0.2 wt%, close to the calculated value of 55.10 wt% for Cu3(CO3)2(OH)2. XRPD produced the following d-spacing values (Å): 5.17, 5.09, 3.67, 3.53, 2.51, 2.29, 2.22, 1.95, and 1.59, which is consistent with reference. 4 The IR spectrum presented peaks at 460, 498 (Cu–O), 701, 756, 820, 833 ν(CO3), 851 δ(O–H), 1,106, 1,398, 1,492, 1,658, 1,681, and 1830 ν(CO3), as well as 3,426 ν(O–H) cm−1, aligning with reference. 16 Thermal analysis showed an endothermic peak from 90–150 °C with a −6.0 % weight loss (H2O), 160–335 °C with no effect and −11.2 % weight loss (CO2), followed by a second endothermic peak from 335–350 °C with a −14.4 % weight loss (CO2).
An X-ray photoelectron spectrometer, EMS-3, developed by the Udmurt Federal Research Center of the Ural Branch of the Russian Academy of Sciences, was utilized to perform XPS in operando under thermal effects on samples of the studied minerals. 17 The diagram of the device is shown in Figure 1a.
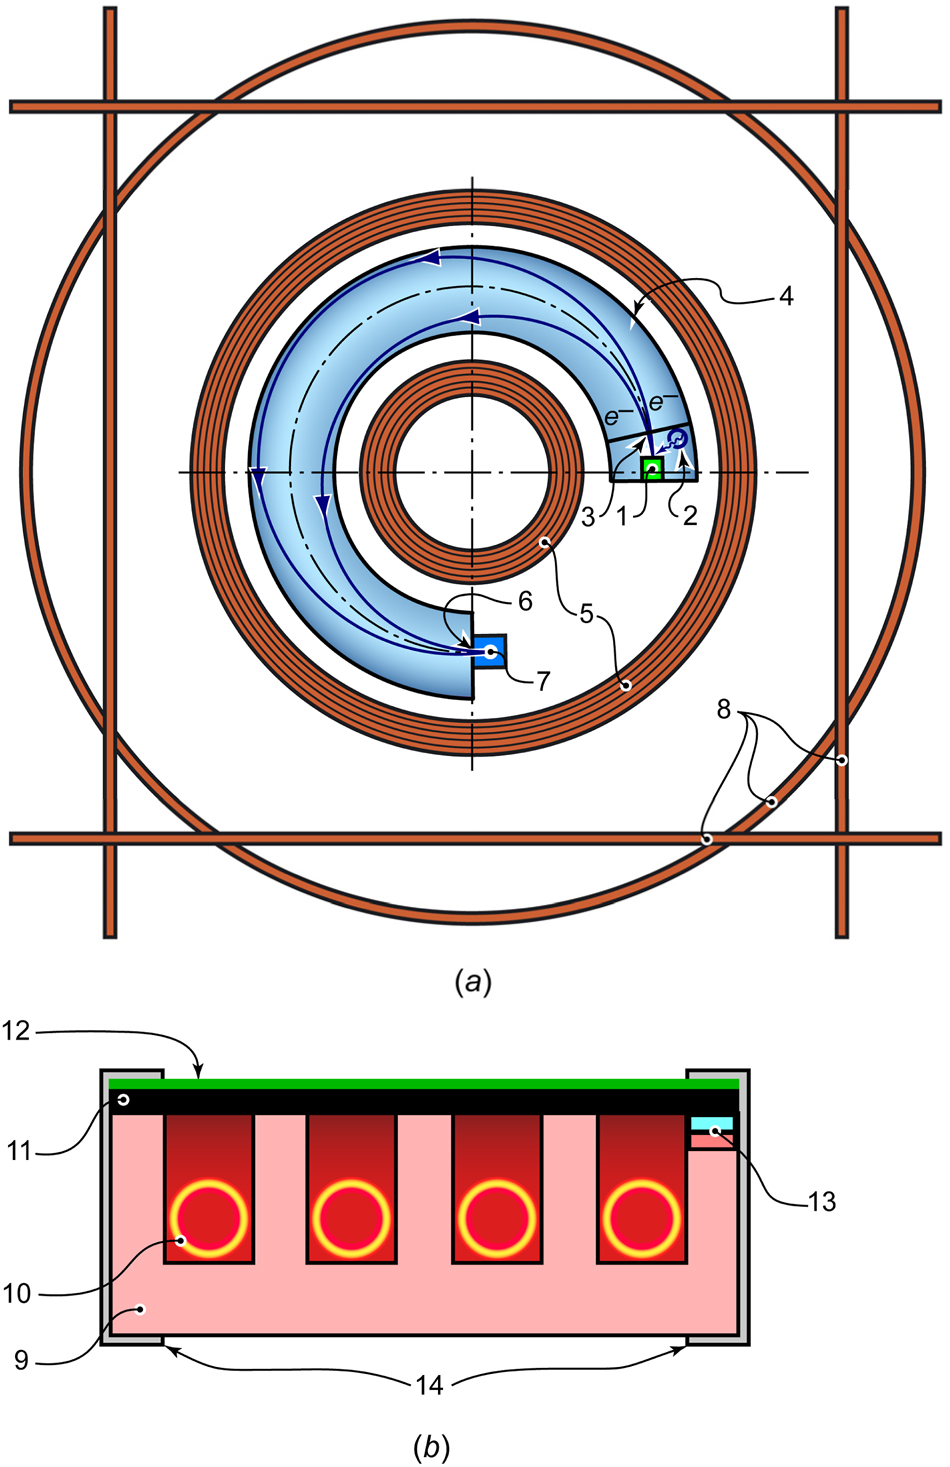
Diagram of the EMS-3 X-ray photoelectron spectrometer (a) and the heat-affected sample holder (b). 1 – sample holder with a sample; 2 – X-ray tube; 3 – inlet aperture of the energy analyzer; 4 – vacuum chamber; 5 – energy analyzer coils; 6 – output aperture of the energy analyzer; 7 – electron detector; 8 – coils for compensation of external magnetic fields and aberrations; 9 – specimen holder body; 10 – resistive heating element; 11 – graphite substrate; 12 – layer of the mineral under study; 13 – thermocouple; 14 – clamps.
The sample holder (1) was positioned in line with the output window of the X-ray tube (2), which emitted Al-Kα radiation (ħω = 1,486.6 eV) at an operating mode of 11 kV and 25 mA (without a monochromator). The photoelectrons emitted from the sample entered the evacuated working chamber (4) through the inlet aperture (3). These electrons were then focused through an inhomogeneous magnetic field created by the coils (5) onto the output aperture (6) before reaching the detector (7). The energy spectrum of the photoelectrons was obtained by varying the current intensity in the coils (5).
Compensation coils (8) encircle the device to minimize the effects of external magnetic fields and correct focus aberrations. Using this energy analyzer design reduces the influence of residual gases and thermal decomposition products on measurement errors of the photoelectron energy. It allows for collecting XPS spectra at a low vacuum within the working chamber.
The specimen holder (1) was designed with an integrated resistive heater (Figure 1b) to induce thermal effects during in operando measurements. The body of the specimen holder (9) is made of mullite-corundum ceramics, which possess stable dielectric properties at high temperatures. A resistive element (10), composed of a tantalum wire spiral, is placed in the grooves of the ceramic housing. A layer of finely ground mineral (12) with a particle size of less than 10 µm was pressed into the surface layer of the graphite substrate (11) to ensure good electrical contact. The chromel-alumel thermocouple (13) is in direct thermal contact with the graphite substrate; however, direct contact between the tantalum helix (10) and the graphite substrate (11) is prevented. Molybdenum clamps (14) secure the structure. The low thermal conductivity of mullite-corundum ceramics (30–40 W ·m−1·K−1), compared to that of graphite (200–300 W ·m−1·K−1), and minimal convective heat transfer ensure uniform radiation heating of the graphite substrate, which acts as the primary heat-absorbing surface due to its color. The tight thermal contact between the thermocouple and the graphite substrate guarantees accurate sample temperature measurement.
The scale was calibrated using the C1s line of the graphite substrate, with a reference binding energy value of E B = 284.5 eV. To reduce the destructive effects of vacuum 18 and X-ray radiation 19 on the samples, XPS spectra were recorded at a low vacuum (10−3 Pa) in the working chamber, and the minimum recording time necessary to achieve an acceptable signal-to-noise ratio was selected.
Initially, all samples were analyzed at room temperature, with the spectra for Cu2p, CuL3M45M45, and O1s recorded over 30–35 min. Following this, while continuously pumping from the working chamber, the samples were gradually heated to temperatures corresponding to the onset or completion of thermal transformations, as indicated by the thermal analysis data. The entire set of spectra was recorded for the same duration at each temperature.
Furthermore, with continuous pumping from the working chamber, the samples were heated stepwise to the temperatures corresponding to the beginning or completion of thermal transformations, as indicated by the thermal analysis data. The complete set of spectra was then registered for the same duration at each temperature.
The mathematical processing of the measurement results, including background subtraction using the Shirley method and the approximation of spectra with Voigt functions, was performed using the Fityk 0.9.8 software. 20
Data from Ref. 21] were used to deconvolve the spectra. For the main spectral lines and magnetic satellite peaks of the Cu2p and O1s spectra, a constraint of G/L = 0.9/0.1 was applied. Additionally, the ratio of integral intensities was restricted to 1:2 for the lines of the spin–orbit doublet Cu2p. Predicting the shape of this doublet is difficult, so no constraints were imposed on the G/L ratio for this specific case.
3 Results and discussion
The main parameters of the obtained XPS spectra Cu2p, CuL3M45M45, and O1s are given in Table 1.
The parameters of the primary lines in XPS spectra Cu2p, CuL3M45M45, and O1s, eV (correspond to Figures 2 and 3).
| Spectrum | Primary lines | |||||||||||||||||
|---|---|---|---|---|---|---|---|---|---|---|---|---|---|---|---|---|---|---|
| A | B | C | D | E | F | |||||||||||||
| EB | FWHM | G/L | EB | FWHM | G/L | EB | FWHM | G/L | EB | FWHM | G/L | EB | FWHM | G/L | EB | FWHM | G/L | |
| Cu(OH)2, 50 °C | ||||||||||||||||||
|
|
||||||||||||||||||
| Cu2p | 934.5 | 2.6 | 0.9/0.1 | 936.9 | 3.6 | 0.9/0.1 | 941.2 | 2.2 | 0.87/0.13 | 944.1 | 2.0 | 0.82/0.18 | 954.4 | 2.6 | 0.9/0.1 | 956.7 | 3.6 | 0.9/0.1 |
| CuL3M45M45 | 566.9 | 3.2 | 0.72/0.28 | 569.9 | 4.0 | 0.85/0.15 | 574.4 | 4.0 | 0.85/0.15 | |||||||||
| O1s | 531.6 | 1.6 | 0.9/0.1 | |||||||||||||||
|
|
||||||||||||||||||
| Cu(OH)2, 200 °C | ||||||||||||||||||
|
|
||||||||||||||||||
| Cu2p | 933.3 | 2.2 | 0.9/0.1 | 935.5 | 2.4 | 0.9/0.1 | 940.6 | 2.1 | 0.9/0.1 | 943.9 | 2.2 | 0.81/0.19 | 952.1 | 2.2 | 0.9/0.1 | 955.4 | 3.6 | 0.9/0.1 |
| CuL3M45M45 | 566.5 | 3.5 | 0.68/0.32 | 568.5 | 2.0 | 0.8/0.2 | 572.2 | 4.5 | 0.78/0.22 | 575.4 | 1.5 | 0.6/0.4 | ||||||
| O1s | 529.9 | 1.2 | 0.9/0.1 | |||||||||||||||
|
|
||||||||||||||||||
| Cu2CO3(OH)2, 50 °C | ||||||||||||||||||
|
|
||||||||||||||||||
| Cu2p (Cu1) | 933.7 | 2.0 | 0.9/0.1 | 936.5 | 1.6 | 0.9/0.1 | 571.3 | 4.0 | 0.7/0.3 | 574.9 | 1.9 | 0.8/0.2 | 953.4 | 2.0 | 0.9/0.1 | 956.5 | 1.6 | 0.9/0.1 |
| Cu2p (Cu2) | 932.4 | 2.0 | 0.9/0.1 | 934.9 | 1.4 | 0.9/0.1 | 568.7 | 3.0 | 0.7/0.3 | 952.2 | 2.0 | 0.9/0.1 | 954.8 | 1.4 | 0.9/0.1 | |||
| CuL3M45M45 (Cu1) | 566.5 | 3.0 | 0.75/0.25 | 570.0 | 4.0 | 0.79/0.21 | 574.2 | 2.2 | 0.85/0.15 | |||||||||
| CuL3M45M45 (Cu2) | 568.7 | 3.0 | 0.88/0.12 | 571.3 | 4.0 | 0.85/0.15 | 574.9 | 1.9 | 0.8/0.2 | |||||||||
| O1s | 530.2 | 1.5 | 0.9/0.1 | 531.7 | 1.5 | 0.9/0.1 | ||||||||||||
|
|
||||||||||||||||||
| Cu2CO3(OH)2, 400 °C | ||||||||||||||||||
|
|
||||||||||||||||||
| Cu2p (CuO) | 933.4 | 2.1 | 0.9/0.1 | 936.1 | 1.3 | 0.9/0.1 | 941.2 | 2.0 | 0.7/0.3 | 946.4 | 1.6 | 0.8/0.2 | 952.2 | 2.1 | 0.9/0.1 | 956.0 | 1.2 | 0.9/0.1 |
| Cu2p (Cu2O) | 932.2 | 1.2 | 0.9/0.1 | 952.0 | 1.2 | 0.9/0.1 | ||||||||||||
| CuL3M45M45 (CuO) | 566.2 | 3.2 | 0.89/0.11 | 568.5 | 2.0 | 0.9/0.1 | 572.4 | 4.2 | 0.86/0.14 | 574.9 | 1.5 | 0.8/0.2 | ||||||
| CuL3M45M45 (Cu2O) | 564.6 | 1.5 | 0.82/0.18 | 569.1 | 4.0 | 0.89/0.11 | 574.1 | 4.0 | 0.81/0.19 | |||||||||
| O1s | 530.0 | 1.5 | 0.9/0.1 | |||||||||||||||
|
|
||||||||||||||||||
| Cu3(CO3)2(OH), 50 °C | ||||||||||||||||||
|
|
||||||||||||||||||
| Cu2p (Cu1) | 934.6 | 1.8 | 0.9/0.1 | 936.7 | 2.8 | 0.9/0.1 | 954.4 | 1.8 | 0.9/0.1 | 956.5 | 2.8 | 0.9/0.1 | ||||||
| Cu2p (Cu2) | 933.2 | 1.8 | 0.9/0.1 | 953.0 | 1.8 | 0.9/0.1 | ||||||||||||
| CuL3M45M45 (Cu1) | 566.5 | 3.0 | 0.78/0.22 | 570.0 | 4.0 | 0.8/0.2 | 573.9 | 2.6 | 0.8/0.2 | |||||||||
| CuL3M45M45 (Cu2) | 568.3 | 3.0 | 0.87/0.13 | 571.2 | 3.6 | 0.85/0.15 | 575.5 | 1.6 | 0.8/0.2 | |||||||||
| O1s | 530.1 | 1.5 | 0.9/0.1 | 531.5 | 1.4 | 0.9/0.1 | ||||||||||||
|
|
||||||||||||||||||
| Cu3(CO3)2(OH), 160 °C | ||||||||||||||||||
|
|
||||||||||||||||||
| Cu2p (Cu1) | 934.6 | 1.8 | 0.9/0.1 | 936.7 | 2.0 | 0.9/0.1 | 943.8 | 2.6 | 0.8/0.2 | 946.4 | 2.6 | 0.8/0.2 | 954.4 | 1.8 | 0.9/0.1 | 956.5 | 2.0 | 0.9/0.1 |
| Cu2p (Cu2) | 933.2 | 1.8 | 0.9/0.1 | 953.0 | 1.8 | 0.9/0.1 | ||||||||||||
| CuL3M45M45 (Cu1) | 566.5 | 3.0 | 0.78/0.22 | 570.0 | 4.0 | 0.8/0.2 | 573.9 | 2.6 | 0.8/0.2 | |||||||||
| CuL3M45M45 (Cu2) | 568.3 | 3.0 | 0.87/0.13 | 571.2 | 3.6 | 0.85/0.15 | 575.5 | 1.6 | 0.8/0.2 | |||||||||
| CuL3M45M45 (CuO) | 566.3 | 3.5 | 0.8/0.2 | 568.7 | 2.0 | 0.9/0.1 | 572.5 | 4.0 | 0.85/0.15 | 575.0 | 1.6 | 0.81/0.19 | ||||||
| O1s | 530.2 | 1.6 | 0.9/0.1 | |||||||||||||||
|
|
||||||||||||||||||
| Cu3(CO3)2(OH), 360 °C | ||||||||||||||||||
|
|
||||||||||||||||||
| Cu2p | 933.4 | 1.8 | 0.9/0.1 | 936.1 | 1.8 | 0.9/0.1 | 939.0 | 1.2 | 0.82/0.18 | 947.2 | 2.0 | 0.88/0.12 | 952.2 | 1.9 | 0.9/0.1 | 956.0 | 1.9 | 0.9/0.1 |
| CuL3M45M45 | 566.2 | 3.2 | 0.8/0.2 | 568.5 | 2.1 | 0.88/0.12 | 572.4 | 4.0 | 0.88/0.12 | 574.9 | 1.7 | 0.76/0.24 | ||||||
| O1s | 529.9 | 1.3 | 0.9/0.1 | |||||||||||||||
Figure 2 displays the XPS spectra of the samples studied, focusing on the Cu2p photoelectrons at various sample temperatures alongside their local structures.
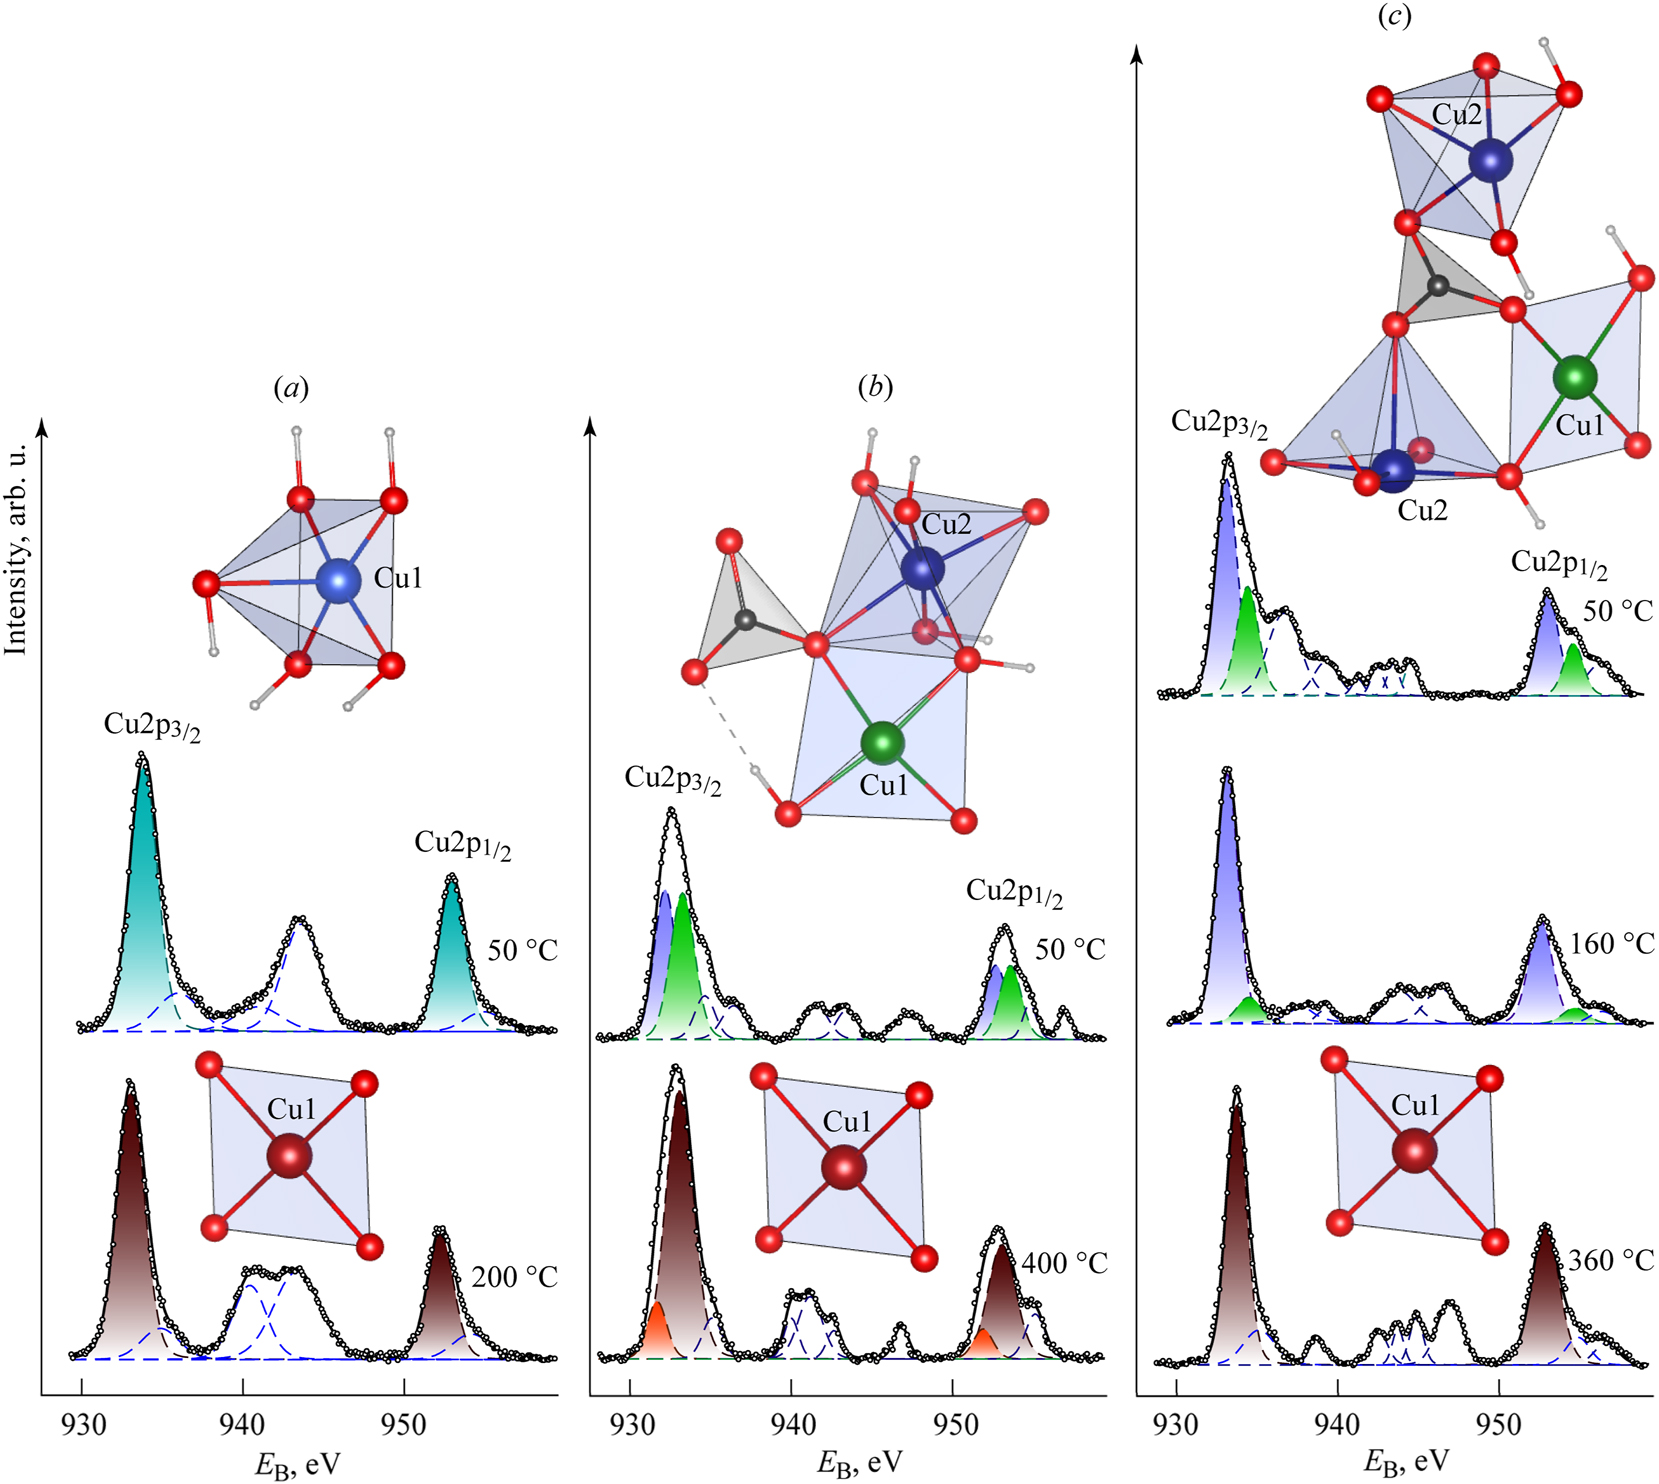
Spectra of XPS Cu2p-photoelectrons of the studied samples Cu(OH)2 (a), Cu2CO3(OH)2 (b) and Cu3(CO3)2(OH)2 (c) at different temperatures and characteristic fragments of their local environment of copper, and Cu local environment of the main decomposition product – CuO.
Figure 3 displays the Auger spectra of the studied samples, obtained using X-ray excitation in the CuL3M45M45 region at varying sample temperatures.
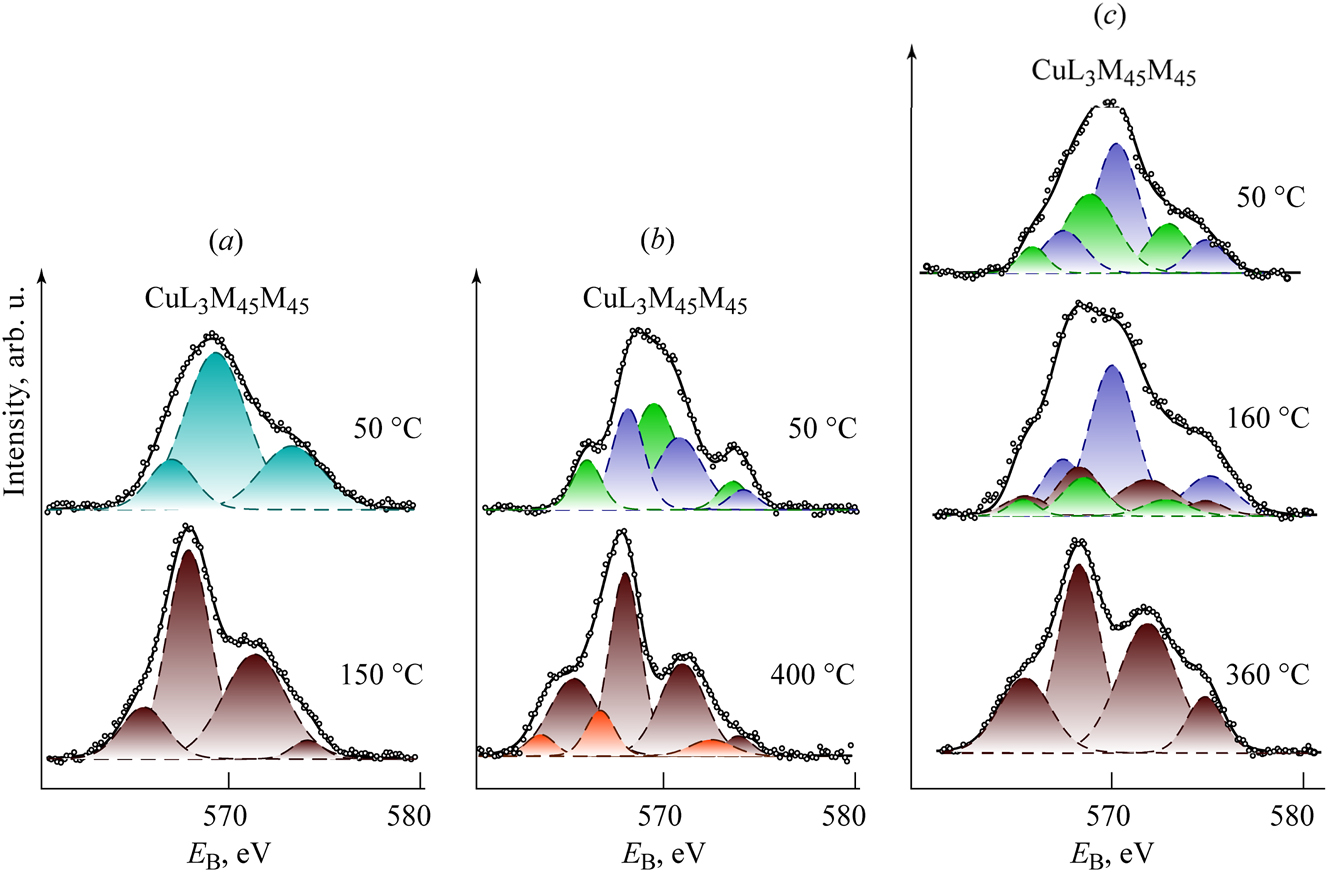
Auger spectra CuL3M45M45 of the studied samples Cu(OH)2 (a), Cu2CO3(OH)2 (b) and Cu3(CO3)2(OH)2 (c) at different temperatures. The structure of the studied compounds and the main product of their decomposition – CuO – is presented in Figure 2.
Covalent mixing in divalent copper (Cu) compounds has been demonstrated using X-ray photoelectron spectroscopy (XPS) in studies by G. Van der Laan et al. 22 , 23 In the Cu2p photoemission process, a core electron is excited into the continuum, resulting in two final state configurations: 2p3d 9 and 2p3d 10 L ( 2p and L denote a photohole and a ligand hole). The energy separation between these states is approximately equal to the charge-transfer energy and the 2p-3d Coulomb interaction.
The 2p3d 9 state shows a multiplet structure, while the 2p3d 10 L state results in a single line. The intensity ratio of these features is influenced by covalent mixing in the initial and final states. Satellite structures in the XPS spectrum indicate holes in the copper d band. 22 , 23 In contrast, monovalent compounds mainly exhibit d character and yield a spectrum with only a single peak corresponding to the 2p3d 10 L final state.
In the Cu2p spectrum of the Cu(OH)2 sample recorded at 50 °C (Figure 2a), we observe prominent peaks A and E. These peaks are components of a spin–orbit doublet (Cu2p3/2–1/2) with a spin–orbit splitting (ΔSO) of 19.9 eV, indicating that the copper atoms are equivalent.
We also note weaker peaks B and F, which likely represent constituents of the magnetic multiplets associated with the main components of the spectrum, characteristic of copper in the +2 oxidation state. Additionally, weak peaks C and D appear to be shake-up satellites of the Cu2p3/2 component. This spectrum aligns well with previously described Cu(OH)2 spectra. 21
After heating the sample to 200 °C, the prominent peaks, A and E, shifted towards smaller binding energies. The magnetic multiplets B and F suggest that the oxidation state of copper remains +2. The intensity of the peaks corresponding to shake-up satellites C and D is typical of the CuO spectrum. 21
In the Auger spectrum (CuL3M45M45) of the Cu(OH)2 sample at 50 °C (Figure 3a), three central components, A, B, and C, are observed, which are characteristic of the Cu(OH)2 spectrum. 21 When the sample temperature is raised to 200 °C, the CuL3M45M45 spectrum undergoes significant changes, displaying four peaks A, B, C, and D, typical of the CuO spectrum. 21
The O1s spectrum of the Cu(OH)2 sample at 50 °C is represented by a single line with a maximum at E B = 531.6 eV and FWHM 1.6 eV, corresponding to the equivalent state of all oxygen atoms. After heating to 200 °C, the maximum of the O1s spectrum shifts towards lower bond energies, which is characteristic of copper(II) oxide.
These findings enhance our understanding of the electron spectra of the Cu(OH)2 sample and confirm the decomposition mechanism of Cu(OH)2 into CuO, along with a rearrangement of the Cu’s local symmetry under transforming from orthorhombic to monoclinic lattice, as proposed earlier. 7 , 8 , 9 , 10 This discovery opens up new avenues for further research in this field.
The Cu2p spectrum of the malachite sample, Cu2CO3(OH)2, taken at a temperature of 50 °C, exhibits a complex structure due to the nonequivalence of copper atoms, which are designated as Cu1 and Cu2 (see Figure 2b). The spin–orbit doublet Cu2p3/2–1/2 shows intensity maxima represented by two components: A1 and A2 for Cu1, and E1 and E2 for Cu2.
This splitting occurs because the XPS method is sensitive to shifts in the energy levels of electrons, which arise from unique interactions among electron shells in the surrounding atomic environment. 24 , 25 , 26 The perturbation of the electron energy structure results from both radial and angular displacements of nearby atoms. Consequently, analyzing XPS spectra allows us to discern differences in the immediate environments of the atoms, including the configuration of the coordination polyhedron surrounding each metal atom. By comparing these differences to known literature data on the structures of the studied minerals, we can associate specific contributions in the XPS spectra with atoms in particular environments.
Maxima A1 and E1 correspond to copper atoms, Cu1, in a planar square coordination with two oxygen atoms and two hydroxyl groups. In contrast, maxima A2 and E2 reflect copper atoms, Cu2, in octahedral coordination. The integral intensity ratio of these doublets is 1:1. Additionally, the spectrum features magnetic multiplets associated with each component of the spin–orbit doublets, labeled B1, B2, F1, and F2, as well as shake-up satellites called C1, C2, and D.
The Auger spectrum of the malachite sample, CuL3M45M45 (see Figure 2b), at 50 °C is also complex. The constituents A1, B1, and C1 appear to belong to Cu1 atoms, whose coordination environment is similar to that of copper atoms in the Cu(OH)2 structure. Conversely, constituents A2, B2, and C2 correspond to Cu2 atoms in an octahedral coordination environment.
The O1s spectrum of the malachite sample at 50 °C displays lines with maxima at E B = 530.2 eV and 531.7 eV, which correspond to deprotonated and protonated oxygen atoms, respectively. Notably, up to temperatures of 280 °C, the electron spectra of malachite show no visible changes, indicating that the structure of malachite is preserved at these temperatures.
When the malachite sample is heated first to 350 °C and then to 400 °C, the prominent peaks observed are A1 and E1, along with magnetic multiplets B and F, which correspond to the spin–orbit doublet of copper atoms in the CuO structure. Shake-up satellites C and B, related to the contribution from Cu(II) atoms, can also be observed. Less intense peaks A2 and E2, which are not accompanied by magnetic multiplets, likely correspond to a minor admixture of Cu2O. In the Auger spectrum (CuL3M45M45) of the degradation products from the malachite sample at 400 °C, four prominent peaks A1, B1, C1 and D are noted, which are characteristic of the CuO spectrum. Additionally, three weaker peaks A2, B2, and C2 are noted, which are characteristic of the Cu2O spectrum.
In the O1s spectrum of malachite degradation products at 400 °C, there is a prominent peak with a maximum at E B = 530.0 eV. This peak corresponds to the contribution of CuO, and it is somewhat broadened (FWHM = 1.5 eV) due to a minor contribution from Cu2O.
The mole ratio of Cu2O to CuO, estimated from the integral intensities of the corresponding spectra, indicates that Cu2O constitutes approximately 5–11 mol %. Analysis of the obtained electron spectra from the malachite sample confirms the simultaneous destruction of OH− and CO3 2− ions, affecting the local surrounding of Cu1 and Cu2 ions in the temperature range of 280–350 °C. This phenomenon was first observed in the analysis of gaseous degradation products. The relationship between the destruction of the coordination polyhedra with different compositions and structures is likely influenced by hydrogen bonds, which stabilize the malachite structure. It is probable that the thermal decomposition of Cu2CO3(OH)2 primarily occurs according to one mechanism, with limited contributions from others that suggest the formation of Cu2O in an oxygen-free environment.
The analysis of the Cu2p spectrum of azurite (Cu3(CO3)2(OH)2) at 50 °C reveals the nonequivalence of copper atoms Cu1 and Cu2. It appears that the Cu1 atoms, situated in planar square coordination with two oxygen atoms and two hydroxyl groups, exhibit a spin–orbit doublet (Cu2p 3/2–1/2) with intensity maxima A1 and E1. In contrast, the Cu2 atoms in octahedral coordination present a spin–orbit doublet with intensity maxima A2 and E2. The ratio of the integral intensities of these doublets is 1:2. Magnetic multiplets associated with these spectral lines could not be distinctly resolved; instead, they are represented as broad peaks B and F. The spectrum also includes shake-up satellites С in range at E B = 939.4–944.6 eV.
In the Auger spectrum (CuL3M45M45) of the azurite sample at 50 °C, constituents A1, B1 and C1 attributed to Cu1 atoms in a planar-square coordination environment are observed. Additionally, constituents A2, B2 and C2 corresponding to Cu2 atoms in the octahedral coordination environment are found.
The O1s spectrum of the azurite sample at 50 °C shows contributions from deprotonated and protonated oxygen atoms at E B = 530.1 eV and 531.5 eV.
A significant alteration in the electron spectra of azurite occurs at 160 °C. In the Cu2p spectrum, the intensity of the peaks A1 and E1, linked to Cu1 atoms, declines drastically, while the intensity of A2 and E2 rises. This change may indicate a contribution from CuO, which could not be distinctly resolved. The width of the magnetic multiplets B and F decreases to 2.0 eV. The shake-up satellite structure of the spectrum reveals peaks С and D, which are characteristic of CuO.
In the Auger spectrum (CuL3M45M45), the intensity of components A1, B1 and C1 corresponding to Cu1 atoms drastically decreases. At the same time, new peaks A3, B3, C3 and D, which are indicative of the CuO spectrum. The intensity of the peaks A2, B2 and C2 linked to Cu2 atoms in the CuL3M45M45 spectrum of azurite at 160 °C does not change markedly, suggesting that this portion of the azurite structure remains intact and undergoes further modifications.
In the O1s spectrum of the azurite sample at 160 °C, the contribution from protonated oxygen atoms almost vanishes, revealing a relatively narrow peak at binding energy E B = 530.2 eV.
The Cu2p spectrum of azurite degradation products at 400 °C displays two intense peaks labeled A and E, along with magnetic multiplets B and F. The shake-up satellite structure of the spectrum reveals additional peaks, C and D, which are characteristic of CuO.
In the Auger spectrum (CuL3M45M45), only peaks A, B, C, and D indicate the presence of CuO.
In the O1s spectrum of azurite degradation products at 400 °C, a narrow peak is observed at E B = 529.9 eV.
In contrast to malachite (Cu2CO3(OH)2), the degradation of azurite (Cu3(CO3)2(OH)2) proceeds differently when heated. As the temperature increases, the degradation of the coordination environment of Cu1 and Cu2 occurs sequentially rather than simultaneously. Initially, within the temperature range of 90–150 °C, the environment around the Cu1 atoms is disrupted, leading to the cleavage of water molecules, evidenced by the disappearance of protonated oxygen contributions at 160 °C.
And then, in the range of 160–350 °C, the destruction of the environment of Cu2 atoms with the cleavage of CO2 molecules
4 Conclusions
The thermal decomposition processes of Cu(OH)2, Cu2CO3(OH)2, and Cu3(CO3)2(OH)2 were studied using in operando XPS technique, and the compositions of the resulting products were determined.
The conditions and stages of thermal decomposition are influenced by the symmetry of Cu’s local environment, the nature of the hydrogen bonds in the initial compound, and the complexity of its rearrangement into the final product, CuO.
Cu(OH)2 is the easiest to decompose; at 160 °C, it completely releases constitutional water and transforms into a structurally similar CuO.
Azurite, Cu3(CO3)2(OH)2, has a more complex structure and decomposes in several successive stages over a wide temperature range. Initially, it splits a molecule of constitutional water, and then, up to a temperature of 350 °C, carbon dioxide is released, forming CuO.
Malachite, Cu2CO3(OH)2, which contains hydrogen bonds represented as O–H‧‧‧O–CO2, is the most stable of the three and begins decomposing only at 280 °C. The decomposition of malachite is completed around 400 °C, resulting in CuO with an admixture of 5–11 mol % Cu2O.
-
Research ethics: Not applicable.
-
Informed consent: Not applicable.
-
Author contributions: All authors have accepted responsibility for the entire content of this manuscript and approved its submission.
-
Use of Large Language Models, AI and Machine Learning Tools: None declared.
-
Conflict of interest: DSR was employed by the company Mezomax Inc., San-Francisco, CA, USA. All other authors state no conflict of interest.
-
Research funding: The work was supported by the Ministry of Science and Higher Education of the Russian Federation 1024032100142-6 (FUUE 2025-0018) and 124021900079-9 (FUUE-2024-0011), using equipment of the Shared-Use Center of the UdmFRC, UB, RAS.
-
Data availability: Not applicable.
References
1. Oswald, H. R.; Reller, A.; Schmalle, H. W.; Dubler, E. Structure of Copper(II) Hydroxide, Cu(OH)2. Acta Cryst. Sec. C. 1990, 46 (12), 2279–2284. https://doi.org/10.1107/S0108270190006230.Suche in Google Scholar
2. Süsse, P. Verfeinerung der Kristallstruktur des Malachits, Cu2(OH)2CO3. Acta Cryst 1967, 22 (1), 146–151. https://doi.org/10.1107/s0365110x67000222.Suche in Google Scholar
3. Zigan, F.; Joswig, W.; Schuster, H. D.; Mason, S. A. Verfeinerung der Struktur von Malachit, Cu2(OH)2CO3, durch Neutronenbeugung. Z. Kristallogr. 1977, 145, 412–426. https://doi.org/10.1524/zkri.1977.145.16.412.Suche in Google Scholar
4. Belokoneva, E.; Gubina, Y.; Forsyth, J. The Charge Density Distribution and Antiferromagnetic Properties of Azurite Cu3[CO3]2(OH)2. Phys. Chem. Min. 2001, 28, 498–507. https://doi.org/10.1007/s002690100176.Suche in Google Scholar
5. Pathiraja, G.; Yarbrough, R.; Rathnayake, H. Fabrication of Ultrathin CuO Nanowires Augmenting Oriented Attachment Crystal Growth Directed Selfassembly of Cu(OH)2 Colloidal Nanocrystals. Nanoscale Adv. 2020, 2 (7), 2897–2906. https://doi.org/10.1039/d0na00308e.Suche in Google Scholar PubMed PubMed Central
6. Mikami, K.; Kido, Y.; Akaishi, Y.; Quitain, A.; Kida, T. Synthesis of Cu2O/CuO Nanocrystals and Their Application to H2S Sensing. Sensors 2019, 19 (1). Article Number 211. https://doi.org/10.3390/s19010211.Suche in Google Scholar PubMed PubMed Central
7. Günter, J. R.; Oswald, H. R. Topotactic Electron Induced and Thermal Decomposition of Copper(II) Hydroxide. J. Appl. Cryst. 1970, 3 (1), 21–26. https://doi.org/10.1107/s0021889870005587.Suche in Google Scholar
8. Cudennec, Y.; Lecerf, A. The Transformation of Cu(OH)2 into CuO; Revisited. Solid State Sci. 2003, 5, 1471–1474. https://doi.org/10.1016/j.solidstatesciences.2003.09.009.Suche in Google Scholar
9. Blaskov, V.; Radev, D. D.; Klissurski, D.; Yordanov, N. D. Behaviour of Cu(II) Hydroxide during Mechanical Treatment. J. Alloys Comp. 1994, 206 (2), 267–270. https://doi.org/10.1016/0925-8388(94)90048-5.Suche in Google Scholar
10. Fukuda, M.; Koga, N. Kinetics and Mechanisms of the Thermal Decomposition of Copper(II) Hydroxide: A Consecutive Process Comprising Induction Period; Surface Reaction; and Phase Boundary-Controlled Reaction. J. Phys. Chem. 2018, 12 (4), 12869–12879. https://doi.org/10.1021/acs.jpcc.8b03260.Suche in Google Scholar
11. Brown, I. W. M.; Mackenzie, K. J. D.; Gainsford, G. J. Thermal Decomposition of the Basic Copper Carbonates Malachite and Azurite. Thermochim. Acta 1984, 75, 23–32. https://doi.org/10.1016/0040-6031(84)85003-0.Suche in Google Scholar
12. Mansour, S. A. A. Thermoanalytical Investigations of Decomposition Course of Copper Oxysalts. I. Basic Copper Carbonate. J. Therm. Anal. 1994, 42, 1251–1263. https://doi.org/10.1007/BF02546934.Suche in Google Scholar
13. Morgan, D. J. Simultaneous DTA–EGA of Minerals and Natural Mineral Mixtures. J. Therm. Anal. 1977, 12, 245–263. https://doi.org/10.1007/BF01909481.Suche in Google Scholar
14. Seguin, M. K. Thermogravimetric and Differential Thermal Analysis of Malachite and Azurite in Inert Atmospheres and in Air. Can. Mineral. 1975, 13, 127–132.Suche in Google Scholar
15. Wang, X.; Andrews, L. Infrared Spectra and Structures of the Coinage Metal Dihydroxide Molecules. Inorg. Chem. 2005, 44 (24), 9076–9083. https://doi.org/10.1021/ic051201c.Suche in Google Scholar PubMed
16. Goldsmith, J. A.; Ross, S. D. The Infra-red Spectra of Azurite and Malachite. Spectrochim. Acta. A. 1968, 24 (12), 2131–2137. https://doi.org/10.1016/0584-8539(68)80273-9.Suche in Google Scholar
17. Trapeznikov, V. A.; Shabanova, I. N.; Kholzakov, A. V.; Ponomaryov, A. G. Studies of Transition Metal Melts by X-Ray Electron Magnetic Spectrometer. J. Electron Spectrosc. Relat. Phenom. 2004, 137–140, 383–385. https://doi.org/10.1016/j.elspec.2004.02.115.Suche in Google Scholar
18. Frost, D. C.; Ishitani, A.; McDowell, C. A. X-Ray Photoelectron Spectroscopy of Copper Compounds. Mol. Phys.: An Int. J. Interface Between Chem. Phys. 1972, 24 (4), 861–877. https://doi.org/10.1080/00268977200101961.Suche in Google Scholar
19. Carrasco, E.; Oujja, M.; Sanz, M.; Marco, J. F.; Castillejo, M. X-Ray and Ion Irradiation Effects on Azurite, Malachite and Alizarin Pictorial Models. Microchem. J. 2018, 137, 381–391. https://doi.org/10.1016/j.microc.2017.11.014.Suche in Google Scholar
20. Wojdyr, M. Fityk: a General-Purpose Peak Fitting Program. J. Appl. Crystallogr. 2010, 43, 1126–1128. https://doi.org/10.1107/S0021889810030499.Suche in Google Scholar
21. Biesinger, M. C. Advanced Analysis of Copper X-Ray Photoelectron Spectra. Surf. Interface Anal. 2017, 49 (13), 1325–1334. https://doi.org/10.1002/sia.6239.Suche in Google Scholar
22. Van der Laan, G.; Westra, C.; Haas, C.; Sawatzky, G. A. Satellite Structure in Photoelectron and Auger Spectra of Copper Dihalides. Phys. Rev. B 1981, 23, 4369–4380. https://doi.org/10.1103/PhysRevB.23.4369.Suche in Google Scholar
23. Van der Laan, G.; Pattrick, R. A. D.; Henderson, C. M. B.; Vaughan, D. J. Oxidation State Variations in Copper Minerals Studied with Cu2p X-Ray Absorption Spectroscopy. J. Phys. Chem. Solids 1992, 53 (9), 1185–1190. https://doi.org/10.1016/0022-3697(92)90037-E.Suche in Google Scholar
24. Ghijsen, J.; Tjeng, L. H.; Van Elp, J.; Eskes, H.; Westerink, J.; Sawatzky, G. A.; Czyzyk, M. T. Electronic Structure of Cu2O and CuO. Phys. Rev. B 1988, 38 (16), 11322–21133; https://doi.org/10.1103/physrevb.38.11322.Suche in Google Scholar PubMed
25. Okada, K.; Kotani, A. Multiplet Structures of Cu2p-XPS in La2CuO4, CuO and Cu Halides. J. Phys. Soc. Jpn. 1989, 58 (7), 2578–2585. https://doi.org/10.1143/JPSJ.58.2578.Suche in Google Scholar
26. Parlebas, J. C.; Khan, M. A.; Uozumi, T.; Okada, K.; Kotani, A. Theory of Many-Body Effects in Valence, Core-Level and Isochromat Spectroscopies along the 3d Transition Metal Series of Oxides. J. Electron Spectrosc. Relat. Phenom. 1995, 71 (2), 117–139; https://doi.org/10.1016/0368-2048(94)02262-3.Suche in Google Scholar
© 2025 the author(s), published by De Gruyter, Berlin/Boston
This work is licensed under the Creative Commons Attribution 4.0 International License.
Artikel in diesem Heft
- Frontmatter
- In this issue
- Obituary
- Obituary for Hartmut Bärnighausen
- Micro Review
- Bismuth as reactive and non-reactive flux medium for the synthesis and crystal growth of intermetallics
- Organic and Metalorganic Crystal Structures (Original Paper)
- Racemic and unusual enantiomeric crystal forms of N-cycloalkyl-4-methyl-2,2-dioxo-1H-2λ6,1-benzothiazine-3-carboxamides and their biological activity
- Inorganic Crystal Structures (Original Paper)
- Lead phosphate oxyapatite, Pb10(PO4)6O, with c-double superstructure
- A novel microporous uranyl silicate prepared by high temperature flux technique
- The Grubbs catalyst – dichlorido(1-(2,6-diethylphenyl)-3,5,5-trimethyl-3-phenylpyrrolidin-2-ylidene)-({5-nitro-2-[(propan-2-yl)oxy]phenyl}methylidene)ruthenium(II) – some observations on the crystallography and stereochemistry of a racemic mimic pair
- Thermal decomposition of copper(II) hydroxide and hydroxocarbonates according to X-ray photoelectron spectroscopy in operando
- New calcium perrhenates: synthesis and crystal structures of Ca(ReO4)2 and K2Ca3(ReO4)8·4H2O