Effects of local fiber discontinuity on the fatigue strength parameter at the fiber inclusion corner in fiber-reinforced composites
-
Cong-Man Wang
 and
Xing-Xing Wang
and
Xing-Xing Wang

Abstract
To comprehend the fatigue failure mechanism at the fiber discontinuity in fiber-reinforced composites, it is necessary to evaluate the local mechanical behaviors. The fatigue strength depends on the stress distribution at the fiber inclusion corner. An improved advanced finite element method (IAFEM) is proposed for the stress intensity factor (SIF) analysis at the fiber inclusion corner. In the IAFEM, the element stiffness matrix of singular inclusion corner element (SICE) is obtained, and the singular elastic field at the tip of the fiber inclusion is determined. The effects of load direction, fiber distribution, fiber geometry, and material properties on SIFs are analyzed numerically using the IAFEM. The difference in stress field distribution between two-dimensional and three-dimensional fiber inclusions is discussed. The IAFEIM and calculation results can provide reference for fatigue strength analysis and preparation of composite materials.
1 Introduction
Fiber-reinforced composites are utilized in automotive, aerospace, and other engineering fields due to their lightweight, low cost, and high-quality processing performance [1,2,3,4]. In composite materials subjected to cyclic loading, the high stress zone prone to crack initiation is usually located at geometric discontinuities due to material mismatch. In fiber-reinforced composites, local fiber fracture is a typical defect [5,6,7]. The criteria for evaluating the fatigue strength of materials mostly depend on assumed structural models. Fatigue behavior can be evaluated in terms of parameters which are meaningfully significant to fatigue phenomena, such as the common S–N curve which combines design stress with the number of cycles. Generally, the fatigue strength S in the S–N curve is related to the definition of nominal stress [8]. If the root radius of the inclusion corner tip is assumed to be zero, stress singularity will appear in linear elastic analysis. Failure prediction based on stress singularity analysis is an active research topic [9]. Seweryn's criterion of brittle failure is based on whether the average stress for crack initiation or propagation to a specific damage stage reaches the critical value [10]. Although the stress near the stress singularity point tends to be infinite, the energy in the small piece of material around the stress singularity point is finite, thus appropriate characterization parameters are a prerequisite for accurate prediction of fatigue failure. Fatigue tests prove that maximum principal stress can be applied to the prediction of fatigue limit, but the scatter of the experimental data was obvious. Relatively speaking, stress intensity factor (SIF) is used as a meaningful parameter for the prediction of fatigue failure [11].
There have been a lot of research works on the singular stress field analysis and SIF of fiber inclusions in composites. Bogy and Wang [12] first studied the stress field at the corner of cylindrical inclusions. Zbib et al. [13] established an analytical expression of SIF for cylindrical cracks located at the fiber-matrix interface. Jiang et al. [14] developed an analytical method for periodic cylindrical inclusions under longitudinal shear by using equivalent inclusion technique and combining the results of Riemann boundary value problem. Bian et al. [15] used Eshelby's equivalent inclusion theory and Mori–Tanaka method to derive an analytical formula for stress distribution near fibers. Mantič [16] studied the plane strain problem of a single cylindrical inclusion embedded in an infinite matrix under uniform uniaxial transverse tension based on the stress criterion of coupling nodes and incremental energy criterion. Vable and Maddi [17] effectively applied the boundary element method for stress analysis of polygonal inclusions. Chen [18] introduced the basic density function in the physical force method to characterize the stress singularity at the inclusion corner in numerical analysis. Noda et al. [19,20,21] systematically calculated the generalized SIF at the inclusion corner with the body force method. Bulling et al. [22] proposed a finite element method (FEM) for automatic enrichment near stress singularities and constructed a semi-analytical singular mode to evaluate the SIFs in the areas of stress singularities.
Due to the complexity of boundary conditions and governing equations, the analytical method is only suitable for certain models which are relatively simple. The goal of fracture analysis using FEM or other numerical methods is to compute the singular stress at the crack tip or inclusion. Tan and Meguid [23] established a new singular FEM by using the complex function method, which could reliably and effectively determine the singular stress field and the related SIFs for various wedge geometry and elastic mismatches. Liou [24] developed a global-local FEM to predict the stress distributions of short fiber-reinforced composite. Madenci et al. [25] developed finite element analysis combining special and conventional elements to provide an accurate description of the stress field at the interface of two materials or at the junction of different materials. Lei et al. [26] evaluated the micromechanical properties of composite materials reinforced with single and clustered polygonal fibers using the FEM. Zhang and Katsube [27] proposed a new mixed FEM for mechanical analysis of heterogeneous materials with randomly dispersed inclusions. Symplectic singular element is a special singular element in the framework of FEM, which can be used to solve the dynamic SIF of bi-material interface cracks [28,29]. Chen et al. [30] developed a singular edge smooth FEM to solve crack problems in anisotropic media.
In order to ensure the compatibility of singular elements, it is usually necessary to use transition elements between singular elements and regular elements. However, Chen and Ping [31] and Ping et al. [32] developed a kind of super singular corner element method based on the special finite element characteristic analysis method, which achieved the consistency degree of freedom between the singular element and the conventional element. By using the characteristic solutions of numerical stress field and displacement field, the singular stress near the tip of polygonal inclusion embedded in the matrix was analyzed by the super singular corner element. The super singular corner element method was further extended to deal with the 3D singular stress field problems [33,34,35]. The local fiber discontinuity problem is a typical three-dimensional (3D) inclusion problem in fiber-reinforced composites. It is necessary to propose an effective solution method and do more research on the stress singularity problem at the fiber inclusion corner.
In this work, using an ad hoc finite element eigen-analysis method and based on the Hellinger–Reissner (H–R) variational principle, a singular inclusion corner element (SICE) containing a part of cylindrical inclusion corner front is established. By using the SICE method, the singular stress field at the inclusion corner tip of double cylindrical inclusions under different loading conditions is analyzed. The effects of material mismatches, inclusion size, inclusion spacing, and unit cell size on SIF are analyzed. The differences in singular stress fields solved by two-dimensional (2D) and 3D models are compared. Once the fatigue strength judgment parameters are obtained, the numerical analysis results can be used to predict fatigue damage problems at 3D fiber discontinuity position.
2 Quantitative parameters of fatigue strength
Inclusion is the key factor to cause low-cycle fatigue failure. SIF is an important characterization parameter of progressive stress distribution near inclusion corner. The relationship between the SIF and the stress components at the angle bisector of the matrix corner adjacent to the inclusion corner in asymptotic stress field can be approximated as follows:
where ϕ b is the angle ϕ located at the angle bisector of the matrix corner as shown in Figure 2a. For singular stress field analysis, ρ = 0.0001R. The values of characteristic roots λ I, λ II, and λ III are related to material properties and inclusion shape [36].
For comparative analysis of 2D and 3D models, the dimensionless SIFs are expressed as:
where specific expressions of
3 SICE model for a cylindrical inclusion corner
In this section, based on the numerical eigen solutions of singular stress field and the generalized H–R variational principle, an SICE is established, and its validity is verified.
3.1 Establishment of the SICE model
In Figure 1a, we assume that 3D cylindrical inclusions are located in the matrix. To analyze the singular stress field at the corner of the inclusion, a unit cell containing a cylindrical inclusion is established, as shown in Figure 1b. 2H is the height of the unit cell, 2W is its length, and 2B is its width. If there are no special instructions, it is assumed that H = W = B.
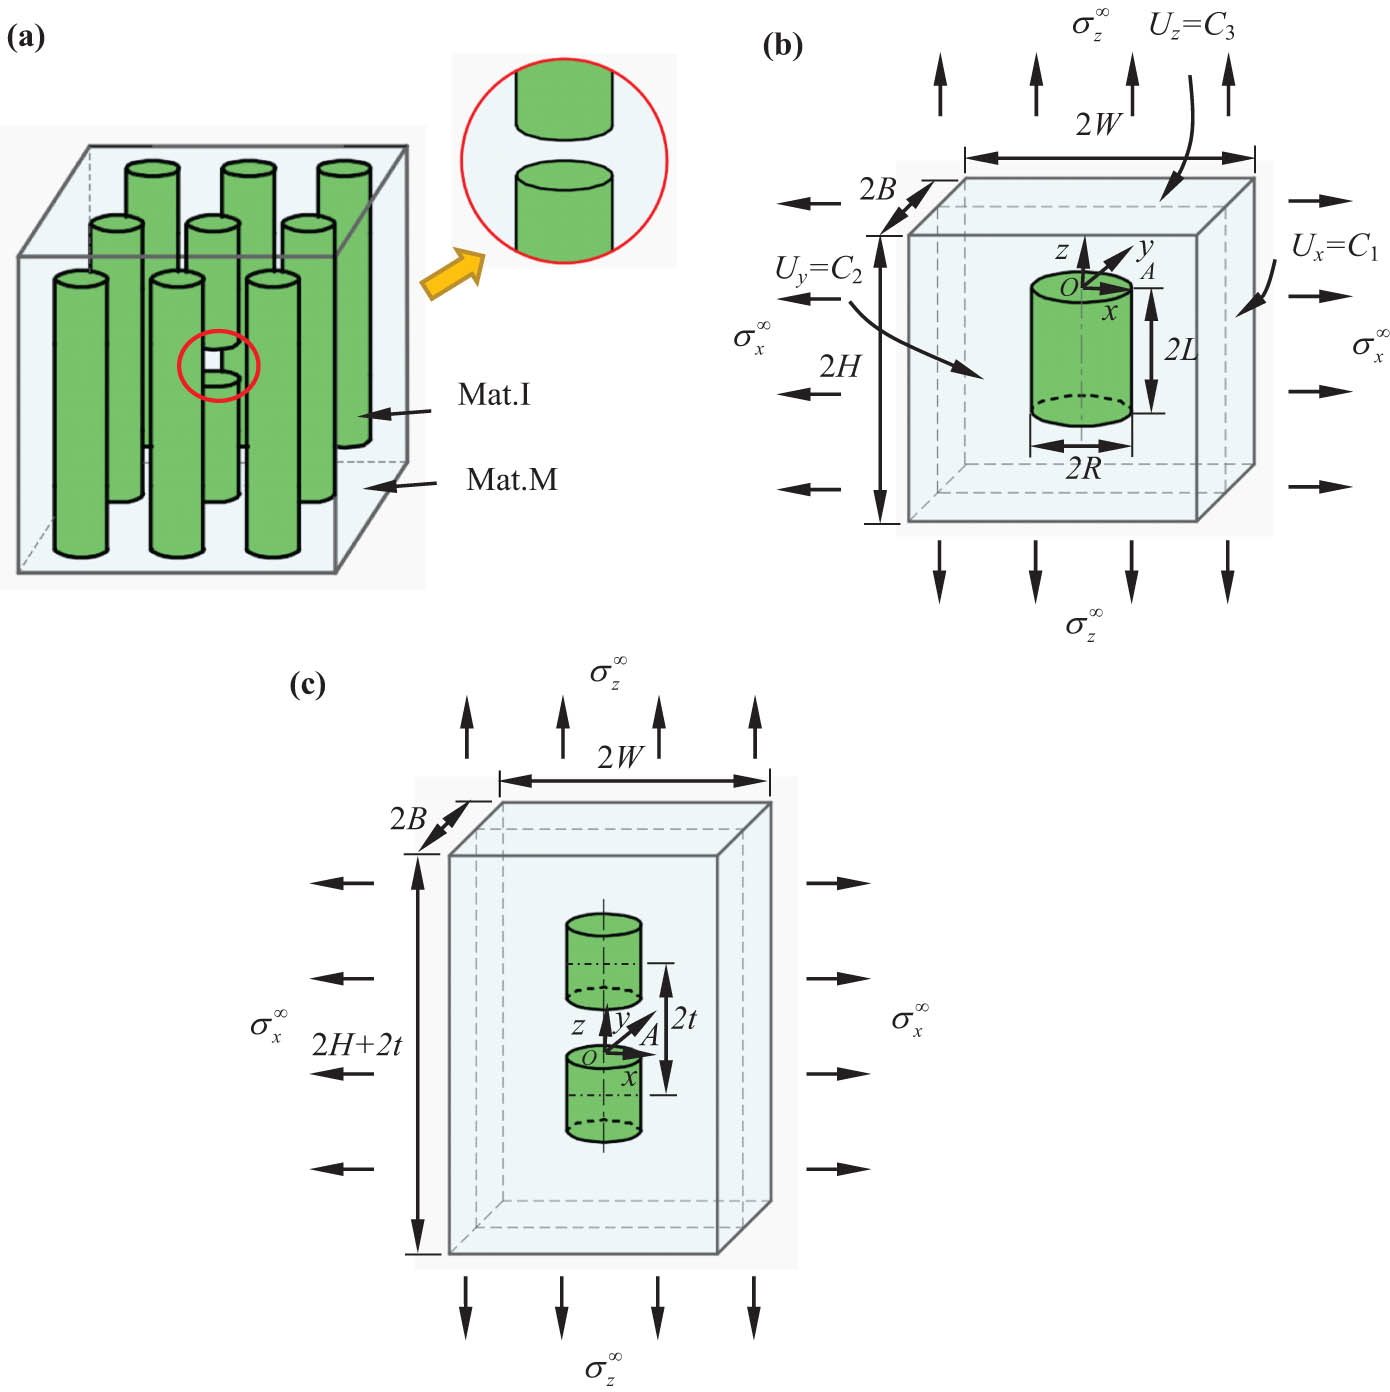
(a) Periodic inclusion model with a local fiber discontinuity; (b) a cylindrical inclusion in a unit cell model; and (c) two cylindrical inclusions aligned in the z-direction.
The diameter of the cylindrical inclusion is 2R and the height is 2L. The boundary condition of the unit cell satisfies U x = C 1, U y = C 2, and U z = C 3. That is, the six planes are translational in the loading process. The elasticity modulus of the inclusion and the matrix are E I and E M, respectively. The Poisson's ratios are v I and v M, respectively. Taking the center point O of the top surface of the cylindrical inclusion as the origin point, the Cartesian coordinate system is established to obtain the singular stress field near the inclusion corner line A. As shown in Figure 2a, a local coordinate system (ρ, ϕ, θ) is established with a point on the inclusion corner front line A. In the region where ρ ≪ R, the asymptotic displacement and stress on the angular bisector of the cylindrical inclusion corner can be expressed as follows:
where λ is the characteristic root of the characteristic equation [37]. The number of intercepted characteristic roots may be multiple, which may be real or complex. N is the number of intercepted complex roots, and M is the number of intercepted real roots. Due to the bounded strain energy, only the eigen values within the range of Re(λ) > −1 are considered herein. D is the elastic matrix of the material, and β n is the stress intensity coefficient to be solved.

Definition of a SICE along the inclusion corner line: (a) Local curvilinear coordinate in rectangular coordinate and cylindrical coordinate; and (b) SICE containing partial inclusion corner line.
The displacement and stress field in the global coordinate system (x, y, z) can be obtained by transforming the corresponding parameters in the local coordinate system (ρ, ϕ, θ), i.e.,
in which
In Figure 2b, an SICE containing partial inclusion corner line is established. The singular element contains the inclusion domain ΩI and the matrix domain ΩM. Γei is the end surface of the SICE. Γci is the remaining surface of the SICE. In order to solve the unknown parameter β n according to the H–R variational principle, the variational functional at the inclusion corner is defined as follows:
By solving the steady state value of the functional, the element stiffness matrix of the SICE is established, and the singular stress field at the inclusion corner is obtained.
where Γc is the assembly of Γci , n is the unit normal vector, and N h is the interpolation function matrix.
When −1 < λ < 1, the singular stress field at the inclusion corner can be expressed as the sum of the third-order singular stresses:
3.2 Verification of the SICE model
In order to verify the SICE model, the unit cell model as shown in Figure 1b is considered. Under the applied load
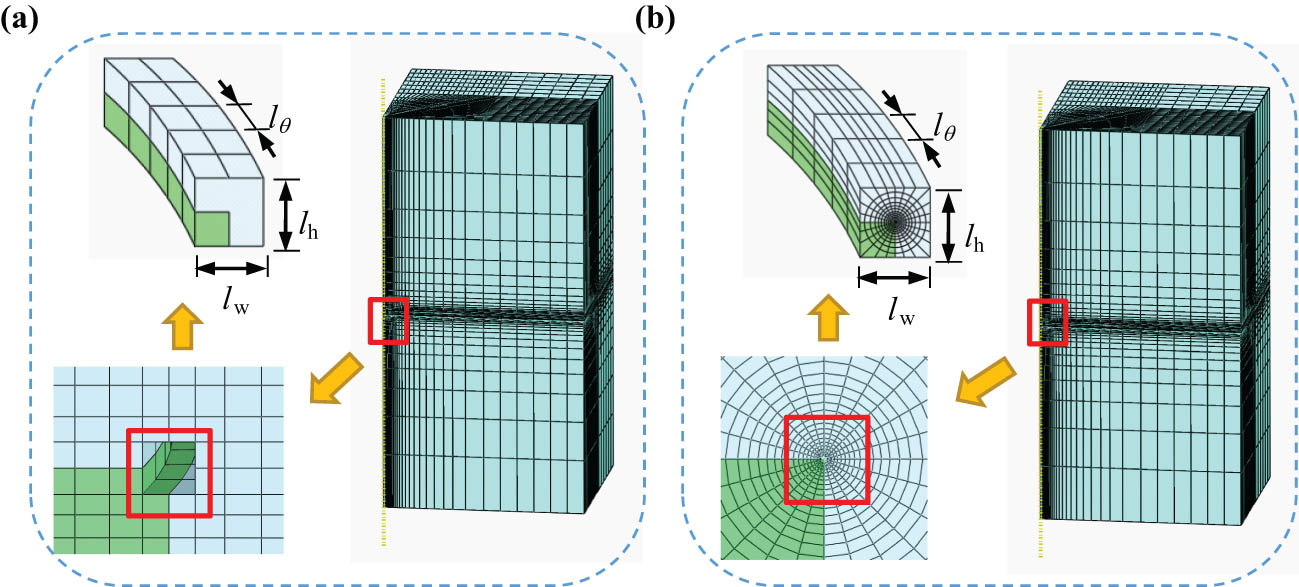
The meshes at the corner of 3D cylindrical inclusion as shown in Figure 1b (L/R = 1, H/L = 100): (a) the mesh using traditional elements and SICEs and (b) the mesh using traditional elements.
The number of elements and CPU running time for SICE method and traditional FEM (Case in Figure 1b)
| L/H | Num. of elements | CPU time | ||
|---|---|---|---|---|
| SICE + FEM | FEM | SICE + FEM | FEM | |
| L/H = 0.8 | 61,688 | 167,442 | 0:01:48 | 0:05:53 |
| L/H = 0.67 | 66,350 | 196,361 | 0:02:05 | 0:07:03 |
| L/H = 0.5 | 80,864 | 254,736 | 0:02:21 | 0:08:07 |
| L/H = 0.33 | 89,027 | 267,255 | 0:02:31 | 0:08:13 |
| L/H = 0.1 | 105,094 | 282,590 | 0:02:58 | 0:10:13 |

Comparison of stress results between the SICE method and the traditional FEM = (L/R = 1, L/H = 100): (a) and (b) results under tensile loading
Figure 4c and d shows the variation in the singular stress components
In the stress intensity coefficient expression, the effect of Dim(
β
) = (2N + M) on the singular stress field of a cylindrical inclusion is shown in Table 2. When Dim(
β
) = 10–26, the errors of
Effect of Dim(
β
) = (2N + M) on singular stress field under tensile loading
| Dim ( β ) = 2N + M |
|
|
||
|---|---|---|---|---|
| E I/E M = 10−2 | E I/E M = 102 | E I/E M = 10−2 | E I/E M = 102 | |
| 10 | 15.827 | 0.193 | 1.177 | 8.028 |
| 14 | 15.892 | 0.193 | 1.179 | 8.092 |
| 18 | 15.986 | 0.195 | 1.183 | 8.092 |
| 22 | 15.988 | 0.195 | 1.184 | 8.093 |
| 26 | 15.987 | 0.195 | 1.185 | 8.090 |
4 Discussion of results
This section applies the SICE model to calculate the fiber inclusion problem under the loading as shown in Figure 1. The effects of load direction, fiber spacing, fiber geometry, and material properties on SIFs at the inclusion corner are analyzed numerically.
4.1 Effects of inclusion size and spacing on the fatigue strength parameters
In the unit cell model as shown in Figure 1b, the effects of inclusion size and spacing on the SIF at corner line A under tensile loading
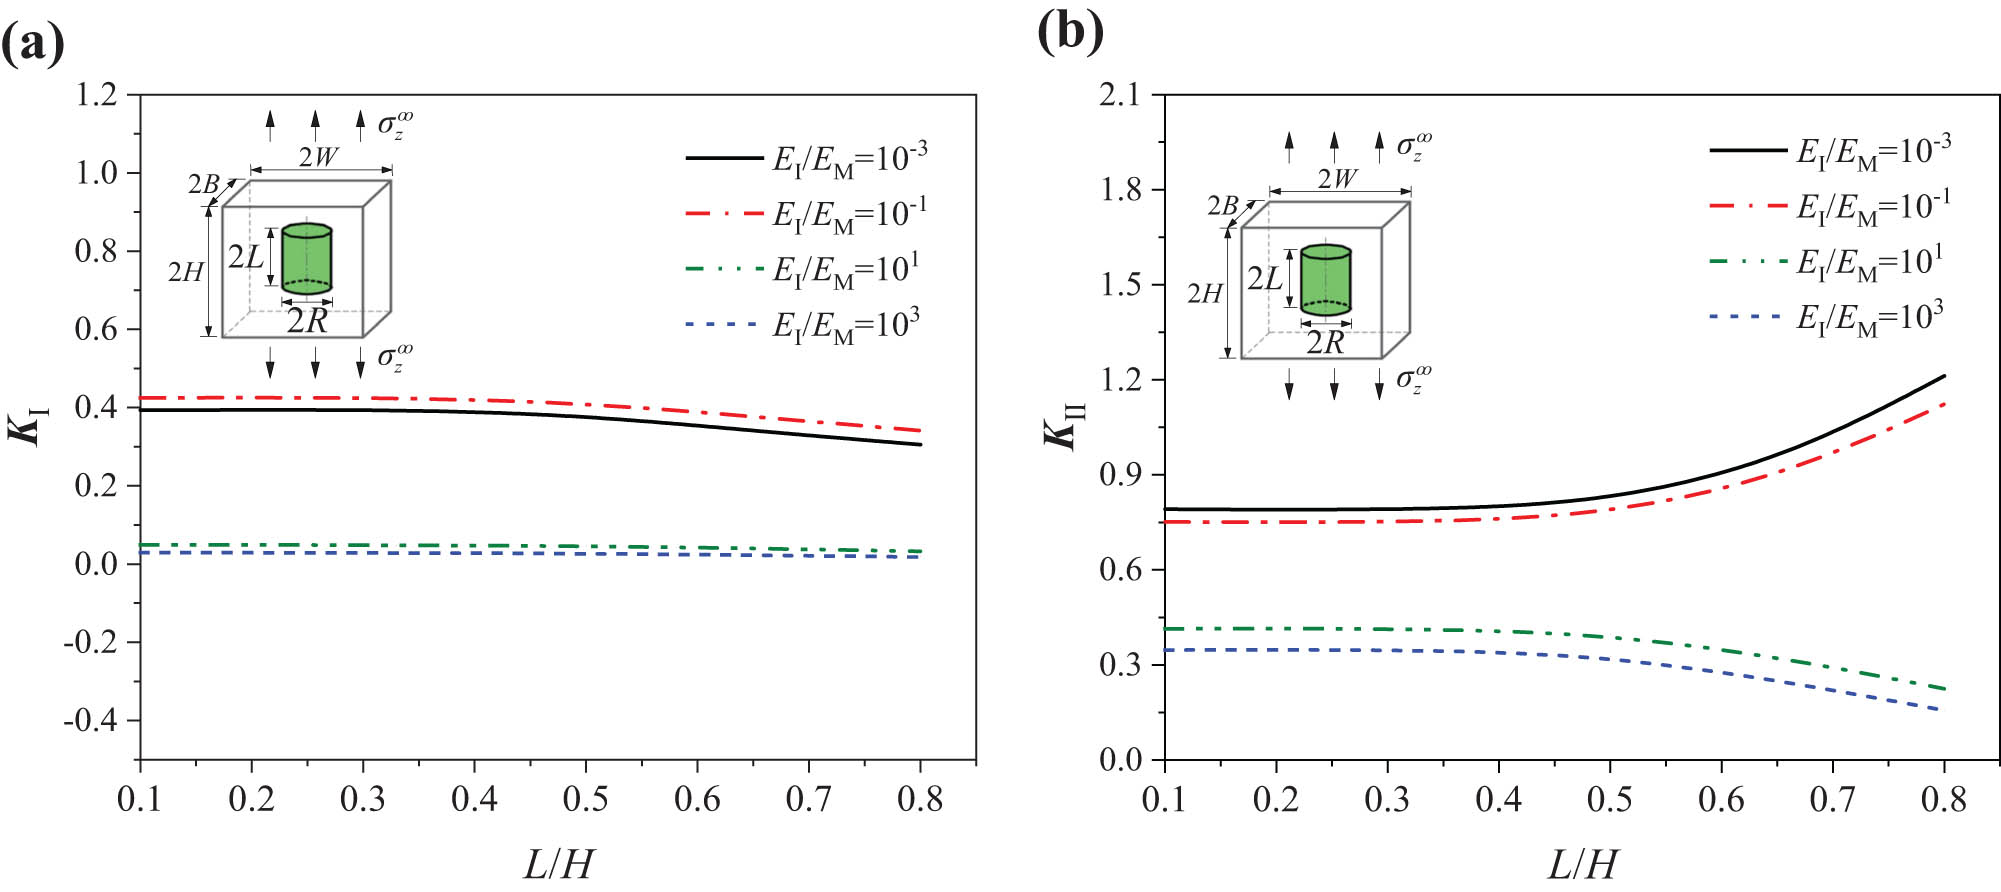
Variation in SIFs at the inclusion corner with the geometrical parameter L/H (L/R = 1) in (a) K I and (b) K II.
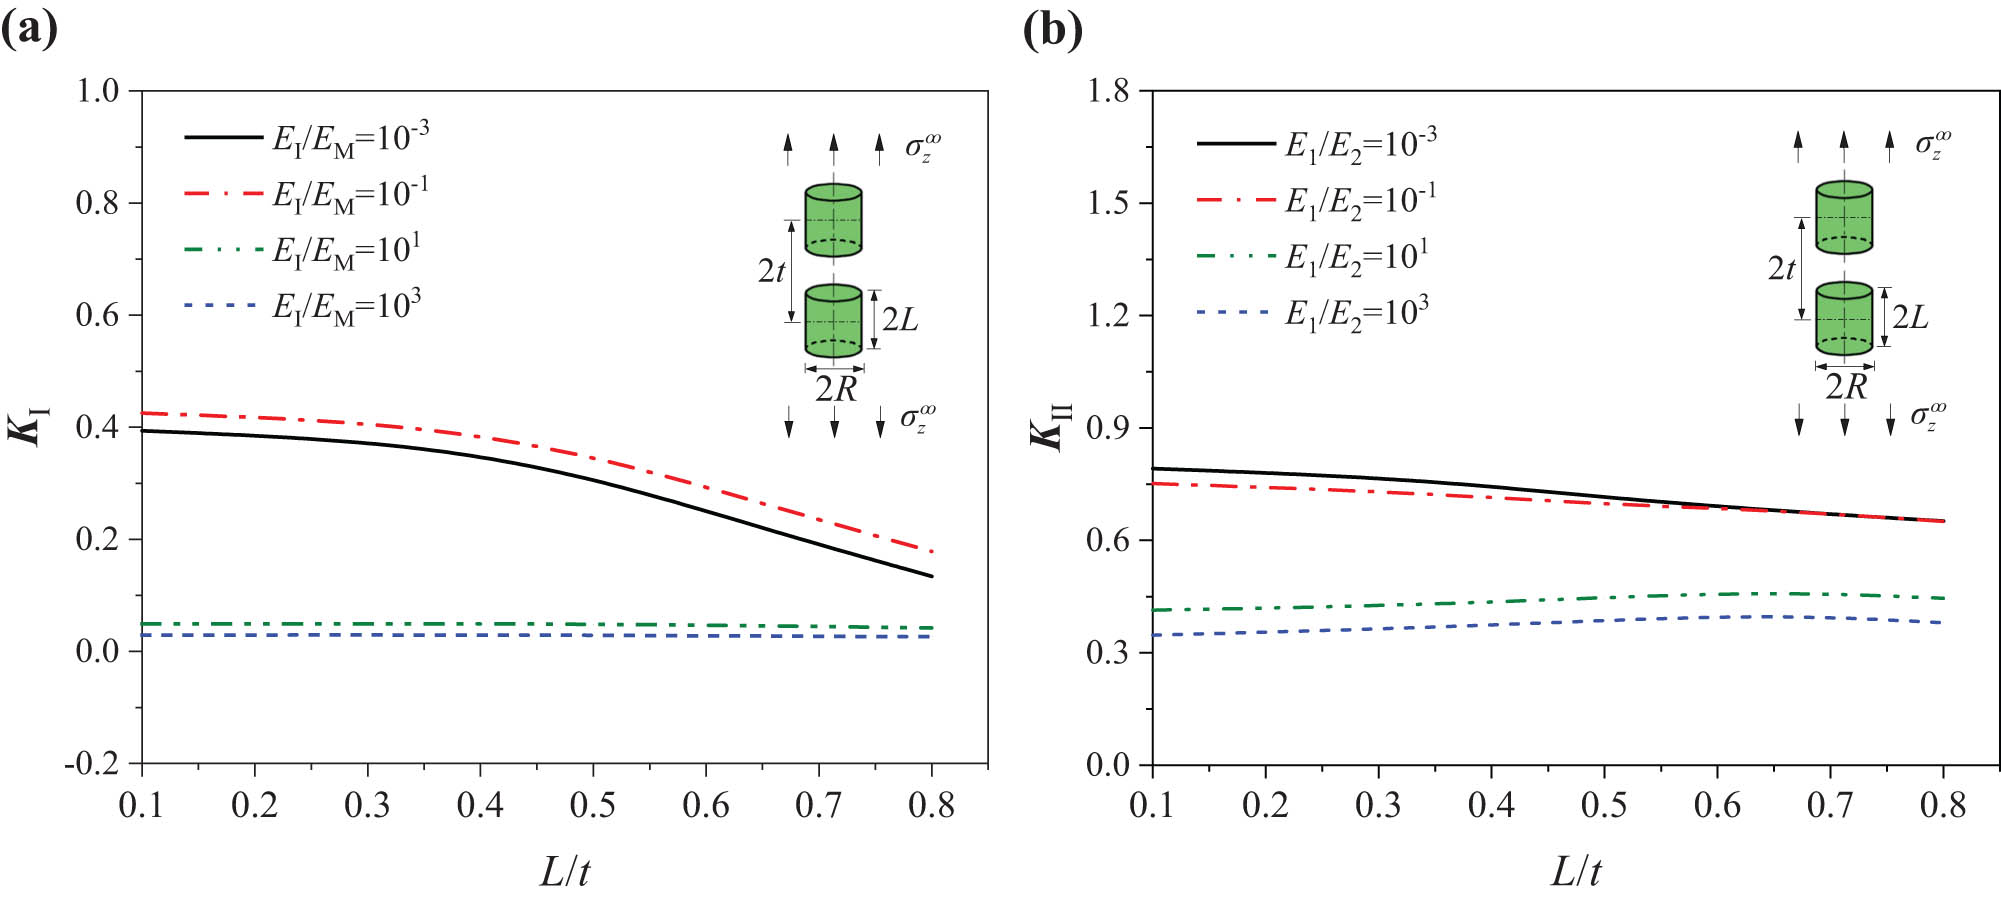
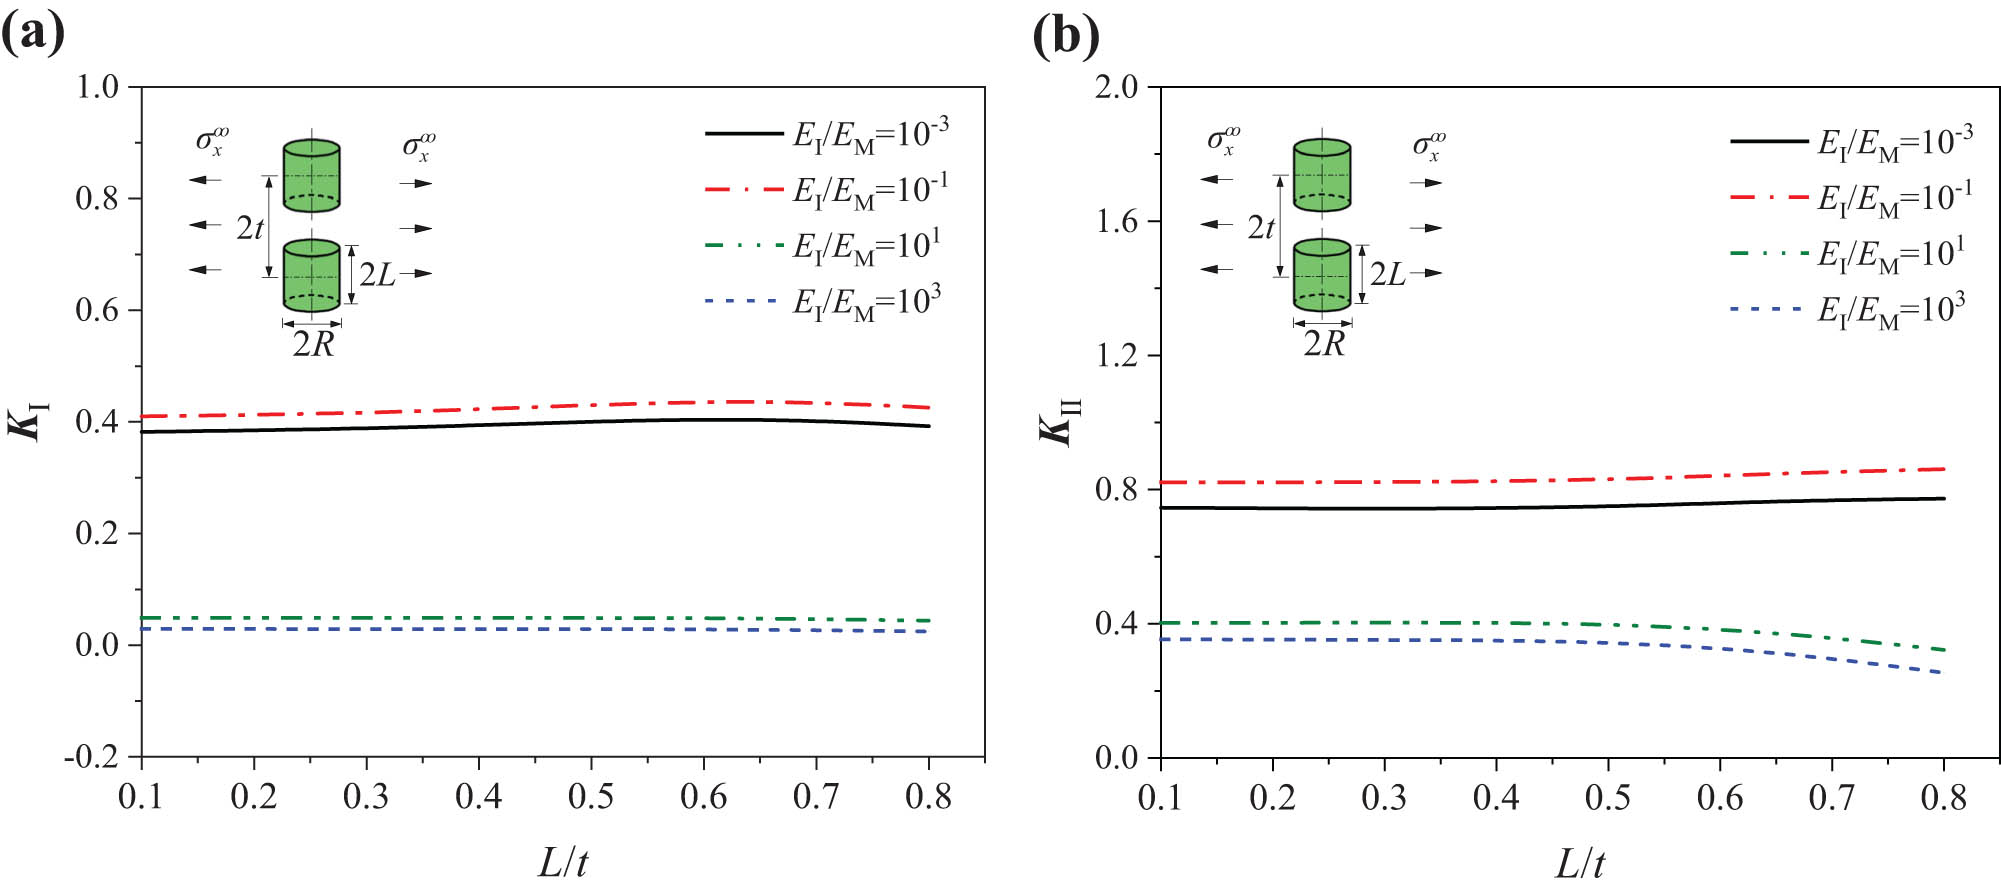
In order to analysis the influence of fiber fracture, the model of double inclusions aligned in the z-direction is established, as shown in Figure 1c. Let L/H = 0.01, which makes the model approximate to an inclusion in an infinite solid. The z-direction distance between the two inclusions is represented by 2t. As shown in Figure 6, K
Ⅰ decreases with L/t for both the soft and hard inclusions. For soft inclusions, K
II increases with the increase in the distance 2t between the two inclusions. While for hard inclusions, K
α
is basically stable after a little decrease with increase in the distance 2t. The extrema of K
II when E
I/E
M = 101 and E
I/E
M = 10−1 both appear at L/t = 0.7, their values are 0.463 and 0.402, respectively. The results show that the interference of inclusions aligned in the z-direction reduces the tendency of opening fracture at the corner front of the inclusion under tensile loading
(a) K I and (b) K II in the interaction of double cylindrical inclusions aligned in the z-direction (L/R = 1).
Figure 7 shows K
Ⅰ and K
Ⅱ in the interaction of double inclusions aligned in the z-direction and at the corner of an inclusion in a unit cell when L/R = 10. By comparing Figure 7 with Figures 5 and 6, K
I is basically the same under tensile loading

(a) K Ⅰ and (b) K Ⅱ at the corner of double cylindrical inclusions aligned in the z-direction and inclusion in unit cell (L/R = 10).
In the current analysis, when E I/E M = 10−3, the length-diameter ratio (L/R) of the inclusion in the unit cell increases, a decreasing trend corresponding to the two cases L/R = 1 and 10, K Ⅰ decreased by 24.834 and 2.969%, respectively.
4.2 Effects of length-diameter ratio and size of a unit cell on fatigue strength parameters
Figure 8a and b shows the variation in K
Ⅰ and K
Ⅱ at the corner A with the length-diameter ratio and size of unit cell under the loading
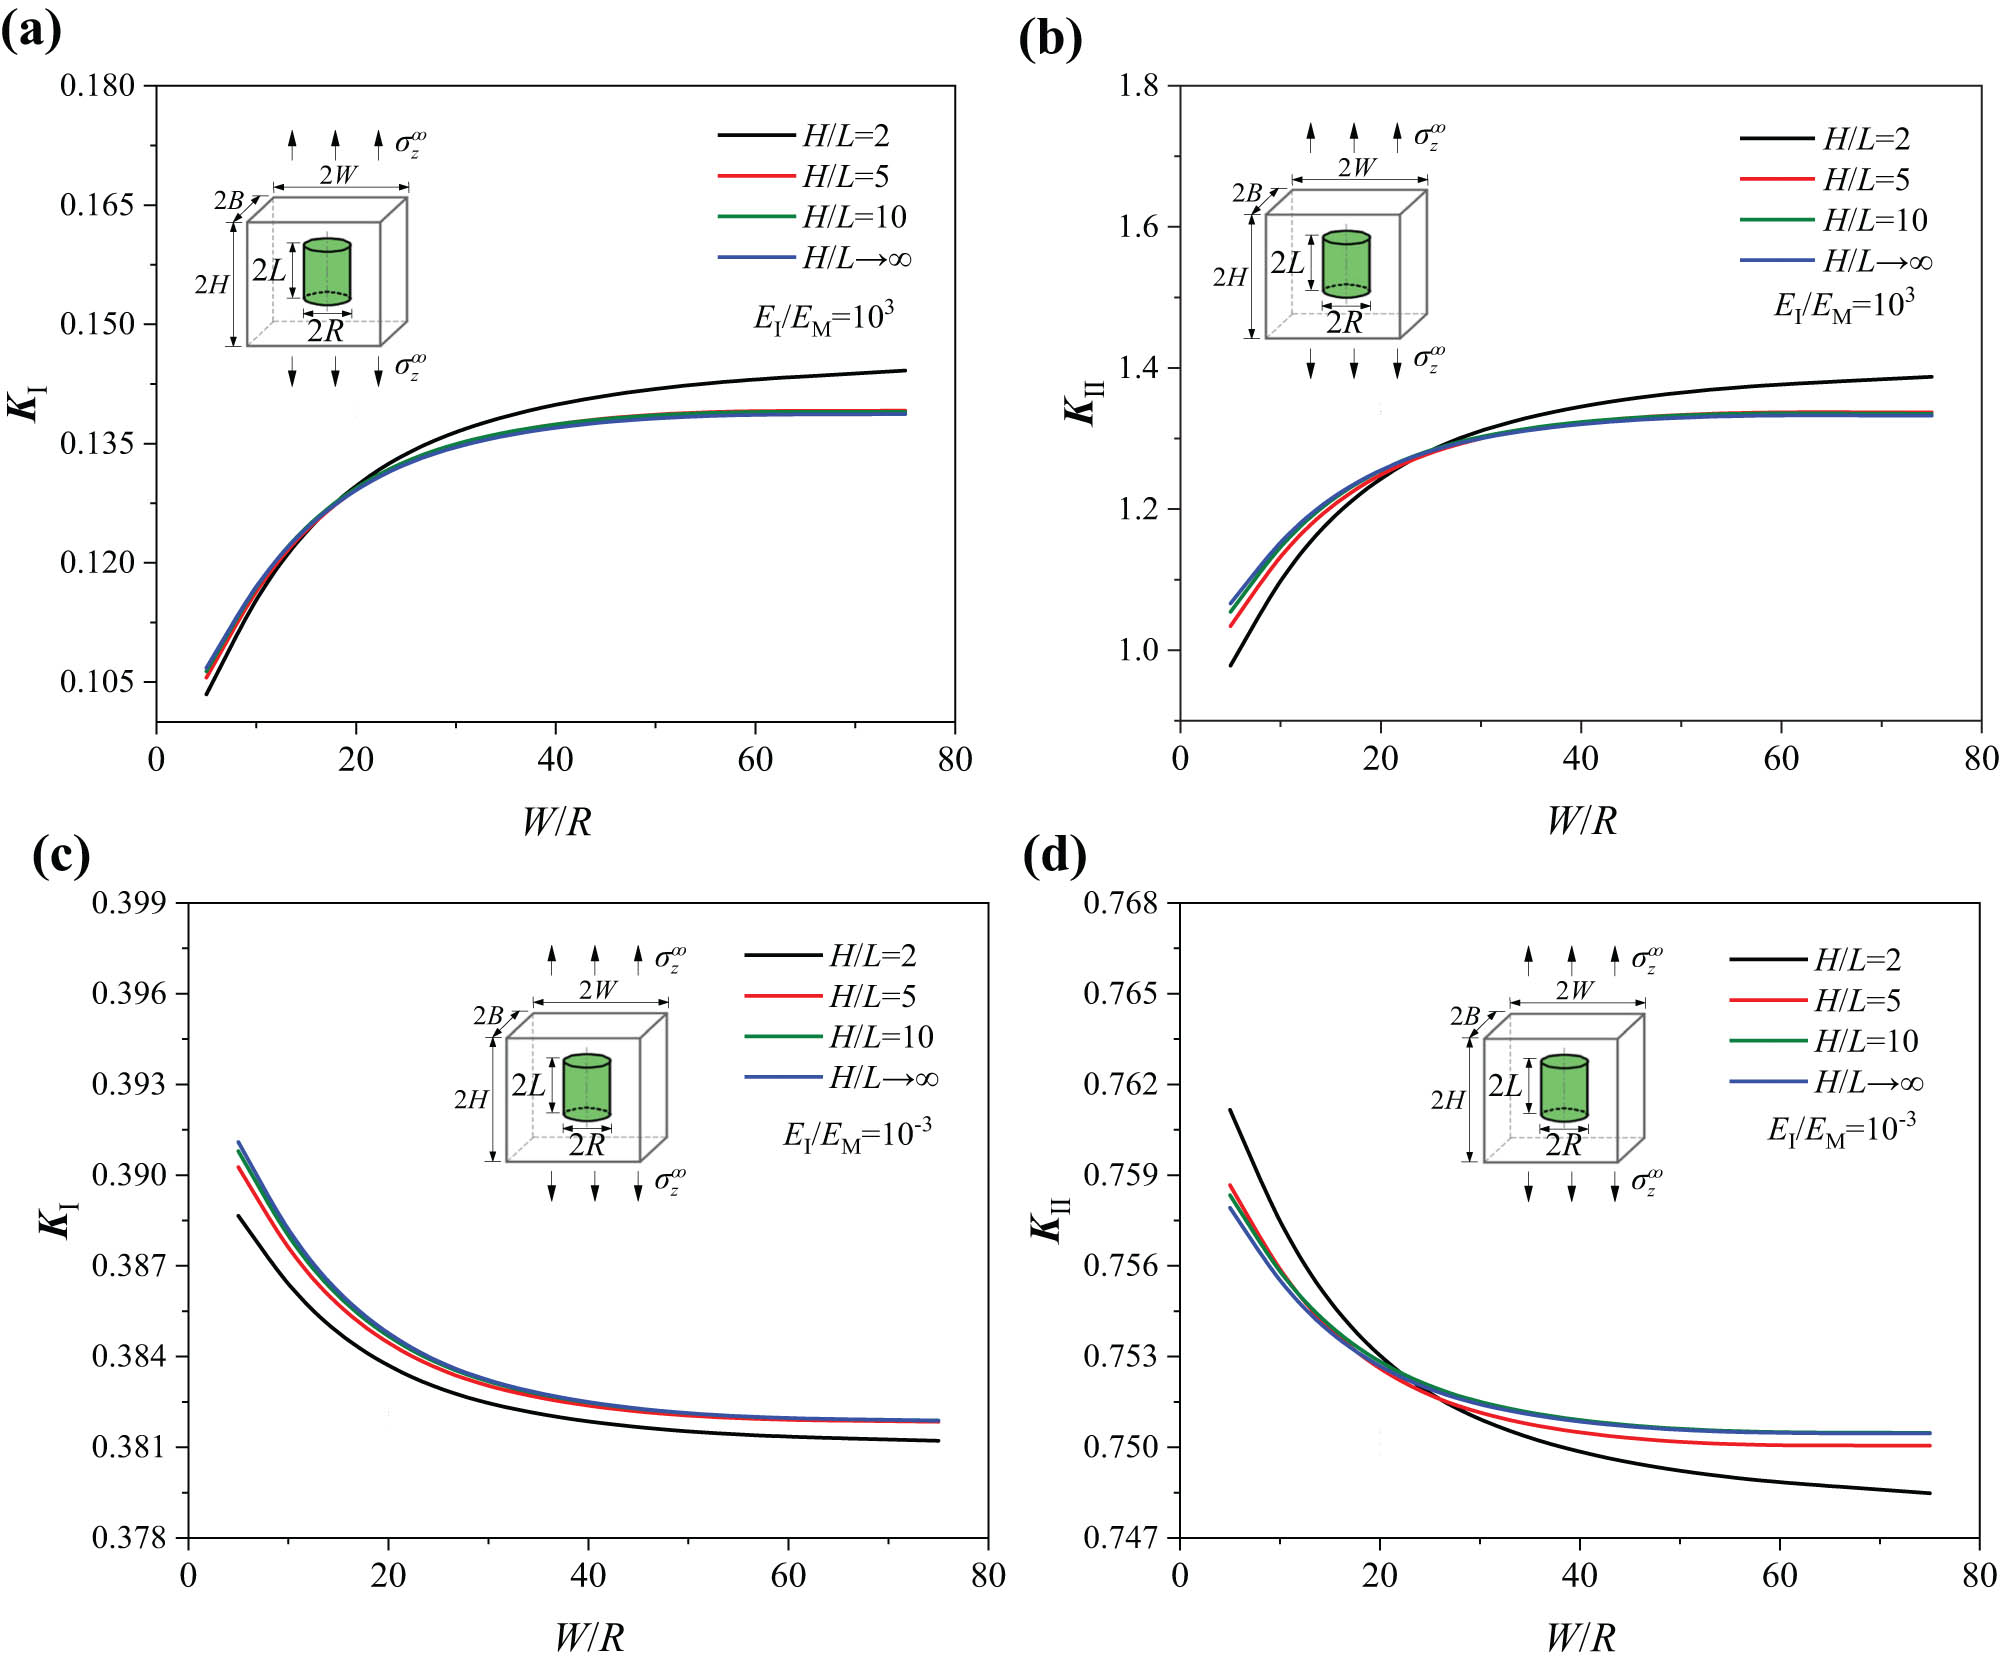
Effects of the unit cell size parameter W/R and the length-width ratio H/L on K
Ⅰ and K
Ⅱ under
4.3 The fatigue strength parameter results under loading
σ
x
∞
The variation in K
Ⅰ and K
Ⅱ with L/H of the cylindrical inclusion in a unit cell under tensile loading

Variation in (a) K Ⅰ and (b) K Ⅱ with L/H of the unit cell (L/R = 1).
Variation in (a) K Ⅰ and (b) K Ⅱ with position parameter of the cylindrical inclusions (L/R = 1).
As shown in Figure 11, under
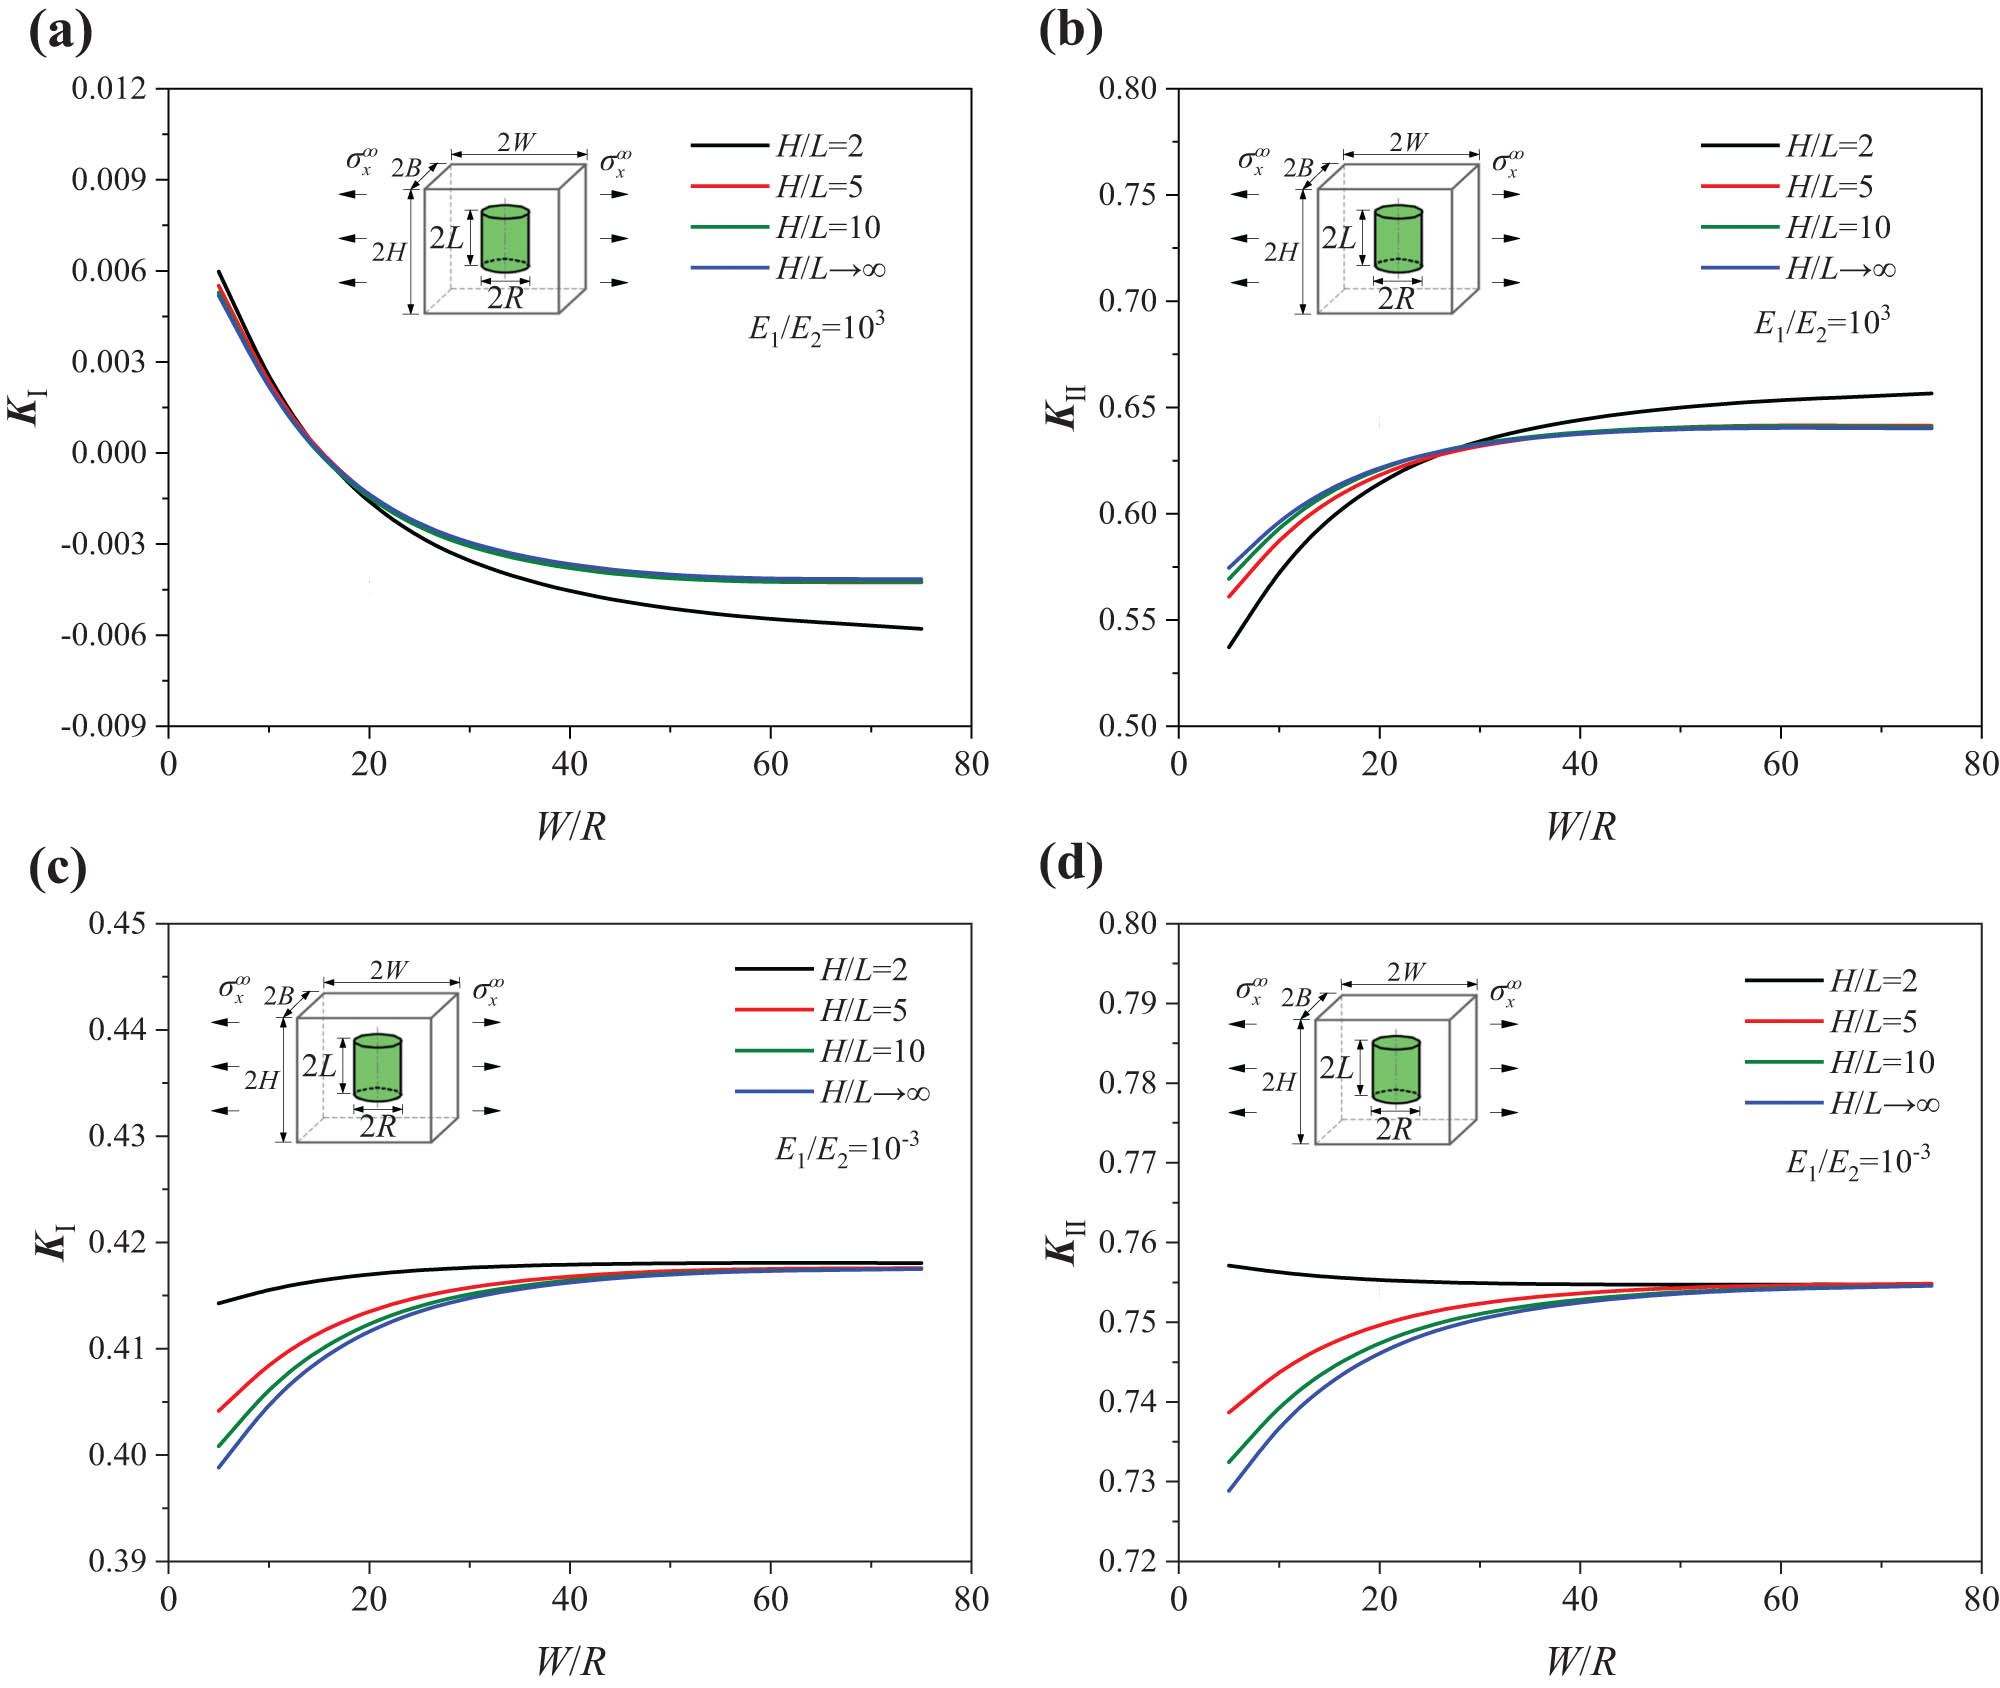
Effects of the unit cell size parameter W/R and the length-width ratio H/L on K
Ⅰ and K
Ⅱ under
5 Comparison between singular stress fields of the 2D and 3D models
The difference between the results of 3D cylindrical inclusion and 2D plane square inclusion is analyzed. Table 3 shows the dimensionless SIFs at the inclusion corner in a unit cell with different material properties and geometric sizes. The variation in the dimensionless SIFs at the 3D cylindrical inclusion corner and the 2D plane square inclusion corner with L/H (l 1/l 2) is basically the same, while there is a special case. In the range of 1/10 ≤ L/H (l 1/l 2) ≤ 2/3 and when E I/E M = 10−1, F Ⅰ at the cylindrical inclusion corner decreased by 12.153%, while F Ⅰ at planar square inclusion corner increased by 14.825%. Table 4 shows the dimensionless SIFs at the double square inclusion aligned in the z-direction. It is found that the variation trends of F Ⅱ in 3D hard inclusions with L/t (l 1/l 2) are different from that of 2D hard inclusions. In the 3D model, F Ⅱ goes up by 8.504% with increase in L/H. On the other hand, in the 2D model, F Ⅱ goes down by 5.766% with increase in l 1/l 2. As shown in Table 3, F Ⅰ and F Ⅱ for 3D cylindrical inclusions are larger than that of 2D plane square inclusions when E I/E M = 10−1. F Ⅰ and F Ⅱ for 3D cylindrical inclusions are smaller than that of 2D plane square inclusions when E I/E M = 101. This same rule applies to the double cylindrical inclusions aligned in the z-direction as shown in Table 4.
Comparison of SIFs between a cylindrical inclusion (3D) and a square inclusion (2D) under loading
| E I /E M | F Ⅰ | Change (%) | F Ⅱ | Change (%) | |||
|---|---|---|---|---|---|---|---|
| L/H (3D), l 1/l 2 (2D) | 1/10 | 2/3 | 1/10 | 2/3 | |||
| 10−1 | 3D | 0.288 | 0.253 | −12.153 | 1.904 | 2.276 | 19.538 |
| 10−1 | 2D (20) | 0.371 | 0.426 | 14.825 | 2.402 | 3.492 | 45.379 |
| 10 | 3D | 0.295 | 0.238 | −19.322 | 0.616 | 0.477 | −22.565 |
| 10 | 2D (20) | 0.229 | 0.182 | −20.524 | 0.532 | 0.355 | −33.271 |
Comparison of SIFs between double cylindrical inclusion (3D) and double square inclusion (2D) aligned in the z-direction under loading
| E I /E M | F Ⅰ | Change (%) | F Ⅱ | Change (%) | |||
|---|---|---|---|---|---|---|---|
| L/t (3D), l 1/l 2 (2D) | 1/10 | 2/3 | 1/10 | 2/3 | |||
| 10−1 | 3D | 0.275 | 0.174 | −36.727 | 1.843 | 1.719 | −6.728 |
| 10−1 | 2D (20) | 0.324 | 0.179 | −44.753 | 2.210 | 2.082 | −5.792 |
| 10 | 3D | 0.297 | 0.274 | −7.744 | 0.635 | 0.689 | 8.504 |
| 10 | 2D (20) | 0.226 | 0.192 | −15.044 | 0.554 | 0.522 | −5.776 |
If 2D models are used to evaluate 3D results, their differences should be realized. The analysis results are conservative when E I/E M = 10−1, and the analysis results are dangerous when E I/E M = 101.
6 Conclusion
The SICE model is established to analyze the fatigue strength parameters at the cylindrical inclusion corner in fiber-reinforced composites with local fiber discontinuity. The SIFs of a cylindrical inclusion and in the interaction of double inclusions aligned in the z-direction under tensile loadings in different directions in the unit cell are investigated. The effects of material properties, inclusion geometry and spacing, and unit cell size on SIFs were systematically discussed.
The present discussions show that the effect of the variation in volume ratio on the fracture mechanics properties of soft inclusions and hard inclusions is basically opposite. The sliding fracture effect of the distance between two inclusions on soft inclusions and hard inclusions is different.
The variations in unit cell size parameter and length-width ratio have an effect on SIFs. But when length-width ratio H/L > 10, the analysis results tend to be consistent.
Compared with the 2D models, the present analysis results are conservative for soft inclusions, and the analysis results are dangerous for hard inclusions.
The SICE method is effective to analyze the singular stress field at the cylindrical inclusion corner and provide references for the fatigue strength prediction and preparation of fiber-reinforced composites.
Acknowledgments
The authors acknowledge the support of the National Natural Science Foundation of China under grant No. 51975411 and the Tianjin Natural Science Foundation of China under Grant No. 18JCYBJC88500. Cong-Man Wang acknowledges the support of Tianjin Graduate Research and Innovation Project under grant No. 2020YJSB072.
-
Funding information: The National Natural Science Foundation of China under Grant No. 51975411. The Tianjin Natural Science Foundation of China under Grant No. 18JCYBJC88500. Tianjin Graduate Research and Innovation Project under Grant No. 2020YJSB072.
-
Author contributions: Cong-Man Wang: writing – original draft, formal analysis, and visualization; Xue-Cheng Ping: methodology, writing – review and editing, and project administration; Xing-Xing Wang: writing – original draft, data curation, and investigation.
-
Conflict of interest: The authors declare that there is no conflict of interest regarding the publication of this article.
-
Data availability statement: All data generated or analyzed during this study are included in this published article.
References
[1] Li LB. Damage and failure of fiber-reinforced ceramic-matrix composites subjected to cyclic fatigue, dwell fatigue and thermomechanical fatigue. Ceram Int. 2017;43(16):13978–96. 10.1016/j.ceramint.2017.07.130.Search in Google Scholar
[2] Deng Y, Li W, Wang X, Kou H, Zhang X, Shao J, et al. Temperature-dependent tensile strength model for 2D woven fiber reinforced ceramic matrix composites. J Am Ceram Soc. 2018;101:5157–65. 10.1111/jace.15765.Search in Google Scholar
[3] Sayyar M, Balachandra AM, Soroushian P. Energy absorption capacity of pseudoelastic fiber-reinforced composites. Sci Eng Compos Mater. 2014;21(2):173–9. 10.1515/secm-2013-0021.Search in Google Scholar
[4] Sun Z. Progress in the research and applications of natural fiber-reinforced polymer matrix composites. Sci Eng Compos Mater. 2018;25(5):835–46. 10.1515/secm-2016-0072.Search in Google Scholar
[5] Gu JF, Chen PH, Su L, Li K. A theoretical and experimental assessment of 3D macroscopic failure criteria for predicting pure inter-fiber fracture of transversely isotropic UD composites. Compos Struct. 2021;259:113466. 10.1016/j.compstruct.2020.113466.Search in Google Scholar
[6] Ostapiuk M, Bieniaś J, Surowska B. Analysis of the bending and failure of fiber metal laminates based on glass and carbon fibers. Sci Eng Compos Mater. 2018;25(6):1095–106. 10.1515/secm-2017-0180.Search in Google Scholar
[7] Chen W, Ji X, Huang Z. Influence of fiber type on mechanical properties of lightweight cement-based composites. Sci Eng Compos Mater. 2021;28(1):249–63. 10.1515/secm-2021-0021.Search in Google Scholar
[8] Lazzarin P, Tovo R. A notch intensity factor approach to the stress analysis of welds. Fatigue Fract Eng M. 1998;21:1089–103. 10.1046/j.1460-2695.1998.00097.x.Search in Google Scholar
[9] Lazzarin P, Campagnolo A, Berto F. A comparison among some recent energy- and stress-based criteria for the fracture assessment of sharp V-notched components under Mode I loading. Theor Appl Fract Mec. 2014;71:21–30. 10.1016/j.tafmec.2014.03.001.Search in Google Scholar
[10] Seweryn A. Brittle fracture criterion for structures with sharp notches. Eng Fract Mech. 1994;47:673–81. 10.1016/0013-7944(94)90158-9.Search in Google Scholar
[11] Livieri P, Lazzarin P. Fatigue strength of steel and aluminium welded joints based on generalised stress intensity factors and local strain energy values. Int J Fract. 2005;133(3):247–76. 10.1007/s10704-005-4043-3.Search in Google Scholar
[12] Bogy DB, Wang KC. Stress singularities at interface corners in bonded dissimilar isotropic elastic materials. Int J Solids Struct. 1971;7(8):993–1005. 10.1016/0020-7683(71)90077-1.Search in Google Scholar
[13] Zbib HM, Hirth JP, Demir I. The stress intensity factor of cylindrical cracks. Int J Eng Sci. 1995;33(2):247–53. 10.1016/0020-7225(94)E0051-J.Search in Google Scholar
[14] Jiang CP, Xu YL, Cheung YK, Lo SH. A rigorous analytical method for doubly periodic cylindrical inclusions under longitudinal shear and its application. Mech Mater. 2004;36(3):225–37. 10.1016/S0167-6636(03)00010-3.Search in Google Scholar
[15] Bian L, Chen L, Gao M. Stress distribution analysis and interface influence on fiber reinforced composites. Mech Mater. 2020;146:103400. 10.1016/j.mechmat.2020.103400.Search in Google Scholar
[16] Mantič V. Interface crack onset at a circular cylindrical inclusion under a remote transverse tension. Application of a coupled stress and energy criterion. Int J Solids Struct. 2009;46(6):1287–304. 10.1016/j.ijsolstr.2008.10.036.Search in Google Scholar
[17] Vable M, Maddi JR. Boundary element analysis of inclusions with corners. Eng Anal Bound Elem. 2007;31(9):762–70. 10.1016/j.enganabound.2007.01.006.Search in Google Scholar
[18] Chen DH. Analysis of singular stress field around the inclusion corner tip. Eng Fract Mech. 1994;49(4):533–46. 10.1016/0013-7944(94)90047-7.Search in Google Scholar
[19] Noda NA, Genkai T, Wang Q. Intensity of singular stress fields at the end of a cylindrical inclusion. J Appl Mech. 2003;70:487–95. 10.1115/1.1598479.Search in Google Scholar
[20] Noda NA, Takase Y, Hamashima T. Generalized stress intensity factors in the interaction within a rectangular array of rectangular inclusions. Arch Appl Mech. 2003;73(5/6):311–22. 10.1007/s00419-002-0249-2.Search in Google Scholar
[21] Noda NA, Takase Y. Intensity of singular stress at the fiber end in a hexagonal array of fibers. Int J Solids Struct. 2005;42(16–17):4890–908. 10.1016/j.ijsolstr.2005.01.021.Search in Google Scholar
[22] Bulling J, Gravenkamp H, Birk C. A high-order finite element technique with automatic treatment of stress singularities by semi-analytical enrichment. Comput Method Appl M. 2019;355:135–56. 10.1016/j.cma.2019.06.025.Search in Google Scholar
[23] Tan MA, Meguid SA. Analysis of bimaterial wedges using a new singular finite element. Int J Fract. 1997;88:373–91. 10.1023/A:1007427506134.Search in Google Scholar
[24] Liou WJ. Stress distributions of short fiber composite materials. Comput Struct. 1997;62(6):999–1012. 10.1016/S0045-7949(96)00307-0.Search in Google Scholar
[25] Madenci E, Shkarayev S, Sergeev B. Thermo-mechanical stresses for a triple junction of dissimilar materials: global-local finite element analysis. Theor Appl Fract Mec. 1998;30(2):103–17. 10.1016/S0167-8442(98)00047-0.Search in Google Scholar
[26] Lei YP, Wang H, Qin QH. Micromechanical properties of unidirectional composites filled with single and clustered shaped fibers. Sci Eng Compos Mater. 2018;25(1):143–52. 10.1515/secm-2016-0088.Search in Google Scholar
[27] Zhang J, Katsube N. A hybrid finite element method for heterogeneous materials with randomly dispersed elastic inclusions. Finite Elem Anal Des. 1995;19(1–2):45–55. 10.1016/0168-874X(94)00056-L.Search in Google Scholar
[28] Cai Z, Hu X, Yao W. Numerical study on bi-material interface crack using symplectic analytical singular element. Eng Fract Mech. 2018;199:308–26. 10.1016/j.engfracmech.2018.05.033.Search in Google Scholar
[29] Hu XF, Chen WH, Zhang P, Bui TQ, Yao WA. A new crack-tip singular element for cracks in three-dimensional elastic bodies. Eng Fract Mech. 2020;235:107148. 10.1016/j.engfracmech.2020.107148.Search in Google Scholar
[30] Chen L, Liu GR, Jiang Y, Zeng K, Zhang J. A singular edge-based smoothed finite element method (ES-FEM) for crack analyses in anisotropic media. Eng Fract Mech. 2011;78(1):85–109. 10.1016/j.engfracmech.2010.09.018.Search in Google Scholar
[31] Chen MC, Ping XC. A novel hybrid finite element analysis of inplane singular elastic field around inclusion corners in elastic media. Int J Solids Struct. 2009;46(13):2527–38. 10.1016/j.ijsolstr.2008.08.030.Search in Google Scholar
[32] Ping XC, Chen MC, Xiao YH. Field intensity factors around inclusion corners in 0–3 and 1–3 composites subjected to thermo-mechanical loads. Int J Mech Mater Des. 2016;12(1):121–39. 10.1007/s10999-014-9287-5.Search in Google Scholar
[33] Ping XC, Chen MC, Zhu W, Xiao YH, Wu WX. Computations of singular stresses along three-dimensional corner fronts by a super singular element method. Int J Comp Meth-Sing. 2016;14(6):1750065. 10.1142/S0219876217500657.Search in Google Scholar
[34] Ping XC, Zhang YX, Guo YB, Xiao ZM, Jalde J, Chen MC. Intensity of stress singularity for the circumferential V‐shape corner front of a three‐dimensional diamond‐like defect. Fatigue Fract Eng M. 2020;43(4):802–17. 10.1111/ffe.13189.Search in Google Scholar
[35] Zhang YX, Ping XC, Wang CM, Xiao ZM, Yang JY, Chen MC. A new computational approach for three-dimensional singular stress analysis of interface voids. Acta Mech. 2021;232:639–60. 10.1007/s00707-020-02842-0.Search in Google Scholar
[36] Sze KY, Wang HT. A simple finite element formulation for computing stress singularities at bimaterial interfaces. Finite Elem Anal Des. 2000;35(2):97–118. 10.1016/S0168-874X(99)00057-8.Search in Google Scholar
[37] Chen MC, Sze KY. A novel hybrid finite element analysis of bimaterial wedge problems. Eng Fract Mech. 2001;68(13):1463–76. 10.1016/S0013-7944(01)00015-7.Search in Google Scholar
© 2022 Cong-Man Wang et al., published by De Gruyter
This work is licensed under the Creative Commons Attribution 4.0 International License.
Articles in the same Issue
- Regular Articles
- Experimental investigations of a novel pressure microfoam preparation device for dust removal
- Influence of hydrothermal aging on the mechanical performance of foam core sandwich panels subjected to low-velocity impact
- Experimental study on surface wrapping strengthening of EPS particles and its concrete performance
- Modification of mechanical properties of Shanghai clayey soil with expanded polystyrene
- A new EPS beads strengthening technology and its influences on axial compressive properties of concrete
- A novel superabsorbent material based on soybean straw: Synthesis and characterization
- Use of line laser scanning thermography for the defect detection and evaluation of composite material
- Research on back analysis of meso-parameters of hydraulic cemented sand and gravel based on Box-Behnken design response surface
- Hot deformation behavior and microstructure of a 0.5 wt% graphene nanoplatelet reinforced aluminum composite
- Analysis of electromagnetic characteristics of the proposed composite four-rail electromagnetic launcher
- Preparation and characterization of a graphene hybridizing polyurethane damping composite
- Effects of layup parameters and interference value on the performance of CFRP–metal interference fit joints
- Vibration and noise reduction of pipelines using shape memory alloy
- Finite element analysis of behavior and ultimate strength of composite column
- Dynamic response of functionally graded plate under harmonic load with variable gradient parameters
- Deformation behavior of rubber composite based on FEA and experimental verification
- Effects of Z-pin on moisture absorption property and damage mode under flexural load for carbon fiber composite
- Design and testing of a smart rubber stave for marine water-lubricated bearings
- Study of carbon nano-modifier of fly ash in cement concrete mixtures of civil engineering
- Analysis of multiple impact tests’ damage to three-dimensional four-directional braided composites
- Theoretical analysis of aluminum honeycomb sandwich panel supported by reinforced concrete wall under low-speed impact load
- Effects of local fiber discontinuity on the fatigue strength parameter at the fiber inclusion corner in fiber-reinforced composites
- Experimental investigation on compressive properties of three-dimensional five-directional braided composites in hygrothermal environment
- Failure process of steel–polypropylene hybrid fiber-reinforced concrete based on numerical simulations
- A simple method for measuring the monofilament diameter of continuous filament yarn with high bending stiffness via synthetic laser imaging
- Span length effect on flexural properties of composite laminate reinforced with a plain weave carbon fiber fabric in a polymer matrix
- Mechanical properties improving and microstructure characterization of inorganic artificial stone binder
- Effect of thermal treatment process on the structure of C/SiO2 composite aerogels
- Mechanical and corrosion resistance analysis of laser cladding layer
- Wear and corrosion mechanisms of Ni–WC coatings modified with different Y2O3 by laser cladding on AISI 4145H steel
- Damage and failure analysis of composite stiffened panels under low-velocity impact and compression after impact with damp-heat aging
- In-situ CT characterization of 2D woven SiCf/SiC composite loading under compression
- Effect of the manufacturing process on the equivalency qualification of glass fiber reinforced polymer
- Study of concrete properties based on crushed stone sand mixture and fiber of fly ash of thermal power plants
- Establishment of wear mechanism distribution diagram of ZTAp-reinforced iron matrix composites
- Calculation method of elastic modulus for carbon fiber-reinforced plastics considering inhomogeneous interphase
- An experimental study on the failure and enhancement mechanism of bolt-strengthening GFRP T-joint subjected to tensile loading
- The viability of cell that encapsulated in calcium alginate hydrogel beads
- Discussion of ceramic bar reinforced TWIP steel composite structure
- A theoretical framework underlying an accelerated testing method and its application to composites under constant strain rates and fatigue loading
- Theoretical analysis of interfacial design and thermal conductivity in graphite flakes/Al composites with various interfacial coatings
- Multiscale heat conduction and fractal oxidation behaviors of needle-punched carbon/carbon composites
- Numerical simulation of composite grid sandwich structure under low-velocity impact
- Wear properties of Al/TiO2 composites fabricated via combined compo-casting and APB process
- Review Articles
- Application of melanin as biological functional material in composite film field
- Review on research progress of cemented sand and gravel dam
- Communication
- Fabrications and microstructure analysis of cobalt-based coatings by an easy-coating and sintering process
- Letter to the Editor
- Investigation on mechanical and conductive behaviors of nano-graphite-based concrete