Deformation behavior of rubber composite based on FEA and experimental verification
-
Yongfeng Shan
 ,
Haitao Cui
,
Haitao Cui

Abstract
A novel separating device, Inertial particle separator (IPS), has been developed recently to separate solid particles and to protect the turbine engine from particle erosion damage. Herein first, an advanced model based on IPS was proposed to investigate the deformational behavior of deformable particle separator, and to meet the higher requirements of sand discharge and pneumatic demand, which are operated under hostile working conditions or environments and severe climate conditions. We established a three-dimensional (3D) nonlinear finite element analysis (FEA) model of bump consequently, which was the core of centerbody. The essential material parameters of the FEA model were obtained via experimental data (tensile testing). By comparing the influence of these factors (pressure and laying angle), the deformational behavior of the centerbody was discussed. Finally, based on the simulation results with the experimental data (Schlieren testing), the model was found to perform with high reliability and accuracy, demonstrating the great capability in precisely predicting the deformational characteristics of the bump under practical working environments.
1 Introduction
Helicopters have been developed to meet the high demand of topographical variation operating under hostile working environment and severe climate conditions. However, the turboshaft engine fall under the extreme influence of absorbing foreign objects including dust and sand particles, which have a high destructive effect on the interior of the engine and greatly reduce the service life [1]. Therefore, the helicopter is equipped with an advanced separation system to protect the rotating parts from erosion and damage, and the inertial particle separator (IPS) is a separation equipment which has been installed on the aircraft to reduce the dust and debris inhaled by the engine [2,3,4,5,6]. There are two bifurcation paths, namely, clear flow path and mainstream path. The surface of this channel is designed cleverly, and the foreign matters in the air will be removed out of the machine due to the inertia and collision of the clear flow path. However, adding the particle separator will result in the increment of the structural weight of the engine, and the thrust weight ratio of the engine is reduced. The length of the inlet flow direction becomes longer with increase in the intake loss of the engine [7]. However, particle separator is used to takeoff and land and near ground operation stages with short operation time and poor air inlet conditions. During high-altitude cruise, the incoming flow is relatively clean, and it is necessary to ensure high total pressure recovery coefficient. In fact, the balance between aerodynamic performance and separation efficiency is the critical issues that affect and limit the performance of particle separators [8]. However, the compromise between multiple functions (air inlet and sand discharge) and different working conditions (take-off and cruise) may be found from the selection of geometrically fixed particle separator surface, which is unable to achieve the best performance in the whole working process. Herein an advanced deformable integral particle separator was developed to adjust the particle separator with extremely separating efficiency during takeoff and landing, and to minimize the loss of aerodynamic performance as possible during cruise (Figure 1).
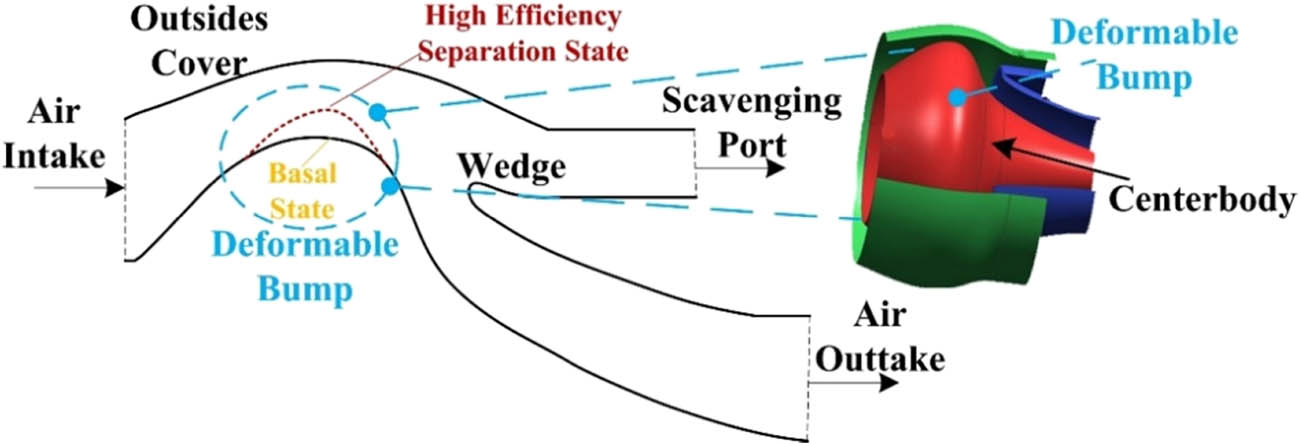
Structure of multi-condition deformable particle separator.
To make deformable geometric components, an appropriate amount of research works have been concentrated on exploring the deformable schemes. For instance, Boeing disclosed a design concept in his patent in which variable geometry particle separator was composed with deformable lower wall and movable diverter. The wall deformation was realized by memory alloy, worm, and laminated plate, and the axial movement of the diverter was driven by memory alloy and worm. The tail of the flexible layer was provided with tinier hole to eject air flow, the mainstream could be guided and adhered to the lower wall preventing flow separation, this method had great possibility and it was really easy to implement. Next a deformable flexible skin which was composed of memory alloy actuators and rubber matrix was proposed by Boeing’s Sampson program [9]. Afterwards, plenty of researchers have been working on investigating the specific implementation methods to realize the deformable scheme of geometric components mentioned above. Li et al. [10] further developed a variable centerbody technology based on special bump, which has good practicability and deformation effect. An adaptive bump scheme based on the deformation of memory alloy plate was proposed by Zhao et al. [11]; however, the issue of the shape variables remains a challenge, which can be concentrated on one dimension without the controllable deformation. In ref. [12], a pure mechanical and umbrella structure on the basis of centerbody deformation scheme was proposed. In this scheme, the mechanical displacement was used as the driving source. However, the skin surface is not smooth and continuous after deformation, and the pure mechanical structure leads to complex mechanism and increased weight.
Therefore, one critical issue that significantly poses an obstacle to the practical application of the particle separator is the ability to control the deformation of the centerbody available from the perspective of geometric position. In terms of technical maturity and controllability, flexible rubber materials can be chosen to realize deformation. Because of cord-reinforced rubber composites which consist of unidirectional cord reinforcement and rubber matrix can bear the dynamic loading and finite strain without obvious change in volume, these composites have been widely applied in tires, pneumatic springs, and transmission belts. Extensive efforts have been devoted to material characterization of cord–rubber composites in the past few decades. As early as the 1960s, Clark [13] and Gough [14] studied the mechanical properties of cord–rubber composites, and Ko and Sture [15] conducted three-dimensional (3D) experimental research on the linear elasticity and anisotropy of cord–rubber materials. Afterwards, the properties of single-layer cord–rubber composites were investigated by Parhizgar [16] and the properties of model materials were simulated via finite element analysis (FEA). Next the coupling effects of cord–rubber composites involving nonlinear and viscoelastic were studied by Clark and Dodge [17]. Moreover, the mechanical behavior of cord composite plates under uniaxial tension and pure bending were investigated by Shield and Costello [18,19], and the calculation formula of equivalent technical constant has been obtained. Particularly, the model was composed of several twisted filaments considering the structure of cord. Pidaparti [20] embedded the mentioned equation into a special type of FEA model, then the mechanical behavior of the cord–rubber composite can be analyzed and obtained under the torsional working conditions. Kocak and Pidaparti proposed an enhanced FEA model via the macro-mechanical modeling to obtain the influences of fiber shape on the mechanical properties of the rubber matrix composites [21]. Recently, this method has been applied in the structural design of tire successfully. For example, Walter applied composite materials theory in the investigation of multi-ply cord-reinforced rubber composites, specific to tires [22]. During the past few decades, the research regarding the tire behaviors went on apace using FEM. It has been developed based on the theory model in recent years, which has the advantages of low-cost, convenient, and comprehensive [23,24,25]. For instance, Levin built an advanced tire reinforcement model on the basis of the macro-mechanics method to calculate the equivalent mechanical properties of the cord–rubber composites [26].
Primarily, reinforcement BAR (“rebar”) elements were developed, which were suitable for analysis of the reinforced concrete, and then were adapted for analysis of rubber composites [27]. Previous work has proven that rebar model could play a positive role in predicting the tire behaviors [28,29,30,31], and it has been introduced to commercial finite element codes successfully, such as Abaqus and MSC Marc. Improvements have also been made in various aspects of rebar modeling. Meschke explored various hyperelastic formulas for rebar material, namely, two variants of neo-Hookean model and quadratic logarithmic model [32]. A novel subroutine was designed by TönüK to determine the angles of the cord within the 3D rebar elements [33], and the tire analysis can be performed precisely in MSC. Shen defined rubber as hyperelastic material element and then the method of neural network was proposed to fit rubber test data [34]. The cord was modeled as rebar element, and a simplified 3D FEA model of v-pulley contact mechanics was established. Cho proposed two equivalent cord models to simulate the behavior of cord models, one was modeled considering the solid element and truss element [35], the solid element and bilinear material characteristics were fully combined with another proposed model. Thus, the results of strain were obtained by the coupled model, which was composed of solid element cord model, rebar element cord model, and equivalent cord model. Furthermore, Tonatto established a FEA model on the basis of rebar element to represent cord behavior by fitting the crucial parameter [36], and it was found that the model exhibited great capability in precisely predicting the stress concentration in failure area.
Generally, an appropriate amount of research works mentioned above have been concentrated on cord–rubber composites of tires or air springs, to predict the stress distribution and strength failure. Few literature have focused on the application of cord–rubber composites to the centerbody of particle separator, it is vitally important to analyze and obtain the deformation characteristics. Herein an advanced coupled model of deformable centerbody was proposed to predict its deformed behavior in this article. By comparing the simulation results with the experimental data, the model was found to perform with high reliability and accuracy, demonstrating the great capability in precisely predicting the mechanical characteristics of the deformable centerbody under practical working environments.
2 Experimental work
2.1 Test specimens
To establish the finite element model of rubber matrix and cord–rubber composite, respectively, the material parameters of the rubber matrix and cord reinforcement phase should be obtained [37]. In this article, natural rubber is used as the matrix material, and nylon cord is applied to the reinforcement material. Dumbbell-shaped specimens are used for rubber matrix, as proposed in Figure 2(a). The cross-section of length, width, and thickness of the rubber specimen are 35, 6, and 2 mm, respectively. Furthermore, the dimensions of length, width, and thickness of the cord–rubber composite specimen are 150, 25, and 3 mm, as shown in Figure 2(b).

(a) Dumbbell-shaped rubber specimen and (b) cord–rubber composite specimen.
2.2 Tensile testing machine
The electronic tensile testing machine was controlled by CMT5105 computer to perform uniaxial tensile test of rubber specimens and cord–rubber composite specimens, as shown in Figure 3(b). The maximum load of the testing machine was 5 kN and the ambient temperature was 25°C. The clamping device is adopted at both ends of the test piece to keep the clamping stability without displacement, and to keep the force direction of the specimens along the axis. The environmental parameters and test parameters of the testing machine are set, and the loading method of displacement control is adopted.
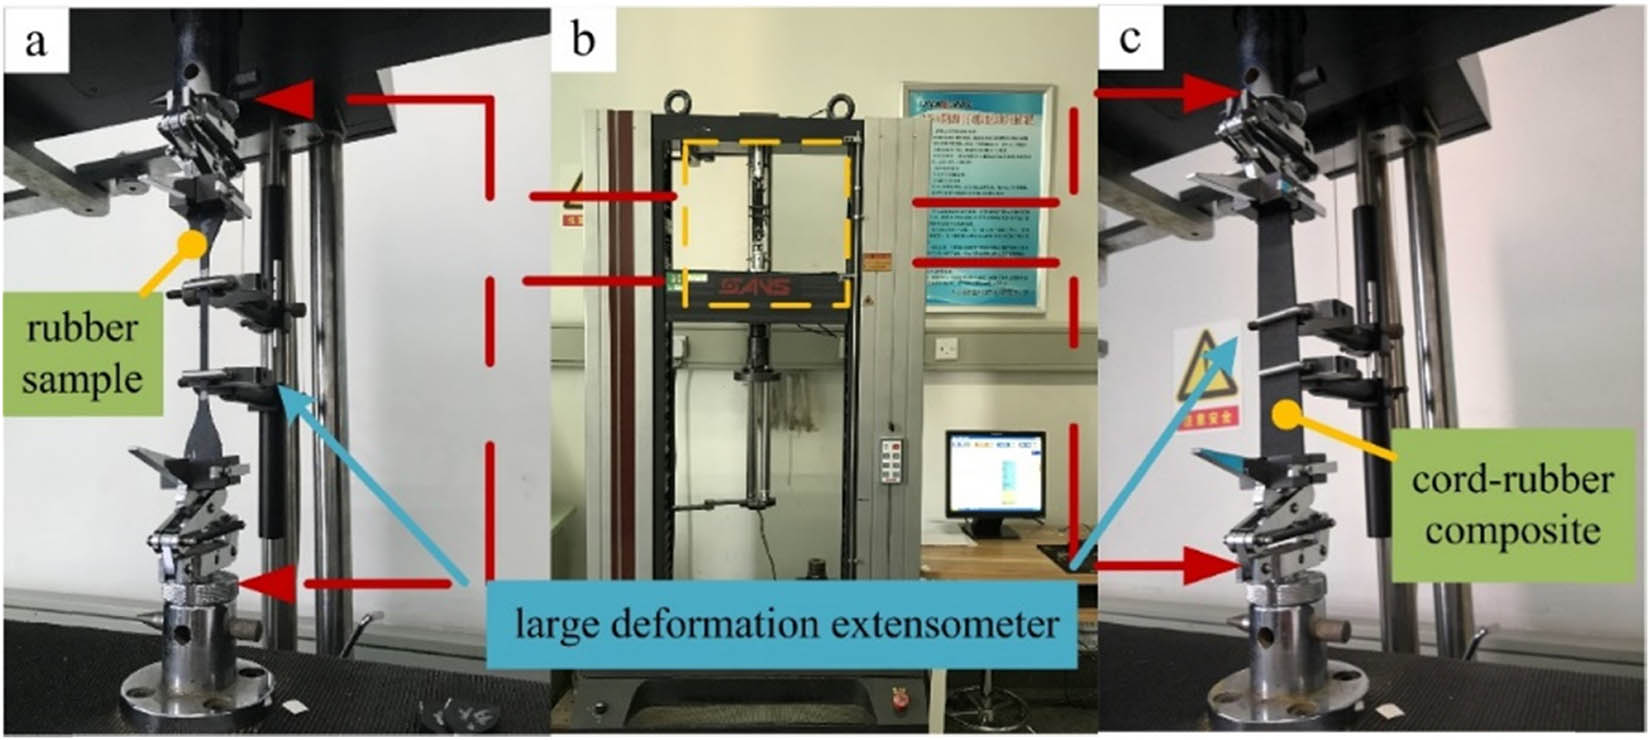
(a) Rubber tensile test, (b) tensile testing machine, and (c) cord–rubber composite tensile test.
In order to eliminate the influence of Mullins effect on the test results, the samples were pretreated, i.e., repeated loading-unloading cycles were carried out, with 5 mm displacement each time, until the final cycle curve was basically the same. The tensile rates of rubber specimens and cord–rubber composite specimens are different, the measured tensile rate of rubber is 500 mm/min, and that of the cord–rubber composites is 10 mm/min. During the test, the large deformation extensometer, as demonstrated in Figure 3(a and c), is used to collect the test data of the specimens, and the force sensor recorded the data in real time.
2.3 Schlieren optical system
Schlieren system is used to observe the displacement of centerbody under different pressures. It is mainly composed of several components involving digital camera, imaging lens, slit, mirror, iris, and light source. The principle of schlieren system is illustrated in Figure 4. The function of Schlieren is to provide a beam of parallel light through the measured object, which is projected into a concave mirror to converge it, and then guided into the camera image through a plane mirror and slit. During the experiment, to obtain the changes in the actual profile before and after the deformation of bump, a high-speed high-resolution camera was used to record the image of the bump, and the profile of the deformable bump under each pressure was recorded.

Schematic of Schlieren optical system.
During the experimental test, the pressure of the bump was determined through the barometer, and every 0.1 MPa increase was recorded.
3 Material properties
3.1 Mechanical properties of rubber
Rubber is considered as a hyperelastic material, because it is volumetrically incompressible. A strain energy function can be used to describe the mechanical properties of rubber. Natural rubber is typically nonlinear, here the hyperelastic constitutive model is chosen to characterize the rubber material.
3.1.1 Constitutive model of rubber material
For rubber materials, there are several constitutive models that can be applied to represent the hyperelastic properties of rubber materials, including neo-Hookean model, Mooney–Rivlin model, and Yeoh model and the constitutive relationship of rubber materials can be described precisely [38,39]. The Mooney–Rivlin model is selected for the prediction of rubber behavior in our study, because it can adequately describe the mechanical behavior of the rubber material when the deformation is within 150%, which is expressed as equation (1):
And the function of the strain energy is given as following
where I 1, I 2, and I 3 are the first, second, and third principal invariants of the right Cauchy–Green deformation tensor, respectively. And λ 1, λ 2, and λ 3 represent the stretch ratio of the three principal directions of the material, and C represents the right Cauchy–Green strain tensor. Thus, the Mooney–Rivlin model of incompressible rubber material is given:
where, C 10 and C 01 are the Rivlin coefficients, which can be determined from the experimental data on the uniaxial tension.
3.1.2 Rubber parameter fitting
According to the analysis of the test data, the fitting stress–strain curve of the rubber can be obtained, which is presented in Figure 5.
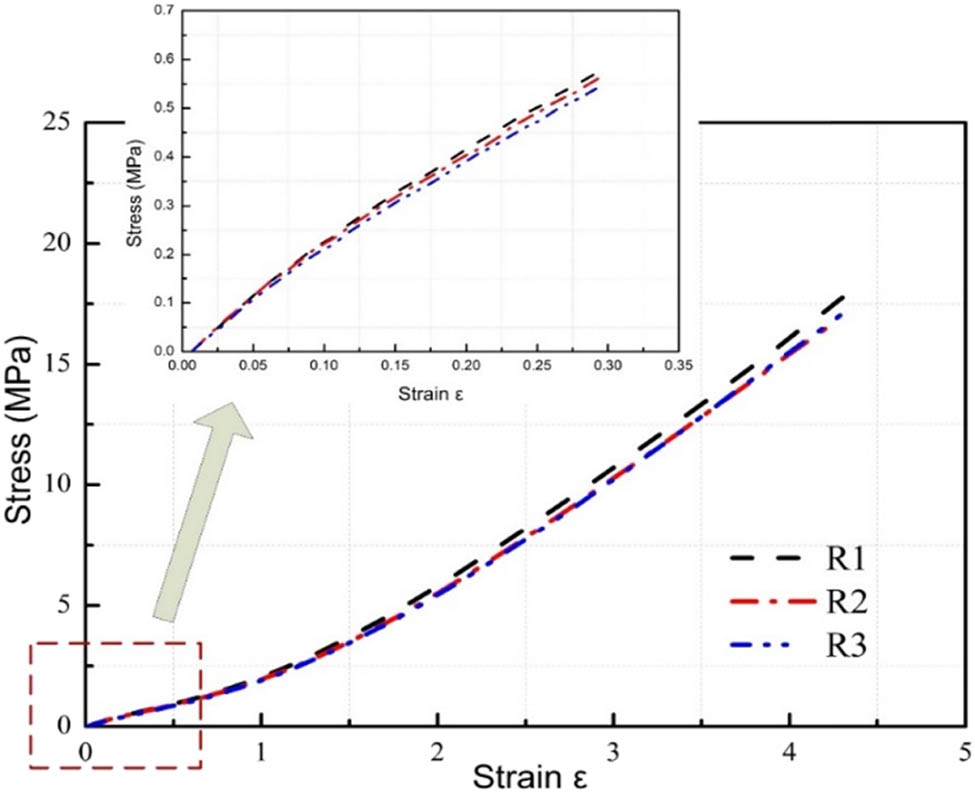
Stress–strain curve of rubber.
The stress–strain data of rubber material are obtained by processing the test data with large deformation incompressible method. The results show that the stress–strain curve of rubber is nonlinear as a whole. Clearly, it can be divided into four obvious deformation stages. First, the mechanical properties of rubber are basically linear elasticity within the strain range of 20%. Then, the stiffness of rubber is strengthened in the strain range of 20–80%, with the increase in the tensile strain (presented phase II). Furthermore, in the process of 80% strain to the final fracture, there is an obvious strengthening stage of rubber stiffness. Finally, the destruction of rubber fracture is instantaneous. According to the dispersibility of the test, the initial test results of the tensile deformation are greatly accurate which depends on the small dispersibility and stable test results.
Moreover, the rubber specimens which are marked as R1, R2, and R3 were tested by tensile experiment. The resulting stress–strain curve of the experiment is presented in Figure 5, it indicates that the phenomenon of tensile strain fracture appeared between 440 and 500%, the corresponding stress range is presented between 15 and 20 MPa. This means that the specimens have maintained the same tensile strength.
Because the deformation of bump varies within 20%, origin is used to fit the 20% stress–strain data of rubber, and the least square method is adopted to get the undetermined material constant of the model. Additionally, the C 10 = 0.42 and C 01 = 0.03 can be obtained from the uniaxial tensile test of rubber in 20% strain range, and the fitting value of material parameters for Mooney–Rivlin constitutive model is obtained. Furthermore, the results of stress–strain curve by experiments and FEM is illustrated in Figure 6. Obviously, the simulated results are consistent with the experimental situations, and the reliability of the proposed model is further validated within the 20% strain range of rubber.
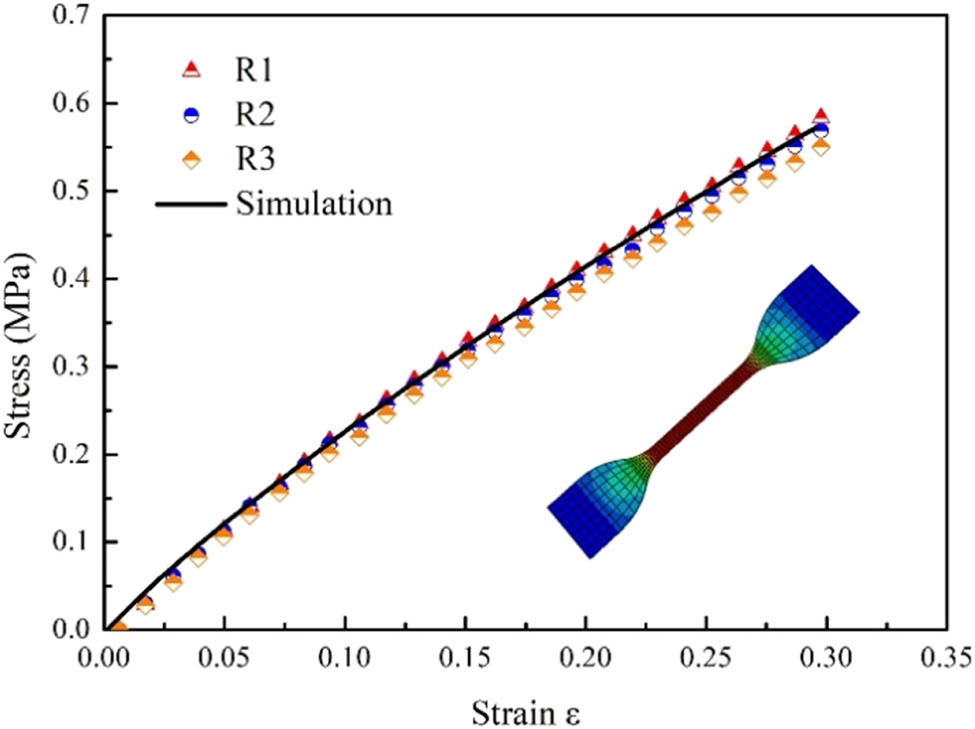
Stress–strain curve of experiments and FEA results.
3.2 Mechanical properties of cord–rubber composite
The cord–rubber composite FEA model with 0° and 90° are proposed by the rebar element analysis method, which is to analyze the mechanical properties of the specimens under uniaxial tension. Particularly, the eight-node hexahedral C3D8R solid element was used to establish the model of the rubber layer, and the rebar element can be meshed by four-node quadrilateral SFM3D4R surface element. Moreover, a rectangular solid rubber unit is established in the component module. Therefore, the FEA model of cord–rubber composite is presented in Figure 7. Additionally, to ensure the consistency of boundary constraint between simulation and testing, the left margin is set to be fixed and the right part is set as free accordingly. Furthermore, the mesh of FEA model was refined in the Experimental section.

FEA model of cord–rubber composite.
The simulated results of cord–rubber composite mechanical behaviors are compared with the measured data under vertical and transverse tension within 20% strain, which are presented in Figure 8. Clearly, the stress–strain curve of 0° cord–rubber composite is presented as an approximate linear relationship, and the mechanical behaviors of the composite materials are mainly determined by the cord, whose laying angle is set as 0°. As the main carrier, the cord is generally regarded as linear elastic, thus the stress–strain curve of the composite materials is presented as a linear relationship approximately. At 90° composite tension, the main carrier shifts to the rubber, and there is a certain similarity in the curve shape and strength. At the same time, rebar element is selected to simulate the model, and the simulated results are consistent with the experimental data, which further supports the practicability of rebar element in the modeling.
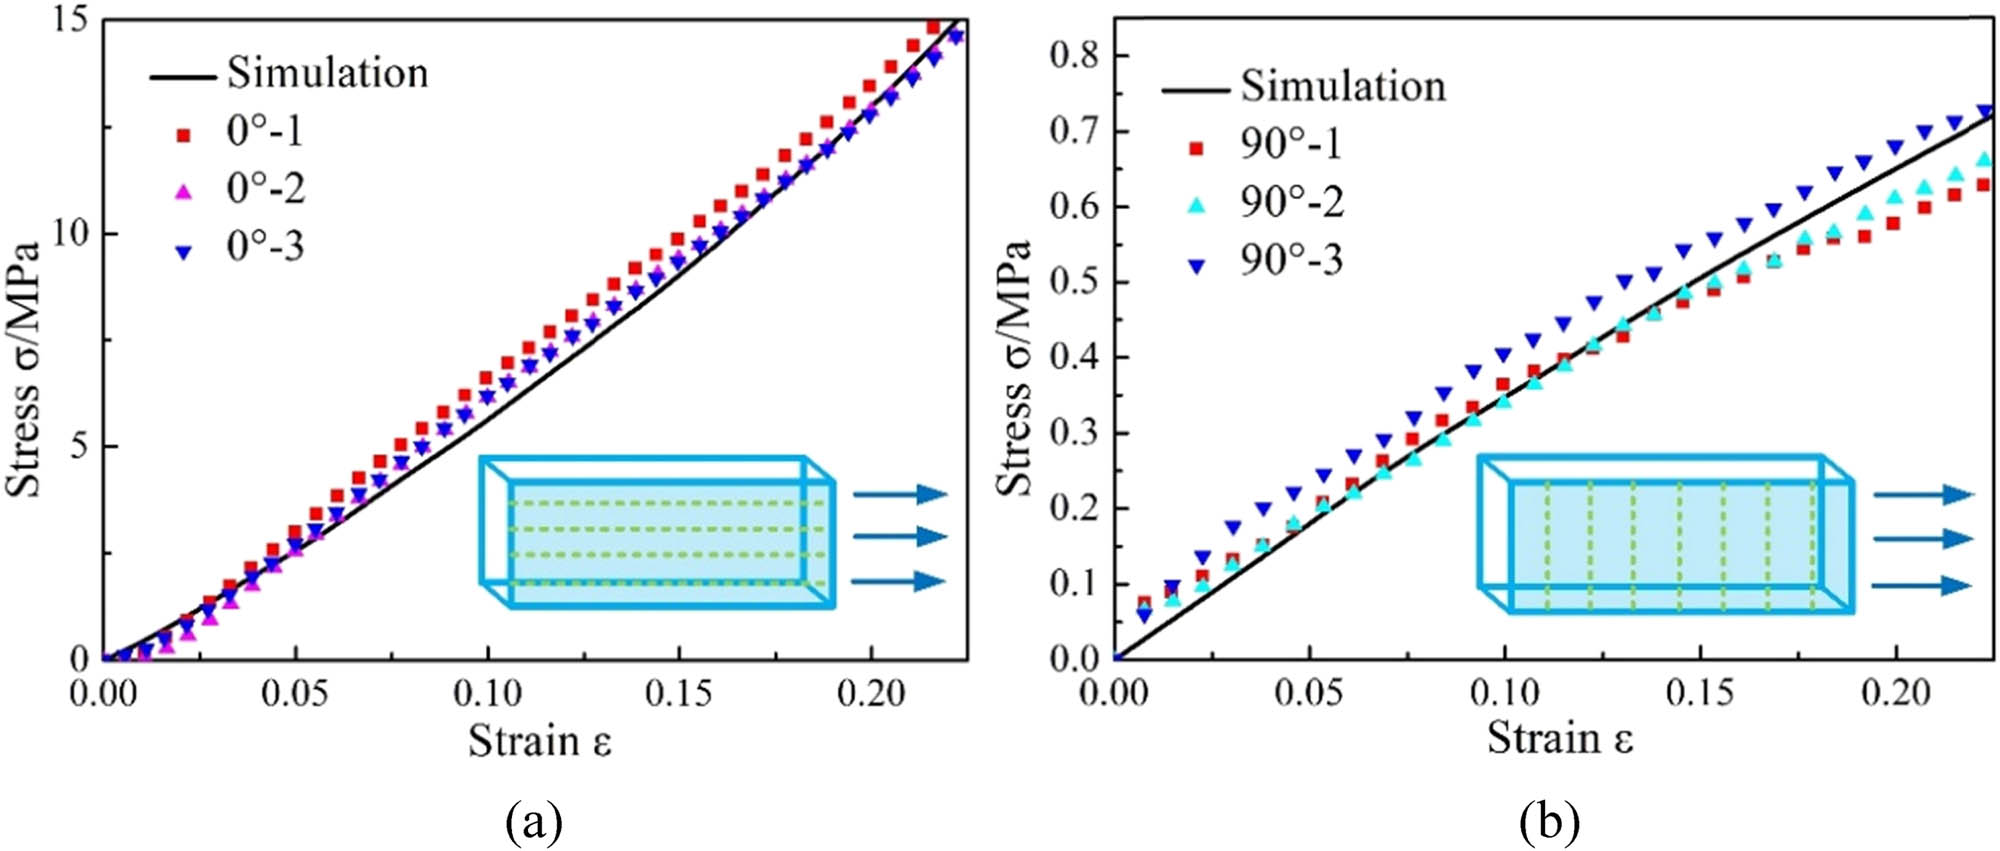
Uniaxial tension of cord–rubber composite: (a) stress–strain curve of vertical tension and (b) stress–strain curve of transverse tension.
4 Analysis of deformation characteristics of bump
4.1 FEA model of bump
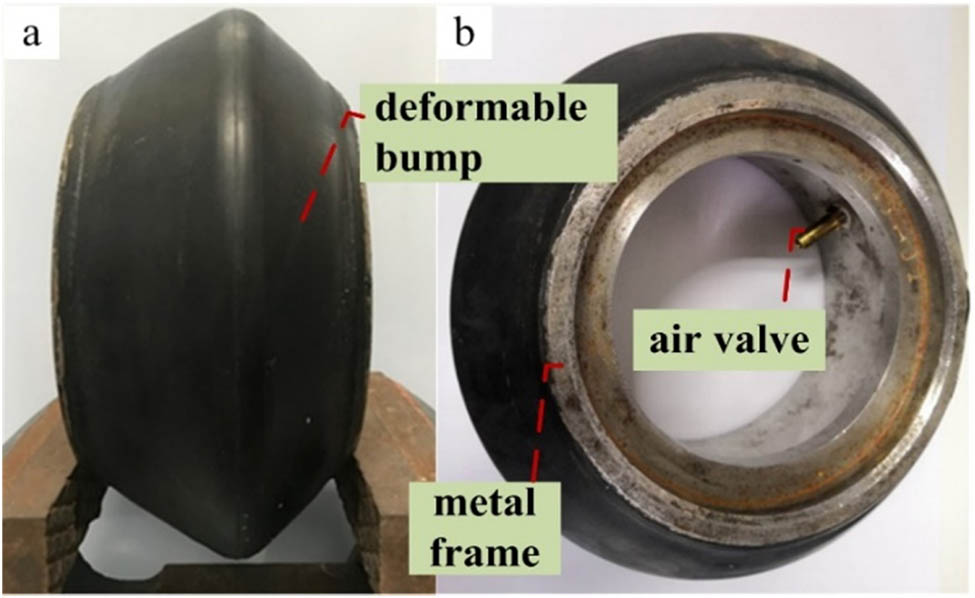
The centerbody is mainly composed of two parts, including the deformable bump made of cord–rubber composite and the metal frame, which is presented in Figure 9. In this article, under the assumption of the metal frame as rigid body, it does not change with displacement but only the change in the bump of flexible layer is considered in the finite element simulation. The relationship between the flexible bump and the internal pressure should be considered during the process of modeling to obtain the deformation characteristics of the bump, it is necessary to simulate the effect of different pressures on the bump.

FEA model of bump.
The flexible layer of bump is composed of rubber and cord, the material tests of rubber and fiber are completed, and the parameters of Mooney–Rivlin constitutive model of rubber material and the elastic modulus of cord are fitted, as shown in Table 1. The cord layer is simulated by rebar element and embedded in the bump through built-in area. The matrix of the flexible layer is rubber material and the skeleton is fiber.
Material parameters of bump
| Material | Parameters | Parameters |
|---|---|---|
| Rubber | C 10 = 0.42 MPa | C 01 = 0.03 MPa |
| Cord–rubber composite | E = 939.56 MPa | v = 0.3 |
4.2 Analysis of continuous controllable deformation of centerbody
The key indicators, which are given as the maximum deformation height of the bump and deformation profile of the centerbody, are proposed to characterize the deformation performance of the bump. Through literature research [40,41], it is found that the two key elements which influenced the continuous controllable deformation are focused on filling pressure and cord angle. In this article, the method of control variables is applied to explore the deformable behaviors of the bump and to analyze the influence of different factors on the deformation of the bump.
4.2.1 Different pressures
In the process of studying the deformation of pressure on the bump, it is assumed that the cord parameter is nylon fiber, usually the spacing of nylon cord is 0.65 mm and the laying angle of the cord is 60° and the deformation behavior of the bump is studied under different pressures of 0.2–0.6 MPa. The node coordinates of the deformable bump under several different pressures are given in Table 2.
Coordinates of maximum deformation height points of bump under different pressures
| Pressure (MPa) | L (mm) | H (mm) |
|---|---|---|
| 0 | 45.53 | 83.75 |
| 0.2 | 40.60 | 84.02 |
| 0.3 | 40.56 | 84.52 |
| 0.4 | 40.53 | 85.07 |
| 0.5 | 40.52 | 85.67 |
| 0.6 | 40.52 | 86.31 |
The gas pressure was applied to the inner surface, and the discrete points of the bump profile were obtained by using the method of node coordinate output. Furthermore, the deformable profile of the bump was obtained by fitting the discrete points with high order. When the pressure is 0 MPa, the maximum height of the initial profile is 83.75 mm, and the corresponding X coordinate is 45.53 mm. The curve is an asymmetric profile, and the left side is relatively flat and the right side is steep. When the pressure is 0.2 MPa, the stiffness of cord–rubber material is overcome. The asymmetrical surface approaches the equilibrium state, and the coordinate is L = 40.52 mm. At the range from 0.2 to 0.6 MPa, the deformation surface has changed in the direction of height and remains at L = 40.52 mm, which is presented as a symmetrical surface with the increase in the gas pressure.
The black line of the coordinates of points extracted by ABAQUS was the initial profile, and the deformable profile is demonstrated in Figure 10 during the different working conditions including 0.2, 0.3, 0.4, 0.5, and 0.6 MPa. Obviously, it can be seen that the deformation height of bump grows linearly with the increase of pressure. Additionally, from the deviation of the maximum height point, increasing the air pressure load will induce rising the bump profile which tends to be symmetrical.
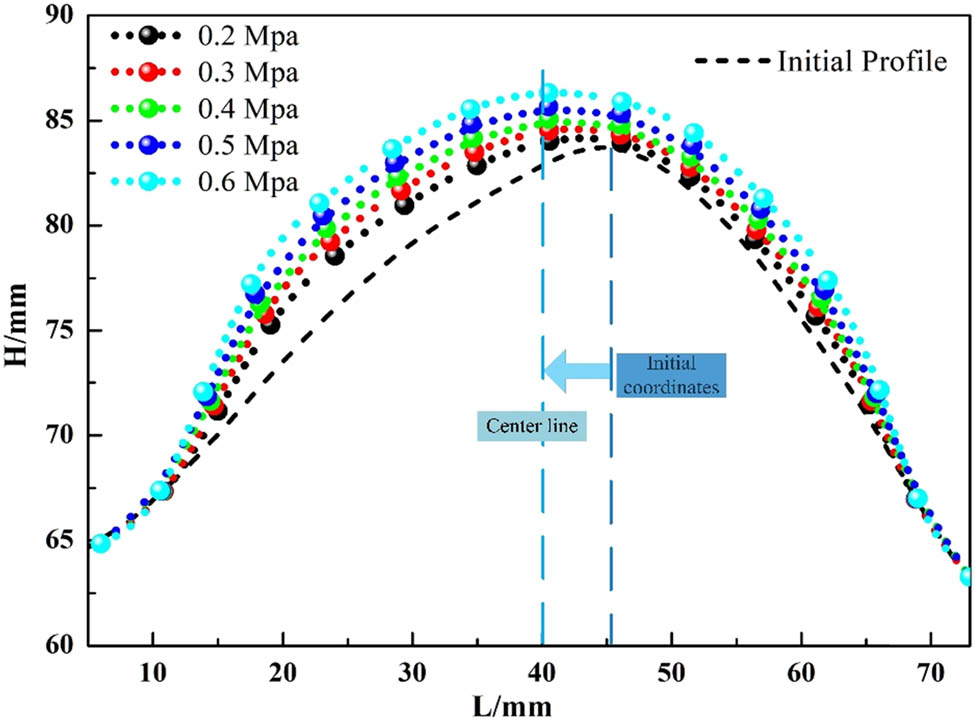
Bump profile under different pressures.
4.2.2 Laying angle
The influence of cord angle on the deformable bump is studied in this section. The laying angle is the included angle formed by the first layer and the second layer. The spacing between cord lines should be maintained at 0.65 mm, as well as the cord. The results of maximum deformation height points of the centerbody with different angles are illustrated in Table 3.
Coordinates of maximum deformation height points of centerbody at different angles
| Cord angle (°) | L (mm) | H (mm) |
|---|---|---|
| 30 | 40.53 | 85.01 |
| 45 | 40.53 | 85.16 |
| 60 | 40.64 | 85.40 |
| 72 | 40.52 | 85.66 |
| 90 | 40.52 | 86.17 |
| 120 | 40.52 | 87.32 |
It can be found that the cord angle had evident effect on the deformation height of the bump. Increasing the cord angle will result in the increment in the expansion height of the bump. The phenomenon can be explained by the fact that the elongation of cord is certain (about 10%), and an increasing the laying angle can induce a greater deformation. Similarly, increasing cord angle will induce rising the deformation of the bump as well.
It can be seen from Figure 11 that even if the cord angles are different, the final profile of the bump after inflation still tends to be symmetrical.
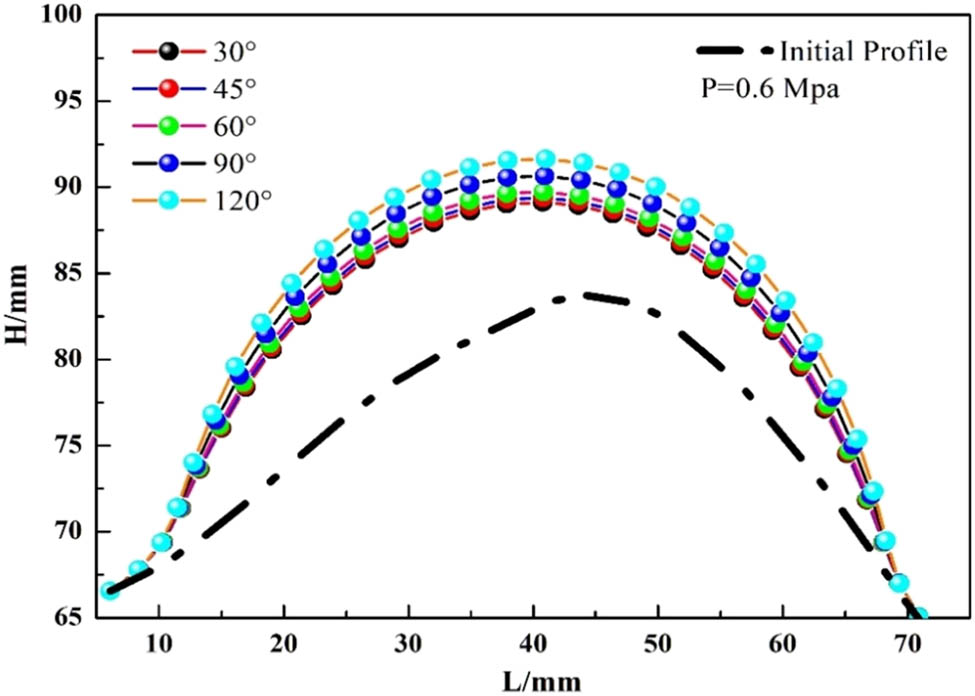
Bump profile under different cord angles.
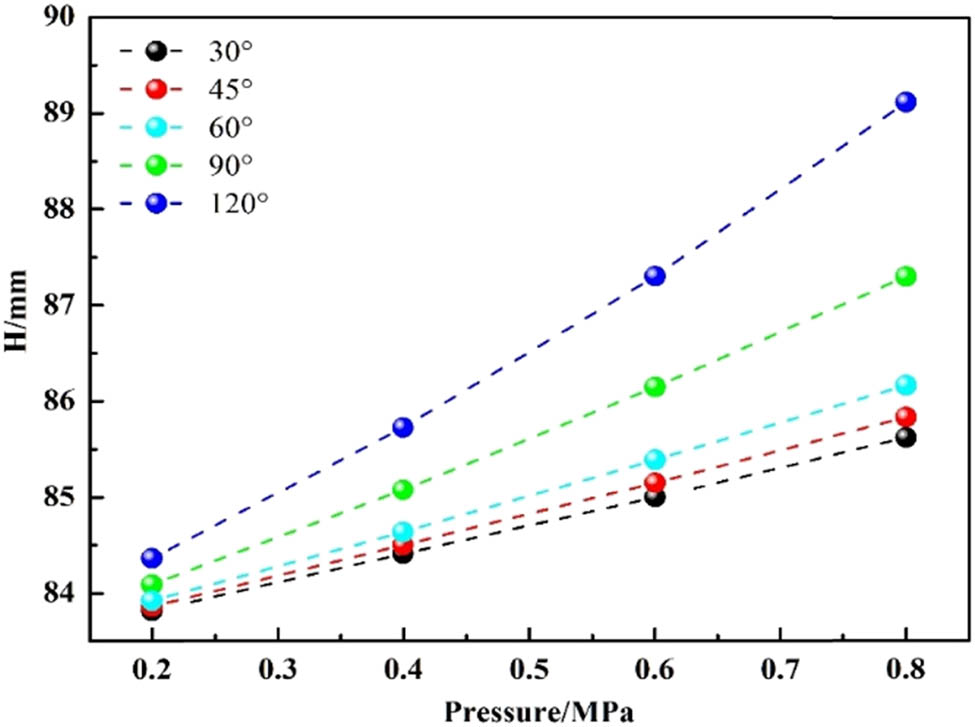
In addition, FEA was carried out for the bump by different laying angles including 30, 45, 60, 90, and 120°, and the different pressures were selected to simulate involving 0.2, 0.4, 0.6 and 0.8 MPa. Then, the deformation behaviors of the bump were analyzed, and the working conditions were explained as mentioned above. Therefore, the maximum deformation height of the outer profile of the bump was extracted, which is presented in Table 4.
Maximum deformation heights of bump at different angles under different pressures
| P (MPa) | 30°H (mm) | 45°H (mm) | 60°H (mm) | 90°H (mm) | 120°H (mm) |
|---|---|---|---|---|---|
| 0.2 | 83.84 | 83.88 | 83.93 | 84.11 | 84.37 |
| 0.4 | 84.41 | 84.50 | 84.64 | 85.09 | 85.74 |
| 0.6 | 85.01 | 85.16 | 85.40 | 86.17 | 87.32 |
| 0.8 | 85.63 | 85.85 | 86.20 | 87.31 | 89.12 |
Obviously, increasing the laying angle will result in the increment in the deformation height of the bump, and the factor of pressure was not considered herein. Similarly, increasing the pressure will induce rising the height of the bump by taking into account the pressure without the laying angle.
As presented in Figure 12, it depicts the relationship between pressures and maximum deformation height of bump with different cord angles. Clearly, the maximum deformation height of the bump grows linearly with the increase in the pressure. Similarly, the maximum deformation height changes rapidly with the increase in the laying angle, and the phenomenon mentioned above may indicate that the increase in the angle can make the deformation height more sensitive than increase in the pressure.
Relationship between pressures and maximum deformation height of bump at different cord angles.
The variation curve of the maximum deformation height of the bump with the cord angle under different pressures is depicted in Figure 13. The maximum height presents a parabolic shape with the increase in the angle. Meanwhile, it can be found that the maximum deformation height increases with a quadratic function as the increasing angle, and the corresponding expression and correlation coefficient are given in Table 5.
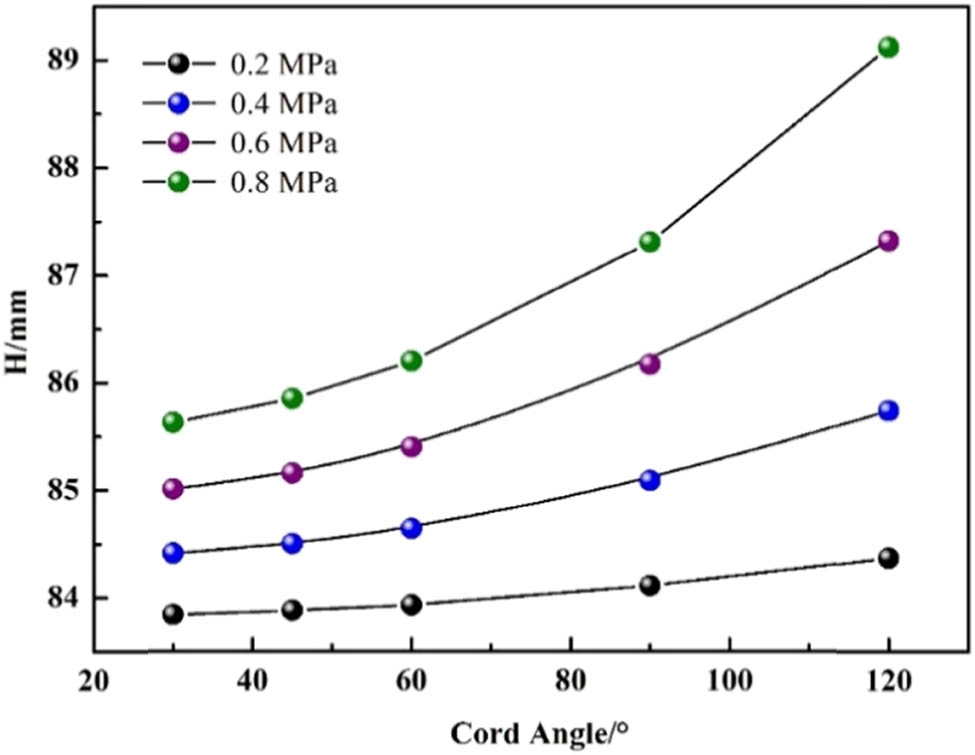
Relationship between maximum deformation height and laying angle under different pressures.
Function expression of maximum deformation height and angle under different pressures
| Pressure (MPa) | Fitting formula | Correlation coefficient (%) |
|---|---|---|
| 0.2 | H = 0.00005α 2 − 0.0012α + 83.834 | 99.99 |
| 0.4 | H = 0.0001α 2 − 0.0027α + 84.385 | 100 |
| 0.6 | H = 0.0002α 2 − 0.0060α + 85.001 | 100 |
| 0.8 | H = 0.0003α 2 − 0.0013α + 85.726 | 99.98 |
4.2.3 Experimental verification
Aiming to further validate the validity and accuracy of FEA model, the physical model of the centerbody is proposed in Figure 14, and the Schlieren testing is used to obtain the deformation behavior of the bump under operating conditions as presented in Figure 15. Particularly, the initial barometer value is zero due to the non-inflatable shape, then it can record and display the shape of the centerbody with increasing pressure in real time, which is presented in Figure 15(a). The inflation pressure value is set to 0.2, 0.4, and 0.6 MPa, and the deformed behaviors of the centerbody are displayed by the real time Schlieren photographs, which are presented in Figure 15(b–d), respectively.
Physical model of centerbody. (a) Front view; (b) side view.
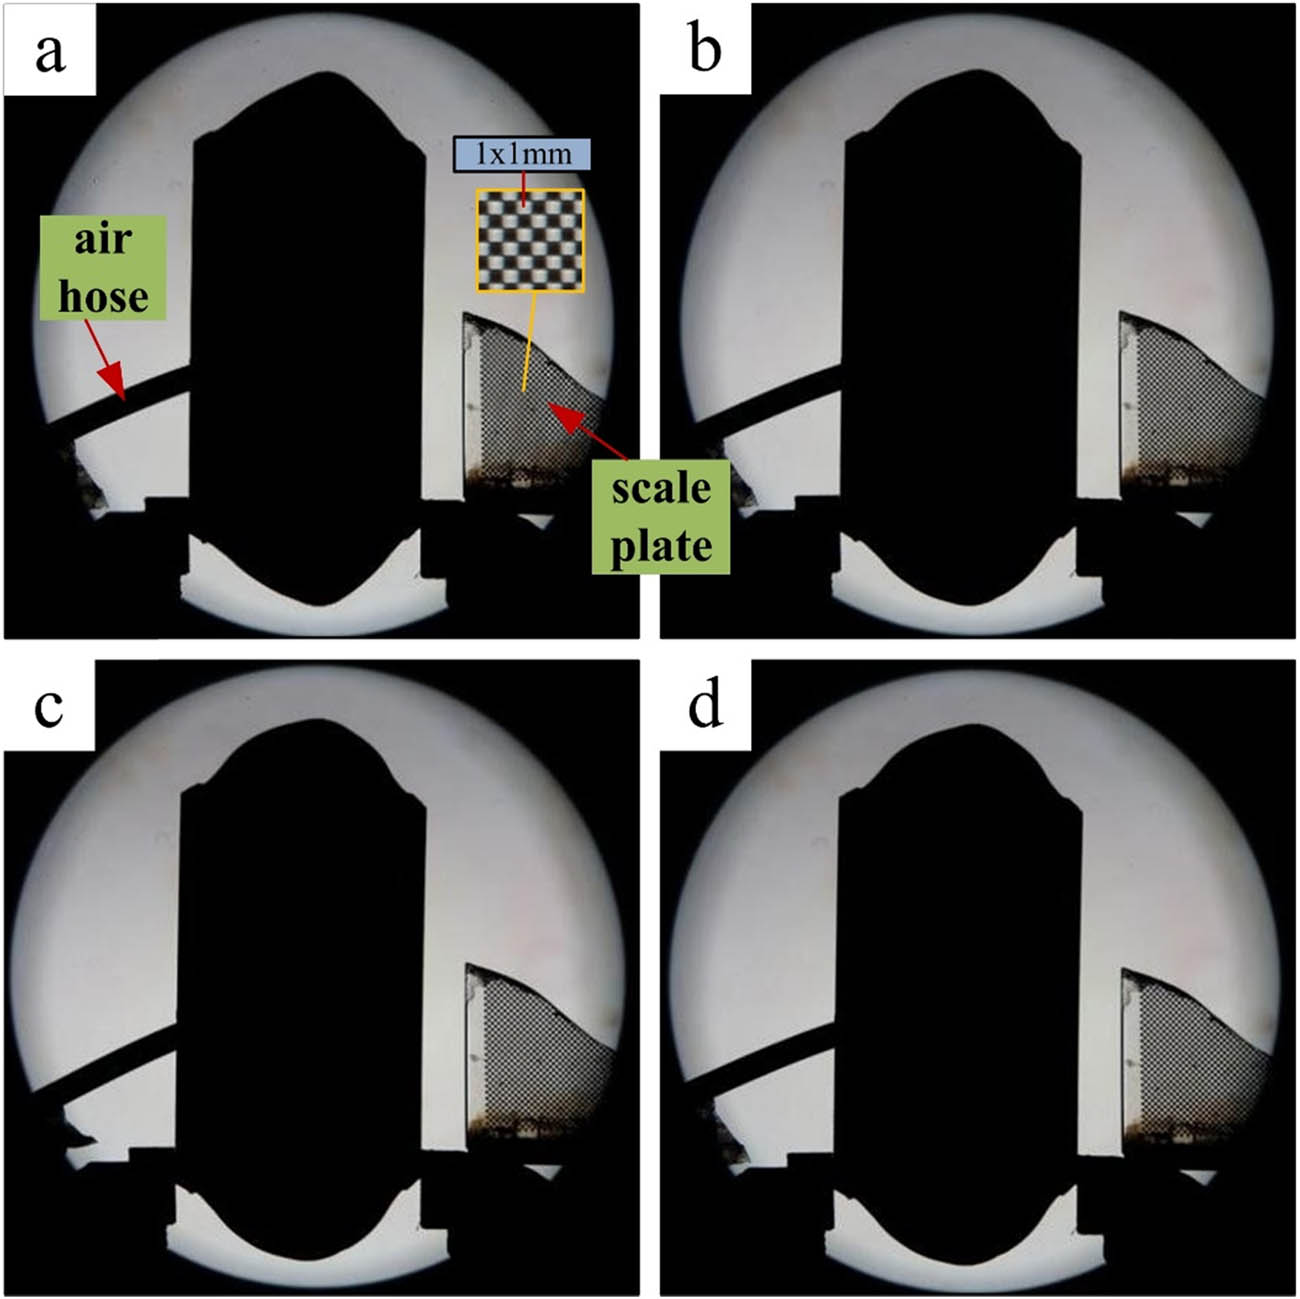
Schlieren photograph of centerbody. (a) Initial profile; (b) 0.2 MPa bump profile; (c) 0.4 MPa bump profile; (d) 0.6 MPa bump profile.
The FEA model of the bump is established, the value of thickness is set to 5 mm, and the material parameters are obtained through tensile test mentioned above. To make the correspondence with testing specimen, the cord angle of FEA bump model is selected as 38°, and identically the simulated working pressures are similar to testing conditions, including 0.2, 0.4, and 0.6 MPa.
During modeling the FEA model of the centerbody using Abaqus, the outer surface coordinate points are extracted and is compared with the outer surface coordinate points of the centerbody measured by the Schlieren system, which is shown in Figure 16. In the figure, the effects of different pressures on the bump deformation are compared. Clearly, there exists some deviations between the experimental and simulated results; however, the deviations are greatly small, resulting in acceptable relative errors. It implies that the proposed FEA model of the centerbody is reasonable and reliable, which can be implemented to investigate the deformation behaviors.
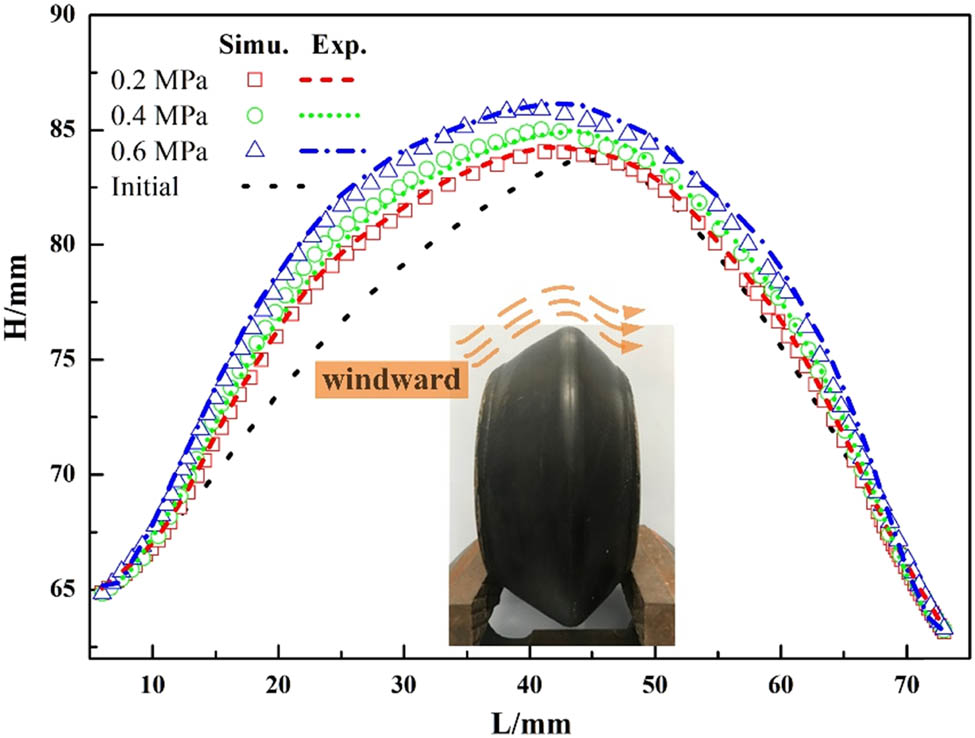
Comparison of test and simulation under different pressures.
From Figure 16, the deformation of the bump measured by Schlieren test under different pressures is in great agreement with the simulation results. The measuring points of the experimental curve are basically distributed around the simulation curve, which verifies the accuracy of the bump research based on the rebar element analysis method.
It can be found that the windward on the left side of the bump is smoother, which can ensure good aerodynamic performance in high-speed cruising state. The deformation of the bump presents a gradual increment with the increase in the pressure; however, the deformation of the bump is of symmetrical shape when the pressure reached maximum. Additionally, reaching the highest point, the throat area of the inlet narrows and the windward surface becomes higher, which is conducive to the rebound of sand particles, improving the separation efficiency, and realizing the deformation concept of the centerbody.
5 Conclusion
In this article, a design concept of centerbody of variable particle separator was proposed. According to the requirements of the inlet under different working conditions, the FEA model was established to study the factors affecting the bump deformation. First, the material parameters were fitted by the tensile experiment, and the influence of different pressures and angles on the bump were analyzed using the control variable method. It was found that the pressure and angle have a certain regular influence on the deformation characteristics of the centerbody. The obtained results were summarized as follows: the maximum deformation height of the bump grows linearly with the increase in the pressure. Similarly, the maximum deformation height changes rapidly with the increase in the laying angle, this shows that the increase in the angle can make the deformation height more sensitive than the increase in the pressure. Finally, the accuracy of the simulation analysis is verified by experiments, which provides a good analysis means for the proposed design concept.
Acknowledgment
This work was supported by National Science and Technology Major Project (2017-IV-0007-0044).
-
Funding information: National Science and Technology Major Project (2017-IV-0007-0044).
-
Conflict of interest: Authors state no conflict of interest.
References
[1] van der Walt JP, Nurick A. Life prediction of helicopter engines fitted with dust filters. J Aircraft. 2012;32(1):118–23.10.2514/3.46691Search in Google Scholar
[2] Stallard P. Helicopter engine protection. Perfusion. 1997;12(4):263–7.10.1177/026765919701200410Search in Google Scholar PubMed
[3] Filippone A, Bojdo N. Turboshaft engine air particle separation. Prog Aerosp Sci. 2010;46(5–6):224–45.10.1016/j.paerosci.2010.02.001Search in Google Scholar
[4] Hamed A. Particle Dynamics of Inlet Flowfields with Swirling Vanes. J Aircraft. 1982;19(9):701–12.10.2514/3.61548Search in Google Scholar
[5] Saeed F, Al-Garni AZ. Analysis method for inertial particle separator. J Aircraft. 2007;44(4):1150–8.10.2514/6.2006-14Search in Google Scholar
[6] Barone D, Loth E, Snyder P. A 2-D inertial particle separator research facility. AIAA Paper; 2012. p. 2012–329010.2514/6.2012-3290Search in Google Scholar
[7] Hamed A, Tabakoff W, Wenglarz R. Erosion and deposition in turbomachinery. J Propul Power. 2006;22(2):350–60.10.2514/1.18462Search in Google Scholar
[8] Calzada PDL, Vazquez R, Fernandez F, Segundol MPS. Particle Dynamics Simulation for Aeroengine Intake Design; 1999. p. 1–7.Search in Google Scholar
[9] Pitt D, Dunne J, White E, Garcia E. SAMPSON smart inlet SMA powered adaptive lip design and static test. AIAA Paper, AIAA-01-1359. p. –200110.2514/6.2001-1359Search in Google Scholar
[10] Li C, Tan H, Wang Dp. Influence of secondary flow injection angle on a fluidic shock control technique. J Propul Power. 2015;31(2):674–84.10.2514/1.B35370Search in Google Scholar
[11] Zhao P, Qiu J, Ji H, Wang M, Rui N. Modeling and numerical analysis of a three-dimensional shape memory alloy shell structure. 3rd International Conference on Smart Materials and Nanotechnology in Engineering. Vol. 840914; 2012.10.1117/12.923553Search in Google Scholar
[12] Sauder J, Chahat N, Thomson M, Hodges R, Peral E, Rahmatsami Y. Ultra-compact Ka-Band parabolic deployable antenna for RADAR and interplanetary CubeSats. AIAA Paper, SSC15-VI-7; 2015. p. 20170008200Search in Google Scholar
[13] Clark SK. A Review of cord–rubber elastic characteristics. Rubber Chem Technol. 1964;37(5):365–89.10.5254/1.3540404Search in Google Scholar
[14] Gough VE. Stiffness of cord–rubber characterization. Rubber Chem Technol. 1968;41(4):988–1021.10.5254/1.3547240Search in Google Scholar
[15] Ko HY, Sture S. Three-dimensional mechanical characterization of anisotropic composites. J Compos Mater. 1974;8(2):178–90.10.1177/002199837400800206Search in Google Scholar
[16] Parhizgar S. Determination of stiffness properties of multi-ply cord–rubber composites. Tire Sci Technol. 1989;17(17):201–16.10.2346/1.2141685Search in Google Scholar
[17] Clark SK, Dodge RN. Nonlinear cord–rubber composites. Tire Sci. Technol. 1990;18(3):191–200.10.2346/1.2141699Search in Google Scholar
[18] Shield C, Costello G. The effect of wire rope mechanics on the mechanical response of cord composite laminates: an energy approach. J Appl Mech. 1994;61(1):9–15.10.1115/1.2901428Search in Google Scholar
[19] Shield CK, Costello GA. Bending of cord composite plates. J Eng Mech. 1994;120(4):876–92.10.1061/(ASCE)0733-9399(1994)120:4(876)Search in Google Scholar
[20] Pidaparti R. Analysis of cord–rubber composite laminates under combined tension and torsion loading. Compos B Eng. 1997;28(4):433–8.10.1016/S1359-8368(96)00064-9Search in Google Scholar
[21] Kocak RPS. Three-dimensional micromechanical modeling of cord–rubber composites. Mech Compos Mater Struct. 2000;7(1):19–34.10.1080/107594100305401Search in Google Scholar
[22] Walter J, Avgeropoulos G, Janssen M, Potts G. Advances in tire composite theory. Tire Sci Technol. 1973;1(2):210–50.10.2346/1.2167165Search in Google Scholar
[23] Ridha R. Computation of stresses, strains, and deformations of tires. Rubber Chem Technol. 1980;53(4):849–902.10.5254/1.3535065Search in Google Scholar
[24] Ridha RA, Theves M. Advances in tyre mechanics. Tire Sci. Technol. 1995;23(1):68–9.10.2346/1.2137497Search in Google Scholar
[25] Hu C, Gao J, Song X, Zhang M, Tan X. Analytical modeling and DEM analysis of soil–wheel interaction under cornering and skidding conditions in off-road vehicles. AIP Advances. 2021;11:085122.10.1063/5.0057046Search in Google Scholar
[26] Levin V, Zingerman K, Vershinin A, Yakovlev MY. Numerical analysis of effective mechanical properties of rubber-cord composites under finite strains. Compos Struct. 2015;131(1):25–36.10.1016/j.compstruct.2015.04.037Search in Google Scholar
[27] Helnwein P, Liu CH, Meschke G, Mang HA. A new 3-D finite element model for cord-reinforced rubber composites-application to analysis of automobile tires. Finite Elem Anal Des. 1993;14(1):1–16.10.1016/0168-874X(93)90075-2Search in Google Scholar
[28] Kabe K, Koishi M. Tire cornering simulation using finite element analysis. Appl Polym Sci. 2000;78(8):1566–72.10.1002/1097-4628(20001121)78:8<1566::AID-APP140>3.0.CO;2-ISearch in Google Scholar
[29] Korunović N, Trajanović M, Stojković M. FEA of tyres subjected to static loading. Serbian Soc Comput Mech. 2007;1(1):87–98.Search in Google Scholar
[30] Meschke G, Payer HJ, Mang HA. 3D simulations of automobile tires: material modeling, mesh generation, and solution strategies. Tire Sci Technol. 1997;25(3):154–76.10.2346/1.2137538Search in Google Scholar
[31] Kondé AK, Rosu I, Lebon F, Brardo O, Devésa B. On the modeling of aircraft tire. Aerosp Sci Technol. 2013;27(1):67–75.10.1016/j.ast.2012.06.008Search in Google Scholar
[32] Meschke G, Helnwein P. Large-strain 3D-analysis of fibre-reinforced composites using rebar elements: hyperelastic formulations for cords. Comput Mech. 1994;13:241–54.10.1007/BF00350227Search in Google Scholar
[33] Tönük E, Ünlüsoy YS. Prediction of automobile tire cornering force characteristics by finite element modeling and analysis. Comput Struct. 2001;79(13):1219–32.10.1016/S0045-7949(01)00022-0Search in Google Scholar
[34] Shen Y, Chandrashekhara K, Breig WF, Oliver LR. Finite element analysis of V-ribbed belts using neural network based hyperelastic material model. Int J Nonlin Mech. 2005;40(6):875–90.10.1016/j.ijnonlinmec.2004.10.005Search in Google Scholar
[35] Cho J, Lee S, Jeong HY. Finite element analysis of a tire using an equivalent cord model. Finite Elem Anal Des. 2015;105(1):26–32.10.1016/j.finel.2015.06.009Search in Google Scholar
[36] Tonatto MLP, Tita V, Araujo RT, Forte MMC, Amico SC. Parametric analysis of an offloading hose under internal pressure via computational modeling. Mar Struct. 2017;51:174–87.10.1016/j.marstruc.2016.10.008Search in Google Scholar
[37] She C, Tang J, Cai R, Li H, Li L, Yao Q, et al. Compatibility of C5F10O with common-used sealing materials: An experimental study. AIP Advances. 2021;11:065220.10.1063/5.0053780Search in Google Scholar
[38] Pucci E, Saccomandi G. A note on the gent model for rubber-like materials. Rubber Chem Technol. 2002;75(5):839–52.10.5254/1.3547687Search in Google Scholar
[39] Johnson AR, Quigley CJ. A viscohyperelastic maxwell model for rubber viscoelasticity. Rubber Chem Technol. 1992;65(1):137–53.10.5254/1.3538596Search in Google Scholar
[40] Oman S, Nagode M. On the influence of the cord angle on air-spring fatigue life. Eng Fail Anal. 2013;27:61–73.10.1016/j.engfailanal.2012.09.002Search in Google Scholar
[41] Oman S, Fajdiga M, Nagode. M. Estimation of air-spring life based on accelerated experiments. Mater Des. 2010;31(8):3859–68.10.1016/j.matdes.2010.03.044Search in Google Scholar
© 2022 Yongfeng Shan et al., published by De Gruyter
This work is licensed under the Creative Commons Attribution 4.0 International License.
Articles in the same Issue
- Regular Articles
- Experimental investigations of a novel pressure microfoam preparation device for dust removal
- Influence of hydrothermal aging on the mechanical performance of foam core sandwich panels subjected to low-velocity impact
- Experimental study on surface wrapping strengthening of EPS particles and its concrete performance
- Modification of mechanical properties of Shanghai clayey soil with expanded polystyrene
- A new EPS beads strengthening technology and its influences on axial compressive properties of concrete
- A novel superabsorbent material based on soybean straw: Synthesis and characterization
- Use of line laser scanning thermography for the defect detection and evaluation of composite material
- Research on back analysis of meso-parameters of hydraulic cemented sand and gravel based on Box-Behnken design response surface
- Hot deformation behavior and microstructure of a 0.5 wt% graphene nanoplatelet reinforced aluminum composite
- Analysis of electromagnetic characteristics of the proposed composite four-rail electromagnetic launcher
- Preparation and characterization of a graphene hybridizing polyurethane damping composite
- Effects of layup parameters and interference value on the performance of CFRP–metal interference fit joints
- Vibration and noise reduction of pipelines using shape memory alloy
- Finite element analysis of behavior and ultimate strength of composite column
- Dynamic response of functionally graded plate under harmonic load with variable gradient parameters
- Deformation behavior of rubber composite based on FEA and experimental verification
- Effects of Z-pin on moisture absorption property and damage mode under flexural load for carbon fiber composite
- Design and testing of a smart rubber stave for marine water-lubricated bearings
- Study of carbon nano-modifier of fly ash in cement concrete mixtures of civil engineering
- Analysis of multiple impact tests’ damage to three-dimensional four-directional braided composites
- Theoretical analysis of aluminum honeycomb sandwich panel supported by reinforced concrete wall under low-speed impact load
- Effects of local fiber discontinuity on the fatigue strength parameter at the fiber inclusion corner in fiber-reinforced composites
- Experimental investigation on compressive properties of three-dimensional five-directional braided composites in hygrothermal environment
- Failure process of steel–polypropylene hybrid fiber-reinforced concrete based on numerical simulations
- A simple method for measuring the monofilament diameter of continuous filament yarn with high bending stiffness via synthetic laser imaging
- Span length effect on flexural properties of composite laminate reinforced with a plain weave carbon fiber fabric in a polymer matrix
- Mechanical properties improving and microstructure characterization of inorganic artificial stone binder
- Effect of thermal treatment process on the structure of C/SiO2 composite aerogels
- Mechanical and corrosion resistance analysis of laser cladding layer
- Wear and corrosion mechanisms of Ni–WC coatings modified with different Y2O3 by laser cladding on AISI 4145H steel
- Damage and failure analysis of composite stiffened panels under low-velocity impact and compression after impact with damp-heat aging
- In-situ CT characterization of 2D woven SiCf/SiC composite loading under compression
- Effect of the manufacturing process on the equivalency qualification of glass fiber reinforced polymer
- Study of concrete properties based on crushed stone sand mixture and fiber of fly ash of thermal power plants
- Establishment of wear mechanism distribution diagram of ZTAp-reinforced iron matrix composites
- Calculation method of elastic modulus for carbon fiber-reinforced plastics considering inhomogeneous interphase
- An experimental study on the failure and enhancement mechanism of bolt-strengthening GFRP T-joint subjected to tensile loading
- The viability of cell that encapsulated in calcium alginate hydrogel beads
- Discussion of ceramic bar reinforced TWIP steel composite structure
- A theoretical framework underlying an accelerated testing method and its application to composites under constant strain rates and fatigue loading
- Theoretical analysis of interfacial design and thermal conductivity in graphite flakes/Al composites with various interfacial coatings
- Multiscale heat conduction and fractal oxidation behaviors of needle-punched carbon/carbon composites
- Numerical simulation of composite grid sandwich structure under low-velocity impact
- Wear properties of Al/TiO2 composites fabricated via combined compo-casting and APB process
- Review Articles
- Application of melanin as biological functional material in composite film field
- Review on research progress of cemented sand and gravel dam
- Communication
- Fabrications and microstructure analysis of cobalt-based coatings by an easy-coating and sintering process
- Letter to the Editor
- Investigation on mechanical and conductive behaviors of nano-graphite-based concrete