Development of AHP-embedded Deng’s hybrid MCDM model in micro-EDM using carbon-coated electrode
-
Dong Pham Van
 ,
Phan Nguyen Huu
,
Phan Nguyen Huu

Abstract
The use of thin film-coated micro-tool electrode introduced a new technical solution to bring the best technical–economic efficiency in the field of non-conventional machining processes. Multi-objective optimization of process parameters in micro-electrical discharge machining (EDM) is very limited with the help of thin film-coated micro-tool, which brought benefits for the industry. In this research work, the technological parameters such as voltage (V), spindle rotation, and capacitance (C) in micro-EDM using carbon-coated electrode were optimized, and Z-coordinate depth of cut and tool wear rate were selected as response variables. Taguchi is combined with Deng’s method to solve this multi-objective decision problem. The results showed that Taguchi–Deng’s method is the right solution for multi-target decision in micro-EDM using the coated electrode. C is the strongest influence on optimal efficiency, and it is the smallest with V. The machining quality under optimal conditions is improved.
1 Introduction
Micro-EDM is widely used for machining difficult-to-machine materials like titanium alloys. Productivity and electrode wear are quality indicators that affect machining time and tool life. Using a coating material with an electrode is a solution that can simultaneously improve both quality criteria in micro-electrical discharge machining (EDM) [1]. It is said to be a solution that can bring economic–technical efficiency in processing products with micro-size. There are very few and limited works available related to thin film-coated tool electrode. The new research results refer to the study investigating the influence of coating materials in micro-EDM [2]. The influence of process parameters on quality parameters and optimization problems in micro-EDM with coated electrodes was published in very few research articles. Therefore, the application of this technology in practice is very limited. Therefore, studies on micro-EDM using coated electrodes will promote the application of this solution in practical production.
The economic performance in micro-EDM with the coated electrode is significantly improved [3]. It was observed that Cu electrode costs three times as compared to Cu-coated Al electrode. The coating materials (Cu-ZrB2 and ZnC) contributed to the significantly improved tool wear rate (TWR) [4,5]. The quality parameters in EDM with multi-walled carbon nanotubes Cu-base-coated electrode are significantly improved [6]. The coating material is already present in the machined surface layer after EDM with the coating electrode, and this will lead to a change in the mechanical, physical, and chemical properties of the machined surface. Cu and Ag were used as coating materials on tungsten carbide (WC) electrode surface in micro-EDM, and the results showed that the material removal rate (MRR) with the Cu-coated material is the largest, the MRR of the Ag-coated material is larger than that of the WC electrode, and the TWR of the WC electrode is the smallest [7]. Ag coating with Cu electrode resulted in significantly improved MRR, TWR, and surface roughness (SR) [8]. Electrode wear rate (EWR) and overcut (OVC) of TiN-coating materials are the smallest, and EWR and OVC with Ag-coating material are the largest. The performance of electrode-coating materials in EDM depends on material properties, including melting and electrical and thermal conductivities [9]. Using Al2O3–TiO2 coating material has significantly improved the workability of Cu electrode, and the results show that the TWR and OVC of the coated electrode are reduced by 92 and 62.5%, respectively [10]. Compared with the uncoated electrode, the TWR and OVC of the coated electrode are reduced by 16.32 and 26%, respectively [11]. And MRR in micro-EDM with the coated electrode is increased by 18.9%. Among the investigated micro-EDM electrode-coating materials (TiN, Ag, and ZrN), TiN material gives the highest efficiency [12]. Gr electrode can be used in EDM finishing by coating Cu material on the electrode surface by the plating method, and the SR of the machined surface is significantly reduced [13]. TiAlN-coating material has lower machining efficiency in micro-EDM than TiN coating [14]. The optimization problem in this study has not been clarified. Compared with uncoated electrode, topography of machined surface with the coated electrode is better [21]. The quality criteria under optimal conditions are analyzed and evaluated, and the results are good [15]. MRR and SR in EDM using coated electrode were decided simultaneously by Taguchi grey relational analysis [16]. Several quality parameters in EDM with coated and uncoated electrodes are simultaneously determined by multiple optimization methods [17]. The research results of each optimization problem depend on the input of each type of problem and the optimization method. Some research results have shown that Deng’s method can produce higher multi-objective optimization than Topsis [18]. Therefore, it is necessary to have studies to determine the optimal results for each specific problem. The above research results have shown that using coated electrodes in EDM can bring economic and technical efficiency in machining. However, the research results in this field are not many, especially the results related to the optimization problem in EDM with coated electrodes. And this will significantly affect the use of this technology in practice.
In this study, the process parameters of the multi-objective problem in micro-EDM using carbon-coated electrode for Ti-6Al-4V were determined. The topography of the machined surface using the micro-EDM with the coated electrode under optimal conditions was analyzed and evaluated. Taguchi–Deng’s method has been used to solve the multi-objective decision problem.
2 Materials and methods
2.1 Experimental setup
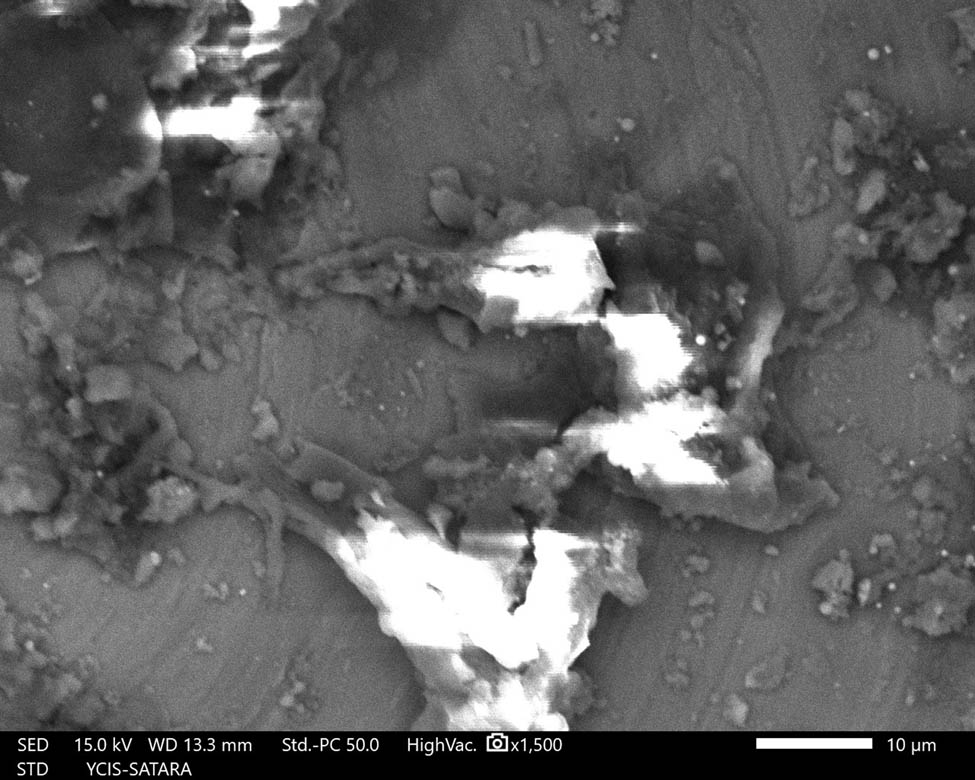
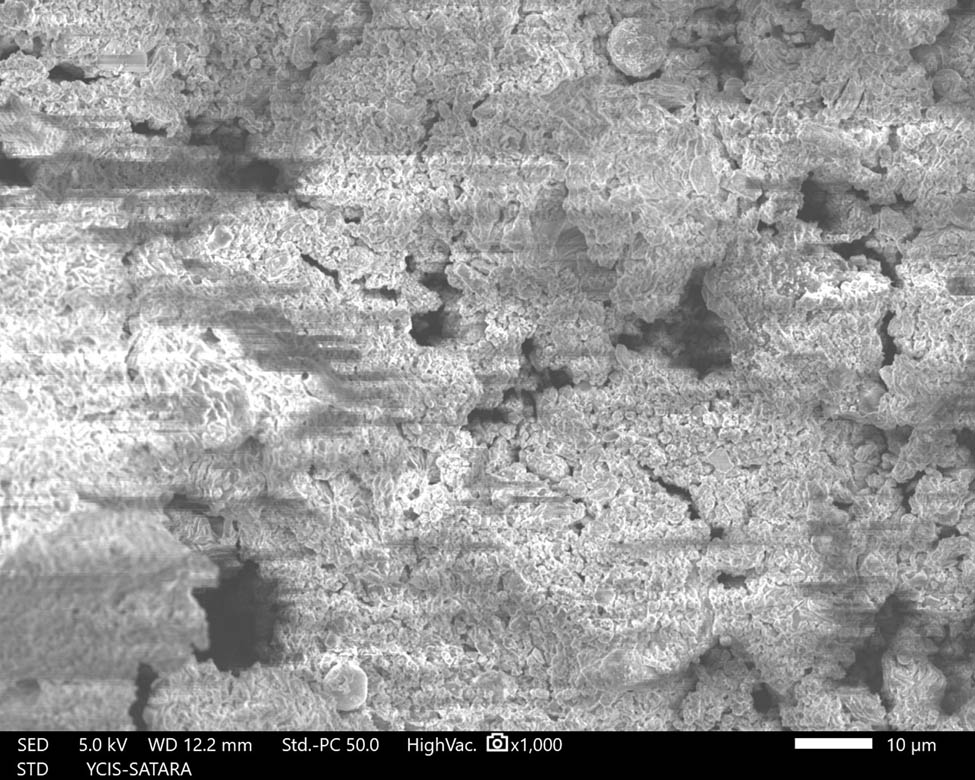
The carbon-coated WC electrode was used in this study, and the coating thickness of the electrode is approximately 10 μm. The results of EDX analysis, shown in Figure 1, show that the thin film coating consists of elements W, O, C, Co, and Zn. The chemical vapor deposition (CVD) was used for coating on tungsten carbide substrate up to 10 μm. The surface quality of the coated electrode is quite good (Figure 2). The structural feature consists of small particles, and the sizes of the particles are quite similar (Figure 3). The micro-EDM machine used in this experimental study is the Hyper 10 micro-EDM. The dielectric fluid is EDM oil, and the workpiece material is Ti-6Al-4V. Quality indicators, including Z and TWR, were used in this study. Process parameters are investigated in micro-EDM as given in Table 1.
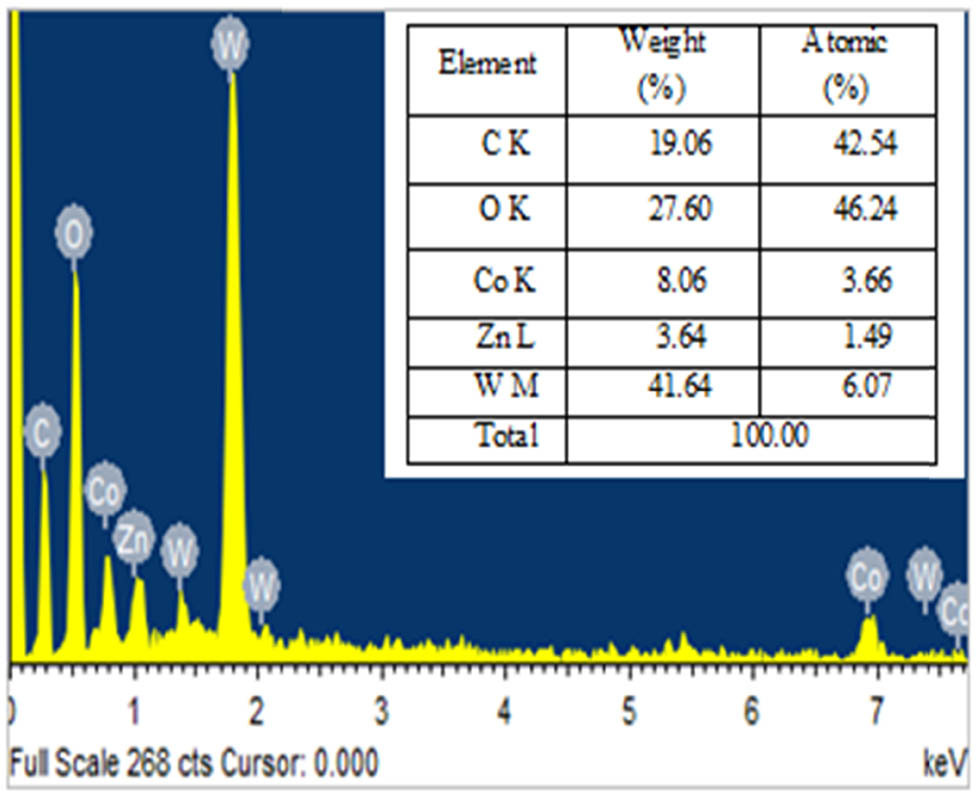
EDX coating of electrode.
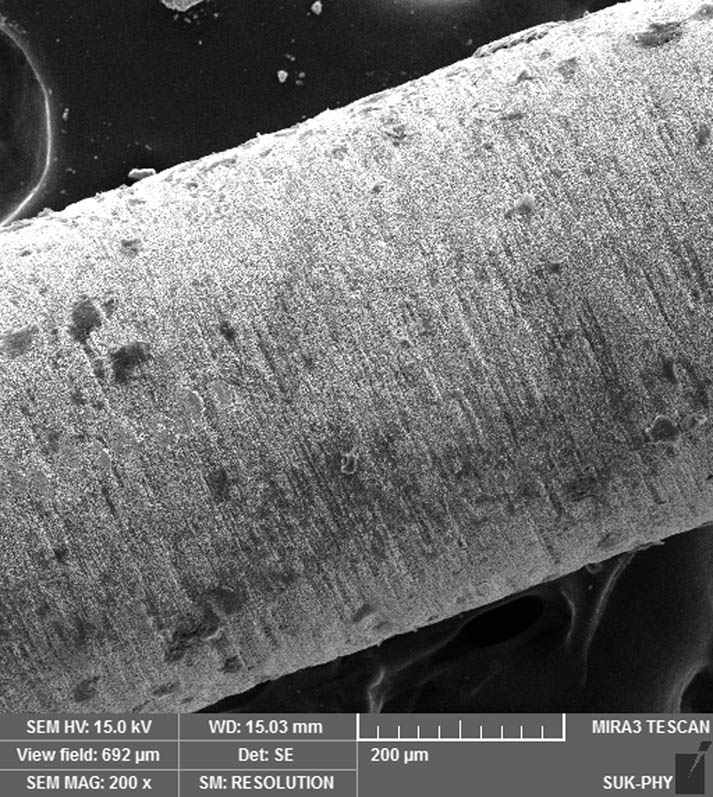
Photograph of electrode surface.
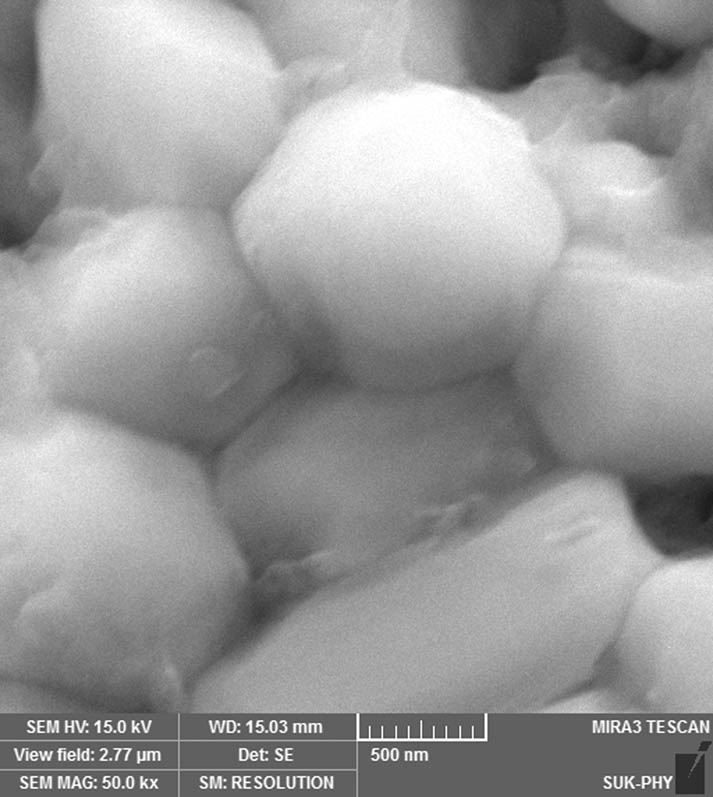
Grain structure in the coating.
Experimental results with carbon-coated micro-tool electrode
| Ex. No. | Process parameters | Response variables | |||
|---|---|---|---|---|---|
| Voltage (V) | Capacitance (pF) | RPM (rpm) | Z (mm) | TWR (mg/min) | |
| 1 | 120 | 100 | 200 | 0.6521 | 0.0097 |
| 2 | 120 | 1,000 | 400 | 1.232 | 0.052 |
| 3 | 120 | 10,000 | 600 | 2.072 | 0.082 |
| 4 | 140 | 100 | 400 | 0.791 | 0.032 |
| 5 | 140 | 1,000 | 600 | 1.399 | 0.055 |
| 6 | 140 | 10,000 | 200 | 2.377 | 0.083 |
| 7 | 160 | 100 | 600 | 1.472 | 0.025 |
| 8 | 160 | 1,000 | 200 | 1.307 | 0.059 |
| 9 | 160 | 10,000 | 400 | 2.391 | 0.114 |
| Average total (T) | 1.521 | 0.057 | |||
2.2 Methodology
Taguchi–Deng’s method was used for multi-objective decision making in this study. The steps to combine Taguchi with Deng’s are shown in Figure 4. The optimal value should be determined by S/N factor analysis, and the value of S/N is determined as shown in (1)–(3).
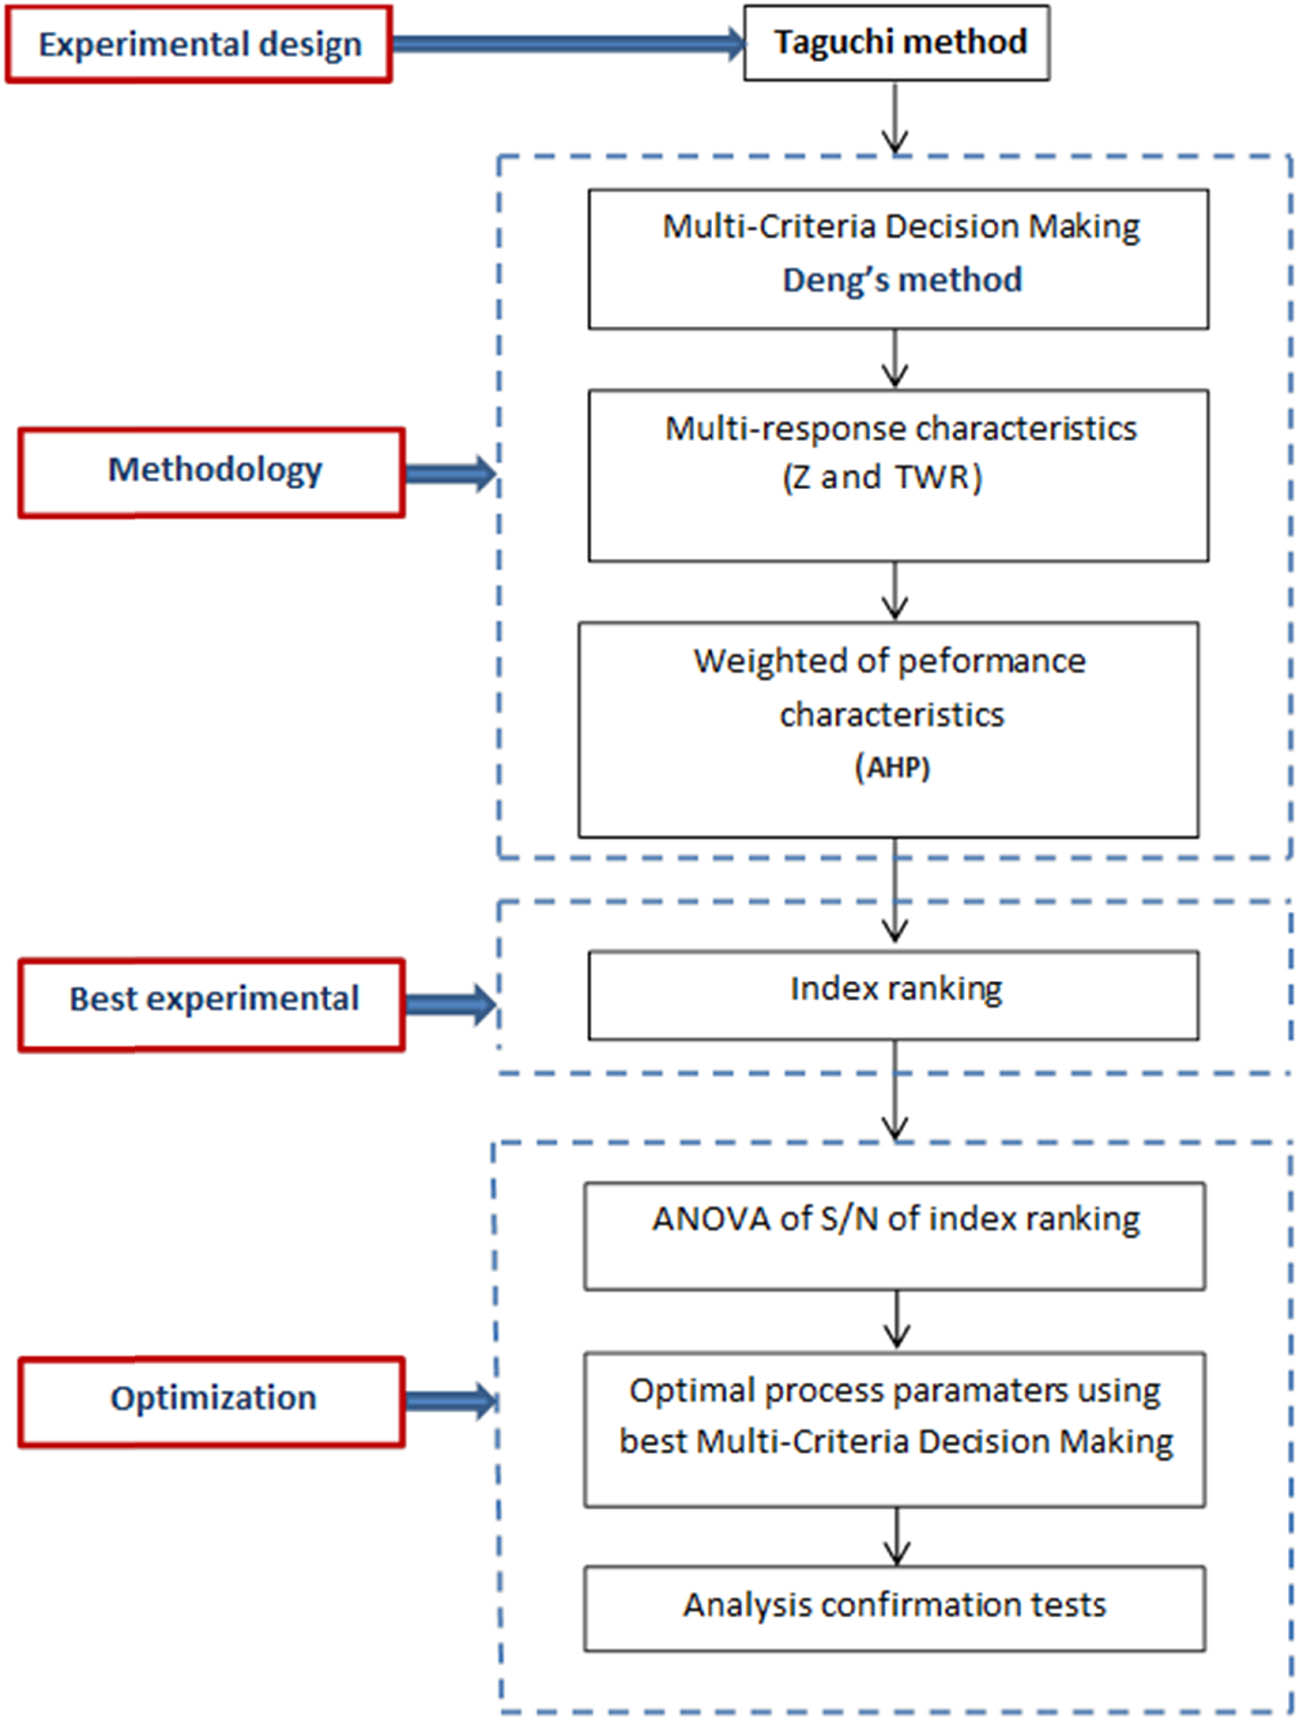
Steps of Taguchi–Deng’s method.
* The S/N ratio:
The “larger the better” S/N value is closer to optimal parameters, and the results of the indicators are as follows:
where mean square deviation (MSDHB) can be defined by the following expression:
In this case, r represents the number of repetitions, and y i is the value of experiment results.
Similarly, “Normal, the best” S/N ratio can be defined as follows:
where the mean square deviation for nominal the best (MSDNB) can be defined as:
In this expression, y 0 represents the standard values or target values.
The “Lower the better” S/N ratio can be defined as:
where mean square deviation for lower the better (MSDLB) can be defined as:
In this equation,
*Multi-response optimization methodology by Deng’s Similarity-Based Method:
Hepu Deng (2007) proposed a new approach to find the best alternative solution to a multi-criteria decision-making process [19]. This approach compares the magnitude and conflict between the alternative and ideal solutions. Gradients of variables indicate conflicts, and the best choice can be identified with the rank of conflicting indexes. The calculation and ranking process in AHP–Deng’s is described in previous study [20].
Step 1: Sort the selected indicators in the matrix form:
where x ij is the experimental value of the selected evaluation indicators (j is the number of indicators (j = 1 – n), and i is the number of experimental values of an indicator (i = 1 – m)).
Step 2: Normalize the determination matrix and convert the responses to non-dimensional form to make comparisons between response values. The standardized matrix is established through standardized values
Step 3: Calculate the performance matrix by assigning the weight of quality indicators to the normalized matrix. The quality matrix is defined as follows:
where A ij is the value of quality indicator j in the ith experiment, W j is the weightage of the indicators, and A is the quality matrix.
Step 4: Positive ideal solution (PIS) and negative ideal solution (NIS) are determined as follows:
PIS:
NIS:
where
Step 5: Calculate the degree of conflict between each alternative: The degree of conflict between each alternative solution and PIS and the NIS can be calculated as follows:
The conflict between the alternative solution and PIS can be obtained as:
The conflict between the alternative solution and NIS can be obtained as:
Step 6: The degree of similarity and conflict between the alternative solution and the PIS and NIS are calculated as follows:
A degree of conflict:
A degree of similarity:
Step 7: Calculate the overall performance index:
The overall performance index for each alternative is calculated as follows:
The larger the index value is, the more priority it will have.
Step 8: Rank according to Deng’s similarity-based method. Higher P i values will give good-quality Ai solutions.
3 Results and discussion
3.1 Determination of the experiment with the best results by Deng’s method
The results are described in detail as follows:
Step 1: Criteria’s matrix:
Step 2: Normalize the criteria’s matrix (Table 2).
Normalized data
| Exp. No | Voltage (V) | C (pF) | RPM (rpm) | Vector normalization | |
|---|---|---|---|---|---|
| X Z | X TWR | ||||
| 1 | 120 | 100 | 200 | 0.133 | 0.050 |
| 2 | 120 | 1,000 | 400 | 0.251 | 0.268 |
| 3 | 120 | 10,000 | 600 | 0.422 | 0.423 |
| 4 | 140 | 100 | 400 | 0.161 | 0.165 |
| 5 | 140 | 1,000 | 600 | 0.285 | 0.284 |
| 6 | 140 | 10,000 | 200 | 0.485 | 0.428 |
| 7 | 160 | 100 | 600 | 0.300 | 0.129 |
| 8 | 160 | 1,000 | 200 | 0.266 | 0.304 |
| 9 | 160 | 10,000 | 400 | 0.487 | 0.588 |
Step 3: Criteria’s weights: The value of the weights of the quality criteria includes W Z = 0.667 and W TWR = 0.333. The results are shown in Table 3.
Calculation results in Deng’s and S/N ratio values
| Exp. No | A i |
|
|
DC+ | DC– | DS+ | DS– | P i | Rank | S/N ratio |
|---|---|---|---|---|---|---|---|---|---|---|
| 1 | 0.0291 | 0.991 | 0.574 | 0.089 | 0.052 | 0.275 | 0.241 | 0.533 | 1 | −5,465 |
| 2 | 0.0560 | 0.905 | 0.793 | 0.172 | 0.150 | 0.528 | 0.700 | 0.430 | 7 | −7,330 |
| 3 | 0.0940 | 0.916 | 0.776 | 0.289 | 0.245 | 0.886 | 1.137 | 0.438 | 5 | −7,170 |
| 4 | 0.0359 | 0.913 | 0.782 | 0.110 | 0.094 | 0.339 | 0.439 | 0.435 | 6 | −7,230 |
| 5 | 0.0634 | 0.917 | 0.775 | 0.195 | 0.165 | 0.598 | 0.765 | 0.439 | 4 | −7,150 |
| 6 | 0.1075 | 0.934 | 0.745 | 0.330 | 0.263 | 1.014 | 1.224 | 0.453 | 3 | −6,878 |
| 7 | 0.0658 | 0.987 | 0.594 | 0.202 | 0.122 | 0.621 | 0.566 | 0.523 | 2 | −5,629 |
| 8 | 0.0595 | 0.893 | 0.810 | 0.183 | 0.166 | 0.561 | 0.770 | 0.421 | 8 | −7,514 |
| 9 | 0.1090 | 0.882 | 0.823 | 0.335 | 0.313 | 1.028 | 1.454 | 0.414 | 9 | −7,659 |
Step 4: The best solution (A +) and the worst solution (A −): the result is as follows: A + = {Z = 0.325; TWR = 0.17} and A − = {Z = 0.089; TWR = 0.196}.
Step 5:
Step 6: DC+, DC-, DS+, and DS− are determined as in Table 3.
Step 7: P i are determined as in Table 3.
Step 8: Ranking: The value of P i is the largest with Exp. No. 1. The best result of the multi-objective problem includes process parameters (V = 120 V, C = 100 pF, and RPM = 200 rpm), and the value of quality indicators (Z = 0.652 mm and TWR = 0.010 µm).
3.2 ANOVA of P i in Deng’s method
The larger the value of P i , it will lead to an increase in the efficiency of the multi-objective optimization problem. The changes of the levels of the parameters V, RPM, and C were different, which resulted in P i being changed very differently (Figure 5). P i is maximum at V = 120 V, C = 100 pF, and RPM = 200 rpm/min, and it is the smallest with V = 140 V, C = 1,000 pF, and RPM = 400 rpm/min. The rank of influence of process parameters on P i is shown in Table 4. The results show that C has the most significant influence on P i , and V has the least influence on Pi. The influence of interaction pairs between process parameters on P i is also shown in Figure 6. The results show that the pair of interactions between RPM and V will produce the largest number of P i ≥ 0.052 (Figure 8a). This result proves that this pair of interactions will give the best performance for this multi-objective decision problem.
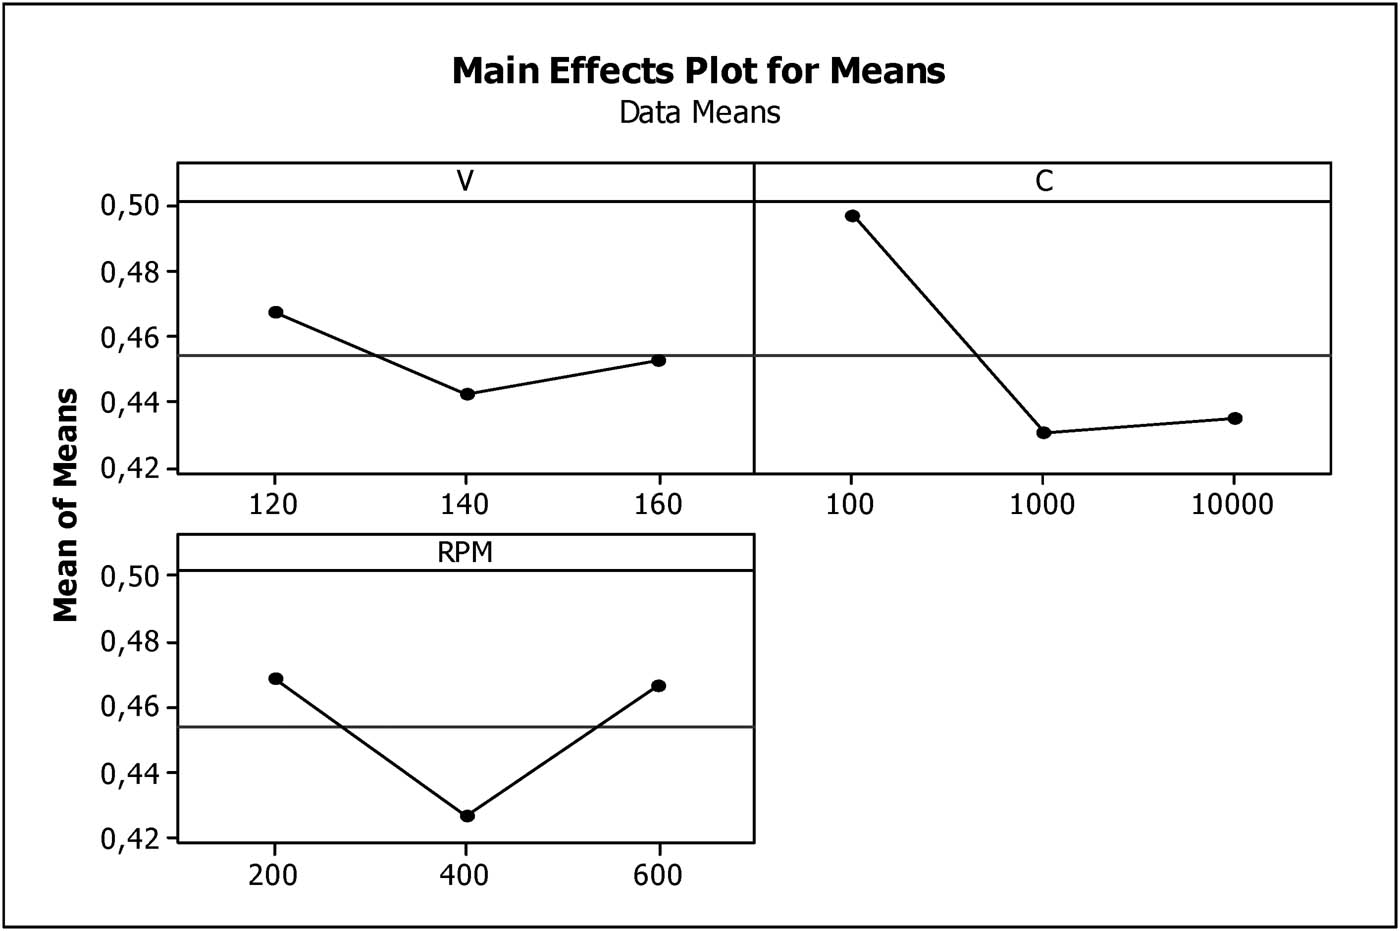
Influence of process parameters on P i in Deng’s method.
Response for mean values of P i
| Level | V | C | RPM |
|---|---|---|---|
| 1 | 0.4244 | 0.3398 | 0.4042 |
| 2 | 0.4142 | 0.4463 | 0.3979 |
| 3 | 0.3947 | 0.4472 | 0.4312 |
| Delta | 0.0297 | 0.1074 | 0.0333 |
| Rank | 3 | 1 | 2 |
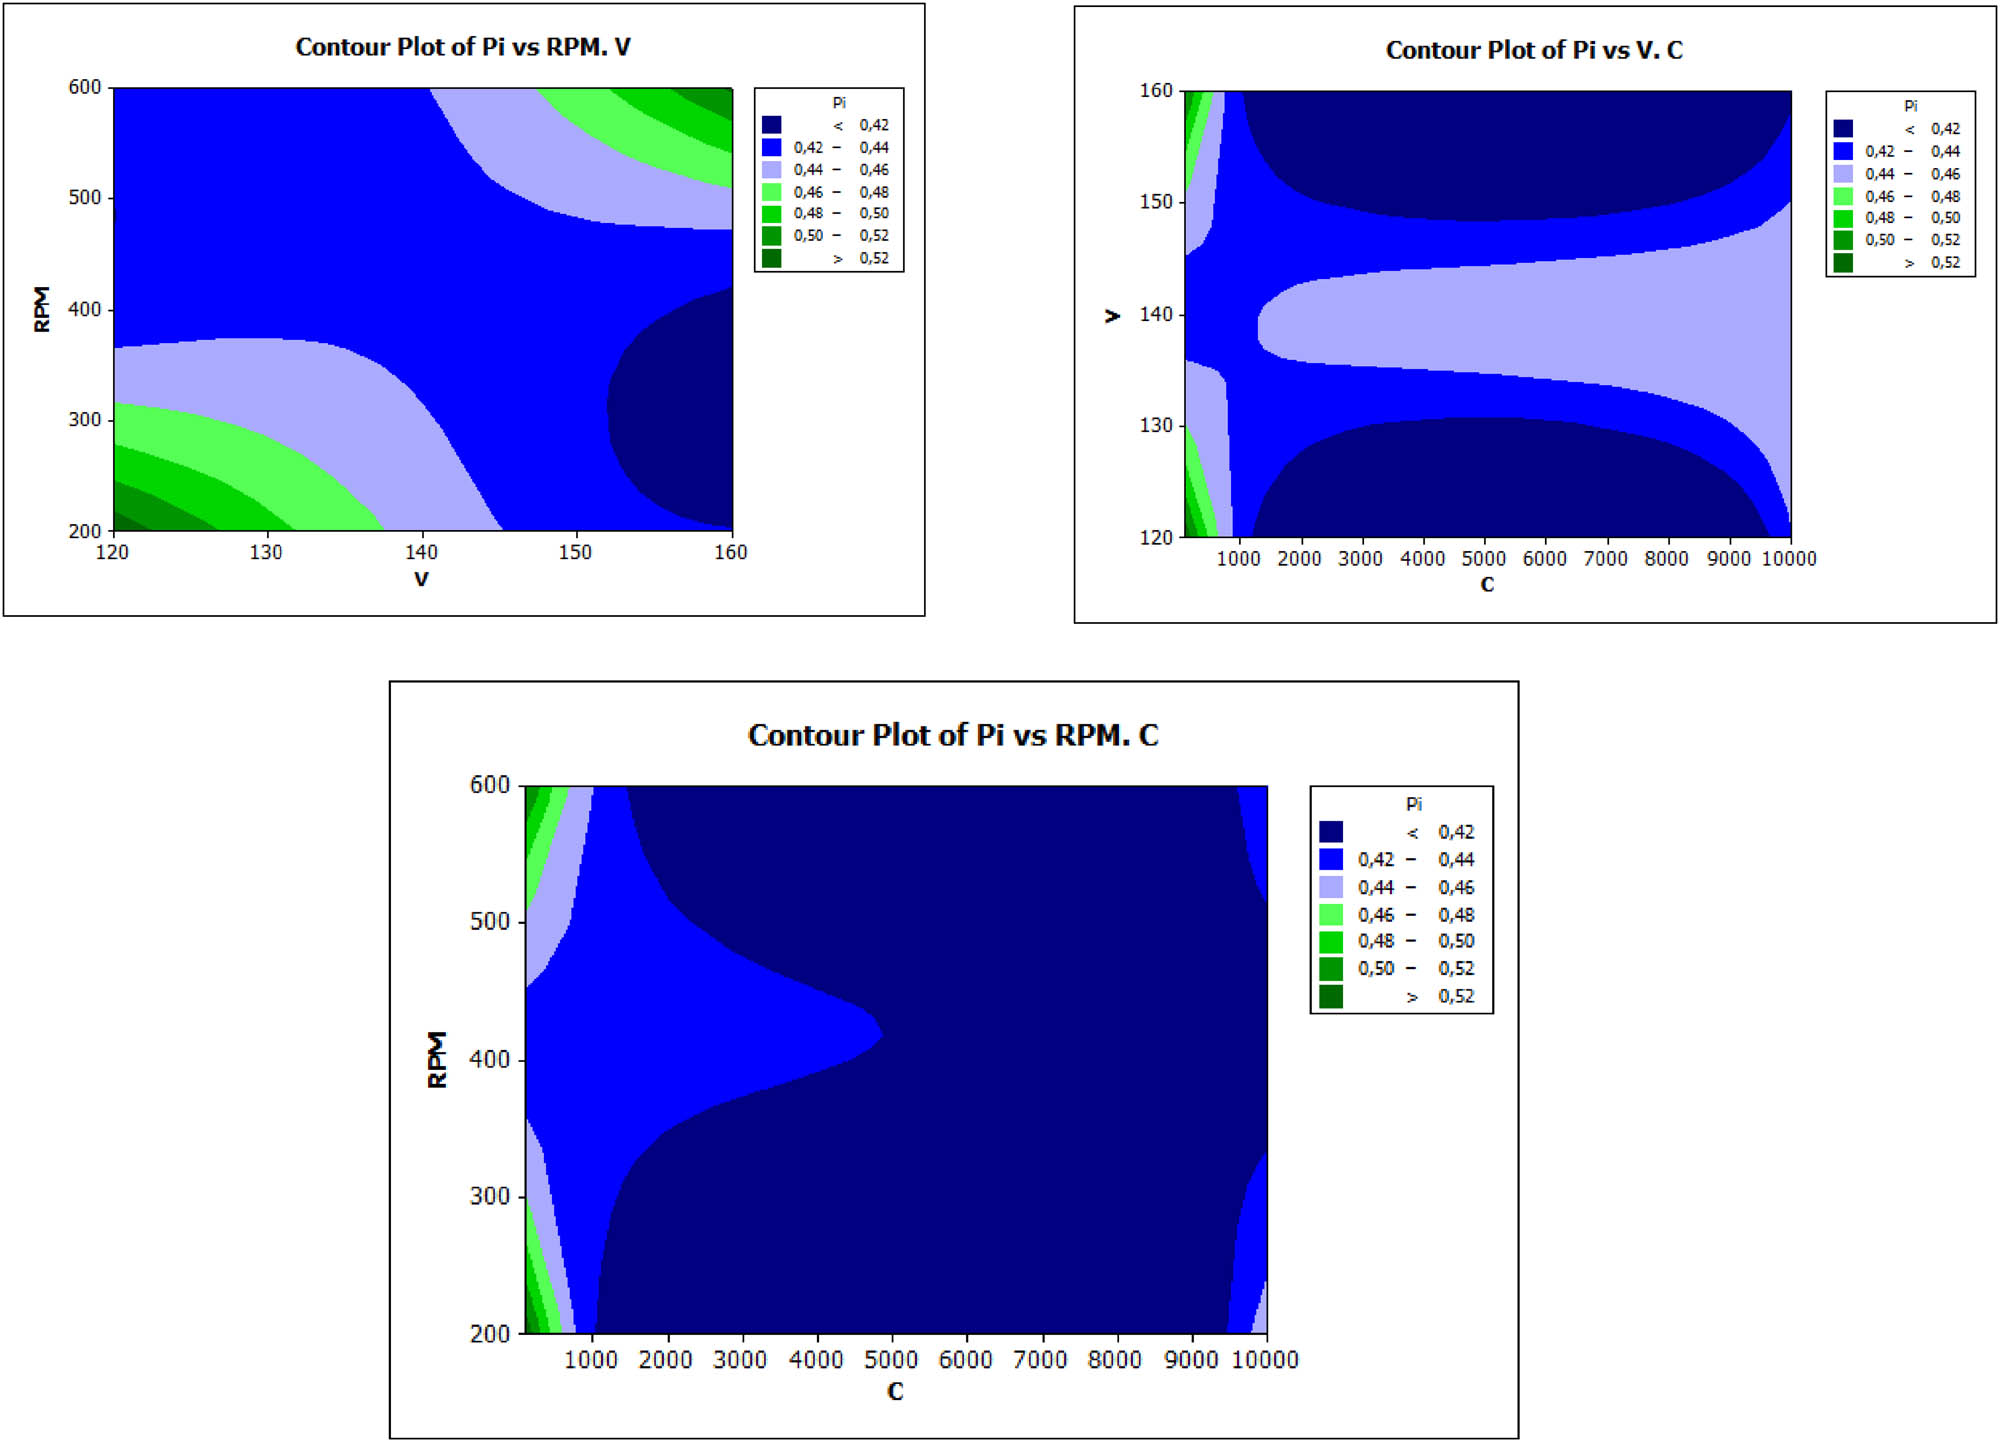
Contour plots for P i in Deng’s method.
3.3 Determination of optimal results by analysis of S/N
Optimal process parameters of Deng’s method are shown in Figure 8, and the result is V = 120 V, C = 100 pF, and RPM = 200 rpm. The results of the quality criteria under optimal conditions are calculated by (15) (Table 5). Compared with the calculated results of the quality criteria, the experimental results of Z and TWR have good accuracy (Figure 7).
Multi-objective optimization results
| Process parameters | Quality indicators | Results | Deviation (%) | |
|---|---|---|---|---|
| Cal. | Exp. | |||
| V = 120 V, C = 100 pF, RPM = 200 rpm | Z (mm) | 0.6929 | 0.652 | −5.90 |
| TWR (mg/min) | 0.0096 | 0.010 | 4.17 | |
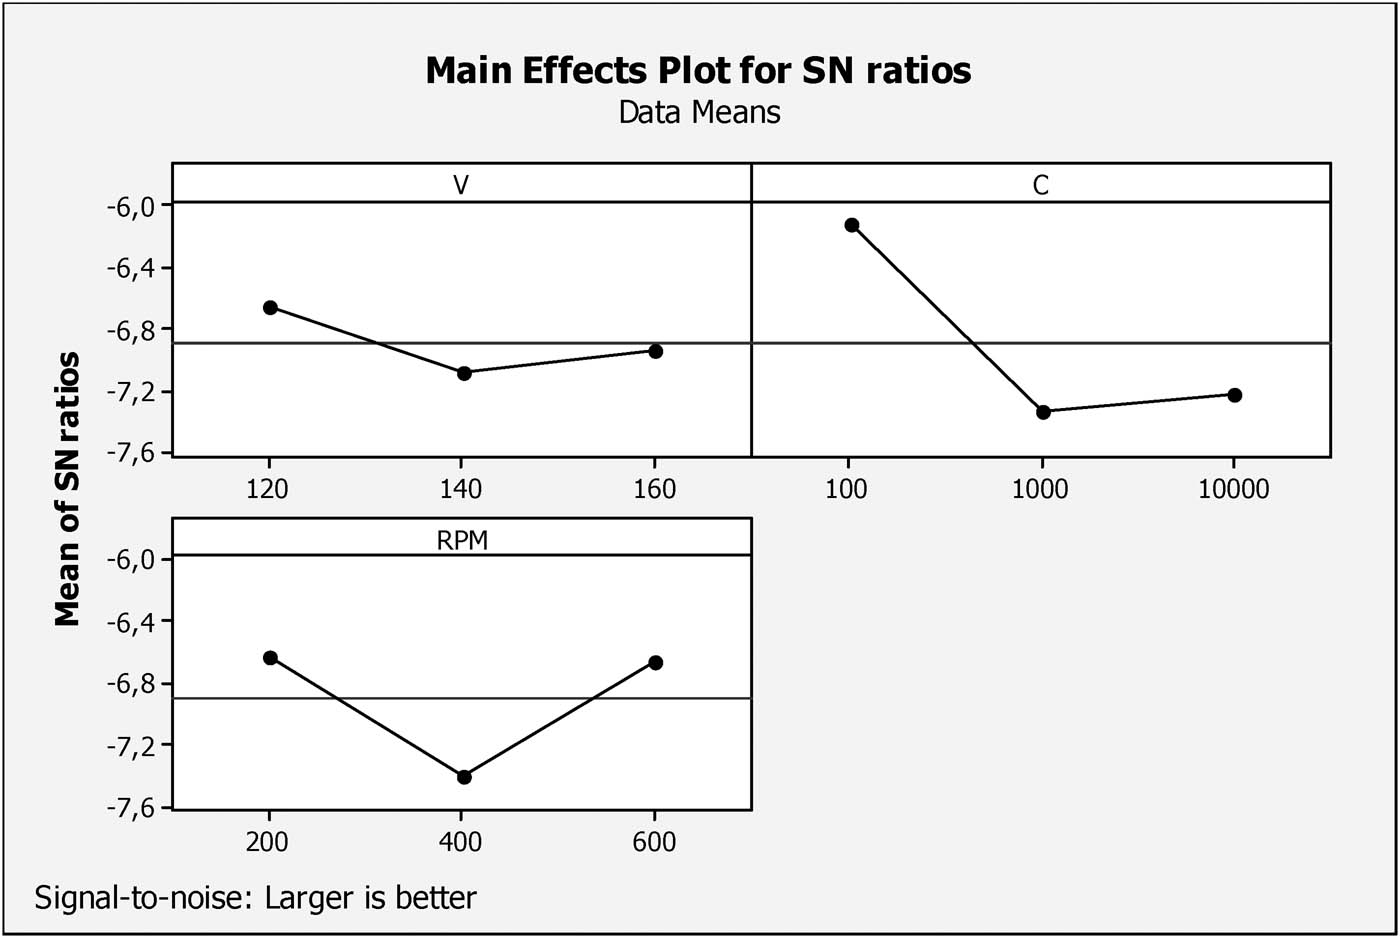
Analysis of S/N of Deng’s.
3.4 Machining quality under optimum conditions
The SEM figure of the machined hole showed that the quality of the hole machined under optimum conditions was significantly improved (Figure 8). Smaller particles adhere to the surface of the machined hole under optimal conditions. This can contribute to improved surface finish after micro-EDM with optimal conditions. The size of the machined hole under optimal conditions is 19.05% smaller than it was in Exp. No. 9. This will affect the machining accuracy in micro-EDM. The machined surface is adhered to by many particles as shown in Figure 9. Their sizes are very different and the particles are randomly distributed over the machined surface. The reason is that the workpiece and electrode materials are melted and evaporated by the thermal energy of the electric sparks, and they are immediately affected by the dielectric solution. Therefore, they firmly adhere to the machined surface. Figure 10 also shows that voids and micro-cracks are also present in significant quantities on the machined surface. These have significantly affected the working quality of the machined surface after micro-EDM with the coated electrode.
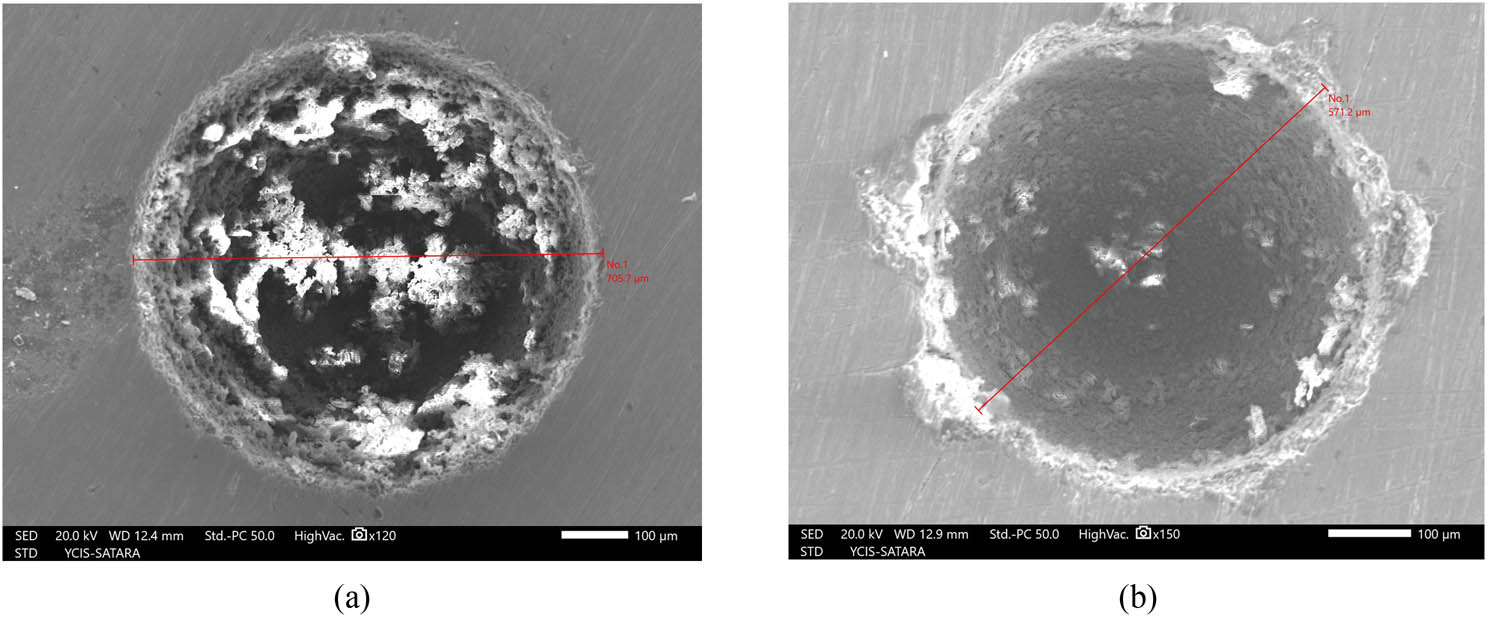
SEM ×100 of machining hole. (a) Exp. No. 9 (the worst optimal effect) and (b) Exp. No. 1 (the best optimal effect).
Topography of machined surface.
Cracks on machined surface.
4 Conclusions
Z and TWR in micro-EDM using the carbon-coated electrode were decided simultaneously by Taguchi–Deng’s. The results of the study came to the following conclusions:
The multi-objective optimization results of Taguchi–Deng’s technique have yielded good machining efficiency, and the accuracy of the results is consistent.
The optimal outcome determined by the P i rating and that of the S/N analysis are the same. This has facilitated the selection of optimal results in practice.
The influence of the technology parameters on P i is as follows: C is the strongest influence, and the influence of RPM and V on P i is gradually decreasing.
The optimal set of technological parameters includes V = 120 V, C = 100 pF, and RPM = 200 rpm. The results of the quality parameters under optimal conditions are as follows: Z = 0.652 mm and TWR = 0.010 mg/min.
The quality of the machining hole under optimal conditions is significantly improved; however, the machined surface after micro-EDM with the coated electrode has many defects. Therefore, it is necessary to have more clear evaluation studies on this technical solution.
-
Funding information: There are no funding details to be mentioned in the manuscript.
-
Author contributions: Pham Van Dong – experiments, Phan Nguyen Huu – optimization and surface morphology, and Nguyen Duc Minh – experiments.
-
Conflict of interest: There is no competing interests to be mentioned in this study.
-
Ethical approval: There is no ethical approval needed for this study.
-
Consent to participate: There is no consent to participate needed for this study.
-
Consent to publish: There is no consent to publish needed for this study.
-
Data availability statement: There is no need to mention the availability of data and materials in this study.
References
[1] Ali MY, Sabur A, Ya’akub SR, Hamid ADA, Alao AR, Singh R. Micro-electro discharge machining (Micro-EDM) models for conductive and nonconductive materials: A review. IOP Conf Ser: Mater Sci Eng. 2021;1173:012063. 10.1088/1757-899X/1173/1/012063.Search in Google Scholar
[2] Zhengkai L, Jiajingm T, Jicheng B. A novel micro-EDM method to improve microhole machining performances using ultrasonic circular vibration (UCV) electrode. Int J Mech Sci. 2020;175:105574. 10.1016/j.ijmecsci.2020.105574.Search in Google Scholar
[3] Ablyaz T, Muratov K, Preetkanwal SB, Sarabjeet SS. Experimental investigation of wear resistance of copper coated electrode-tool during electrical discharge machining. IOP Conf Ser: Mater Sci Eng. 2019;510:012001. 10.1088/1757-899X/510/1/012001.Search in Google Scholar
[4] Yuangang W, Fuling Z, Jin W. Wear-resist electrodes for micro-EDM. Chin J Aeronaut. 2009;22:339–42. 10.1016/S1000-9361(08)60108-9.Search in Google Scholar
[5] Reolon LW, Henning LCA, Torres RD. WEDM performance and surface integrity of Inconel alloy IN718 with coated and uncoated wires. Int J Adv Manuf Technol. 2019;100:1981–91. 10.1007/s00170-018-2828-6.Search in Google Scholar
[6] Mandal P, Mondal SC. Performance analysis of copper-based MWCNT composite coated 316L SS tool in electro discharge machining. Mach Sci Technol. 2021;25:422–37. 10.1080/10910344.2020.1855652.Search in Google Scholar
[7] Chiou AH, Tsao CC, Hsu CY. A study of the machining characteristics of micro EDM milling and its improvement by electrode coating. Int J Adv Manuf Technol. 2015;78:1857–64. 10.1007/s00170-014-6778-3.Search in Google Scholar
[8] Karunakaran K, Chandrasekaran M. Investigation of Machine-ability of Inconel 800 in EDM with Coated Electrode. IOP Conf Ser: Mater Sci Eng. 2017;183:012014. 10.1088/1757-899X/183/1/012014.Search in Google Scholar
[9] Yu L, Wenjian W, Wenchao Z, Fujian M, Dapeng Y, Zhihua S, et al. Experimental study on electrode wear of diamond-nickel coated electrode in EDM small hole machining. Adv Mater Sci Eng. 2019;2019:7181237. 10.1155/2019/7181237.Search in Google Scholar
[10] Prasanna J, Rajamanickam S. Investigation of die sinking electrical discharge machining of Ti-6Al-4V using copper and AlO-TiO coated copper electrode. Middle-East J Sci Res. 2016;24(S1):33–7. 10.5829/idosi.mejsr.2016.24.S1.8.Search in Google Scholar
[11] Shailesh SS, Maharudra SP. Experimental investigation on micro-electro discharge machining process using tungsten carbide and titanium nitride-coated micro-tool electrode for machining of Ti-6Al-4V. Adv Mater Process Technol. 2020. 10.1080/2374068X.2020.1833399.Search in Google Scholar
[12] Huang CH, Yang AB, Hsu CY. The optimization of micro EDM milling of Ti–6Al–4V using a grey Taguchi method and its improvement by electrode coating. Int J Adv Manuf Technol. 2018;96:3851–9. 10.1007/s00170-018-1841-0.Search in Google Scholar
[13] Panchal DL, Biradar SK, Gosavi VY. Analysis of EDM process parameters by using coated electrodes. Int J Eng Trends Technol (IJETT). 2016;41(4):181–5.10.14445/22315381/IJETT-V41P234Search in Google Scholar
[14] George J, Chandan R, Manu R, Mathew J. Experimental investigation of silicon powder mixed EDM using graphene and CNT nano particle coated electrodes. Silicon. 2021;13:3835–51. 10.1007/s12633-020-00658-0.Search in Google Scholar
[15] Phan NH, Dong PV, Dung HT. Multi-object optimization of EDM by Taguchi-DEAR method using AlCrNi coated electrode. Int J Adv Manuf Technol. 2021;116:1429–35. 10.1007/s00170-021-07032-3.Search in Google Scholar
[16] Subrat KB, Pooja P, Asha U. Effect of nichroloy coated electrode on machining performance of electrical discharge machining using Inconel 625. Mater Today Proc. 2021;45:7894–900.10.1016/j.matpr.2020.12.615Search in Google Scholar
[17] Nguyen HP, Pham VD, Hoang TD, Nguyen VT, Muthuramalingam T, Shailesh S, Nguyen CT, et al. Multi-object optimization of EDM by Taguchi-DEAR method using AlCrNi coated electrode. Int J Adv Manuf Technol. 2021;116:1429–35.10.1007/s00170-021-07032-3Search in Google Scholar
[18] Raj SON, Prabhu S. Analysis of multi objective optimisation using TOPSIS method in EDM process with CNT infused copper electrode. Int J Mach Mach Mater. 2017;19(1):76–94.10.1504/IJMMM.2017.10002091Search in Google Scholar
[19] Bedamati N. Multi-response optimization in machining: exploration of Topsis and Deng’s similarity based approach [dissertation]. Rourkela: National Institute of Technology Rourkela; 2010.Search in Google Scholar
[20] Phan NH. Multi-objective optimization in titanium powder mixed electrical discharge machining process parameters for die steels. Alex Eng J. 2020;59:4063–79.10.1016/j.aej.2020.07.012Search in Google Scholar
© 2023 the author(s), published by De Gruyter
This work is licensed under the Creative Commons Attribution 4.0 International License.
Articles in the same Issue
- Research Articles
- The mechanical properties of lightweight (volcanic pumice) concrete containing fibers with exposure to high temperatures
- Experimental investigation on the influence of partially stabilised nano-ZrO2 on the properties of prepared clay-based refractory mortar
- Investigation of cycloaliphatic amine-cured bisphenol-A epoxy resin under quenching treatment and the effect on its carbon fiber composite lamination strength
- Influence on compressive and tensile strength properties of fiber-reinforced concrete using polypropylene, jute, and coir fiber
- Estimation of uniaxial compressive and indirect tensile strengths of intact rock from Schmidt hammer rebound number
- Effect of calcined diatomaceous earth, polypropylene fiber, and glass fiber on the mechanical properties of ultra-high-performance fiber-reinforced concrete
- Analysis of the tensile and bending strengths of the joints of “Gigantochloa apus” bamboo composite laminated boards with epoxy resin matrix
- Performance analysis of subgrade in asphaltic rail track design and Indonesia’s existing ballasted track
- Utilization of hybrid fibers in different types of concrete and their activity
- Validated three-dimensional finite element modeling for static behavior of RC tapered columns
- Mechanical properties and durability of ultra-high-performance concrete with calcined diatomaceous earth as cement replacement
- Characterization of rutting resistance of warm-modified asphalt mixtures tested in a dynamic shear rheometer
- Microstructural characteristics and mechanical properties of rotary friction-welded dissimilar AISI 431 steel/AISI 1018 steel joints
- Wear performance analysis of B4C and graphene particles reinforced Al–Cu alloy based composites using Taguchi method
- Connective and magnetic effects in a curved wavy channel with nanoparticles under different waveforms
- Development of AHP-embedded Deng’s hybrid MCDM model in micro-EDM using carbon-coated electrode
- Characterization of wear and fatigue behavior of aluminum piston alloy using alumina nanoparticles
- Evaluation of mechanical properties of fiber-reinforced syntactic foam thermoset composites: A robust artificial intelligence modeling approach for improved accuracy with little datasets
- Assessment of the beam configuration effects on designed beam–column connection structures using FE methodology based on experimental benchmarking
- Influence of graphene coating in electrical discharge machining with an aluminum electrode
- A novel fiberglass-reinforced polyurethane elastomer as the core sandwich material of the ship–plate system
- Seismic monitoring of strength in stabilized foundations by P-wave reflection and downhole geophysical logging for drill borehole core
- Blood flow analysis in narrow channel with activation energy and nonlinear thermal radiation
- Investigation of machining characterization of solar material on WEDM process through response surface methodology
- High-temperature oxidation and hot corrosion behavior of the Inconel 738LC coating with and without Al2O3-CNTs
- Influence of flexoelectric effect on the bending rigidity of a Timoshenko graphene-reinforced nanorod
- An analysis of longitudinal residual stresses in EN AW-5083 alloy strips as a function of cold-rolling process parameters
- Assessment of the OTEC cold water pipe design under bending loading: A benchmarking and parametric study using finite element approach
- A theoretical study of mechanical source in a hygrothermoelastic medium with an overlying non-viscous fluid
- An atomistic study on the strain rate and temperature dependences of the plastic deformation Cu–Au core–shell nanowires: On the role of dislocations
- Effect of lightweight expanded clay aggregate as partial replacement of coarse aggregate on the mechanical properties of fire-exposed concrete
- Utilization of nanoparticles and waste materials in cement mortars
- Investigation of the ability of steel plate shear walls against designed cyclic loadings: Benchmarking and parametric study
- Effect of truck and train loading on permanent deformation and fatigue cracking behavior of asphalt concrete in flexible pavement highway and asphaltic overlayment track
- The impact of zirconia nanoparticles on the mechanical characteristics of 7075 aluminum alloy
- Investigation of the performance of integrated intelligent models to predict the roughness of Ti6Al4V end-milled surface with uncoated cutting tool
- Low-temperature relaxation of various samarium phosphate glasses
- Disposal of demolished waste as partial fine aggregate replacement in roller-compacted concrete
- Review Articles
- Assessment of eggshell-based material as a green-composite filler: Project milestones and future potential as an engineering material
- Effect of post-processing treatments on mechanical performance of cold spray coating – an overview
- Internal curing of ultra-high-performance concrete: A comprehensive overview
- Special Issue: Sustainability and Development in Civil Engineering - Part II
- Behavior of circular skirted footing on gypseous soil subjected to water infiltration
- Numerical analysis of slopes treated by nano-materials
- Soil–water characteristic curve of unsaturated collapsible soils
- A new sand raining technique to reconstitute large sand specimens
- Groundwater flow modeling and hydraulic assessment of Al-Ruhbah region, Iraq
- Proposing an inflatable rubber dam on the Tidal Shatt Al-Arab River, Southern Iraq
- Sustainable high-strength lightweight concrete with pumice stone and sugar molasses
- Transient response and performance of prestressed concrete deep T-beams with large web openings under impact loading
- Shear transfer strength estimation of concrete elements using generalized artificial neural network models
- Simulation and assessment of water supply network for specified districts at Najaf Governorate
- Comparison between cement and chemically improved sandy soil by column models using low-pressure injection laboratory setup
- Alteration of physicochemical properties of tap water passing through different intensities of magnetic field
- Numerical analysis of reinforced concrete beams subjected to impact loads
- The peristaltic flow for Carreau fluid through an elastic channel
- Efficiency of CFRP torsional strengthening technique for L-shaped spandrel reinforced concrete beams
- Numerical modeling of connected piled raft foundation under seismic loading in layered soils
- Predicting the performance of retaining structure under seismic loads by PLAXIS software
- Effect of surcharge load location on the behavior of cantilever retaining wall
- Shear strength behavior of organic soils treated with fly ash and fly ash-based geopolymer
- Dynamic response of a two-story steel structure subjected to earthquake excitation by using deterministic and nondeterministic approaches
- Nonlinear-finite-element analysis of reactive powder concrete columns subjected to eccentric compressive load
- An experimental study of the effect of lateral static load on cyclic response of pile group in sandy soil