Cholera in the City of Poznań: Did the Death Toll of the 1866 Cholera Epidemic Reflect Social and Economic Differences?
-
Grażyna Liczbińska
Grażyna Liczbińska is a human biologist. She is an associate professor at the Faculty of Biology, Adam Mickiewicz University in Poznań, Poland. Her main scientific interests are related to biology and demography of populations from the past, with a special emphasis on the impact of social inequalities, human ecology, environmental stress related to biological and health status and social mobility, as well as positive and negative determinants of health. und
Jörg Vögele
und
Jörg Vögele
Jörg Vögele is Professor of Modern History. He studied History in Konstanz and Bristol, worked as lecturer in Konstanz, Research Fellow in Liverpool and Assistant Professor in Düsseldorf. From 2003 to 2015 he acted as Managing Director of the Institute for the History of Medicine at the University of Düsseldorf, since 2016 he is Deputy Director of the Department of History, Philosophy and Ethics of Medicine, University of Düsseldorf. He was a Fellow of the University of Liverpool and Visiting Professor at Charles-University in Prague.

Abstract
The objective of this paper is to study whether and to what extent the 1866 cholera epidemic reflected social and economic differences. Individuallevel information on the deceased in Poznań in 1866 was collected from parish death registers. The different exposure levels, sickness and death rates in the different city districts of Poznań are discussed at length. What becomes evident from the quantitative results: the poorest social groups were the most frequent victims of cholera, due to poor living conditions, malnutrition, poor hygiene, lack of awareness of the risks, and pursuit of professions that increased the risk of exposure to germs. Women, who performed domestic work as servants or at home, were at especially high risk of exposure and death. However, cholera also affected those better off: while they contracted the disease less often, if they did so, they were more likely to succumb to it. The approach and methods used show the complexities of a 19th century local epidemic in great granularity.
1 Health Indicators of Social Inequalities
Socioeconomic disadvantages often result in health disadvantages, leading to social differences in mortality. The discussion about the relationship between socioeconomic inequalities and biological and health determinants, however, is still ongoing. Several researchers believe that the relationship is largely a statistical one, [1] others think the link between inequality and health is biased. [2] Meanwhile, studies of human populations provide evidence that socioeconomic factors such as employment status, income level, ethnic and religious affiliation, education, size of the place of residence, and family/household size all have a significant impact on human well-being. [3]
Assessing inequalities in morbidity, mortality, and life expectancy is a growing field of interest. It is fairly well documented that in many European countries, premature mortality rates among adults are inversely proportionate to social strata, as reflected by occupation, income, or education. [4] In most contemporary societies, socioeconomic status is positively associated with health and negatively associated with mortality. [5] Meanwhile, studies of health and mortality differences in historical populations yield less consistent results. [6] More important than social position was the size of the place of residence, access to infrastructure, population density or other factors. [7] These reflect the fact that the effects of social class were different by age, sex, and, of course, for each type of disease. In the nineteenth century, overall mortality, as well as infant and child mortality, were lower in rural areas than in urban ones. [8] Overpopulated cities with their poor sanitation and hygiene, where the lower strata of the population was concentrated in overcrowded districts, posed a threat to human health and life. Villages were characterized by very low population density instead. [9] Urban and rural centers also saw different causes of death. For example, deaths from tuberculosis were more frequent in urban than in rural areas. [10] Tuberculosis was identified as the archetype disease of industrialization, strongly reflecting social inequality. Pulmonary tuberculosis was considered to be the disease of the proletariat. Crowded and poorly ventilated living and working environments that are strongly associated with poverty, constituted direct risk factors for the transmission of tuberculosis pathogens. Malnutrition was another risk factor for developing active tuberculosis. When suffering from tuberculosis, workers often lost their jobs and consequently their abodes and often had to move to even poorer parts of the city. [11]
The classic epidemic of the nineteenth century, however, was cholera, a leading waterborne disease. The development of the economy and industry contributed to the growth of territorial mobility and the creation of international trade networks; wars also played a role in spreading cholera throughout nineteenth-century Europe along trade routes, rivers and seas, and through the movement of troops. The disease mainly affected urban areas. Cholera is an acute diarrhoeal disease that can kill within hours, affecting people with inadequate access to clean water and basic sanitation. During the nineteenth century, cholera spread across the world from its original reservoir in the Ganges delta in India. Six global pandemics killed millions of people across all continents. [12] Cholera is now endemic in many countries, and it is estimated that even today there are 1.3 to 4.0 million cases of cholera, with 21,000 to 143,000 deaths worldwide. [13]
To study cholera and its effects based on individual social and economic status from a historical perspective, we will focus on the city of Poznań, which was territorially and administratively part of the Prussian state in the nineteenth century (it was called Posen in German). The fortified city on the Warta river (then called Warthe in German) experienced significant immigration, which led to high population density. Poznań was characterized by a lack of infrastructure and generally poor hygienic conditions. The city was prone to several outbreaks of serious epidemic diseases.
Cholera epidemics plagued Poznań in several waves up until 1873. This study aims to determine whether Poznań’s inhabitants, representing different occupational and social groups and living in parts of the city with different access to sanitation and clean water, were equally affected by cholera during the 1866 wave of this waterborne disease. Urban sanitation and urban ecology are closely linked, given that the state of sanitation in a city is an integral part of urban ecology because it affects human health and how people function within urban environments. Attention will be paid to both of these areas throughout this study.
2 Poznań in the Nineteenth Century: Sanitary Conditions, Urban Ecology and Victims of Cholera Epidemics
As an outcome of the Congress of Vienna, as per February 1815, the city of Poznań became the capital of the Grand Duchy of Poznań, which was in territorial and administrative terms a part of the Prussian state. [14] In 1828, Prussian authorities decided to turn the city into a fortress (see Figure 1, which includes the German names for city, river and streets). The first phase of construction, which focused on the perimeter of the citadel and barracks, as well as the fortifications on the eastern side of the city, was completed in mid-1839. At the same time, by order of the Prussian King Frederick William III, the construction of fortifications around the entire city began. These works continued until 1869.
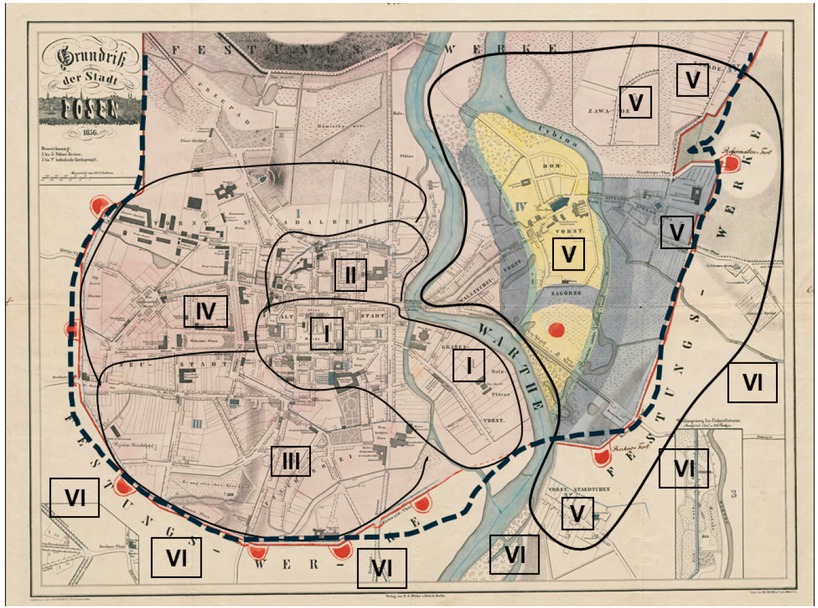
Map of 19th-century Poznań (with Quarters I to VI marked). Note: The dotted line indicates the ring of fortifications. Source: Anon., Grundriss der Stadt Posen, in: The Collection of the Raczyński Library, catalogue no. CYRYL_12_2_2_272_0001, https://cyryl.poznan.pl (01.10.2024).
The construction of the fortifications disturbed the water management in the south-western part of the city. There was a serious water shortage. The wells and most of the fountains in this part of the city dried up and the groundwater seeped into the ditches surrounding the fortress. [15] Turning the city of Poznań into a fortress surrounded by walls also inhibited its spatial development. After some time, the city that was now enclosed within the fortress started to suffer from a lack of free space. By the end of the nineteenth century, it was virtually suffocating within the surrounding walls. [16]
A lack of assorted infrastructure was another major problem in Poznań. Until the mid-1860s, the city had no central water supply or municipal sewage systems. Construction of the latter began in 1888, and only by 1896 had the city’s major streets been connected to the sewerage system. [17] For these reasons, the population often suffered from outbreaks of epidemics. [18]
In 1850, the city had some 45,000 inhabitants while in 1864 it had 53,383 people. [19] Following the cholera epidemic of 1866, the city’s population remained level at 53,392 in 1867, [20] which was due to continued immigration to the city. Only at the beginning of the twentieth century, after the demolition of fortifications and the incorporation of areas located outside the city walls, did the population of Poznań increase to 117,000. [21]
During the second half of the nineteenth century, Poznań experienced cholera epidemics in 1852, 1855, 1866, and 1873. It would seem that, as a result of earlier epidemics in the first half of the nineteenth century, the city should have had considerable experience in dealing with cholera. However, given the high death rates, this does not seem to have been the case. The high population density in the city and the low quality of sanitation meant that each cholera outbreak was a major challenge for Poznań authorities and city inhabitants. [22] In 1852 the cholera-specific mortality rate was over 30 deaths per 1,000 population, and in 1866 it was still at 25 deaths per 1,000 population. Only by 1873, when water supply systems were already in operation, the number of cholera deaths had fallen to only two per 1,000 population (see Figure 2).
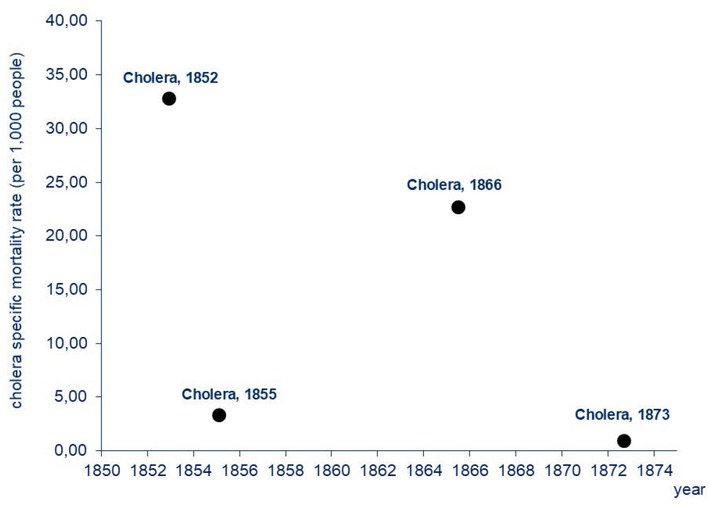
Cholera-specific Mortality Rates in Poznań in the Second Half of the 19th Century. Note: Cholera-specific mortality rates were calculated by the authors. Sources: The number of cholera deaths was derived from: Polizeipräsidium Posen 5676, Die Cholera im Jahre 1866; the population size was taken from: M. Kędelski, Stosunki ludnościowe w latach 1815–1918, in: J. Topolski/L. Trzeciakowski (Eds.), Dzieje Poznania 1793–1918, Vol. 2, Poznań 1994, pp. 238, 241, 244, and from Galloway, Galloway Prussia Database.
In the second half of the nineteenth century, cholera epidemics had a significant impact on the population dynamics of Poznań and played an important role in shaping mortality rates (see Figure 3). If cholera deaths are excluded from the total number of deaths in the epidemic years (1852, 1855, 1866, and 1873) and the crude death rates and the population growth are recalculated, it can be observed that the curve depicting mortality rates flattens, and the mortality surpluses disappear. However, a visible improvement in the population dynamics, reflected by births outnumbering deaths and the population growth above zero, can only been observed since the 1870s (see Figure 4).
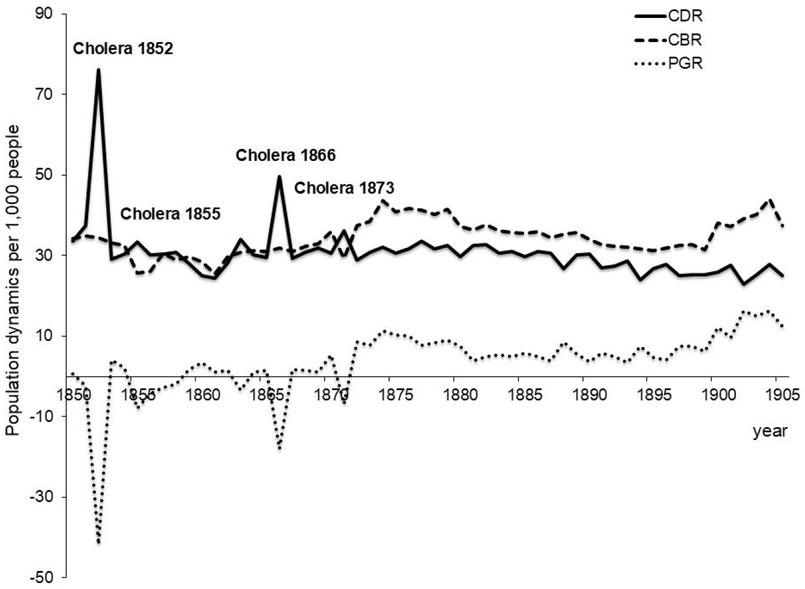
Population Dynamics in Poznań (1850 to 1905). Note: CDRs, CBRs, and PGRs were calculated by the authors. CDR – Crude Death Rate; CBR – Crude Birth Rate; PGR – Population Growth Rate. Sources: The numbers of deaths, births, and population size for 1850 to 1861 were taken from: Kędelski, Stosunki ludnościowe w latach 1815–1918, pp. 238-250; the numbers of deaths, births and population size for the years 1862 to 1905 were taken from Galloway, Galloway Prussia Database.
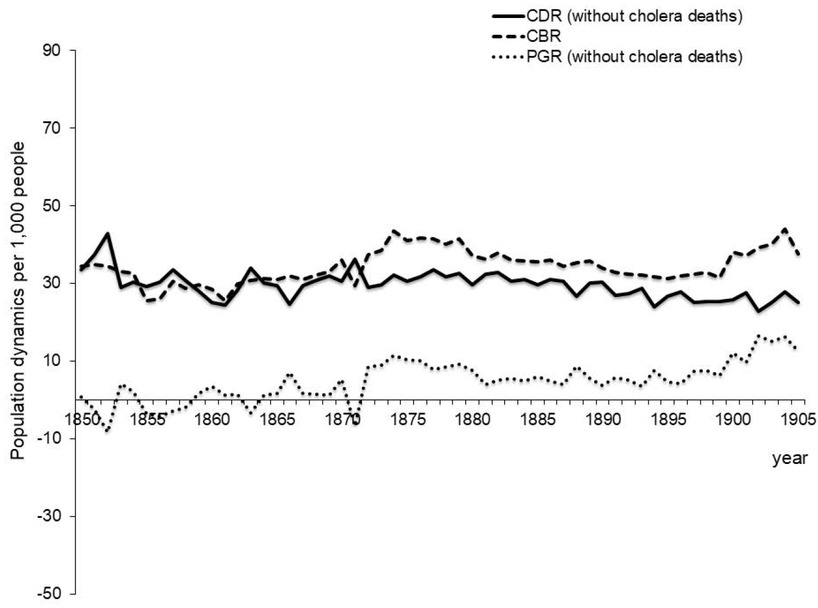
Population Dynamics in Poznań with Cholera Deaths Excluded (1850 to 1905). Note and Sources: same as for Fig. 3.
In the nineteenth century, the area within the walls of the city of Poznań was divided into five so-called police quarters (Polizeireviere), that were numbered with Roman numerals I to V (see Figure 1). [23] During the 1866 cholera epidemic, each quarter kept its own statistics on the number of the sick and the number of fatalities in homes located on streets belonging to a given quarter (see Figure 1). [24] Quarters I to IV were located on the left bank of the Warta river, while Quarter V was on its right bank. Quarter I encompassed the streets around the Old Market Square. [25] In 1866, 8,513 people lived there. Quarter II included the streets outside the Old Market Square but was still located within the city walls. [26] There were 8,631 people living in Quarter II in 1866. Quarter III had a population of 11,095 in 1866, [27] and there were 9,194 people living in Quarter IV. [28] Quarter V had a population of 7,706 at this time. [29] As can be seen in Figure 1, we have created another area that we call Quarter VI, [30] which covers the streets outside the fortress area and includes the suburbs of Poznań. This additional category was created to include all localities that were not in Quarters I to V. Altogether it had a population of over 52,000. [31]
In 1866, around 2,600 people died in the six quarters that made up Poznań. The 1866 cholera epidemic, that lasted for roughly four months between 18. June and 22. October, took a toll of over half of the total deaths that year. [32] The disease was probably brought in to one of the inns in the Old Market Square by raftsmen from Szczecin in June. [33] By mid-June, local newspapers warned the inhabitants of Poznań of an impending epidemic and reminded the city authorities to clean the gutters. [34] In the following weeks, the newspaper continuously reported about the epidemic and its death toll.
Despite the Prussian authorities using solutions tested in 1831 [35] and publishing relevant ordinances, as well as physicians following the state of the medical art at that time, the epidemic proved difficult to control. For the Prussian authorities, the war with Austria-Hungary was a priority, which undoubtedly influenced the course and dynamics of the cholera epidemic in Poznań, since it involved the movement of military transports, soldiers, and prisoners of war also via Poznań. [36]
The cholera-specific-mortality rates (CSMR) differed from one city quarter to another, due to the different prevalent conditions like access to clean water. [37] The values of the CSMR in quarters located on the left bank of the Warta were significantly lower than in Quarters V and VI, which were located on the right bank of the river. In Quarter I, the CSMR was at a level of 18 deaths per 1,000 population; there was a roughly similar level in Quarter II. In Quarter III, the CSMR exceeded 23 cholera deaths per 1,000 population, while the lowest values were recorded in Quarter IV: 16.5 deaths per 1,000 population. In Quarters V and VI, 54 and 50 people died due to cholera per 1,000 inhabitants respectively (see Table 1).
Mortality Rates in Poznań due to Cholera by Place of Residence, Religion and Sex of the Deceased (1866).
| Variable | Cholera-specific mortality rates (per 1,000 people) | Case fatality rates (per 100 infected) | Reported attack rates (per 100 people at risk) |
|---|---|---|---|
| Quarters | |||
| I | 18.10 | 65.5 | 3.1 |
| II | 19.34 | 65.3 | 3.4 |
| III | 23.40 | 70.0 | 4.0 |
| IV | 16.53 | 62.1 | 3.1 |
| V | 54.20 | 32.1 | 16.9 |
| VI | 49.62 | – | – |
| Religion | |||
| Catholic | 31.5 | – | – |
| Protestant | 31.0 | – | – |
| Jews | 6.8 | – | – |
| Sex | |||
| Female | 26.75 | 44.7 | – |
| Male | 19.78 | 44.5 | – |
Sources: Quarters I to V: Calculations are based on the number of residents and the recorded cases of those getting sick and deaths from cholera, see: Polizeipräsidium Posen, Die Cholera im Jahre 1866. Quarter VI: Calculations are based on the numbers of deaths from cholera in Kreis Posen Land derived from: Preussische Statistik, 1879, p. 429; data on population size for Kreis Posen Land in 1867 are derived from: Galloway, Galloway Prussia Database. Data on the number of Catholics, Protestants and Jews and the number of deaths from cholera in these groups are taken from: Samter, Zur Geschichte der Cholera, p. 300. In the case of cholera-specific mortality rates, the numbers of women and men by age were taken from: Galloway, Galloway Prussia Database; the numbers of cholera deaths for women and men by age were taken from: Polizeipräsidium Posen 5676, Die Cholera im Jahre 1866, 1866–1868. As for the case fatality rates for women and men, we used data on deaths in hospital until 23. July 1866 from T. Kaczorowski, Bericht über die Cholera-Epidemie des Jahres 1866 in Posen, in: Berliner Klinische Wohenschrift 9/2, 1872, p. 16.
A completely different perspective on the toll of cholera is provided by the ratio of the number of diagnosed cases to the number of deaths, the so-called case fatality rate (CFR). [38] In Poznań as a whole, the CFR was at 50 percent, which means that fifty out of 100 individuals with the infection died, while the other fifty recovered. However, differences in the CFR values can be observed in individual Quarters: in Quarters I and II, the CFR was 65 percent, which means that 65 people died of cholera out of 100, while 35 recovered. In Quarter III, the most densely populated area of the city, the CFR reached a level of 70 percent (ie. 70 of 100 individuals died while thirty people recovered). 62 percent died in Quarter IV (or 62 out of 100 infected). In Quarter V, located on the right bank of the Warta river, 32 sick individuals out of 100 died, but the others recovered. In other words, the incidence of cholera deaths in the whole population was lower on the left bank of the river (Quarters I to IV), but the severity of the disease measured by the number of deaths among diagnosed cases was greater there. The opposite was true in districts V and VI, where the incidence of cholera deaths was higher, but the severity of the disease was lower.
To investigate the acute cholera outbreaks and identify the exposures that contributed to the disease intensity, we used the reported attack rate (RAR). [39] In Quarters I to IV, the RAR ranged from 3 to 4 percent, which means that the risk of getting sick from cholera was three to four cases per 100 individuals at risk, while in Quarter V almost 17 per 100 people were at risk (see Table 1).
Cholera-specific mortality rates show that mortality from cholera among Catholics and Protestants was identical, but more than four and a half times higher than among the Jewish population (see Table 1). For the latter, the observance of ritual purity probably played an important role in the fight against the epidemic: Jews took care of their hygiene. It was compulsory to wash hands before and after a meal. [40] Interestingly, the CSMR was higher for women than for men, [41] which will be discussed in more detail below.
3 Data and Methods
Individual-level data on deaths in Poznań in 1866 was used in this study. Information was collected from parish death books characterized by a good continuity of registration. The books are deposited in the State Archive in Poznań. In total we gathered individual-level information on 2,643 deceased from death books of Catholic and Protestant parishes, including their sex, date of death, age at death, religion, place of residence, occupation (or in the case of children – their father’s occupation, and in the case of most of women – their husband’s occupation), and the recorded cause of death. We are certain to have collected all deaths recorded in 1866, including 100 percent of cholera deaths. This allows us to examine and compare all of the victims of the cholera epidemic in Poznań in 1866 recorded in the above-mentioned sources.
The fractions of cholera and non-cholera deceased by sex, age, religion, quarter of residence, occupation, and season of death in Poznań in 1866 are shown in Table 2. Here, it becomes clear, that women were more likely to die of cholera than men. For men, cholera deaths accounted for 52.5 percent of all deaths, with the remainder being deaths from other causes, but for women, deaths from cholera accounted for 57.5 percent of all deaths (Ch2=6.70, df=1, p<0.05). In the age groups 10 to 19 and 20 to 49, cholera deaths accounted for more than 70 percent of all deaths (or 76 percent and 71 percent respectively) (Ch2=233.9; df=4; p<0.0001).
Distribution of Cholera and Non-Cholera Deaths in Poznań in 1866.
| Variable | Category | Cholera deaths N (%) | Non-cholera deaths N (%) | Ch2 |
|---|---|---|---|---|
| Sex | Male | 666 (52.50) | 603 (47.52) | 6.70; df=1 |
| Female | 781 (57.51) | 577 (42.49) | p<0.05 | |
| Age at death | <10 yrs. | 489 (40.31) | 724 (59.69) | 233.96; df=4 |
| 10 to 19.9 yrs. | 114 (76.00) | 36 (24.00) | p<0.0001 | |
| 20 to 49.9 yrs. | 534 (71.20) | 216 (28.80) | ||
| 50 to 69.9 yrs. | 249 (65.87) | 129 (34.13) | ||
| 70+ yrs. | 64 (46.72) | 73 (53.28) | ||
| Religion | Protestants | 259 (51.80) | 241 (48.20) | 2.85; df=1 |
| Catholics | 1200 (56.00) | 944 (44.00) | p>0.05 | |
| Jews | n.a. | n.a. | ||
| City quarter | I | 267 (54.33) | 232 (45.67) | 64.08; df=5 |
| II | 32 (39.51) | 49 (60.49) | p<0.0001 | |
| III | 121 (46.01) | 141 (53.99) | ||
| IV | 338 (49.63) | 343 (50.37) | ||
| V | 307 (55.62) | 245 (44.38) | ||
| VI | 374 (68.37) | 173 (31.63) | ||
| Profession | Farmers & agricultural workers | 56 (57.14) | 42 (42.86) | 56.84; df=6 |
| Unskilled laborers | 291 (59.03) | 202 (40.97) | p<0.0001 | |
| Skilled laborers | 216 (45.86) | 255 (54.14) | ||
| White-collar workers | 85 (55.56) | 68 (44.44) | ||
| Other professions | 51 (59.30) | 35 (40.70) | ||
| Profession not recorded | 319 (68.45) | 147 (31.55) | ||
| Season of death | Winter | 0 (0.00) | 226 (100.00) | 882.11; df=3 |
| Spring | 1 (0.42) | 239 (99.58) | p<0.0001 | |
| Summer | 1138 (77.75) | 297 (22.25) | ||
| Autumn | 129 (38.05) | 210 (61.95) |
For both Catholics and Protestants, cholera accounted for more than half of all deaths each (51.8 percent for Catholics and 56 percent for Protestants) (p>0.05), and the difference between Catholics and Protestants in the share of cholera deaths vs. all deaths was not significant (see CSMR in Table 1).
We do not have access to the files of the Jewish population because they did not register in the same registers as Catholics and Protestants (for this reason, Jews are not included in Table 2.) However, a contemporary researcher found that out of a total of 7,366 registered Jews at this time, only 50 (or 6.8 per 1,000 people; see Table 1) died of cholera in Poznań in 1866. [42] The frequency of cholera deaths differed between city quarters (Ch2=64.08; df=5; p<0.0001). More than half of all deaths were caused by cholera in Quarter 1 (54.3 percent), Quarter V (55.6 percent), and Quarter VI (68.40 percent), while the lowest share of cholera deaths among all causes of death in 1866 was recorded in Quarter II (39.5 percent cholera deaths vs. 60.5 percent non-cholera deaths).
The variable occupation groups the adult deceased of both sexes into six categories: 1) farmers and agricultural workers (incidentally, there were farmers and agricultural workers in Poznań. The parishes of St. John and St. Adalbert had an urban-rural character and were mainly located in Quarter 5 and 4, respectively); [43] 2) unskilled labourers (e.g., daily labourers, hired workers, manual workers, workmen, servants, etc.); 3) skilled labourers (e.g., craftsmen, bricklayers, construction workers and builders); 4) white-collar workers (e.g., teachers, accountants, office managers, medical doctors, architects, lawyers, professors, pharmacists, judges); 5) other professions; 6) profession not recorded (this mainly includes widows and married women with the status registered as wife. These women probably did not work professionally because their husbands were the main breadwinners in the household. The category also includes widowers, who were probably no longer working). There were two occupations in which women were mainly represented: servants and workers (category 2).
The proportion of cholera deaths to all deaths was high in all occupational groups, indicating that cholera killed regardless of social and occupational status. However, the distribution of cholera and non-cholera deaths between the different groups was not equal (Ch2=56.8; df=6; p<0.0001). For example, farmers and agricultural workers were more likely to die from cholera than from other causes (57 percent vs. 43 percent). The same was true for unskilled labourers: almost 60 percent of them died of cholera, compared with 40 percent who died of other causes. Among white-collar workers, cholera deaths accounted for 55.6 percent of all deaths. Cholera victims included many people with no registered occupation (68.45 percent of cholera deaths vs. 31.55 percent of deaths from other causes), this is probably because poverty was strongly associated with the status of widowed people.
When looking at the seasonality of deaths, not surprisingly, the highest number of deaths were recorded in summer (or 77.7 percent of all summer deaths), followed by autumn (38 percent of deaths were due to cholera vs. all deaths). However, seasonality only plays a minor role here, since the epidemic only took place in the summer and ended in October 1866. [44]
Generalized Linear Models (GLMs) with binomial error distribution and the logit link function were used to test whether proxies for the socioeconomic status of Poznań citizens (like place of residence and occupation) had a significant effect on the likelihood of dying from cholera. We used a categorical variable as the dependent variable, taking the value zero for non-cholera deaths and one for cholera deaths. The place of residence and occupation of the deceased were the explanatory variables. We examined whether the probability of dying from cholera (the dependent variable) was higher on the right bank of the Warta (Quarters V and partially VI combined, coded as one) than on the left bank (Quarters I to IV, coded as zero). As shown in Table 1, the risk of contracting cholera was more than five times higher on the right bank of the Warta than on the left bank.
The second explanatory variable was high-risk occupation, which we classified based on the occupation of the deceased as recorded in the parish death books. Here we grouped occupations such as unskilled workers, minor craftsmen, and selected service workers as those potentially most exposed to the infectious agent due to the nature of their work, frequent contact with people, and lack of hygiene at home and work (this group was coded as one, the others as zero). The odds ratios and their 95 percent confidence intervals (CI) were calculated to characterize the effect of the explanatory variables on the binary response. Odds ratios allowed the assessment of the risk of cholera death according to place of residence and occupation. Area under the ROC (receiver operating characteristics) curves; AUC were calculated to assess model performance. The area under the ROC curve measures the decisiveness and accuracy of the model, i.e., it compares different models for a particular variable and assesses the performance of the model. [45] All statistical analyses were carried out using STATISTICA version 13.3. [46] Significance was set at p<0.05, p<0.001 and p<0.0001.
4 Results and Discussion
The model coefficients and odds ratios explaining the influence of both place of residence in Poznań in 1866 and high-risk occupation of the deceased on cholera death are presented in Table 3. The values of the GLMs show that residence on the right bank of the Warta river and performing high-risk professions affected the chance of death from cholera. The directions of the effects were positive, and odds ratios were above one, which means that the odds of the event (in this case deaths due to cholera) were higher for all residents on the right bank of the river than for those on the left bank and also for occupations with a higher risk of disease (unskilled workers, service workers, maids, laundresses, cleaners) than for others.
Model Coefficients and Odds Ratios for Place of Residence and High-risk Occupations.
| All deaths |
|||||
|---|---|---|---|---|---|
| Explanatory variables | Estimate | SE | +95 CL | –95% CL | OR (95% CI) |
| Right bank of Warta | 0.24 | 0.04 | 0.16 | 0.32 | 1.63 (1.39–1.91)* |
| High-risk occupations | 0.16 | 0.05 | 0.06 | 0.26 | 1.38 (1.12–1.66)** |
Deaths in hospitals excluded |
|||||
| Right bank of Warta | 0.29 | 0.04 | 0.21 | 0.37 | 1.80 (1.53–2.13)* |
| High-risk occupations | 0.16 | 0.05 | 0.05 | 0.27 | 1.39 (1.11–1.72)** |
Note: Abbreviations: SE – standard error; CL – confidence level; OR – odds ratio; CI – confidence interval. *Significant p<0.0000; **Significant p<0.005.
Living on the right bank of the Warta river increased the likelihood of dying from cholera by more than 60 percent, and when cholera deaths in hospital (which was located on the left bank of the river) were excluded from the material [47] – the odds ratio for cholera deaths rose to 80 percent on the right bank. Working in a high-risk profession increased the chance of dying from cholera by more than 30 percent. When cholera deaths in hospital were excluded, the odds ratio for high-risk occupations hardly changed. This seems to indicate that the poorer social groups that lived in places with bad environmental conditions had a higher risk of cholera. The ROC curves with AUC ranged from 0.76 to 0.78, showing that the accuracy of the model can be considered acceptable. The AUC offers an estimation of the probability of correctly classifying a random subject; in our case, it indicates the likelihood of correctly classifying a given case at 76 to 78 percent. [48]
The sanitary situation in nineteenth-century Poznań was very poor. The city was surrounded by fortifications and suffered from serious infrastructural deficiencies like no water supply or lack of a sewage system. The quality of water available left much to be desired. [49] By 1866, there was a water supply network in the ground, but it was not yet connected to houses or barracks. On 3. July 1866, early on after the cholera outbreak, the city council announced that Poznań residents could use drinking water deposited in containers on the streets free of charge. They also reminded residents of the obligation to flush the gutters, which were used to dispose of sewage. Unfortunately, nitric acid, chlorine, ammonia, and hydrogen sulphide had been detected in well water samples. [50] Despite the water being contaminated, it was still used for consumption. [51] Moreover, the chemical report indicated that water from the Warta river, which was used for consumption, contained large amounts of diatoms. The poor condition of the river water resulted from the discharge of sewage through canals directly into the Warta. [52] Nevertheless, some areas of the city were privileged in terms of hygiene levels. Quarter I and Quarter II were located on the left bank of the Warta and had better city infrastructure. Around the Old Market Square there were fountains fed by water transported from outside the city. Sanitation was also better, as three sewage disposal canals had already been built and put in use thanks to the efforts of the city magistrate. [53] Additionally, the neighbourhood west of the Old Market Square had been built according to the newest urban development standards (Quarter IV). [54]
In Quarter I there was a cholera infirmary that had been converted from a municipal hospital, where cholera patients with severe symptoms were admitted. [55] This could have increased the number of cholera deaths in this quarter, which was on the left bank of the river. We, therefore, performed a further analysis in which all cholera victims who died in hospital were excluded from the total number of cholera deaths in 1866. This increased the odds ratio for cholera deaths on the right bank (see Table 3), confirming that mortality was very high on the right bank compared to the left bank of the city (see statistics in Table 3 vs. Tables 1 and 2).
The distribution of the fractions of cholera deaths was predominant in Quarters V and VI (see Tables 1 and 2). According to contemporary author Joseph Samter, cholera appeared in 622 out of 1,225 households in the city (50.7 percent), while 603 households remained cholera free. [56]
In Chwaliszewo, which belonged to Quarter V, the course of the epidemic was the most dramatic: here only 40 out of 270 households were free of cholera (vs. 85 percent with cholera). In the nineteenth century, Quarter V was very neglected and underinvested, inhabited mainly by unskilled and skilled workers (the latter were mainly minor craftsmen). A large group of people living in this quarter were migrants from surrounding villages. [57] The dwellings were overcrowded to the limit; rooms must have been stuffy and damp. Sanitary conditions were particularly bad. Primitive gutters had insufficient drainage; during the summer heat, water and sewage were retained and quickly putrefied. Drinking water was drawn from shallow wells and moats, their quality was marred by substances from cesspits and sewage. Sewage was drained directly into the Warta river, from which water was drawn for consumption at the same time. In the spring and summer period, residents washed their clothes in the nearby Cybina river, from where they also drew drinking water. There was a lack of pavements, which caused water and sewage to accumulate on the street in the summer. [58]
In Prussian statistics, there were 2,609 deaths from cholera recorded in the Poznań County (Kreis Posen Land), which included the rural areas outside Poznań (some of these areas were assigned to Quarter VI). [59] The total death toll was higher than in the city. The level of hygiene was very poor in these areas and the awareness of how to cope with infectious diseases seemed non-existent. Deaths from other waterborne diseases like gastrointestinal diarrhoea and dysentery were three times higher than in other parts of the city. Many of the victims of such diseases were infants and children aged 2 to 14 years. [60] The rural population neglected basic hygiene rules when cooking, preparing and eating meals. [61] The main problem was the lack of access to clean water. [62]
The high temperatures of the summer contributed to the spoilage of food and water and the spread of infections. [63] In the summer of 1866, there were 34 days that were considered heat waves: 17 days in June, five days in July, five days in August and seven days in September were particularly hot. [64] The average temperature in June was 32.5°C, and this long-lasting heat at the beginning of the cholera outbreak, probably exacerbated its severity. [65]
Poverty and the associated poor housing and sanitary conditions also favoured the development of the cholera epidemic. As a result, the risk of dying from cholera was higher for the high-risk occupational group, which represented the poorest sections of society. Fishermen, washers and street cleaners were arbitrarily included in this group. All had more frequent contact with the infectious agent. These people lived and worked in the worst conditions and only earned an average of 500 to 600 marks per year, most of which was spent on rent. After paying the rent, a worker had less than one mark per day to feed the whole family. For many unskilled workers, the working days in overcrowded factories and workshops were long and working conditions poor. In workshops, the twelve-hour working day was often extended to 16 hours. [66] Many such workers and their families were undernourished. As a result, they were unable to fight the infection effectively. In addition, there was a lack of hygiene habits.
Servants were also grouped among the high-risk professions. Women predominated in the group of servants. In 1885, men only made up 3.9 percent of all servants, while altogether there were some 2,433 women working as domestic servants. [67] Women had the most frequent contact with contaminated water when cooking and preparing food, cleaning houses and toilets, doing laundry, washing dishes, etc. [68]
Figure 5 shows Cholera-specific Mortality Rates (CSMR) by sex and age during the 1866 cholera epidemic in Poznań. Cholera mortality rates were higher for women aged 20 and older, than for men (except for men between the ages of 41 and 50). During the cholera outbreak in Hamburg in 1892, domestic servants were also the main victims of the cholera epidemic. [69] However, married women from poorer families usually performed the same tasks as the servants and had the same level of risk (see category Profession not recorded in Table 1).
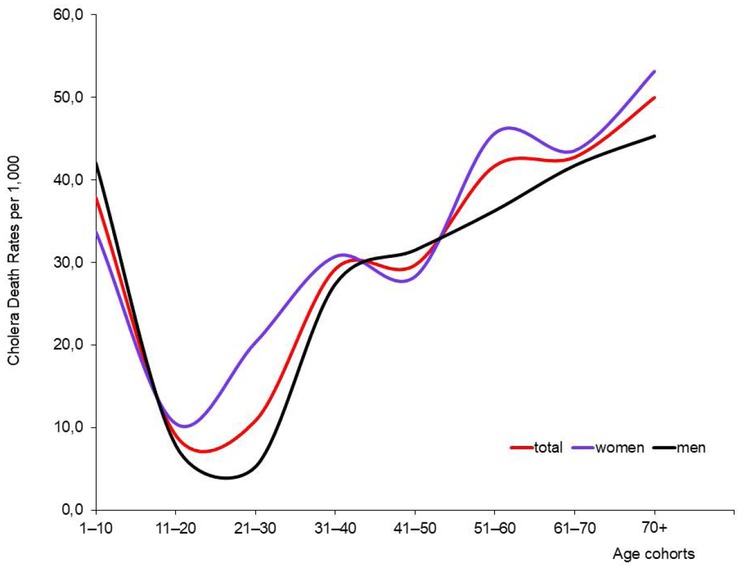
Cholera-specific Mortality Rates by Age and Sex. Note: CSMRs were calculated by the authors. Sources: The numbers of women and men by age were taken from Galloway, Galloway Prussia Database; the numbers of cholera deaths for women and men by age were taken from: Polizeipräsidium Posen 5676, Die Cholera im Jahre 1866.
5 Research Limitations and Opportunities
The paper is not free of research limitations. The first is the lack of information on the population at risk by occupation. This does not allow us to calculate cholera-specific mortality rates by occupational groups. Another limitation is the lack of data on the number of cholera patients who died from cholera by occupation, age, sex, or religion. This made it impossible for us to calculate epidemiological rates such as CFR (case fatality rates) or RAR (reported attack rates) by social and biological determinants (age and sex), to estimate the probability of survival, and thus to conduct more in-depth analyses.
Family history reconstructions using individual information on births, marriages and deaths would provide even better data than just death files, as they would allow for the examination of mortality from cholera within families.
Address books are another interesting source for research on the cholera epidemic in 1866 since they contain information about people registered at a given address by the police. [70] A comparison of address books from before and after the 1866 epidemic shows that after the epidemic ended, the Śródka district (Quarter V) lacked 63 workers, 14 female workers, 25 minor craftsmen, and two servants. The Chwaliszewo district (Quarter V), lacked 79 workers, nine female workers, 51 farm hands, 251 minor craftsmen, and two laundresses after the epidemic. This suggests that these professional groups experienced losses due to cholera-related deaths. However, we must remember that people disappearing from a given address after 1866 did not necessarily die of cholera, although many probably did. They may have died of other causes, married, moved to another part of the city or migrated elsewhere. [71]
6 Summary and Conclusions
The decision made by the Prussian administration to transform Poznań into a fortress and enclose it within walls did not favour its development. In the 1860s, the abolition of permanent residence fees encouraged people to move to Poznań and settle within the city walls. Migration intensified, especially after 1870, when demand for labour in the city increased. Due to a lack of free space in the already overpopulated city centre, immigrants settled on the outskirts of the city, mainly on the right bank of the Warta River. The overpopulated city, which had a large proportion of the poorest people and insufficient urban infrastructure, including sanitation, was hit by epidemics of infectious diseases, including cholera. Between 1831 and 1866, Poznań experienced as many as six cholera epidemics. Therefore, the 1866 epidemic was not an unknown phenomenon for the city’s residents, administration and doctors. Nevertheless, it claimed many lives, accounting for more than half of all deaths in 1866. [72]
In 1866, victims of cholera included people of all genders, ages, religions and occupations. However, our research showed some striking differences by various groups. In addition to those who were professionally active and had more frequent contact with infectious agents, infected people and the sick, children and the elderly were also at risk of dying from cholera. The elderly are unable to tolerate the fluid loss caused by diarrhoea and vomiting. Similarly, the immature organ functions of young children mean that they are unable to compensate for fluids lost in this way. [73]
The poorest parts of society, such as unskilled labourers, small artisans and servants, were at particular risk of contracting the infectious agents and dying from cholera due to their poor living conditions including poor hygiene, malnutrition, lack of awareness of the risks associated with their work, contact with bad quality water, etc.
The mortality rates from cholera were higher for women than for men in almost all age groups. Cholera is a water-borne disease, and women were primarily responsible for domestic duties using water, such as cleaning, cooking and laundry, as well as sometimes caring for the sick. They had more frequent contact with the infectious agents than did most men.
When it comes to age, professionally active people were at a higher risk of dying from cholera than were children and the elderly. This may have been due to their increased activity levels, professional contacts and movement within the city.
The social status of Poznań’s inhabitants was connected to their profession, place of residence and place of work. Poorer social groups more often lived in neglected districts on the right bank of the Warta, which were characterised by bad sanitary conditions and a lack of infrastructure. The work they did and the places they lived in posed a higher risk of contracting and dying from cholera than for wealthier groups living on the left bank of the Warta. This does not mean that cholera did not affect the left bank at all. Although the rate of deaths from cholera per number of inhabitants was lower, the number of deaths among diagnosed cases was higher there.
Our research reveals the complex dynamics of cholera in the 19th century. When studying cholera epidemics, it is necessary to consider many variables and how they interact with each other. Simply looking at death tolls alone does not tell the whole story. For Poznań, the 1866 epidemic was the second-to-last one. The city was plagued by cholera only one more time, in 1873, but with less severity. By the late 19th century, improved sanitation finally led to conditions that no longer allowed cholera to break out fatally.
About the authors
Grażyna Liczbińska is a human biologist. She is an associate professor at the Faculty of Biology, Adam Mickiewicz University in Poznań, Poland. Her main scientific interests are related to biology and demography of populations from the past, with a special emphasis on the impact of social inequalities, human ecology, environmental stress related to biological and health status and social mobility, as well as positive and negative determinants of health.
Jörg Vögele is Professor of Modern History. He studied History in Konstanz and Bristol, worked as lecturer in Konstanz, Research Fellow in Liverpool and Assistant Professor in Düsseldorf. From 2003 to 2015 he acted as Managing Director of the Institute for the History of Medicine at the University of Düsseldorf, since 2016 he is Deputy Director of the Department of History, Philosophy and Ethics of Medicine, University of Düsseldorf. He was a Fellow of the University of Liverpool and Visiting Professor at Charles-University in Prague.
Acknowledgement
This work was supported by the National Science Centre, Poland, under the grant Cholera epidemic in 1866 as a turning point in the history of Poznań, No. UMO-2021/41/B/HS3/00594.
© 2025 Grażyna Liczbińska/Jörg Vögele, published by De Gruyter
This work is licensed under the Creative Commons Attribution-NonCommercial-NoDerivatives 4.0 International License.
Artikel in diesem Heft
- Frontmatter
- Obituary for Eckart Schremmer
- Special Issue Articles
- Epidemics and Pandemics in Economic-historical Perspective – An Introduction
- Cholera in the City of Poznań: Did the Death Toll of the 1866 Cholera Epidemic Reflect Social and Economic Differences?
- The Mortality Impact of Cholera in Germany
- When Diseases Return from the Epidemiological Honeymoon: The Reemergence of Smallpox in 19th Century Germany and its Lessons for Public Health Policies after COVID-19
- On the Economic Costs of the Spanish Flu Pandemic in Germany: An attempt at Assessing GNP Lost for 1918
- Malaria in Catania/Sicily: Local Manifestations and International Scientific Cooperation During a Pandemic in the 1920s
- Geographical Aspects of Diphtheria in England and Wales: Immunisation and the Spatial Sequence of Retreat to Effective Elimination, 1921 to 1964
- Pandonomics: Why Economics was Unprepared for COVID-19-Policies
- Research Forum
- “Stupid” German Money? Bonus Interest Rate Payments on Savings Deposits During the Stagflation of 1967 to 1984
- Geography and Space in Recent Economic History