The Mortality Impact of Cholera in Germany
-
Kalle Kappner
Kalle Kappner wurde 2021 an der Humboldt-Universität zu Berlin promoviert und forscht seitdem an der Ludwig-Maximilians-Universität München. Er hat zahlreiche Beiträge zu stadt-, umwelt- und seuchengeschichtlichen Themen veröffentlicht, unter anderem imJournal of Urban History und inExplorations in Economic History .

Abstract
This paper presents the first comprehensive quantitative account of epidemic cholera in 19th-century Germany. Using a new dataset based on archival sources, it documents nearly half a million cholera deaths, along with outbreak timing and population at risk, across 2,685 cities and 852 rural counties within the 1871 German Empire. Five stylized facts come to light: First, cholera was primarily an urban disease, with city death rates averaging 3.5 times higher than in rural areas. Second, mid-sized cities (1,000 to 3,000 inhabitants) were the most severely affected. Third, cholera’s geographic epicenter focused on the less developed north-eastern territories (Central Poland today) but shifted South-West over time. Fourth, outbreaks spread more rapidly across regions and within cities over time, despite declining overall mortality. Fifth, local epidemics converged in severity across locations but became more spatially clustered over time. Understanding these complex patterns requires analysis of cholera’s interaction with dominant trends of 19th-century Western development, including public health reforms, urbanization, market integration, and political change. While the rich cholera historiography has long recognized these links, it merits greater attention from quantitative social scientists, including economic historians. Datasets like this one are the foundation for such research.
1 The Continuous Significance of Cholera
Epidemic cholera claimed the lives of almost half a million people in Germany between 1831 and 1895, the years spanning the country’s first and last major outbreaks. This paper offers the first comprehensive and precise account of cholera’s mortality patterns, drawing on a new dataset covering 2,685 cities and 852 rural counties within the 1871 German Empire. Cholera – a highly contagious and often lethal diarrheal disease – became emblematic of industrialization, urbanization, and globalization as it swept across the globe in multiple pandemics during the 19th century. [1] While now a matter of the past in the Western world, cholera’s global and historical importance has kept it at the center of a vibrant literature in medical, social, and increasingly, economic history. I argue that this literature stands to benefit significantly from a more quantitative, data-driven perspective, making use of the rich epidemiological data that archival sources offer.
At the core of this paper is a newly assembled dataset, compiled from archival and supplementary sources, and covering the territory of the 1871 German Empire. The dataset includes annual cholera deaths, population at risk, and outbreak start and end dates. Analysis of this data yields five stylized facts about cholera in Germany. First, despite notable rural outbreaks, cholera was primarily an urban phenomenon, with cities experiencing death rates 3.5 times higher than their rural surroundings. Second, mid-sized cities with populations of 1,000 to 3,000 were most severely affected – a pattern observed both in cross-sectional comparisons and as individual cities expanded over time. Third, the severity of cholera was initially concentrated in Germany’s historical North-East (in the region that now includes central and northern Poland) before shifting to the South-West over time. Fourth, epidemics diffused more rapidly across space and developed faster within cities as time progressed. Fifth, outbreaks became increasingly localized, transforming from a broadly shared experience into rarer, regionally concentrated events.
Although cholera was not the deadliest disease of the 19th century, its periodic outbreaks instilled widespread fear and uncertainty because of their sudden onset and mysterious nature. The disease was deeply entangled with industrialization, urbanization, and other modernization processes. Research has, for example, linked cholera to 19th-century sanitary reform movements, social struggles, wars, and the emergence of global public health cooperation. Moreover, contemporary outbreaks in developing regions echo aspects of 19th-century epidemics, ensuring that historical cholera continues to attract scholarly attention. This sustained interest is reflected in a vast body of qualitative research – including detailed case histories of Victorian London, post-revolutionary Paris, and the notorious 1892 Hamburg outbreak – as well as studies examining cholera’s impact across nations and regions, such as in Africa, the United States, and France. [2] Comprehensive global overviews have also been published. [3]
Despite this rich literature, cholera has attracted limited engagement from quantitative social scientists. For instance, a recent survey of data-driven historical pandemic studies identifies just four papers on cholera compared to 97 on the 1918/1919 Influenza – a stark contrast to cholera’s prominent position in historical demography and the qualitative research literature. [4] This gap highlights untapped potential: explicitly causal, quantitative frameworks can assess the extent to which prominent cholera narratives generalize beyond case studies and evaluate their quantitative importance. One example is the claim that cholera epidemics propelled the development of public health and sanitation reforms in 19th-century Western societies. Although this idea gained renewed attention during the COVID-19 pandemic, questions remain about the underlying mechanisms, the necessary societal and political preconditions, and the overall role of epidemics as drivers of social change. [5] The benefits of a data-driven approach are evident from the growing quantitative literature on other pandemics, such as the Black Death and the 1918/1919 Influenza pandemic. [6] Developing high-quality datasets – such as the one presented here – is a crucial first step toward systematic quantitative analysis of cholera’s social, economic, and political impacts. Germany, because of its size, central European position, and rich geographic variation, is an excellent starting point for this endeavor. [7]
In section 2, I introduce the new dataset on Germany’s historical cholera mortality, discuss the historical origins of quantitative cholera historiography, and validate the data against three independent sources. Section 3 contextualizes Germany’s cholera experience by comparing its aggregate temporal and spatial patterns to those of neighboring countries and other major epidemic diseases; in this section, I also present the five stylized facts outlined above. Section 4 discusses the potential for a data-driven approach to cholera’s social history by highlighting five intriguing narratives and hypotheses from the literature. Section 5 concludes.
2 A Dataset of German Cholera Epidemics
This paper presents the first comprehensive quantitative account of Germany’s cholera history. The dataset documents almost half a million cholera deaths between 1831 and 1895, coded at the level of 2,685 cities and 852 time-consistent rural areas. [8] It also includes annual population estimates for these reporting units, as well as start and end dates for each outbreak. This data effort builds on a long tradition in historical epidemiology, aiming to document cholera’s spatial and temporal patterns. In the 19th century, European governments produced a large number of quantitative reports in the aftermath of major cholera outbreaks. An impressive example is the French government’s comprehensive municipality-level report on the 1854 epidemic. [9] For Germany, similar reports were published for the 1873 and 1892 outbreaks, but political fragmentation before German unification in 1871 hindered earlier comparable efforts across the entire territory. [10] A second wave of quantitative cholera research emerged in the 1930s to 1950s, after cholera had largely disappeared from Western countries. This included retrospective geo-medical studies for various nations, such as Austria, Great Britain, Russia, Switzerland, and France. [11] For Germany, Walther Krehnke assembled a detailed collection of quantitative evidence on major cholera events. [12] As these studies rely heavily on the government-issued reports mentioned above, rather than archival sources, they lack both spatio-temporal detail and consistency, and often remain vague on smaller epidemics. [13] More recently, spatially and temporally consistent cholera datasets have been constructed for countries such as Italy, England, Japan, and India. [14] However, no dataset seems to match the present one in terms of its spatio-temporal granularity and completeness. [15]
Constructing the dataset, I draw on a broad range of sources, including official reports, archival materials, and secondary literature. Like most other European states, Prussia and the other German territories started registering and publishing official cause-of-death statistics only in the second half of the 19th century (e.g. 1862 in Prussia), and thus well after the most important cholera waves. For this reason, it is generally not possible to comprehensively reconstruct the earlier patterns of cholera epidemics from official vital statistics. [16] Thus, the primary sources used for this dataset were archival materials, consisting mainly of official correspondence between government bodies on local outbreaks, often featuring precise tabulations. In addition, governments issued outbreak reports, which often provided disaggregated data for certain outbreaks and certain regions, and which have also been included in the dataset. Supplementary data was gathered from medical journals, public health treatises, and local newspapers. About 83 percent of the cholera figures in this dataset come from such contemporary sources, with archival evidence covering most cases.
Additional estimates were derived from later historical treatises. These are often based on archival material that is no longer available. [17] In a few cases, primary or secondary sources suggest an outbreak for a specific year in a specific region, but no quantitative data at the required granularity is available. In such instances, I approximated local death counts using excess crude mortality, other close correlates, or data available at coarser spatial levels. As a general rule, the absence of evidence for an outbreak across a wide range of sources was taken as evidence for the absence of cholera. This is a reasonable assumption for Germany, where cholera’s high public profile and reporting standards precluded deliberate cover-ups or war-related underreporting, unlike in other prominent cases like Portugal (1833), Hungary (1848/1849), and Italy (1911).
Cholera death counts were transcribed verbatim from original sources, without adjustment for values that appeared unexpectedly high or rounded. However, I corrected unambiguous summation errors in the process. Although reporting errors could arise from misattributed causes of death, cholera’s distinct symptoms meant it was generally well recognizable, and local authorities had strong incentives to report fatalities accurately. While underreporting was common for non-fatal cases (due to asymptomatic cases or comorbidities), the same does not apply to fatalities. [18] In Germany, unlike e.g. in England, officials were careful to distinguish epidemic cholera from the milder, endemic European cholera (or cholera nostras) and other diarrheal diseases. [19]
The dataset divides the German territory as of 1871 into a time-constant set of 852 territorial units (counties) to facilitate comparability over time and statistical analysis. The imposition of time-constant reporting units implies some anachronistic choices, given Germany’s administrative reorganization and territorial expansion over the studied period. [20] Apart from the rural units, 2,685 cities were defined using a compromise between different requirements: with few exceptions, all locations that possessed a town charter or were considered a titular city at any point between 1831 and 1914 are included. I also included other locations listed in the Deutsches Städtebuch, a German city encyclopedia. [21] Rural counties and cities add up to a total of 3,537 units.
Apart from fatality counts, the dataset also reports outbreak start and end dates. This information was typically reported along with death counts, but where it was missing, alternative sources were cross-referenced. Preference was given to dates unambiguously marking the first and last fatalities in each location. In some cases, however, the dates mentioned in the original sources might correspond to the first and last diagnosed case, or the day it was officially registered. Given cholera’s short incubation period and high fatality rate, any discrepancy between case onset and death should be minimal. [22] The dataset also includes annual population estimates for 3,537 units from 1831 to 1895, facilitating mortality rate calculations. Population data were collected primarily from the official reports for the territorial, and later Imperial, censuses conducted at 3 to 5-year intervals over much of the 19th century. However, detailed population data (including counts for individual cities) is scarce for some non-Prussian German territories before 1871, making interpolations necessary. [23] While some sources report age- or sex-specific death counts (and populations), such information was not included in the dataset due to a lack of systematic data. [24]
In appendix A, I conduct three quantitative validity checks on my dataset: First, I demonstrate that cholera death rates are highly correlated with all-cause excess mortality rates derived from independent civil registration data. Second, I validate local cholera outbreaks against a risk model that incorporates three reliably measurable environmental and infrastructural factors – temperature, rainfall, and water quality – and their interactions. Third, I compare mentions of cholera outbreaks and death counts for these, to an alternative source that contains selective reports on cholera outbreaks in Germany. In appendix B, I detail all sources and assumptions, territory by territory.
3 Cholera in Germany: Basic Patterns and Five Stylized Facts
This section explores the basic spatial and temporal patterns of cholera outbreaks in 19th-century Germany, using the dataset described earlier. To put cholera into perspective, Table 1 provides mortality estimates for major pandemic outbreaks in German history.
Mortality during Major Pandemics in Germany.
| Disease | Period | Total Deaths (in percent) |
|---|---|---|
| Plague | 1347 to 1353 | c. 3 million (20 to 25) |
| Smallpox | 09/1870 to 06/1873 | 181,067 (0.44) |
| Influenza | 10/1918 to 03/1919 | 263,328 (0.41) |
| COVID-19 | 03/2020 to 05/2023 | 174,490 (0.21) |
| Cholera | 05/1831 to 01/1838 | 63,603 (0.21) |
| Cholera | 01/1848 to 01/1861 | 221,124 (0.62) |
| Cholera | 08/1865 to 11/1874 | 175,937 (0.43) |
Note: Mortality estimates refer to Germany’s respective territory in each period. Deaths per capita are computed using the mean population during each outbreak, or, directly quote the sources. Other important epidemic outbreaks in German history include typhoid fever during the Thirty Years’ War (1618 to 1648), the Russian flu (1889/1890), diphtheria (19th century) and AIDS (20th century). The COVID-19 pandemic was ongoing as per October 2025, although the WHO ended the global emergency in May 2023. Sources: Own calculations based on plague mortality from Jedweb/Johnson/Koyama, Economic Impact, p. 137; smallpox mortality from Reichsgesundheitsamt, Blattern und Schutzpockenimpfung. Denkschrift zur Beurteilung des Nutzens des Impfgesetzes vom 8. April 1874 und zur Würdigung der dagegen gerichteten Angriffe, Heidelberg 41925; Influenza mortality from M. Förtsch/F. Rösel, The Spanish Flu Killed 260,000 in Germany in 1918, in: ifo Dresden berichtet 3/2021, 2021, pp. 6-9; and COVID-19 mortality from World Health Organization, COVID-19 dashboard: Cumulative deaths until May 5, 2023, https://data.who.int/dashboards/covid19/deaths (15.02.2025).
When comparing per-capita mortality across pandemics, it must be noted that their durations differ. The second cholera pandemic (1831 to 1838), the third cholera pandemic (1848 to 1861), and the fourth cholera pandemic (1865 to 1874) together produced death tolls comparable to the 1918/1919 Influenza pandemic, although cholera spread over multiple years rather than a few months. The devastating 1870 to 1873 smallpox outbreak, exacerbated by the Franco-Prussian War, resulted in a similarly high death toll. Cholera had a significant impact on all-cause mortality, as shown in Panel a of Figure 1. The figure plots annual mortality rates in Germany from 1820 to 1914, highlighting years in which cholera accounted for more than 1 percent of recorded deaths. Many of the deadliest years – 1831 (3.04 deaths per 100 population), 1848 (2.9), and 1866 (3.06) – were such cholera years. This long-run perspective also suggest that cholera’s emergence coincided with elevated mortality rates beginning in the 1830s, while its decline after the mid-1870s aligned with a long-term reduction in general mortality. Multiple factors contributed to Germany’s mortality transition, but cholera’s rise and fall seems to have played a crucial role. [25]
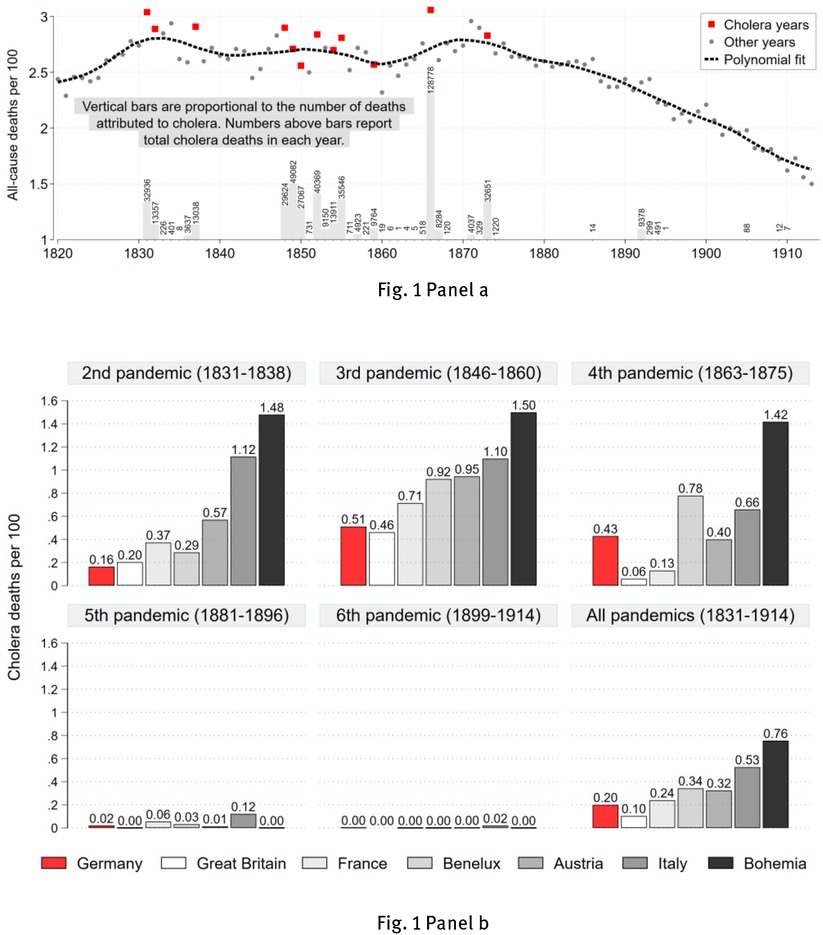
Cholera Mortality in Germany and Neighboring Countries, 1820 to 1914. Note: Panel a shows annual all-cause deaths per 100 for Germany within 1871 borders. Years in which cholera deaths account for at least 1 percent of all deaths are highlighted with a red square marker. The dashed line results from a local polynomial regression. Vertical bars in the lower part of the figure are proportional to the number of cholera deaths in each year; the associated labels give the death count. Panel b shows cholera deaths per 100 per pandemic for seven historical European states. The population at risk is measured for 1830, 1850, 1870, 1890, and 1910. The bottom-right bar chart presents the population-weighted average over pandemics per country. Sources: All-cause deaths and population counts are calculated from B. Mitchell, European Historical Statistics, 1750–1970, London 1975, here pp. 104-116.
Panel b of Figure 1 compares Germany’s cholera incidence to neighboring countries, including Great Britain, France, the Benelux states, Austria, Italy, and Bohemia (Czech Republic today). During the 2nd and 3rd cholera pandemics, Germany experienced relatively low cholera mortality compared to neighboring countries, including the United Kingdom in 1831 to 1838. However, by the 4th cholera pandemic, Germany’s incidence surpassed that of France and Britain, placing it in a middle position. Like most of Western Europe, Germany saw little cholera activity during the 5th and 6th pandemics (1881 to 1896, 1899 to 1914). Aggregating across all pandemics, Germany’s overall cholera incidence was at the lower end across countries
Turning to the spatial and temporal patterns within Germany, Figure 2 maps variation in outbreak intensity across Germany during the four major pandemics. Below each map, histograms show the number of locations (cities and rural counties) with active cholera cases by day, illustrating the temporal trajectory of outbreaks. These graphs highlight both commonalities between pandemics, and significant spatial and temporal heterogeneity across them. The remainder of this section condenses the patterns found here into five stylized facts.
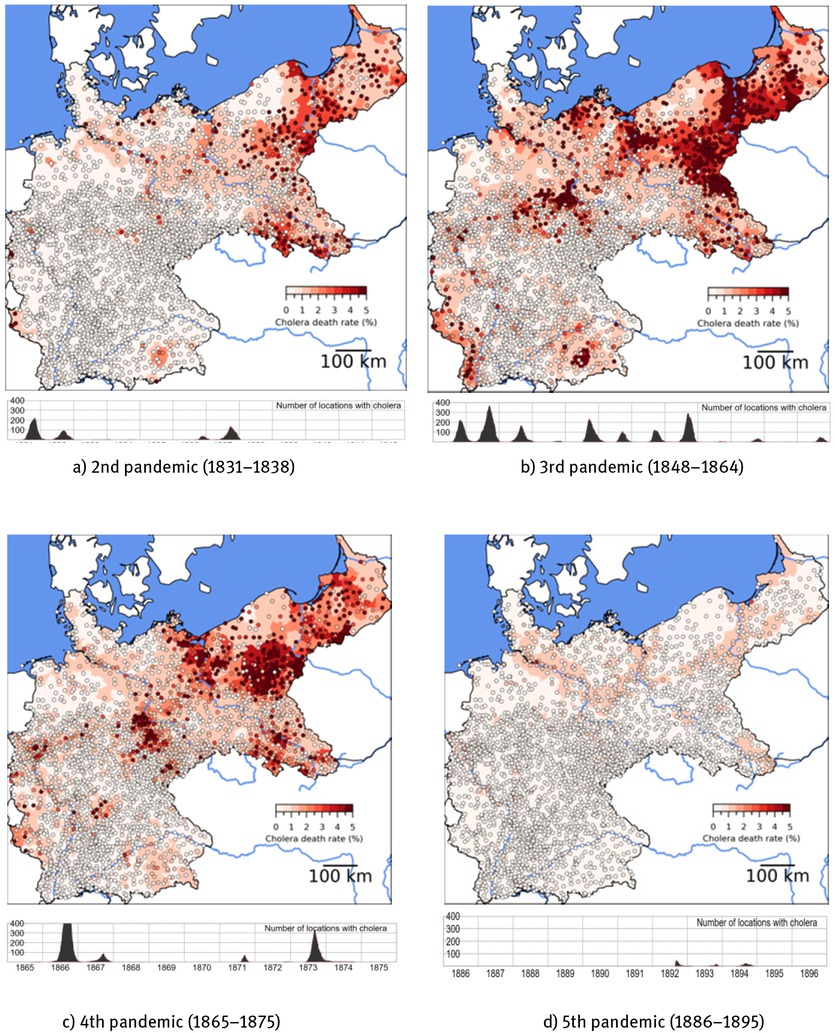
The Spatial and Temporal Distribution of Cholera in Germany. Note: Each panel shows maps that include 2,685 cities and 852 rural counties in Germany, colored by cholera mortality, calculated as cholera deaths divided by mean population during each pandemic. Black lines indicate national borders; blue lines mark major rivers (Rhine, Elbe, Oder, Vistula, and Neman). Below each map, a histogram displays the number of locations with active outbreaks per day during the pandemic. The October 1866 epidemic peak in Panel c, with over 800 active locations, is cropped to better show variation across other pandemics. Sources: Figures 2 to 7 are based exclusively on the original dataset presented in this paper.
Stylized fact 1: Cholera was disproportionately urban
Cholera was predominantly an urban phenomenon with city death rates consistently outpacing rural ones – at times by an order of magnitude. Figure 3 presents two complementary measures for this urban cholera penalty.
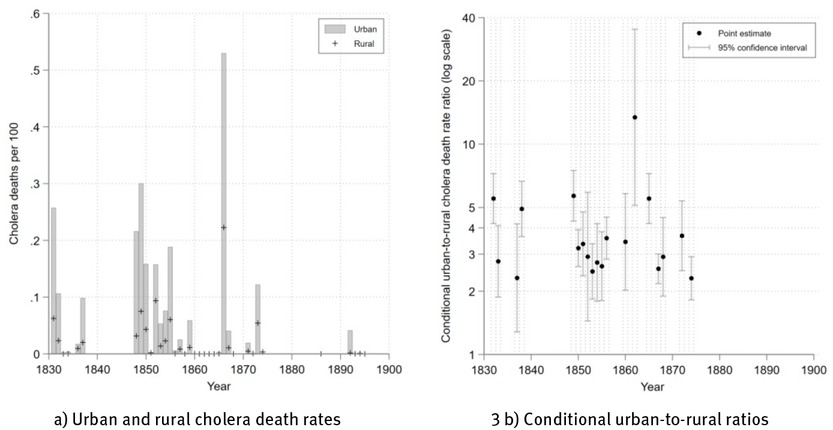
Urban Excess Cholera Mortality over Time. Note: Panel a displays annual average cholera death rates as percentages in urban areas (gray bars) and rural areas (black pluses). Panel b plots exponentiated coefficient estimates from a panel regression of logged death rates on a year-interacted urban dummy variable, controlling for time and county fixed effects. For example, a value of 3.5 indicates that cholera death rates were 3.5 times higher in urban areas than in their immediate rural hinterlands, conditional on time-constant cross-location heterogeneity and overall time trends. Gray spikes in Panel b denote 95 percent confidence intervals, and coefficients with a significance level below 1 percent are omitted. Ratios are displayed on a logarithmic scale for clarity.
Panel a of Figure 3 displays the annual average cholera death rate (in percent), separately for urban and rural areas. Urban areas consistently exhibited much higher mortality rates than rural areas. This difference scaled with overall cholera severity and was most pronounced during major outbreaks (e.g. 1831, 1849, 1852, and 1866). Panel b offers a refined perspective by showing conditional urban-to-rural cholera death rate ratios. These are estimated in a regression model that compares cities specifically to their immediate rural hinterlands. This approach controls for shared local conditions – geography, climate, and some socioeconomic factors – and isolates the urban-specific cholera penalty (see Figure note for details). On average, urban areas experienced cholera death rates 3.5 times as high as those in their rural surroundings. This relative urban penalty remained mostly stable over time but reached a factor of 15 during the particularly devastating 1866 outbreak.
Stylized fact 2: Mid-sized cities were most affected
Not all cities were affected equally by cholera; population density played a critical role. Panel a of figure 4 presents binned scatter plots showing the variation in cholera death rates across city size, separately for each pandemic. Polynomial regression fits (thick lines) exhibit an inverse U-shape, particularly during the 2nd and 3rd cholera pandemics (1831 to 1838 and 1848 to 1864, respectively). Death rates peaked in mid-sized cities with approximately 3,000 inhabitants, while both smaller and larger cities experienced significantly lower mortality. In contrast, rural areas (dashed lines) displayed a more monotonic upward trend, with higher death rates in more populous rural regions. [26]
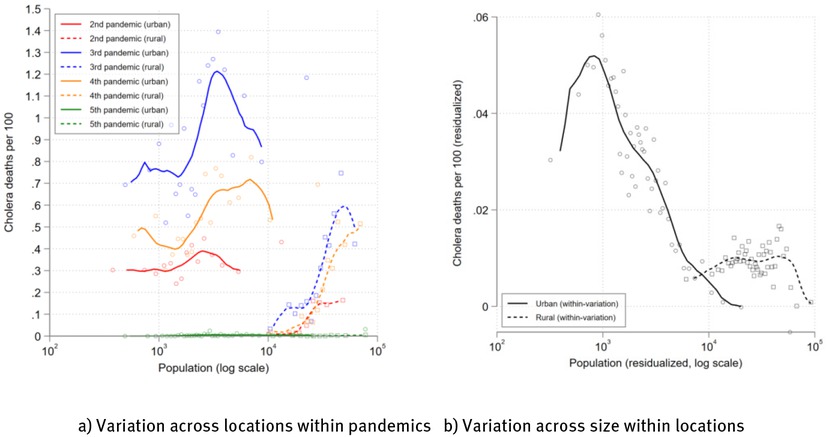
Population Size and Cholera Mortality. Note: Panel a shows average cholera death rates by population size bins, separately for urban (circles and solid lines) and rural (squares and dashed lines) areas. Pandemic-specific death rates were calculated by pooling all cholera deaths and dividing them by mid-pandemic population. Panel b shows residualized cholera death rates, pooling all years (1831 to 1895), but controlling for location and region-specific time fixed effects. This reflects within-location differences over population size levels, abstracting from time-constant local factors and shocks common to all locations in a region. Fit lines stem from local polynomial regressions, and population size is shown on a logarithmic scale for clarity.
Panel b of Figure 4 shifts the focus from comparing differently sized locations during a given pandemic to comparing a single location to itself at different population-size levels. Specifically, the panel shows residualized death rates and population levels after controlling for all time-constant location characteristics and region-specific time trends in a two-way fixed effects model. The inverse U-shape persists: for an average city, death rates increased with population size up to a threshold (1,000 inhabitants), then declined as population size grew larger. A similar, though less pronounced pattern, is visible for rural areas.
Stylized fact 3: Cholera began in the North-East and shifted South-West over time
Figure 2 highlights a strong Eastern bias in cholera exposure, with high mortality clusters in Imperial Germany’s easternmost territories, particularly around what is Central Poland today. Figure 5 further explores this geographical bias and reveals a gradual South-West shift in cholera’s epicenter over time.
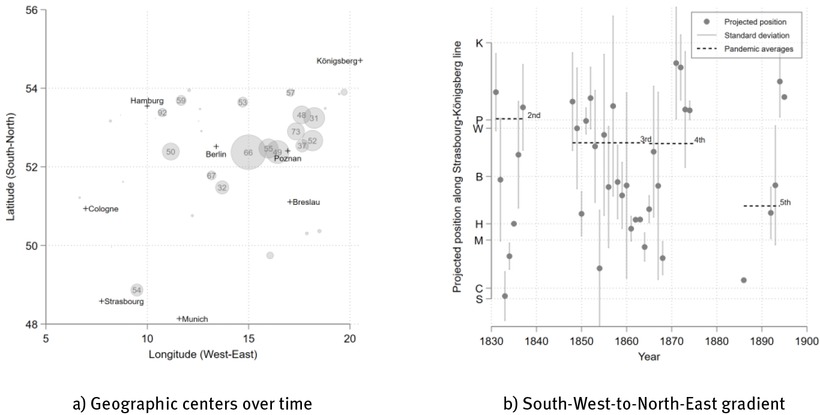
The Geographic Epicenter of Cholera. Note: Panel a shows the geographic centers of annual outbreaks, computed as mean latitude and longitude coordinates, weighted by the cholera death rate. Circle sizes indicate the overall severity of each outbreak, with larger circles representing more deadly years. For major outbreaks, the year is also labelled within the circles (e.g. “50” for 1850). Black crosses mark the locations of eight large cities for reference. Panel b projects the annual geographic centers onto a diagonal axis from Straßburg in the South-West to Königsberg in the North-East. The gray spikes depict the average bidirectional squared deviations from this projected center, capturing the spatial dispersion of each year’s outbreak. Horizontal dashed black lines show pandemic-specific average positions, weighted by each epidemic’s overall death rate. Letters on the vertical axis indicate city locations: Königsberg (Kaliningrad today), Posen (Poznań today), Breslau (Wrocław today), Berlin, Hamburg, Munich, Cologne, and Straßburg.
Panel a of Figure 5 shows the geographic center of each outbreak, calculated as the mean latitude-longitude coordinate of all affected locations, weighted by cholera death rates. Most outbreaks were concentrated in Germany’s North-Eastern provinces near Posen, including the most severe ones (e.g. 1831, 1848/1849, and 1866). However, secondary waves following major outbreaks (e.g. 1832, 1850, and 1867) shifted toward Central Germany, while smaller outbreaks in 1853, 1859, and 1892 focused on Northern Germany. The 1854 outbreak, centered in the South-West (Bavaria and Alsace-Lorraine), stands out as a notable exception.
Focusing on the most apparent spatial trend, Panel b projects the geographic centers onto a diagonal axis running from South-Western Straßburg to North-Eastern Königsberg (see figure 5 note for details). Although year-to-year variation (gray points) and within-year dispersion (gray spikes) are substantial, the pandemic-specific averages (dashed black lines) reveal a clear South-West drift over time. Each pandemic saw distinct outbreaks in the North-Eastern territories, but cholera’s overall geographic focus moved West over time.
Stylized fact 4: Cholera’s diffusion speed increased across and within locations
Figure 6 examines the temporal dynamics of cholera’s diffusion, showing how its spread accelerated both across regions and within locations over the 19th century. While cholera death rates declined over time, diffusion speed increased, indicating growing efficiency in outbreak propagation. Panel a measures cross-location diffusion speed as the average kilometers travelled per day by cholera in each year (see figure 6 note for details). Dashed black lines, indicating averages per pandemic, suggest acceleration over time. In the 1830s, cholera travelled at an average speed of 18 km/day. In 1892, this had increased to 36 km/day. Circles are proportional to the severity of each outbreak, indicating that deadlier outbreaks also diffused faster.
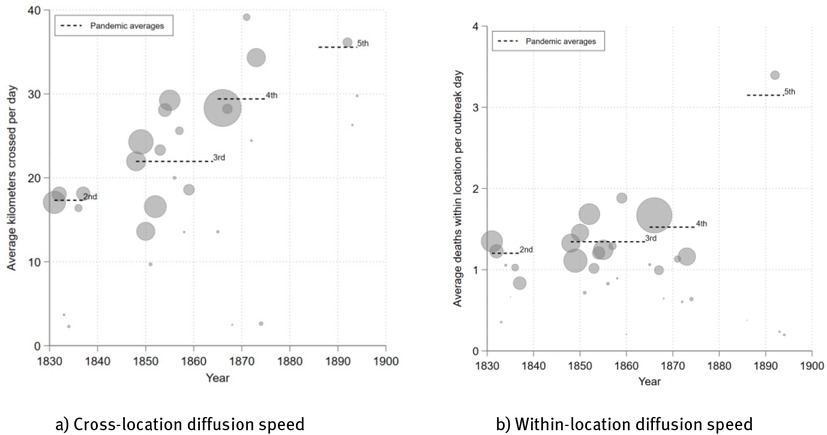
The Acceleration of Cholera Diffusion across and within Locations. Note: Panel a shows cross-location diffusion speed, i.e. average location-pairwise distance (in kilometers) divided by the time (in days) between the start of their outbreaks. Panel b depicts within-location diffusion speed, measured as the average number of deaths per day during an outbreak spell. Circle sizes in both panels are proportional to the overall death rate; dashed black lines indicate pandemic-specific averages, weighted by each outbreak’s overall death rate. Uncertain dates have been approximated, with early, mid, late, and unknown days within a known month coded as days 5, 15, and 25, and 15. Results remain similar when these observations are dropped instead. Observations with unknown outbreak months have been dropped.
Panel b of Figure 6 focuses on within-location diffusion speed, measured as the average number of deaths per day within each affected location during an outbreak spell. Similar to cross-location trends, within-location diffusion also accelerated over time, though less dramatically. In earlier outbreaks, daily deaths averaged around 1.2, but by 1892, this number had almost tripled, indicating more intense and faster local outbreaks despite the overall reduction in mortality. Circle sizes again correspond to outbreak severity, reinforcing the observation that larger and deadlier outbreaks were associated with faster diffusion.
Stylized fact 5: Outbreaks grew more uniform across locations but clustered in space
Figure 7 compares to what extent local cholera outbreaks were similar to each other across locations. In Panel a, the coefficient of variation (CV) measures the relative dispersion of cholera death rates across locations within a given year. The decline in the CV over time suggests that locations became more similar in terms of local outbreak intensities. This trend suggests an overall convergence in the severity of cholera’s impact across locations over the 19th century, except for the last epidemic, which was highly dispersed with its disproportionate impact on Hamburg.
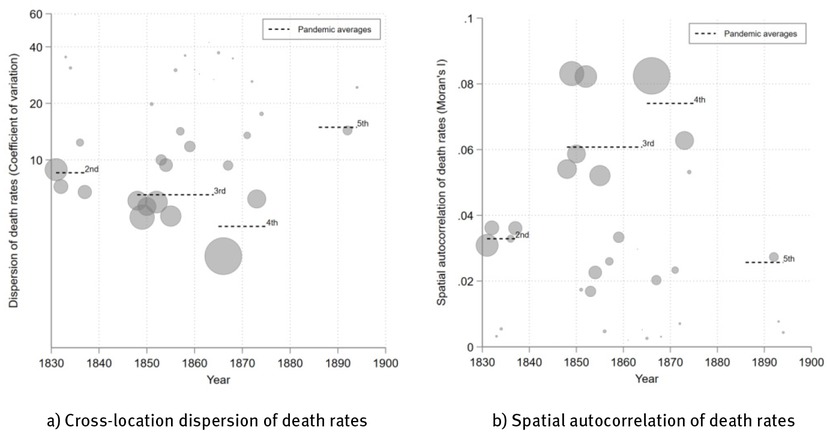
The Cross-location Similarity of Outbreaks. Note: Panel a shows outbreak-specific coefficients of variation (CV) for death rates, i.e. their standard deviation over their mean. A higher CV suggests a more dispersed distribution. Panel a uses a logarithmic scale for clarity. Panel b shows outbreak-specific Moran’s I estimates for death rates, computed using inverse straight-line distance weighting. A higher Moran’s I suggests stronger spatial clustering of similarly affected locations. Circle sizes in both panels are proportional to the overall severity of each outbreak; dashed black lines indicate pandemic-specific averages, weighted by each outbreak’s overall death rate.
Focusing on the spatial dimension of dispersion, Panel b of Figure 7 plots annual Moran’s I values for cholera death rates. These measure the spatial autocorrelation of outbreaks, with higher values indicating stronger spatial clustering of similarly impacted locations. While the variation over time is high, pandemic-wise averages (black dashed lines) suggest that highly impacted locations increasingly clustered in specific regions rather than being more evenly distributed across space. [27] The opposing patterns in Panels a and b suggest a complex trend with respect to the concentration of outbreaks. While locations generally converged in terms of outbreak severity (via the CV), outbreaks also became more spatially clustered over time (via Moran’s I).
4 Cholera, Society and the Economy: New Data, New Research
The previous section discussed the spatio-temporal patterns of Germany’s cholera epidemics in abstract terms. To better understand these patterns, they must be contextualized within the broader social, economic, and political transformations of the 19th century. Such change expressed itself in numerous dimensions: Germany, like other Western countries, underwent industrialization and urbanization, demographic change, growing market integration, expanding international trade, mass migration, and increasing cultural homogenization. [28] These trends influenced and were influenced by epidemic dynamics. For instance, cholera’s disproportionate impact on mid-sized cities suggests that early urban growth came with severe health costs but ultimately created conditions that enabled effective sanitation as cities expanded. Moreover, the accelerating diffusion of cholera, along with its gradual westward shift, indicates that transport networks, trade integration, and internal migration changed epidemic patterns in complex ways.
Exploring these and other claims within a rigorous quantitative framework remains an open challenge for future research. In what follows, I highlight five major narratives and ongoing interdisciplinary research programs that explore cholera’s relationship with broader societal transformations. What unites these perspectives is not a lack of compelling hypotheses, theoretical foundations, or anecdotal evidence, but rather the absence of systematic engagement by quantitative social scientists – largely due to the scarcity of structured historical data of the kind presented in this paper.
The origins of public health and sanitary innovation
Pandemic shocks are often associated with significant innovations, investments, and institutional reforms. However, the conditions under which such changes occur and the mechanisms driving them remain contested. Quantitative-causal frameworks are well-suited to investigate and generalize these dynamics. For example, recent studies suggest that the 1918/1919 Influenza pandemic spurred formal healthcare expansion, reinforced religious and scientific convictions, and undermined social trust. [29] Cholera historiography contains similarly intriguing claims that, however, have not yet been explored by quantitative social scientists.
Historians highlight 19th-century cholera epidemics as pivotal to the rise of public health and major sanitary investments. [30] Yet, key aspects of this narrative remain unclear. First, cholera’s perceived importance often exceeded its actual mortality impact relative to endemic diseases like typhoid. [31] Second, while rich anecdotal evidence links cholera to public health advocacy and reform, these processes spanned decades, often extending beyond cholera’s major mortality episodes. [32] Finally, the failure to replicate similar sanitary revolutions outside the Western world suggests that factors such as ideology, political institutions, economic incentives, and medical knowledge mediate the cholera-sanitation nexus. [33]
In contrast to the now decade-spanning literature on Influenza and the Black Death, researchers have only very recently begun to explore cholera’s role in public health in settings that abstract from single case studies. For example, recent studies identify capital-skill production complementarities as a main driver of elites’ willingness to finance sanitary infrastructure in face of cholera epidemics, and, show that 19th century British expert’s opinions on the contagiousness of cholera were shaped by their economic stakes in oversea trade relations. [34]
Epidemic shocks, political crisis, and social change
Epidemic shocks can ignite far-reaching political and social dynamics, though their directions and magnitude are difficult to predict as demonstrated by the COVID-19 pandemic. [35] Cholera, due to its salience, wide geographic spread, and focus on modern mass societies, provides a promising historical lens to examine how epidemics shape society and politics. Recent studies emphasize cholera’s role as one of the most conflict-prone epidemics in history, unleashing social clashes, scapegoating, and the infamous cholera riots across Europe and the world. [36] This perspective builds on an earlier tradition that has linked 19th-century European cholera epidemics to revolutionary and disruptive events, identifying them as both catalysts for and amplifiers of political change. [37]
Cholera also played a role in major international turning points, such as the 1830/1831 Polish November Uprising, the 1848 Revolutions and civil wars, and the Crimean War (1853 to 1856). [38] On a brighter note, Europe’s shared exposure to cholera spurred early international sanitary cooperation, laying the groundwork for the eventual creation of the World Health Organization. [39]
Despite this rich historical backdrop, scholars have barely begun to explore cholera’s sociopolitical impacts within explicitly quantitative-causal frameworks. A comparison to the well-studied 1918/1919 Influenza pandemic demonstrates the dormant potential. For example, recent studies show that exposure to this pandemic caused voters in Weimar Germany to reward parties seen as competent in public health while punishing governments that demonstratively neglected health infrastructure. [40]
Globalization, growth, and epidemic burden
The relationship between trade, globalization, and the spread of epidemic diseases has long intrigued economists and gained renewed attention during the COVID-19 pandemic. [41] Cholera, in particular, is often described as the disease of the First Globalization, with its pandemics closely tied to the expansion of global trade networks during the 19th century. [42] Within countries, growing transport connectivity and labor mobility also facilitated the spread of diseases. [43]
Cholera’s broad geographic reach was undeniably a byproduct of globalization – and, by extension, economic progress. Yet, it has also been portrayed as the symbol of pre-sanitary poverty, disproportionately affecting dense and impoverished urban areas. [44] A useful framework to further explore this duality is provided by Werner Troesken, who distinguishes between “diseases of poverty”, such as typhoid, and “diseases of commerce”, such as smallpox. [45] Institutional features conducive to economic growth – such as trade openness and labor mobility – can simultaneously mitigate poverty-related diseases while exacerbating commerce-related ones. [46] Cholera occupies a dynamic position within this dichotomy: while trade and connectivity facilitated its spread, it also spurred sanitary investments in highly integrated economies like Germany, where cities grew rich from trade and labor inflow.
The relationship between epidemic shocks, economic activity, and trade restrictions has been studied extensively in the context of the 1918/1919 Influenza pandemic. For instance, recent studies argue that exposure to the Influenza pandemic led to increases in tariffs, while migration barriers failed to limit mortality during four historical Influenza pandemics, including 1918/1919. [47] Other contributions show that interaction-reducing non-pharmaceutical interventions (NPIs) in the US did not suppress economic activity beyond the direct costs of Influenza itself; moreover, local Influenza outbreaks were severely amplified by industrial atmospheric pollution. [48] Despite cholera’s similarly complex entanglement with trade and economic growth, similar empirical studies do not yet exist.
The macroeconomic effects of epidemic shocks
How do epidemic shocks impact macroeconomic variables such as real wages and output? The COVID-19 pandemic has revived interest in whether evidence from historical epidemics can inform predictions about the macroeconomic consequences of future outbreaks. [49] Much of this literature focuses on the 1918/1919 Influenza pandemic and the Black Death, with cholera receiving relatively little attention. [50]
Overlooking cholera in this context represents a missed opportunity. Unlike pre-modern plague epidemics, 19th-century cholera outbreaks occurred during a period of economic transition, affecting both Malthusian economies and those shifting toward modern economic institutions characterized by economies of scale, human capital accumulation, and sustained growth. [51] Moreover, in contrast to the 1918/1919 Influenza pandemic, which saw widespread use of non-pharmaceutical interventions (NPIs), cholera epidemics largely played out in a laissez-faire policy environment, with few interventions apart from the initial quarantines and border control instances noted earlier. [52] Cholera epidemics also differed in their temporal dynamics, unfolding over multiple waves of varying magnitude across the 19th century, rather than constituting a one-time shock.
Potential avenues of research extend beyond real wages and output. For instance, evidence suggests that Prussian cities quickly recovered their pre-epidemic population levels after major cholera shocks. [53] Recent work has also shown that cholera epidemics increased inequality in 19th-century France, induced long-term health costs from early-life exposure in Japan, and stimulated technological innovation in the French agricultural sector due to labor scarcity. [54] These findings, which plausibly echo expected macroeconomic effects of epidemic shocks in modern contexts (e.g. COVID-19), highlight the broader potential of studying cholera to understand how economies respond to epidemics.
Cholera, climate change and resource management
Cholera remains a significant global threat. Studies suggest that it may become more severe in the future as climate change expands cholera’s oceanic habitats, clean water resources grow scarcer, and urbanization accelerates. [55] However, many of the hydrological, climatic, and socioeconomic factors that influence cholera evolve slowly over time. Moreover, epidemiological risk assessment models require extensive data. For these reasons, historical quantitative evidence plays an increasingly important role in outbreak modeling and speculation about cholera’s future epidemic significance.
Of course, the limitations of historical comparisons must be acknowledged. Societal and economic structures have changed significantly, with important implications for cholera epidemiology. [56] The modern El Tor biotype differs from earlier strains in both longevity and fatality, and treatment methods have improved and become more accessible. [57] However, these limitations must be weighed against the opportunities historical research provides. Historical data offers rich variation across time and space, including fluctuations in climate and geography that contemporary data cannot deliver. A recent example for the creative use of long historical data series is a study of the relationship between changing climate conditions and cholera in Kolkata over 120 years. [58] Other examples are the use of historical records from London, Baltic port cities, and Denmark to estimate key parameters and transmission mechanisms within epidemiological models. [59]
5 Conclusion
This paper delivers a comprehensive quantitative account of 19th-century cholera mortality in Germany, documenting nearly half a million deaths across 2,685 cities and 852 rural counties. Cholera emerges as an important contributor to the mortality transition in Germany, with mortality levels comparable to those in other Western European countries and of similar quantitative importance to more extensively studied pandemics, such as the 1918/1919 Influenza pandemic. The paper distills cholera’s complex spatio-temporal dynamics into five stylized facts: cholera was predominantly urban, with city death rates averaging 3.5 times higher than rural ones; mid-sized cities were hit the hardest; the disease’s geographic center shifted from the North-East to the South-West over time; outbreaks spread more rapidly across regions and within locations in later pandemics; and cholera mortality became increasingly spatially clustered, despite a decline in overall death rates.
The complex patterns identified in this study are not conclusions in themselves but a starting point for a more systematic engagement with the rich qualitative cholera historiography. Over decades, social and medical historians, demographers, and geographers have linked cholera to major modernization processes, including public health reform, political change, globalization, and economic development. This literature is rich in ideas, but rests primarily on case studies and anecdotal evidence as comprehensive data on historic cholera epidemics is scarce. As demonstrated with other pandemics – such as the Black Death and Influenza – quantitative social scientists, including economic historians, can substantially advance this literature by applying causal frameworks and quantitative methods to datasets like the one presented here.
To motivate such research, I outline five major cholera narratives that imply causal claims deserving empirical, data-driven engagement. First, cholera is framed as crucial catalyst for sanitary investments, medical research and the development of epidemiological methods. The political motivations, economic incentives, and cognitive frameworks driving the relevant decision makers remain vague and controversial, however. Second, cholera is associated with political crises, wars, and social unrest, such as the 1848 revolutions and cholera riots throughout the 19th century. To what extent these events were driven by, rather than themselves driving cholera outbreaks, warrants further analysis. Third, cholera exemplifies the epidemic risks of globalization, having spread along trade and migration routes and prompting limited but important experiments in quarantine, standardized reporting, and international health coordination during the First Globalization. Fourth, the disease’s economic impacts, including potential effects on wages, inequality, and technological change, remain largely unexplored despite cholera’s occurrence at a key transitional period from Malthusian stagnation to modern economic growth. Lastly, cholera is highly sensitive to changing climatic and environmental conditions. Analysis of historical epidemic patterns, including their integration in modern epidemiological frameworks, should advance our understanding of cholera’s future.
As highlighted by these examples, the relevance of a data-driven research agenda extends beyond historical analysis. Globalization, urbanization, and climate change continue to shape epidemic risks, and cholera remains a persistent threat in many developing regions. Insights gained from historical cholera epidemics can inform contemporary policy debates on public health resilience, crisis management, and the trade-offs between market integration and epidemic risk. Future exploration of Germany’s comprehensive 19th-century cholera history – based on the dataset presented in this paper – will deepen our understanding of how societies generate and respond to health shocks. This research agenda can build on cholera’s extensive qualitative historiography, more developed literatures such as those on the Black Death and Influenza, and profit from growing interest from the modern public health and epidemiology community.
6 Appendix A: Dataset Validation
In this appendix, I validate the German cholera dataset against three independent sources of information. First, I demonstrate that regional annual excess mortality between 1816 and 1914 is highly predictive of cholera epidemics identified in the dataset. Second, I show that cholera events and associated death rates are well-predicted by an established risk model, based on the interaction of climate and water supply facilities. Third, I compare mentions of cholera events between the dataset and the German city encyclopedia (Städtebuch), documenting a high degree of agreement between both sources.
6.1 Regional Excess Mortality Strongly Correlates with Cholera Epidemics
Excess all-cause mortality can be a useful proxy for cause-specific epidemic death counts. To assess excess mortality, I collect population and all-cause deaths data for each state in the dataset (see appendix B for details). Given their size, each Prussian district is treated as a separate “state”, resulting in 63 regional entities. All-cause mortality, derived from vital statistics, are available annually from 1816 to 1914, though some states have gaps in early years. [60]
I regress annual deaths Dr,t on state-specific base levels and time trends, adjusting for the population at risk Pr,t within a conditional exponential means model. Due to the observed mortality transition – a sudden, consistent downward trend in overall mortality – I allow the time trends to vary around a state-specific break year Br, estimated through Supremum Wald tests. The regression model is as follows:
Using the fitted regression model, I obtain predicted deaths
In Figure 8, I compare these predictions to observed deaths, expressed in per-capita terms to accommodate different state sizes. The tight, symmetric dispersion around the 45° line indicates that the observed mortality dynamics between 1816 and 1914 are well captured trough state-specific time trends, allowing for differential onset of the mortality transition. However, observations further away from the identity line indicate unexpected excess or deficit mortality (below or above the 45° line, respectively). Among these, I highlight state-years with cholera accounting for more than 10 percent (triangles) or 20 percent (crosses) of the observed deaths, according to my dataset. Almost all of these cholera years show high excess mortality, among them the most extreme years. [61]
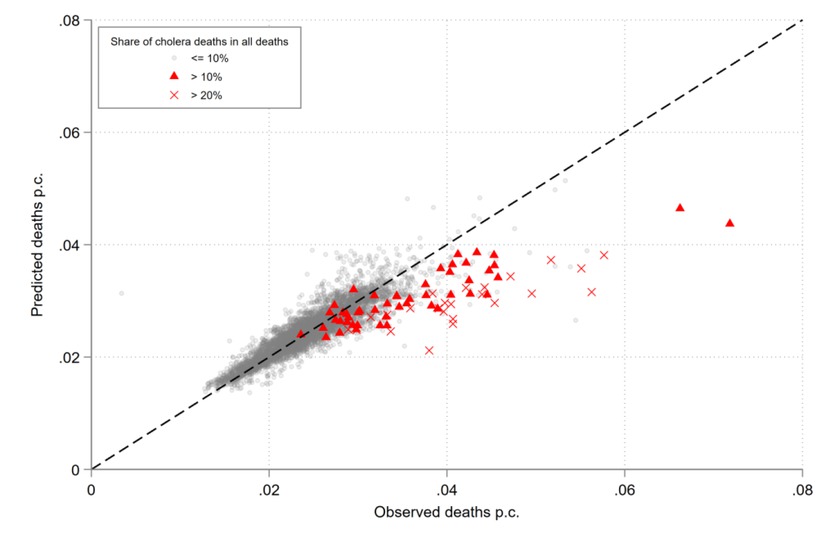
Excess Mortality and Cholera Years. Note: This graph plots observed per-capita deaths for 5,753 state-year observations against predicted deaths (also in per-capita terms) according to a time trend regression model (see text). Observations highlighted in red are cholera years, in which cholera accounts for more than 10 percent (triangles) or 20 percent (crosses) of all deaths. Out of the 49 (24) state-years in which cholera accounted for 10 to 20 percent (more than 20 percent) of all deaths, 45 (24) state-years also experienced excess mortality, i.e. more observed deaths than predicted deaths. Sources: Own calculations based on the dataset presented in this paper.
6.2 Climate and Infrastructure Risk Factors Predict Cholera Outbreaks
I test whether the observed mortality patterns align with established environmental and infrastructural risk factors. Studies demonstrate that cholera incidence correlates with climatic, hydrological and infrastructural conditions. Most evidence comes from coastal and tropical areas near cholera’s endemic regions, such as India and East Asia, but comparative studies from Africa, the Arabian Peninsula, and the Caribbean have also linked cholera risk to environmental factors. [62] Among the most established risk factors are high temperatures, heavy rainfall, and contaminated water supplies. [63]
The specific role of these three factors can vary substantially across locations, time and context. [64] However, at the most basic level, a large body of evidence links cholera risk to warm temperatures, heavy rainfall and poor sanitary conditions. [65] Antarpreet Jutla et al. present a simple integration of these risk factors in epidemic (i.e. non-endemic) settings. [66] Their framework posits that if all three conditions are met – high spring temperatures (inducing bacterial growth, low river levels and salination), followed by heavy summer rains (causing cross-contamination of water reservoirs), in regions with vulnerable water supplies – the likelihood of a cholera outbreak increases. If any condition is absent, cholera risk diminishes. This model’s simplicity, focusing on a limited set of factors, allows for the inclusion of interactions and temporal structure while remaining tractable. Moreover, each factor has been tested across diverse settings. [67]
I use the model offered by Antarpreet Jutla et al. to indirectly test the plausibility of the German cholera dataset: If the model captures basic epidemic probabilities, and the data is accurate, cholera epidemics should be most severe in locations and at times subject to the presence of all three risk factors. To test this implication across locations i (in regions r) and years t, I define dummy variables for the absence of risk factors: Temperature risk is absent (Ti,t = 1) when spring temperatures are below their 15-years rolling average. Rainfall risk is absent (Ri,t = 1) when summer precipitation is below its 15-years rolling average. Finally, water quality risk is absent (Wi,t = 1) once a city builds a safe piped water supply. [68]
The estimation equation reads
where j = 1, … ,7 represents the seven possible combinations of risk-lowering factors – low spring temperature (T), low summer rainfall (R), and safe water infrastructure (W) – with the absence of all three as the omitted base category. Here, C is either an outbreak dummy indicator or the cholera death rate. Location fixed effects (αi ) and region-year effects (λr (i)×t) control for unobserved, time-invariant risk factors and regional shocks.
The regression results in Table 2 indicate that locations meeting none of the three risk-lowering factors had an outbreak probability of 6 to 9 percent (cols. 1-3) and death rates of 2 to 5 percent (cols. 4-6), with cities showing a higher cholera incidence (cols. 2 and 5), especially those whose center is within one kilometer of a river (cols. 3 and 6). Below the baseline rates, the table shows marginal deviations (percentage point changes) from these baseline outcomes when one or more of the three risk factors is not met. The model’s prediction is that any absence of risk factors lowers cholera risk. The findings support this prediction as most coefficients are negative and many are significant. [69] This, in turn, indirectly validates the quality of the dataset employed for the estimation.
Regression results from a cholera risk factor model.
| Dep. var.: Outbreak (0/1) |
Dep. var.: Death rate (%) |
|||||
|---|---|---|---|---|---|---|
| (1) All locations | (2) Cities | (3) River cities | (4) All locations | (5) Cities | (6) River cities | |
| Baseline rate | ||||||
| All risk factors | 0.06*** | 0.05*** | 0.09*** | 0.02*** | 0.04*** | 0.05*** |
| present | (0.00) | (0.00) | (0.00) | (0.00) | (0.00) | (0.00) |
| Marginal deviation | ||||||
| T (✓) R(✗) W(✗) | -0.01 | 0.00 | -0.01 | 0.00 | -0.00 | -0.01 |
| (0.29) | (0.68) | (0.44) | (0.60) | (0.71) | (0.78) | |
| T (✗) R(✓) W(✗) | -0.01* | 0.01 | -0.01 | -0.00 | -0.01 | -0.04* |
| (0.08) | (0.19) | (0.37) | (0.12) | (0.37) | (0.06) | |
| T (✗) R(✗) W(✓) | -0.02*** | -0.04*** | -0.04*** | -0.04*** | -0.02*** | -0.02*** |
| (0.00) | (0.00) | (0.00) | (0.00) | (0.00) | (0.00) | |
| T (✓) R(✓) W(✗) | -0.00 | 0.02* | -0.01 | 0.01 | -0.01 | -0.02 |
| (0.95) | (0.06) | (0.62) | (0.40) | (0.48) | (0.45) | |
| T (✓) R(✗) W(✓) | -0.04*** | -0.04*** | -0.06*** | -0.03*** | -0.02* | -0.01 |
| (0.00) | (0.00) | (0.00) | (0.00) | (0.10) | (0.57) | |
| T (✗) R(✓) W(✓) | -0.02** | -0.02*** | -0.03* | -0.04*** | -0.02*** | -0.06*** |
| (0.02) | (0.01) | (0.08) | (0.00) | (0.00) | (0.01) | |
| T (✓) R(✓) W(✓) | -0.01 | 0.01 | -0.04* | -0.02* | -0.02 | -0.03 |
| (0.53) | (0.58) | (0.06) | (0.03) | (0.12) | (0.19) | |
| R-squared | 0.63 | 0.63 | 0.83 | 0.34 | 0.40 | 0.78 |
| Observations | 229706 | 174261 | 19955 | 229706 | 174261 | 19955 |
| Locations | 3536 | 2683 | 307 | 3536 | 2683 | 307 |
Note: Table 2 shows estimation results from a regression model that predicts cholera outbreaks or death rates based on dummy variables that indicate the absence of three risk factors: low spring temperature (T), low summer precipitation (R), and safe water supplies (W). The baseline rate is the conditional outbreak probability (cols. 1-3) or death rate (cols. 4-6) in locations that have none of these three risk-lowering factors present. The coefficients listed as marginal deviations indicate the change to the baseline probabilities or rates under different combinations of risk-lowering factors, with ✓ indicating their presence. The River cities sample (cols. 3 and 6) includes all cities whose center is within one kilometer of a river. Estimates are conditional on location and region-year fixed effects. Locations are weighted by population to account for their varying size. Standard errors are clustered at the location level and presented in parentheses. See text for further details. Sources: Own calculations based on the dataset presented in this paper; temperature data from Luterbacher et al., Temperature Variability; precipitation data from Pauling et al., Precipitation reconstructions; water quality data from Gallardo Albarrán/Kappner, Progress.
6.3 Cholera Events in the Dataset are well Represented in the German City Encyclopedia
While the dataset presented in this paper is the first to use systematic sources on cholera events in German cities, the multi-volume German city encyclopedia (Städtebuch) contains sections on historically significant epidemic events for a large sample of cities throughout history. [70] I rely on a recent transcription of these books and compare whether epidemic events mentioned in this source are also found in my dataset. [71] This is a meaningful validation, because the mention of a significant cholera epidemic in the city encyclopedia indicates that the respective authors referenced this event across multiple sources and deemed the information reliable. In Figure 9, I present several comparisons between both datasets.
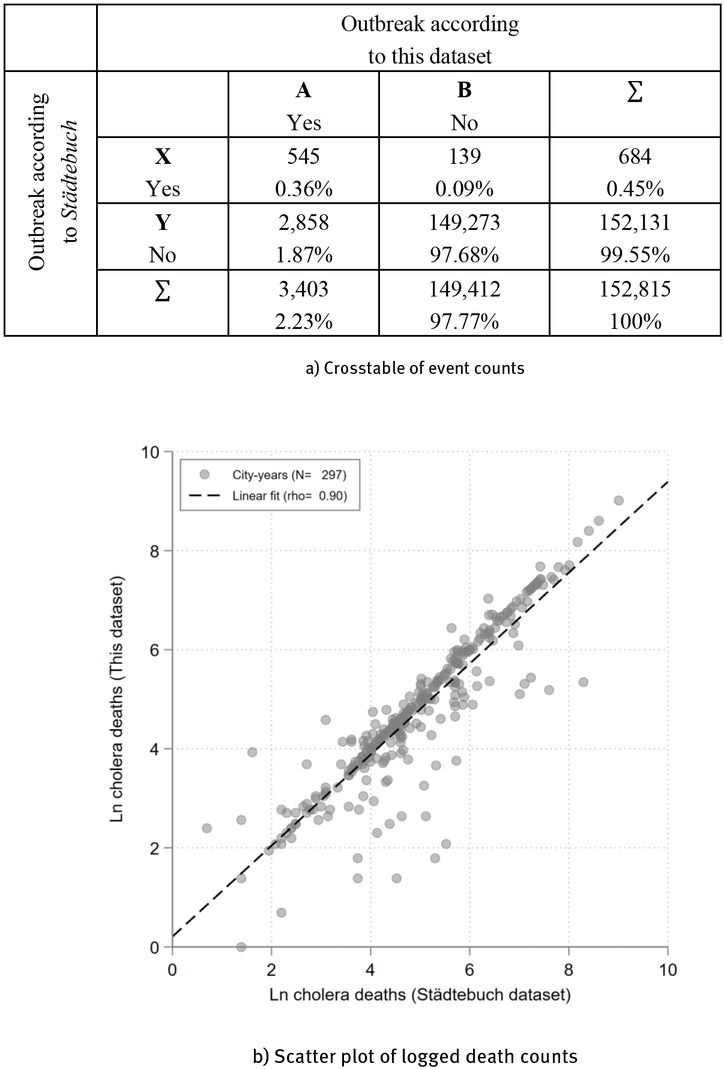
Cholera Event Mentions and Death Counts in the Städtebuch and Dataset. Note: This figure presents a comparison between cholera epidemics data mentioned in the German city encyclopedia and my dataset. Panel a is a crosstable, counting city-year instances according to whether cholera outbreaks are mentioned in my dataset (column A) or not (column B), and whether they are mentioned in the city encyclopedia (row X) or not (row Y). For example, 545 outbreaks are mentioned in both sources, representing 0.36 percent of all city-year instances. Panel b plots death counts reported in both datasets, based on 297 cholera epidemics for which such data is provided in the encyclopedia. Epidemics that are located on the dashed black 45° line have the same magnitude reported in both datasets. Sources: City encyclopedia data from Keyser et al. (Eds.), Städtebuch; Bogucka/Cantoni/Weigand, Princes and Townspeople.
In Panel a of Figure 9, I compare mentions of cholera events in 2,351 cities across both datasets. I register all “Cholera” and “Brechruhr” events in the city encyclopedia for the time span 1831 to 1895 (65 years), yielding 152,815 city-years. [72]
The cross-tabulation shows that, out of the 684 outbreaks mentioned in the city encyclopedia, 545 are also featured in my dataset, suggesting that these sources generally align. Moreover, a large share of the 139 events not listed in my dataset is explained by one-year deviations, e.g. when the same outbreak is coded under the years 1831 or 1832 in the two datasets, respectively. Beyond this positive check, the cross-tabulation also implies that 2,858 outbreaks filed in my dataset are not mentioned in the encyclopedia. This was to be expected, given that reporting in the Städtebuch depended on the subjective assessment of the respective authors, who often focused on significant epidemic events and did not necessarily aim at comprehensiveness. Given these limitations, the high odds ratio of agreement between both sources,
is a strong validation for my dataset.
In Panel b, I compare cholera death counts across both datasets for 297 city-years for which the city encyclopedia reports these. The high correlation (with an R-squared of 0.9) indicates agreement, although the city encyclopedia reports slightly higher death counts on average.
7 Appendix B: Territory-by-territory Sources List
The online Appendix B provides a detailed list of all data sources, territory by territory. It also highlights important assumptions, limitations and data anomalies. Furthermore, it prompts annual cholera death counts separately per territory, and visually contextualizes these cholera outbreaks within each territory’s general mortality trend.
Please find the online Appendix B here:
https://drive.google.com/file/d/1KniMZiHQLpTVtEhtDYXZkINjPiS9yREL/view
About the author
Kalle Kappner wurde 2021 an der Humboldt-Universität zu Berlin promoviert und forscht seitdem an der Ludwig-Maximilians-Universität München. Er hat zahlreiche Beiträge zu stadt-, umwelt- und seuchengeschichtlichen Themen veröffentlicht, unter anderem im Journal of Urban History und in Explorations in Economic History.
Acknowledgement
I thank Daniel Gallardo Albarrán and Anja Maria Hamann for useful discussions; Juliette Le Baron for helpful comments; Tobias Jopp for prompting me to write this paper; an anonymous referee for helpful comments; the archival staff in Altenburg, Berlin, Bückeburg, Colmar, Dessau, Detmold, Hamburg, Hanover, Lübeck, Marburg, Schleswig, Schwerin, Szczecin, Wiesbaden, and Wolfenbüttel for helping me work through their sources; and Christian Lopau for sharing his insights with me. This work has benefited financially from the support of the LMU Munich Junior Research Fund and Deutsche Forschungsgemeinschaft (CRC TRR 190, project number 280092119).
© 2025 Kalle Kappner, published by De Gruyter
This work is licensed under the Creative Commons Attribution-NonCommercial-NoDerivatives 4.0 International License.
Articles in the same Issue
- Frontmatter
- Obituary for Eckart Schremmer
- Special Issue Articles
- Epidemics and Pandemics in Economic-historical Perspective – An Introduction
- Cholera in the City of Poznań: Did the Death Toll of the 1866 Cholera Epidemic Reflect Social and Economic Differences?
- The Mortality Impact of Cholera in Germany
- When Diseases Return from the Epidemiological Honeymoon: The Reemergence of Smallpox in 19th Century Germany and its Lessons for Public Health Policies after COVID-19
- On the Economic Costs of the Spanish Flu Pandemic in Germany: An attempt at Assessing GNP Lost for 1918
- Malaria in Catania/Sicily: Local Manifestations and International Scientific Cooperation During a Pandemic in the 1920s
- Geographical Aspects of Diphtheria in England and Wales: Immunisation and the Spatial Sequence of Retreat to Effective Elimination, 1921 to 1964
- Pandonomics: Why Economics was Unprepared for COVID-19-Policies
- Research Forum
- “Stupid” German Money? Bonus Interest Rate Payments on Savings Deposits During the Stagflation of 1967 to 1984
- Geography and Space in Recent Economic History